

Abstract
Purpose
To determine flash and background colors that best isolate the photopic negative response (PhNR) and maximize its amplitude in the primate ERG.
Methods
Photopic full-field flash ERGs were recorded from anesthetized macaque monkeys before and after pharmacologic blockade of Na+-dependent spiking activity with tetrodotoxin (TTX, 1 to 2 μM, n = 3), blockade of ionotropic glutamatergic transmission with cis-2,3 piperidine dicarboxylic acid (PDA, 3.3–3.8 mM, n = 3) or laser-induced monocular experimental glaucoma (n = 6), and from six normal human subjects. Photopically matched colored flashes of increasing stimulus strengths were presented on scotopically matched blue, white, or yellow backgrounds of 100 scot cd/m2 using an LED-based stimulator.
Results
PhNRs that could be eliminated by TTX or severe experimental glaucoma were present in responses to brief (<5 ms) and long-duration (200 ms) stimuli of all color combinations. In normal monkey and human eyes for brief low-energy flashes, PhNR amplitudes were highest for red flashes on blue backgrounds and blue flashes on yellow backgrounds. For high-energy flashes, amplitudes were more similar for all color combinations. For long-duration stimuli, the PhNRon at light onset in monkeys was larger for red and blue stimuli, regardless of background color, than for spectrally broader flashes, except for stimuli >17.7 cd/m2 when PhNRons were all of similar amplitude. For red flashes, eliminating the PhNRon pharmacologically or by glaucoma removed the slowly recovering negative wave that normally followed the transient b-wave and elevated the whole ON response close to the level of the b-wave peak. However, for white, blue, and green flashes, a lower-amplitude plateau that could be removed by PDA remained.
Conclusions
For weak to moderate flash strengths, the best stimulus for maximizing PhNR amplitude is one that primarily stimulates one cone type, on a background with minimal adaptive effect on cones. For stronger stimuli, differences in amplitude are smaller. For long-duration stimuli, red best isolates the PhNRon because it minimizes the overlapping lower-level plateau that originates from the activity of second-order hyperpolarizing retinal neurons.
The photopic negative response (PhNR) of the photopic full-field flash electroretinogram (ERG) appears as a negative-going wave after the b-wave and again after the d-wave for long-duration stimuli. The PhNR was first identified in monkeys with the use of red flashes on a rod-saturating blue background by Viswanathan et al.,1 who showed that these late negative waves were absent in animals with experimental glaucoma that had lost their retinal ganglion cells2,3 and that they could also be removed by intravitreal administration of tetrodotoxin (TTX), an agent that prevents the generation of sodium-dependent spikes in retinal neurons.4,5 These observations suggested that the PhNR was probably primarily a reflection of the spiking activity of ganglion cells though it might also contain contributions from other spiking cells in the inner retina (some amacrine cells).
After the initial description of the PhNR in the macaque ERG there have been several reports of reduction in the PhNR amplitude in the brief-flash ERG of patients with optic neuropathy due to glaucoma6–8 and other etiologies9–11 as well as in patients with other inner retinal diseases.12–14 Although some of these studies have been based on ERG recordings made with brief red flashes on a blue background, as originally described by Viswanathan et al.,1 others have used white flashes on a white background or different stimuli. Although the results of all these studies indicate that the amplitude of the PhNR can be used to monitor changes in inner retinal function, it is not clear whether the use of colored stimuli rather than the more readily available white stimuli is really advantageous. In this context, we have now examined the effect on the PhNR amplitude of eliciting the response with some of the spectrally different stimuli that can be provided by a stimulator using red, green, and blue light-emitting diodes (LEDs). In particular, we have been interested in comparing color combinations (red on blue, blue on yellow) that provide some degree of isolation of individual color mechanisms, with white on white stimulation. This was intended to provide a test of our suggestion7 that the PhNR is especially well stimulated by red flashes on a blue background because the antagonism between mechanisms fed by different cone types is relatively weak in this situation.
In this study, we also examined the effect of different color combinations on the inner retinal contribution to the responses to long-duration flashes. Previous studies of the PhNR in monkeys in response to long-duration red flashes found that severe experimental glaucoma or intravitreal injection of TTX elevated the slowly recovering negative plateau that normally follows the transient b-wave, up to the b-wave peak.1 However, Sieving et al.15 used long-duration white flashes on white backgrounds in a study and reported that the suppression of inner retinal activity with N-methyl-D-aspartate (NMDA) had little effect on the negative wave. Only blockade of ionotropic glutamate receptors that eliminated activity of hyperpolarizing second-order neurons (Off-bipolar and horizontal cells) as well as inner retinal activity removed the negative plateau after the b-wave.15 These findings suggest that the long red flash is more effective in isolating the PhNR from the inner retina than the long white flash, and this was more thoroughly evaluated in the present study.
Although we made some observations on the PhNR of normal human subjects, we have mainly studied the response in macaques because we were able to confirm our identification of the PhNR as an inner retinal response by examining animals with inner retinal dysfunction induced by experimental glaucoma or by pharmacologic manipulations.
This study showed that for stimuli of weak to moderate strength, colored flashes that preferentially stimulate a specific cone type are the most effective in producing large PhNR amplitudes, and broadband (white) flashes on a broadband background produce the smallest amplitudes. However, with increasing stimulus strength, the difference in the effectiveness of more monochromatic versus broadband stimuli is reduced. In addition, this study showed that the inner retinal contribution to long-duration flashes could be more easily identified by using red rather than other colored flashes. A report of this study has appeared previously in abstract form (Rangaswamy et al. IOVS 2005;46:E-Abstract 4762).
Methods
Subjects
Photopic full-field flash ERGs were differentially recorded between the two eyes of macaque monkeys (Macaca mulatta; six controls, three in pharmacologic blockade experiments and six with experimental glaucoma). Recordings also were obtained from six normal adult human subjects (25–32 years of age). All animals, whose ages ranged from 3.5 to 10 years, were also subjects in other studies. All experimental and animal care procedures adhered to the ARVO Statement for the Use of Animals in Ophthalmic and Vision Research and were approved by the Institutional Animal Care Committee of the University of Houston. All procedures in humans were approved by the University of Houston Committee for Protection of Human Subjects and adhered to the Declaration of Helsinki. Informed consent was obtained from all subjects after the procedures were completely explained.
Animal Preparation
Animals were anesthetized intramuscularly with ketamine (20–25 mg/kg · h) and xylazine (0.8–0.9 mg/kg · h) and were treated with atropine sulfate (0.04 mg/kg, injected SC). The depth of the anesthesia was maintained at a level sufficient to prevent the animals from blinking or moving. Pupils were dilated fully to 8.5 mm in diameter with topical tropicamide (1%) and phenylephrine hydrochloride (2.5%). The non-stimulated eye was covered. Heart rate and blood oxygen were monitored with a pulse oximeter (model 44,021; Heska Corp., Fort Collins, CO) and body temperature maintained between 36.5 and 38°C with a thermostatically controlled blanket (TC1000-Temperature Controller; CWE, Ardmore, PA).
ERGs were recorded differentially between Dawson-Trick-Litzkow (DTL) electrodes16 that were positioned across the center of the cornea and under a corneal contact lens on each eye. A needle inserted under the scalp served as the ground electrode. Recordings were amplified and filtered (DC-300 Hz; Espion; Diagnosys LLC, Lowell, MA).
Intravitreal Injections
Intravitreal injections of 40 to 50 μL were made nasally and temporally into the vitreous cavity of a monkey’s eye with a sterile 30-gauge needle inserted through the pars plana behind the limbus. Vitreous concentrations of the pharmacologic agents were estimated by assuming the vitreous volume to be 2.1 mL. The following drugs and concentrations, all in sterile balanced saline solution, were used: TTX (1.2–2.1 μM; n = 3), to block sodium-dependent spiking activity generated by retinal ganglion cells, amacrine cells, and interplexiform cells, and cis-2,3 piperidine dicarboxylic acid (PDA: 3.3–3.8 mM; n = 3) to block ionotropic glutamatergic transmission to cells that contain AMPA/KA (α-amino-3-hydroxy-5-methyl-4-isoxazolepropionic acid/kainate) receptors (i.e., off-bipolar, horizontal, amacrine, and ganglion cells).17–19 The concentrations that we chose were sufficient in other experiments on monkeys to achieve pharmacologic separation of components of the full-field flash ERG.1,10,20,21 Recordings were made before and at least 1 hour after injections when the effects of the drugs had stabilized.
Experimental Glaucoma
The intraocular pressure (IOP) in the right eye of six anesthetized monkeys was elevated by three to four blue-green argon laser treatments of the trabecular meshwork, as described previously.22 Briefly, treatment spots (50-μm spot size, 1.0-W power, and 0.5-second duration) were placed to produce continuous tissue blanching, using a slit lamp delivery system (model PC; HGN, Salt Lake City, UT). IOPs were measured before ERG recording with a hand-held applanation tonometer (model HA-1; Kowa Co., Ltd., Tokyo, Japan). As part of other studies, static perimetry was performed frequently on all animals with experimental glaucoma (Humphrey Visual Field Analyzer, model 630; Carl Zeiss Meditec, Inc., Dublin, CA, running the central 24-2 full-threshold program) with a Goldmann size III target, 0.43° in diameter, modified for measuring animal behavior. The perimetric testing methods for monkeys have been described previously.23 For this study, only eyes with advanced experimental glaucoma showing a mean deviation (MD) in the visual field of ≥ −10 dB were selected. Based on the model of Harwerth et al.,24 the number of retinal ganglion cells in these eyes was reduced to approximately 30% of the number in control eyes.
ERG Recordings in Humans
ERGs were recorded differentially between DTL fiber electrodes moistened with 1% carboxymethyl cellulose and placed in the lower cul-de-sac of each eye after topical anesthetic (0.5% proparacaine hydrochloride) was applied. Each DTL fiber was anchored with a dab of petroleum jelly near the inner canthus and electrically connected by a lead at the outer canthus. The ground electrode was an adhesive silver/silver chloride EKG electrode that was placed on the forehead. Pupils were fully dilated to approximately 8.5 mm with tropicamide (1%) and phenylephrine hydrochloride (2.5%). Responses were averaged over 60 to 80 stimulus presentations.
Visual Stimulation
Full-field stimulation was produced with a small Ganzfeld stimulator (ColorBurst Espion system; Diagnosys LLC) positioned very close to one eye. Stimuli were brief (<5 ms)- and long (200 ms)-duration flashes on a rod-saturating background. Interstimulus intervals were of adequate duration to avoid adaptive effects. Photopic and scotopic luminances were calibrated using a photometer (model IL1700; International Light, Peabody, MA) with CIE photopic and scotopic correction filters. The flashes were photopically matched and were generated by the following LEDs: red (λmax = 650 nm), blue (λmax = 462 nm), and green (λmax = 510 nm). The white flash was produced by combining all three LEDs. Figure 1A shows the normalized spectra of the three LEDs in the stimulator (ColorBurst, Espion; Diagnosys LLC). Figure 1B shows a plot of normalized human cone fundamentals obtained for a 10° field (from Ref. 25), and indicates by vertical lines, the overlap of the LED peak wavelength (Fig. 1; arrows in A and solid lines in B) with the fundamentals. These fundamentals are believed to be very similar to those in monkeys.26 Based on the LED spectra and the cone fundamentals in Figure 1, the relative stimulation of the three cone types (L, M, and S) by the flash and background colors used in this study is shown in Table 1.
Figure 1.
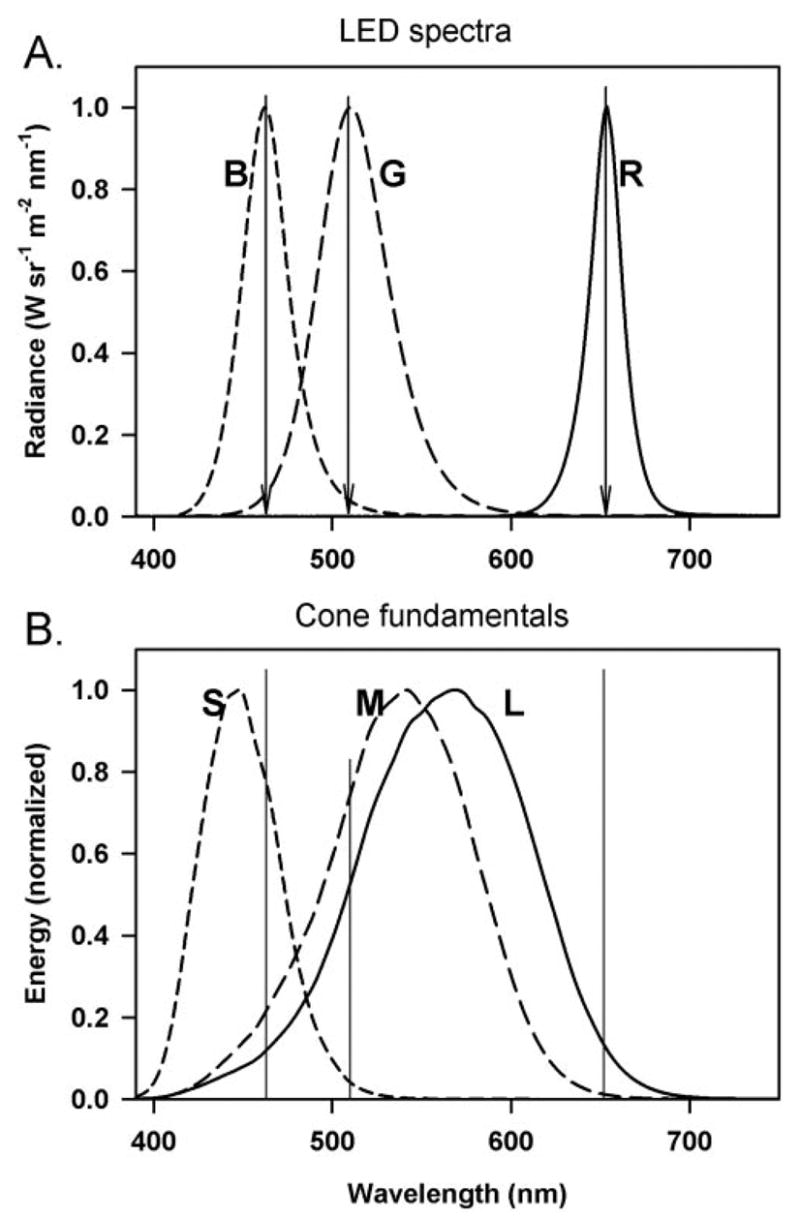
(A) Spectrum of the three LEDs (blue, green, and red) of the stimulator (Espion ColorBurst, Diagnosys LLC, Lowell, MA). (B) Cone fundamentals of the three human cones (S, M, and L) for a 10° field (from Stockman et al.25). The vertical lines in (B) correspond to the peak wavelength of the LEDs denoted by arrows in (A).
Table 1.
Relative Stimulation of the Three Cone Types by the Flash and Background Colors
| L | M | S | |
|---|---|---|---|
| Flash (equal photopic luminance) | |||
| Red | 1.18 | 0.16 | 0.0002 |
| Green | 0.87 | 1.27 | 0.24 |
| Blue | 1.32 | 2.54 | 12.0 |
| White | 1 | 1 | 1 |
| Background (equal scotopic luminance) | |||
| Blue | 0.33 | 0.62 | 1.48 |
| White | 1 | 1 | 1 |
| Yellow | 1.20 | 1.19 | 0.33 |
L, M, and S values are relative to the excitation provided by the white light, calculated using 10° cone fundamentals. The blue LEDs used for the background had a peak wavelength of 472 nm as opposed to the blue LEDs used for the stimulus, which had a peak wavelength of 462 nm.
The photopically matched flashes used in this study ranged from 0.04 to 2.84 cd-s/m2 for brief flashes and from 2.5 to 280 cd/m2 for the long-duration (200 ms) flashes. The strongest brief-flash stimulus we used had stimulus energy in the range of the ISCEV (International Society for Clinical Electrophysiology of Vision) standard flash. The blue, yellow, or white backgrounds used in this study were scotopically matched (100 scot cd/m2) but their photopic luminances were different (10, 35, and 40 cd/m2, respectively).
The main flash and background color combinations used in this study (for both brief- and long-duration flashes) included: a red flash on a blue background, a white flash on a white background and a blue flash on a yellow background. These three combinations were chosen because they have been used most commonly by investigators to elicit PhNRs in electrophysiological testing of patients with glaucoma and other optic neuropathies. In addition, we used green flashes on a blue background. The green LED in the stimulator (ColorBurst, Espion; Diagnosys LLC) produced similar excitation of L and M cones (see Table 1) and therefore served as another broadband stimulus. The other two combinations evaluated were red on white and blue on white, to determine the effect on the PhNR amplitude of a background of higher photopic luminance.
Photopic full-field flash ERGs were also obtained from human subjects using red on blue, blue on yellow, and white on white stimuli of the same strengths as those used for monkey recordings.
Analyses
In all cases the amplitude of the PhNR in the ERGs evoked by a brief flash was measured as the deviation from the baseline (averaged over one period at the line frequency, 17 ms before the stimulus) at the fixed time of 65 ms after the flash. This time was chosen to be close to the time of the maximum negativity after the b-wave but later than the i-wave and other oscillatory waves that could appear on the descending limb of the b-wave. For the long-duration flashes, the basic measurement in control eyes for the response at light onset (PhNRon) was made from the peak of the b-wave to the lowest point in the trough after the b-wave.1 However, because these measured negative waves contained more than a single negative component, one from the inner retina and one generated more distally, as described in the Results section, the amplitude of the PhNR was always based on the difference between measurements made in control eyes and eyes in which the PhNR could be assumed to have been removed. In experiments on eyes with experimental glaucoma, the PhNR (for both brief and long flashes) was calculated as the difference between measurements made in the ERGs of the fellow control eyes and the amplitude in glaucomatous eyes (measured at the same time as that in the control eyes) recorded in the same session. In experiments involving intravitreal injection of TTX or PDA, the reported PhNR is the difference in the ERG amplitude from the same eye obtained before and after the drug injection.
Statistical Analyses
Repeated-measures ANOVA was performed to determine whether there was a significant difference in the PhNR amplitude in response to the different color combinations. Paired t-tests were used to compare the effects of TTX, PDA after TTX, and experimental glaucoma on the PhNR amplitude of the ERGs obtained with each color combination individually. Two-sample t-tests were performed to determine whether there were significant differences between the effect of experimental glaucoma and TTX on the PhNR amplitude for each color combination individually.
Results
In reporting the results of our study, findings when brief flashes were used will be described first followed by those when long-duration flashes were used.
Brief-Flash ERGs
PhNR in Control Eyes
Figure 2A (left and middle columns) shows typical brief-flash ERGs for a control monkey eye obtained with the stimulus color combinations (red on blue and white on white) that have most commonly been used in published studies of patients with optic neuropathies and other forms of inner retinal damage (e.g., Refs. 7–14). Responses to blue on yellow are also illustrated (Fig. 2A; right-hand column), since isolation of the S-cone response using a silent substitution method has been shown by Drasdo et al.8 to elicit a large PhNR. Our blue stimulus did not isolate the S-cone response as well as was achieved in that study, but it was more effective for the S- cones than the L- and M-cones (see Table 1) and hence provided moderately selective activation of S-cones. Responses are shown for a range of stimulus energies from 0.044 cd-s/m2, the lowest energy at which a PhNR was clearly seen with a stimulus of any color, to 2.84 cd-s/m2, a level by which the PhNR (and b-wave) appeared to have reached saturation in all cases. In Figure 2B, photopic ERGs obtained with the other color combinations used in this study (red on white, green on blue, and blue on white) are shown for stimulus energies of 0.18 cd.s/m2 and higher.
Figure 2.
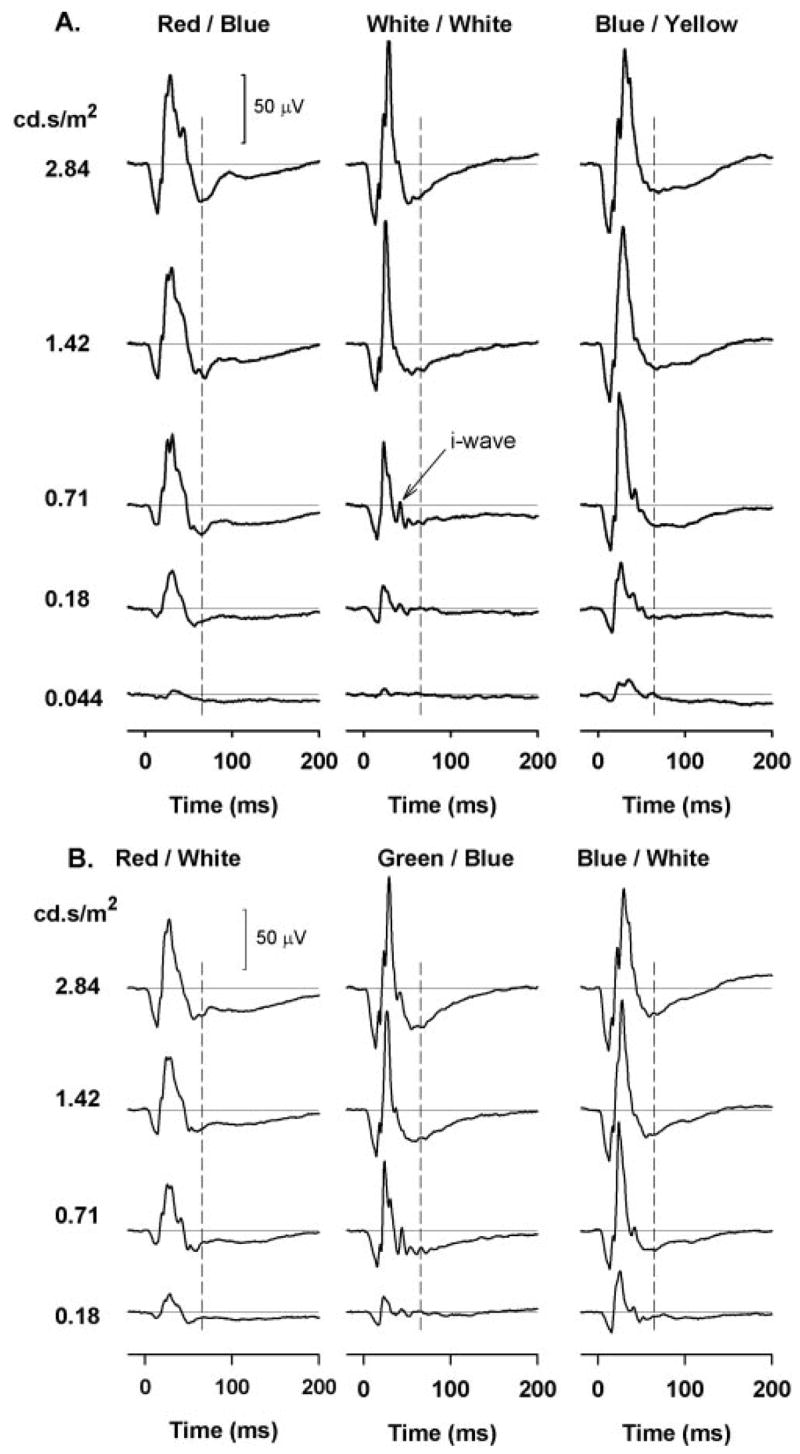
(A) Photopic full-field flash ERGs obtained with (left) brief red flashes on a blue background, (middle) white flashes on a white background, and (right) blue flashes on a yellow background for the range of stimulus strengths used in this study from a control monkey eye. (B) Photopic full-field flash ERGs obtained, left to right: with red on white, green on blue, and blue on white for four stimulus strengths from the same control eye as shown in (A).
For all color combinations, the response waveforms were generally similar: an initial brief negative-going a-wave, followed by a slightly longer lasting positive b-wave, and then an even longer negative PhNR. For every color combination illustrated in Figure 2 the amplitude of each of the three waves increased as the stimulus energy was increased, though in the case of white on white and green on blue stimuli, the PhNR was not evident until the stimulus energy was considerably greater than was needed with the other colors. When the stimulus energy was increased well above threshold, the differences among PhNR amplitudes disappeared, and for the two highest energies used in this study, 1.42 and 2.84 cd-s/m2, the amplitude of the PhNR was approximately the same for each stimulus color.
Although the waveform of the ERG was generally the same for each color, the responses to white on white and green on blue were noticeably different, the b-wave being of shorter duration (from zero-crossing to zero-crossing) and the i-wave being more prominent, especially for lower stimulus energies. With increase in stimulus energy, however, the waveforms for these stimuli became simpler and more similar to those obtained with the other colors.
To appreciate the effect of different color combinations on the relation between the amplitude of the PhNR and stimulus energy, the PhNR amplitude was measured at a fixed time of 65 ms after the stimulus (Fig. 2, indicated by dashed lines) and plotted as a function of stimulus energy (Fig. 3). The left-hand plot shows the PhNR amplitude for the three commonly used color combinations—red on blue (R/B), white on white (W/W), and blue on yellow (B/Y)—and the right-hand plot shows PhNR amplitude for red on white (R/W), green on blue (G/B), and blue on white (B/W). For reference, the R/B and W/W data from the left plot are repeated as red and gray solid lines in the right-hand plot.
Figure 3.
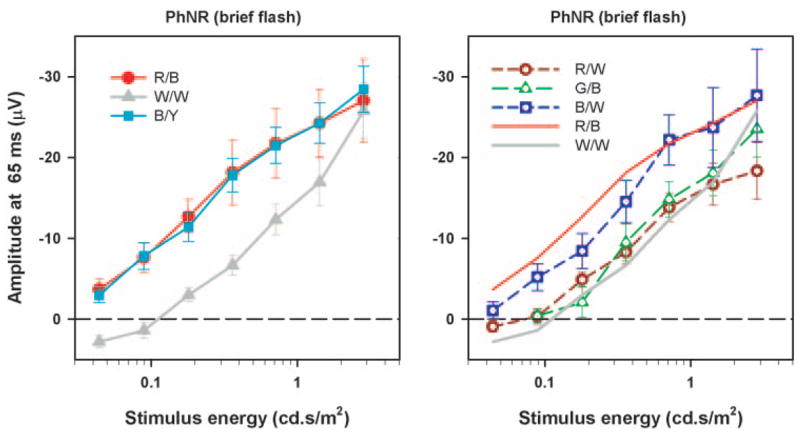
Mean PhNR amplitude (measured from the baseline at 65 ms) as a function of stimulus energy (left) for red on blue, for white on white, and for blue on yellow and (right) for red on white, green on blue, and blue on white. The error bars are ± 1 SEM (n = 6).
It can be seen from Figure 3 that red flashes on a blue background and blue flashes on a yellow background were generally the most effective stimuli. For these stimuli, the amplitude of the PhNR rose steadily and nearly linearly, with the logarithm of stimulus energy (i.e., much less rapidly than in direct proportion to stimulus energy) over the whole range of energies studied. There was some indication of a more rapid saturation at the higher energies corresponding approximately to the ISCEV standard flash (1.5–3 cd-s/m2). At the highest energy level, the blue on white and white on white stimuli gave rise to a PhNR with just about the same amplitude as the red on blue and blue on yellow stimuli, though the amplitude at low energies was significantly less (P < 0.05) for the blue on white and still less for the white on white. The red on white and green on blue stimuli were no more effective than white on white at the lower stimulus energies and did not show as great an increase in effectiveness as the white on white at the highest energy levels.
Effect of Experimental Glaucoma, Intravitreal TTX, and PDA after TTX
Because the ERGs in response to green on blue stimuli were so similar to those in response to white on white, and the ERGs in response to blue flashes were similar for white and yellow backgrounds, the figures illustrating the extent to which PhNRs were sensitive to experimental glaucoma or intravitreal TTX (and PDA) do not show responses to green on blue and blue on white stimuli.
Figure 4 shows the effect of (Fig. 4A) advanced experimental glaucoma in which field loss was severe (MD more than −10 dB), (Fig. 4B) TTX, and (Fig. 4C) PDA after TTX on the brief-flash ERGs at two stimulus energies (0.71 and 2.84 cd-s/m2). These two strengths were chosen because 0.71 cd-s/m2 is the stimulus that we have commonly used in other studies (e.g., Ref. 10), and 2.84 cd-s/m2 is not only within the range of the ISCEV standard flash but is also strong enough for all color combinations to give PhNRs of similar amplitude. In these plots, control ERGs are shown by the gray traces, ERGs in eyes with experimental glaucoma, or after TTX, and in eyes with PDA after TTX as solid black lines. The main effect of both experimental glaucoma and TTX was a marked reduction of the PhNR; the slow negative wave after the b-wave often being replaced by a prolonged positive phase above baseline. This was observed for all color combinations consistent with previous findings.1,10 In addition, TTX elevated the leading edge of the b-wave up to the peak, for all color combinations, slightly reduced the a-wave, and made the i-wave more prominent, as previously observed by Rangaswamy et al.10 for red stimuli on blue backgrounds. In contrast, experimental glaucoma had a very minimal effect on the b-waves, and a less-consistent effect on the a-wave.
Figure 4.

Photopic full-field flash ERGs with brief flashes obtained before (gray trace) and after experimental glaucoma (black trace) (A), TTX (black traces) (B), and PDA after TTX (black traces). The ERGs after TTX are shown as a solid gray line (C) for two stimulus energies (0.71 and 2.84 cd-s/m2).
Adding PDA after TTX had no additional effect on the PhNR although PDA made the b-wave slightly broader and eliminated the a- and i-waves as reported by Rangaswamy et al.10 for red flashes on a blue background.
Figure 5A shows how much experimental glaucoma (light gray bars) and TTX (dark gray bars) altered the amplitude of the ERG measured from the baseline 65 ms after the flash, for two stimulus energies (top: 2.84 cd-s/m2 and bottom: 0.71 cd-s/m2). In no case was the effect of glaucoma and TTX- on the amplitude of the ERG at 65 ms significantly different, (P > 0.05, two sample t-test). These plots also show the mean amplitude of the ERG measured in the control eyes from baseline at 65 ms after the flash. Displaying these data makes it easy to compare directly the standard measurement from baseline with the amplitude of the components of the ERG removed by the experimental procedures. For all stimulus strengths and all colors tested, the PhNR produced by removal of inner retinal contributions was larger than the PhNR measured from baseline in the control eyes. This finding implies that our standard method of quantifying the PhNR somewhat underestimated the amplitude of the inner retinal components of the ERG that produce the PhNR.
Figure 5.

(A) Glaucoma (n = 6) and TTX sensitive (n = 3) portion of the response measured at 65 ms after the flash with the different colors for two stimulus energies: 2.84 cd.s/m2 (top) and 0.71 cd.s/m2 (bottom). The PhNR amplitude of the control eye was measured from the baseline for each color combination. (B) Glaucoma (top), and TTX (middle), and PDA after TTX sensitive portion (bottom) (all n = 3) of the response measured at 65 ms after the flash as a function of stimulus energy for red on blue (R/B), white on white (W/W), blue on yellow (B/Y), and red on white (R/W). The error bars represent ±1 SEM. The control for the glaucomatous eye was the normotensive fellow eye and the control for eyes treated with test agents was the pretreatment measure in the same eye.
Figure 5B shows how the PhNR amplitude of the ERG induced by experimental glaucoma (top), TTX (middle), and PDA after TTX (bottom) varied with stimulus energy for the red on blue, white on white, blue on yellow, and red on white stimuli. Similar to the findings for the PhNR amplitude measured from baseline in the control eyes, for weaker stimuli, the change in amplitude was largest for the red on blue stimuli (red circles) and for the blue flashes on a yellow background (cyan squares) and smallest for white on white (gray triangles) and red on white stimuli (dark red circles). PDA injected after TTX had no further effect on the ERG, indicating that TTX had already removed the PhNR and reinforcing the utility of TTX or severe experimental glaucoma in identifying this component. The results for the other color combinations were equally in line with expectations based on observations of PhNR in control eyes. The close correspondence between the amplitude of the PhNR assessed by direct measurement of the brief-flash ERG and the amplitude assessed by experimental removal of inner retinal components becomes important when interpreting responses to long-duration stimuli where other slow negative components that overlap the PhNR in time are present.
Long-Duration Flash ERGs
Control Eyes
Figure 6A shows ERGs from a representative control monkey eye in response to long-duration (200 ms) stimuli of 70 cd/m2 for four different color combinations. As with responses to brief flashes, ERGs evoked by green on blue stimuli were similar to those evoked by white on white stimuli and ERGs for blue on white stimuli were similar to those for blue on yellow and are not illustrated. For all colors, ERGs recorded in response to the stimulus onset had an initial brief negative a-wave that was followed first by a brief positive b-wave and then by a much longer-lasting negative-going wave that can be assumed to include the photopic negative response to the stimulus onset. In control eyes, this negative wave had not returned to the plateau level that would have been seen with a longer-lasting stimulus. Stimulus offset gave rise to a positive-going d-wave that was followed by a slow return to the baseline on which a transient negative-going wave (the photopic negative response to the stimulus offset) was superimposed.
Figure 6.

Photopic full-field flash ERGs obtained with long-duration (200 ms) flashes for the different colors shown for a stimulus luminance of 70 cd/m2 from a control monkey eye (black line) (A); experimental glaucoma (black line; control is shown by the gray line) (B); TTX (black line) (C); and PDA after TTX (black line). The ERGs after TTX are shown by the gray line (D); the effect of TTX (left, 1.1 μM; black line) and NMDA (1.6 mM) after TTX on a long-duration flash response recorded with a blue flash on a blue background for the same flash and background luminance as used in (A–D). The preinjection control response (left) and the ERG after TTX but before NMDA (right) are shown by the gray lines (E).
Regardless of the stimulus luminance and background color (blue or white), the waveforms obtained with red stimuli were different from those obtained with other colors. As illustrated in Figure 6A, for moderate stimulus strengths, with red stimuli the a-wave was smaller, the trough after the b-wave hardly dipped below the baseline, and the d-wave had relatively minor oscillatory waves. In contrast, for the white, green, and blue stimuli, as luminance was increased up to that used for responses in Figure 6A and higher, the a-wave became quite large, the negative trough after the b-wave deepened, and the d-wave gained more noticeable oscillations on its peak. Because of the large variation in the voltage of the ERG at the minimum of the photopic negative trough, it was not clear how the amplitude of the inner retinal contribution (i.e., PhNR) to the long-duration flash ERG could best be estimated. This question was investigated by comparing ERGs from control eyes with those from eyes with experimental glaucoma and eyes injected either with TTX or with TTX and then PDA.
Inner Retinal Contributions to the Long-Duration Flash ERG
Figures 6B–D show the effect of experimental glaucoma (Fig. 6B), TTX (Fig. 6C), and PDA after TTX (Fig. 6D) on the responses to a 200-ms flash of 70 cd/m2. In every case, both experimental glaucoma and TTX resulted in complete, or nearly complete, elimination of the transient negative wave that followed the b-wave, so that a plateau level after the transient b-wave became established much earlier after stimulus onset in eyes whose inner retinal activity had been removed. Although with the red stimulus the level of the plateau after the b-wave was essentially the same as that of the b-wave peak itself, with the other colors the plateau was at a much lower level. For the white-on-white stimulus, the plateau level was close to, or even below, the baseline. Experimental glaucoma and TTX also appeared to eliminate the transient negative wave that represented the PhNR at the light offset for all the color combinations tested. However, the waveform complex at light offset changed considerably in shape and timing, with the different color combinations, making measurements of Off-PhNRs problematic, and therefore they were not included in this study.
Previous studies in monkeys showed that the plateau between the b- and d-wave was elevated by PDA for a long-duration white flash on a white background.15,27 Therefore, we injected PDA into the eyes that had already received a TTX injection and, as shown in Figure 6D, this elevated the plateau between the b- and d-wave in the ERGs evoked by white, blue, and green (not shown) stimuli. The effect of PDA on the response to a red stimulus was smaller, the level of the plateau after TTX alone already being relatively higher than for other colors. The effect of PDA injected after TTX was similar to that obtained when PDA was injected alone in a control eye (data not shown), which is to be expected because PDA blocks all inner retinal responses in addition to blocking the responses of Off-bipolar and horizontal cells.17–19 The elevation of the plateau between the b- and the d-wave can probably be ascribed to elimination of the activity of Off-bipolar and horizontal cells by PDA. The traces in Figure 6E show the effect of TTX (left) and the effect of NMDA after TTX (right) on the response to a long-duration blue flash on a blue background, selected from other studies in the laboratory. Adding NMDA to an eye already injected with TTX (Fig. 6E), to eliminate at least some of the nonspiking responses of third-order neurons28,29 that remained after spikes were blocked, did not elevate the plateau much more than TTX alone. The limited effect on the response to white stimuli on a white background of NMDA (injected alone) compared with that of PDA has been described by Sieving et al.15
It was unclear how the amplitude of the PhNR, evoked by the onset of a long-duration flash, PhNRon, could reasonably be estimated from control records. Therefore, the change in amplitude at the time of the negative PhNR trough in control ERGs that was brought about by procedures that removed inner retinal responses were used as a surrogate estimate of PhNRon. Figure 7 shows the PhNR amplitude produced by experimental glaucoma and TTX with the color combinations used in Figure 6 measured over a range of stimulus luminances. As seen for responses to brief flashes, the PhNRon revealed by TTX and experimental glaucoma were similar, although the PhNR amplitude after TTX did not increase as monotonically with stimulus strength as with glaucomatous eyes in these long-flash experiments. The PhNRon to the blue and red stimuli increased as a function of stimulus strength and first saturated at a stimulus luminance of approximately 15 cd/m2, after which the amplitude with the blue stimulus continued to grow. The PhNRon was smallest with the white on white stimuli, but with increasing stimulus luminance, the amplitudes increased and became similar to the PhNRon recorded with the blue and red stimuli. For stimulus luminance up to approximately 20 cd/m2, PhNRon for the white on white and green on blue stimuli was significantly smaller than the PhNRon recorded with the red and blue stimuli (P < 0.05, repeated measures ANOVA). However, for any given color combination of a particular stimulus strength, there was no statistically significant difference (P > 0.05. two-sample t-test) in the PhNRon estimated from the TTX and glaucoma experiments.
Figure 7.
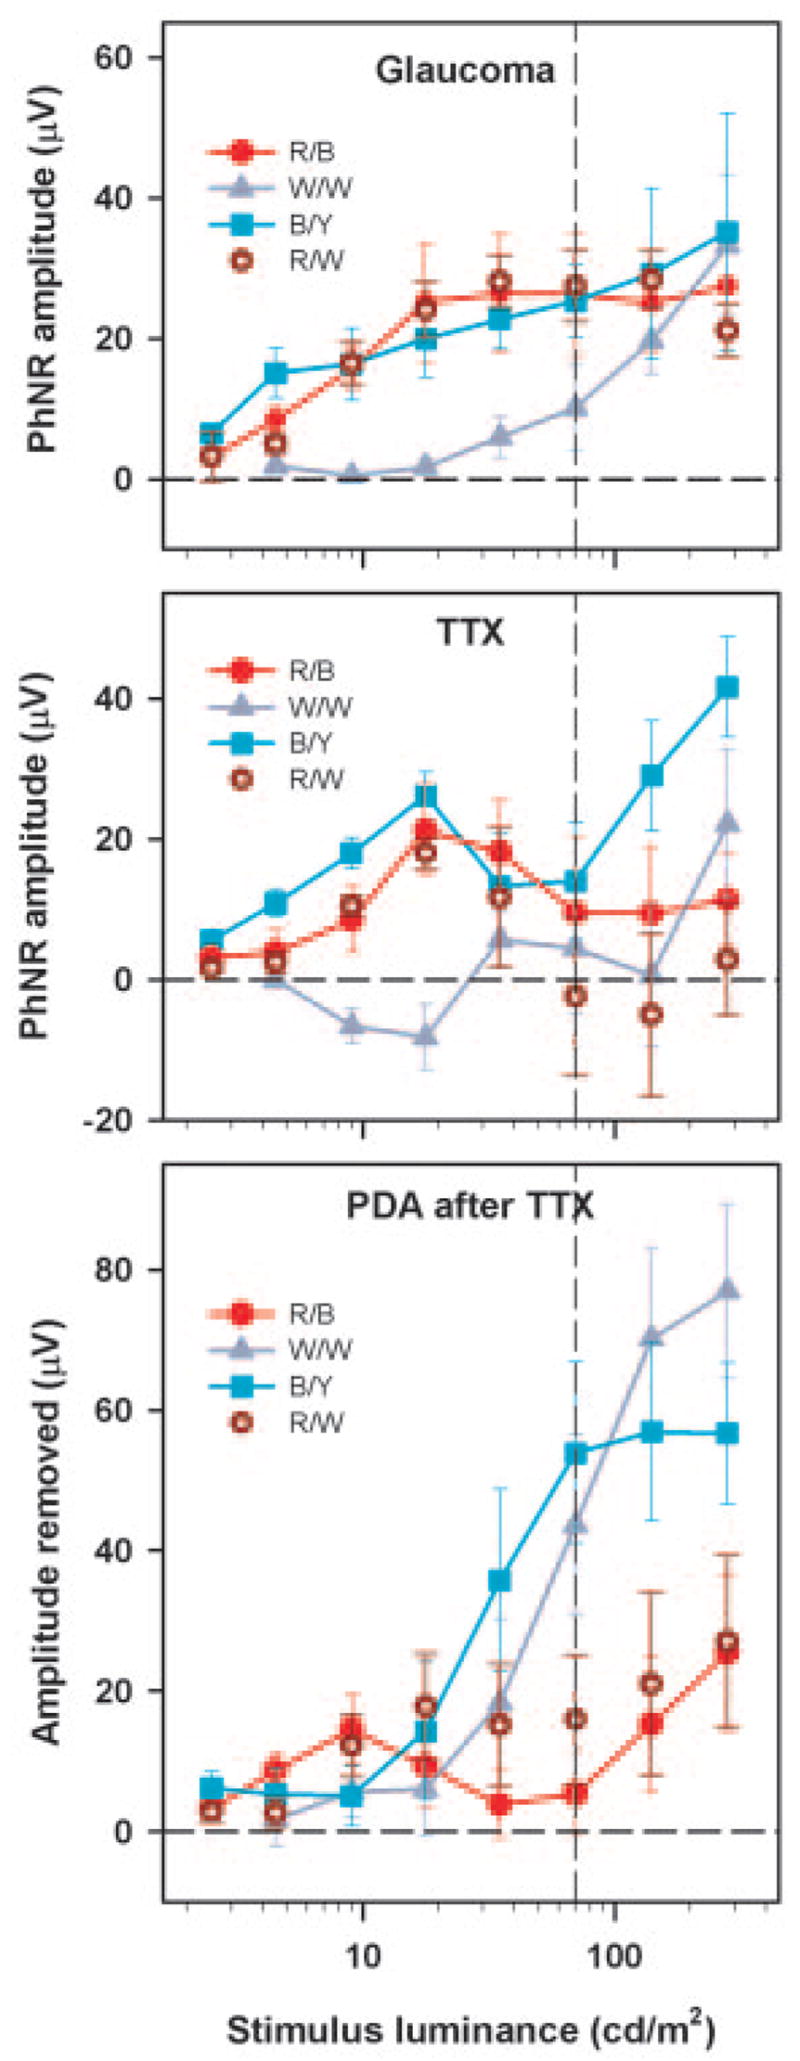
Top: experimental glaucoma (n = 6). Middle: TTX-sensitive PhNRon (n = 3) plotted as a function of the stimulus luminance for the different color combinations. Bottom: PDA (after TTX; n = 3)-sensitive portion of the On part of the long-duration flash ERG as a function of stimulus luminance for the different color combinations. Error bars: ±1 SEM. The vertical dashed line in these plots represents the stimulus luminance for which ERGs are shown in Figures 6 and 8.
Figure 7 (bottom) shows the further change in amplitude of the ERG (measured at the time of the PhNR trough in control eyes) produced when PDA was injected after the spiking activity of inner retina had already been blocked with TTX. It is evident that adding PDA to the vitreous after TTX injection had relatively little effect on the ERG evoked by red stimuli. Although PDA also had little effect on the ERGs evoked by blue and white (and green, not illustrated) stimuli of low luminance, when the luminance of these stimuli was increased above approximately 20 cd/m2, the effect of PDA rapidly became much larger. This finding indicates that the negative-going wave after the b-wave recorded with the red flashes had been largely eliminated by TTX, and hence was primarily a contribution from the innermost retina, whereas the responses to strong stimuli of the other colors contained a large PDA-sensitive negative component from the more distal retina.
Comparison with Human Photopic Full-Field ERGs
Figure 8 shows representative normal photopic full-field flash ERGs obtained with (Fig. 8A) brief (0.71 cd-s/m2) and (Fig. 8B) long-duration flashes (70 cd/m2) from a normal human subject (top) and monkey (bottom) for the three flash and background color combinations (red on blue, white on white, and blue on yellow). The waveforms of the ERGs recorded in the human subjects were generally similar to those recorded in the monkeys for both brief- and long-duration flashes. For the brief-flash ERG, the human PhNR amplitude was smallest for the white on white stimulus, consistent with the finding in the monkeys. For the long-duration flashes, the human response to the red stimulus was (as in the monkeys) clearly somewhat different from that to the other colors, having a b-wave of slightly longer duration and a PhNR trough that was less deep, although, unlike the monkey, the voltage at the deepest point of the human PhNR was negative, even with the red stimulus, as previously observed by Viswanathan et al.1
Figure 8.

Photopic full-field flash ERGs obtained for three flash and background color combinations from a control human eye (top) and control monkey eye (bottom) for (A) brief of stimulus energy 0.71 cd-s/m2 and (B) long-duration flashes of stimulus luminance 70 cd/m2. (C) Mean PhNR amplitude (measured from baseline at 65 ms) for a brief flash as a function of stimulus energy for the human (top) and monkey (bottom) controls. The error bars represent ± 1 SEM. (C) Vertical dashed line: the stimulus energy for which ERGs are shown in Figures 4 and 8A.
Figure 8C shows a comparison plot of mean PhNR amplitude as a function of stimulus energy for the three color combinations for human controls (top) and monkey controls (bottom) for brief-flash ERGs. Similar to the findings in the monkeys discussed earlier and shown in the bottom plot, the PhNR amplitude with the white-on-white stimuli (gray triangles) was significantly smaller than the PhNR amplitude obtained with the red and blue stimuli (red circles) for weaker stimulus strengths (P < 0.05, repeated measures ANOVA). For the strongest stimulus energy, the PhNR amplitude measured in the control monkeys were very similar to each other while the PhNR amplitude obtained with the white on white stimulus in the control human was still smaller than that obtained with the red and blue flashes.
DISCUSSION
This study shows that a PhNR can be identified in the photopic ERG of macaques and humans by using a variety of different color combinations for the flashed stimulus and the rod-saturating background. However, the amplitude of the PhNR elicited by stimuli of different colors depends not only on the strength of the stimulus but also on the specificity of each colored stimulus for a single type of cone and the effectiveness of the rod-saturating background in adapting the cones that are activated.
Our hypothesis that flashed stimuli of colors that induced the least spectral antagonism would be best for eliciting the PhNR of brief-flash ERGs was generally confirmed for weak to moderate stimulus strengths. Thus, the PhNRs obtained with a red flash (on a blue background) or a blue flash (on a yellow or white background) were the largest, whereas responses to white or green flashes were the smallest; that is, as a generalization, the flashed stimuli eliciting the largest PhNRs were relatively more specific for a single type of cone, whereas stimuli eliciting the smallest PhNRs were the most broadband in effect (Fig. 1, Table 1). As stimulus strength was increased, the differential effect of stimulus color was eliminated in macaques and reduced in humans. This occurred as response amplitude to the red flashes saturated, and amplitudes for the other colors continued to grow. The amplitudes of the a- and b-waves also grew relatively more with increasing stimulus strength for all colors other than red (a statistically significant finding, data not shown). The greater increase in a- and b-wave amplitude with stimuli other than red probably occurred because the other stimuli were less specific for a particular cone type than was the red stimulus (see Table 1). The signals from the different cone-types, even when traveling in separate retinal pathways, could add together in the ERG when stimulus strength was increased.
Although the backgrounds were all scotopically matched and were therefore all equally effective in suppressing the rod pathway, their effectiveness in adapting the different cone pathways depended on their spectral composition. For example, the waveform of the ERGs obtained with the brief red flashes on both white and blue backgrounds were similar, but amplitudes tended to be lower when the white background was present because this background had a greater adapting effect on L- and M-cones (corresponding to its greater photopic luminance) than that of the blue background. The waveforms of the ERGs obtained with blue flashes on either yellow or white backgrounds were similar to one another, although brief-flash responses tended to be smaller, but not significantly so, on the white background (Fig. 3). The two backgrounds differed mainly in the amount of blue light that they included, with the white background being three times more effective for the S-cones than the yellow background. However, both backgrounds were more effective in adapting L- and M-cones than was the blue background and had much the same adapting effect as each other on the L and M cones (see Table 1). These effects also were seen in the ERGs recorded using long-duration flashes and isolated using experimental glaucoma or TTX. However, for the longer duration stimuli, with more energy delivered by the flash, the more nearly saturated responses to red flashes were no more reduced by the white than by the blue background.
The PhNRs in response to broadband stimuli presented on backgrounds with greater photopic luminance grew to the size of the responses elicited with red or blue flashes only when the stimuli were strong enough to compensate for the reduced sensitivity caused by the background. The PhNR obtained with the white on white combination was the smallest in amplitude for weak stimuli because the broadband flash produced strong center-surround antagonism, and the white background had the highest photopic luminance.
The greater effectiveness of colored stimuli that were more specific for a particular cone type than the more broadband stimuli was particularly obvious when long-duration flashes were used. The waveform of the PhNRon isolated by experimental glaucoma or TTX in macaques was similar for the various colors; however, the PhNRon was obscured by a negative-going component that could be eliminated by PDA in the ERGs obtained with all but the red flashes. This component, originally observed by Sieving et al.15 and Bush and Sieving,27 arises from hyperpolarizing second-order neurons and will be discussed later.
Inner Retinal Contributions to the ERG
The contributions of responses of inner retinal cells to the ERG were determined in macaques by looking at the effects of advanced experimental glaucoma and of pharmacologic blockade of inner retinal spiking activity with TTX. For brief flashes, both procedures were similar in their effects on the response after the b-wave: They reduced the amplitude of the PhNR and increased the prominence of the small positive i-wave, arising from Off pathways,10 which was present after the b-wave. However, the effects of TTX on the PhNR amplitude were more variable than those of severe glaucoma and the effects of glaucoma and TTX on the a- and b-waves differed, with an increase in b-wave amplitude, and reduction in a-wave amplitude only being seen consistently with TTX. The effects of TTX on a- and b-waves have been observed previously and are similar to effects in humans of nonarteritic anterior ischemic optic neuropathy,10 and of optic neuritis associated with multiple sclerosis (Rangaswamy et al., unpublished observations, June 2005).
The inner retinal contributions to ERG at the onset of the long-duration flash was manifest as the PhNRon, which appears as a transient negative dip after the b-wave, and as the response to the flash offset, the PhNRoff, which is a transient negative dip after the d-wave. With the red stimuli (on both blue and white backgrounds), almost all of the dip between the b- and d-wave was of inner retinal origin, whereas with the other colors, there was a very large long-lasting and overlapping negative (hyperpolarizing) component that was PDA sensitive and is thought to come from hyperpolarizing second-order neurons.27 Therefore, the inner retinal contribution to the long-duration flash ERG could be more easily identified with the use of red flashes than with the other colors.
The waveform of the response to long-duration red flashes is very different from that obtained with white, blue, or green flashes, as initially observed by Evers and Gouras30 in monkeys. This was also reported by Kasuga31 who used principle-component analysis of monkey ERGs to analyze responses to flashes of different colors and suggested that the waveform differences seen with red and green stimuli are due to red-green opponency’s affecting the response to the green stimulus. This raises an interesting question about the cells of origin of the long-lasting PDA-sensitive negative plateau. To the extent that it is due to spectral opponency, it is more likely to be explained by horizontal cell feed back via cones to spectrally opponent cone-bipolar cells than by the push–pull effects of Off- versus On-bipolar cells, as suggested by Sieving et al.15
Comparison of Macaque and Human PhNR
In this study we found that in humans, as in macaques, the amplitude of the PhNRs obtained with brief red and blue flashes of weak to moderate stimulus strengths that, to some extent, isolated particular cones were larger than those produced by more broadband stimuli. One difference noticed between the monkey and human PhNRs was that for the maximum flash energy used in this study, 2.8 cd-s/m2, and for all combinations of stimulus and background color, the PhNR amplitude in the monkeys became saturated at about the same amplitude, whereas the PhNR amplitude in the human subjects was still growing so that red flashes still elicited larger PhNR amplitudes than white flashes. One reason for this difference in PhNRs could be a difference in the L-to-M cone ratios in these two species. The L-to-M cone ratio in Macaca mulatta, the species of monkey used in this study, is reported to be 1:1 on average,26,32–36 whereas in humans it is approximately 2:1 on average, with a range from 1:3 to as high as 20:1 in some individuals.37–40
PhNR Amplitudes in Other Studies
In this study, we found that whereas the PhNR amplitude in humans obtained with a red on blue stimulus was larger than that with white on white, for all stimulus energies up to the maximum that we used, 2.8 cd-s/m2. This prompts the question of what might have happen if we had used stronger stimuli for human subjects. Data from a recent study by Chen et al.,14 who used red on blue brief red flashes similar to those in our study, but with energies up to 7 cd-s/m2, showed an increase in PhNR amplitude in normal human eyes when stimulus energy was raised from 1 to 5 cd-s/m2, but with hardly any further increase for a stimulus of 7 cd-s/m2, suggesting that for the red on blue (LED) Ganzfeld stimulus, the PhNR amplitude in humans saturates at around 5 cd-s/m2.
PhNR amplitudes obtained by Chen et al.14 also were considerably larger than the amplitudes for the human subjects in the present study, even when stimuli were of equivalent strength. A possible factor is that we used DTL fiber electrodes while Chen et al.14 and investigators in other recent studies who examined PhNR amplitude in humans in response to white on white stimuli9,12,13 recorded the PhNR with contact lens electrodes that may yield larger signals than we have observed.
Practical Implications
The PhNR can be elicited with a variety of color combinations of stimuli and backgrounds, but for weaker stimulus strengths it is larger in response to stimuli that are relatively more cone-type specific. Preferential stimulation of the L-cones is likely to be more successful in most available LED stimulators than is stimulation of S-cones due to the commonly used wavelength of the LEDs with which it is not possible to get good isolation of S-cone signals from M-cone signals with flashed stimuli. With red stimuli, moderate stimulus strengths can be used, which can make ERG testing more comfortable for the patient. However, the white stimuli in stimulators that do not produce narrow-band stimuli is a viable option if a strong enough stimulus is used. For responses to long-duration stimulation, the red stimulus is essential for separating the inner retinal contributions that constitute the PhNR from the long-lasting, negative-going wave that originates more distally and overlaps in time with the inner retinal contributions.
Acknowledgments
The authors thank Ronald S. Harwerth and Earl L. Smith, III, University of Houston, for providing monkeys known from perimetric testing to have severe experimental glaucoma as a consequence of laser-induced elevation of the intraocular pressure.
Supported by National Eye Institute Grants R01-EY06671, P30-EY07751, and T35007088.
Footnotes
Disclosure: N.V. Rangaswamy, None; S. Shirato, None; M. Kaneko, None; B.I. Digby, None; J.G. Robson, None; L.J. Frishman, None
References
- 1.Viswanathan S, Frishman LJ, Robson JG, Harwerth RS, Smith EL., III The photopic negative response of the macaque electroretinogram is reduced by experimental glaucoma. Invest Ophthalmol Vis Sci. 1999;40:1124–1136. [PubMed] [Google Scholar]
- 2.Frishman LJ, Shen FF, Du L, et al. The scotopic electroretinogram of macaque after retinal ganglion cell loss from experimental glaucoma. Invest Ophthalmol Vis Sci. 1996;37:125–141. [PubMed] [Google Scholar]
- 3.Hare WA, Ton H, Ruiz G, Feldmann B, Wijono M, WoldeMussie E. Characterization of retinal injury using ERG measures obtained with both conventional and multifocal methods in chronic ocular hypertensive primates. Invest Ophthalmol Vis Sci. 2001;42:127–136. [PubMed] [Google Scholar]
- 4.Bloomfield SA. Effect of spike blockade on the receptive field size of amacrine and ganglion cells in the rabbit retina. J Neurophysiol. 1996;75:1878–1893. doi: 10.1152/jn.1996.75.5.1878. [DOI] [PubMed] [Google Scholar]
- 5.Stafford DK, Dacey DM. Physiology of the A1 amacrine: a spiking axon-bearing interneuron of the macaque monkey retina. Vis Neurosci. 1997;14:507–522. doi: 10.1017/s0952523800012165. [DOI] [PubMed] [Google Scholar]
- 6.Colotto A, Falsini B, Salgarello T, Iorossi G, Galan ME, Scullica L. Photopic negative response of the human ERG: losses associated with glaucomatous damage. Invest Ophthalmol Vis Sci. 2000;42:2205–2211. [PubMed] [Google Scholar]
- 7.Viswanathan S, Frishman LJ, Robson JG, Walters JW. The photopic negative response of the flash electroretinogram in primary open angle glaucoma. Invest Ophthalmol Vis Sci. 2001;42:514–522. [PubMed] [Google Scholar]
- 8.Drasdo N, Aldebasi YH, Chiti Z, Mortlock KE, Morgan JE, North RV. The s-cone PhNR and pattern ERG in primary open angle glaucoma. Invest Ophthalmol Vis Sci. 2001;42:1266–1272. [PubMed] [Google Scholar]
- 9.Gotoh Y, Machida S, Tazawa Y. Selective loss of photopic negative response in patients with optic nerve atrophy. Arch Ophthalmol. 2004;122:341–346. doi: 10.1001/archopht.122.3.341. [DOI] [PubMed] [Google Scholar]
- 10.Rangaswamy NV, Frishman LJ, Dorotheo U, Tang RA. Photopic ERGs in patients with optic neuropathies: comparison with primate ERGs after pharmacological blockade of inner retina. Invest Ophthalmol Vis Sci. 2004;45:3827–3837. doi: 10.1167/iovs.04-0458. [DOI] [PubMed] [Google Scholar]
- 11.Miyata K, Nakamura M, Kondo M, et al. Reduction of oscillatory potentials and photopic negative response in patients with autosomal dominant optic atrophy with OPA1 mutations. Invest Ophthalmol Vis Sci. 2007;48:820–824. doi: 10.1167/iovs.06-0845. [DOI] [PubMed] [Google Scholar]
- 12.Machida S, Gotoh Y, Tanaka M, Tazawa Y. Predominant loss of photopic negative response in central retinal artery occlusion. Am J Ophthalmol. 2004;137:938–940. doi: 10.1016/j.ajo.2003.10.023. [DOI] [PubMed] [Google Scholar]
- 13.Ueno S, Kondo M, Piao CH, Ikenoya K, Miyake Y, Terasaki H. Selective amplitude reduction of the PhNR after macular hole surgery: ganglion cell damage related to ICG-assisted ILM peeling and gas tamponade. Invest Ophthalmol Vis Sci. 2006;47:3545–3549. doi: 10.1167/iovs.05-1481. [DOI] [PubMed] [Google Scholar]
- 14.Chen H, Wu D, Huang S, Yan H. The photopic negative response of the flash electroretinogram in retinal vein occlusion. Doc Ophthalmol. 2006;113:53–59. doi: 10.1007/s10633-006-9015-z. [DOI] [PubMed] [Google Scholar]
- 15.Sieving PA, Murayama K, Naarendorp F. Push-pull model of the primate photopic electroretinogram: a role for hyperpolarizing neurons in shaping the b-wave. Vis Neurosci. 1994;11:519–532. doi: 10.1017/s0952523800002431. [DOI] [PubMed] [Google Scholar]
- 16.Dawson WW, Trick GL, Litzkow CA. Improved electrode for electroretinography. Invest Ophthalmol Vis Sci. 1979;18:988–991. [PubMed] [Google Scholar]
- 17.Slaughter MM, Miller RF. An excitatory amino acid antagonist blocks cone input to sign-conserving second-order retinal neurons. Science. 1983;219:1230–1232. doi: 10.1126/science.6131536. [DOI] [PubMed] [Google Scholar]
- 18.Slaughter MM, Miller RF. Bipolar cells in mudpuppy retina use an excitatory amino acid neurotransmitter. Nature. 1983;303:537–538. doi: 10.1038/303537a0. [DOI] [PubMed] [Google Scholar]
- 19.Stockton RA, Slaughter MM. B-wave of the electroretinogram: a reflection of on bipolar cell activity. J Gen Physiol. 1989;93:101–122. doi: 10.1085/jgp.93.1.101. [DOI] [PMC free article] [PubMed] [Google Scholar]
- 20.Viswanathan S, Frishman LJ, Robson JG. Inner retinal contributions to the photopic flicker electroretinogram of macaques. Doc Ophthalmol. 2002;105:223–242. doi: 10.1023/a:1020505104334. [DOI] [PubMed] [Google Scholar]
- 21.Rangaswamy NV, Hood DC, Frishman LJ. Regional variations in local contributions to the primate photopic flash ERG: revealed using the slow-sequence mfERG. Invest Ophthalmol Vis Sci. 2003;44:3233–3247. doi: 10.1167/iovs.03-0009. [DOI] [PubMed] [Google Scholar]
- 22.Smith EL, III, Chino YM, Harwerth RS, Ridder WH, Crawford ML, DeSantis L. Retinal inputs to the monkey’s lateral geniculate nucleus in experimental glaucoma. Clin Vis Sci. 1993;8:113–139. [Google Scholar]
- 23.Harwerth RS, Smith EL, III, DeSantis L. Behavioral perimetry in monkeys. Invest Ophthalmol Vis Sci. 1993;34:31–40. [PubMed] [Google Scholar]
- 24.Harwerth RS, Vilupuru AS, Rangaswamy NV, Smith EL., III The relationship between nerve fiber layer and perimetry measurements. Invest Ophthalmol Vis Sci. 2007;48:763–773. doi: 10.1167/iovs.06-0688. [DOI] [PubMed] [Google Scholar]
- 25.Stockman A, MacLeod DI, Johnson NE. Spectral sensitivities of human cones. J Opt Soc Am A Opt Image Sci Vis. 1993;10:2491–2521. doi: 10.1364/josaa.10.002491. [DOI] [PubMed] [Google Scholar]
- 26.Dobkins K, Thiele A, Albright TD. Comparison of red-green equi-luminance points in humans and macaques: evidence for different L:M cone ratios between species. J Opt Soc Am A. 2000;17:545–556. doi: 10.1364/josaa.17.000545. [DOI] [PubMed] [Google Scholar]
- 27.Bush RA, Sieving PA. A proximal retinal component in the primate photopic ERG a-wave. Invest Ophthalmol Vis Sci. 1994;35:635–645. [PubMed] [Google Scholar]
- 28.Robson JG, Frishman LJ. Dissecting the dark-adapted electroretinogram. Doc Ophthalmol. 1999;1998–95:187–215. doi: 10.1023/a:1001891904176. [DOI] [PubMed] [Google Scholar]
- 29.Hood DC, Greenstein V, Frishman LJ, et al. Identifying inner retinal contributions to the human multifocal ERG. Vision Res. 1999;39:2285–2291. doi: 10.1016/s0042-6989(98)00296-x. [DOI] [PubMed] [Google Scholar]
- 30.Evers HU, Gouras P. Three cone mechanisms in the primate electroretinogram: two with, one without off- center bipolar responses. Vis Res. 1986;26:245–254. doi: 10.1016/0042-6989(86)90019-2. [DOI] [PubMed] [Google Scholar]
- 31.Kasuga T. Effect of glutamate analogues on red-green opponent interaction in monkey electroretinograms. Exp Eye Res. 2001;73:311–320. doi: 10.1006/exer.2001.1043. [DOI] [PubMed] [Google Scholar]
- 32.Jacobs GH, Deegan JF., 2nd Spectral sensitivity of macaque monkeys measured with ERG flicker photometry. Vis Neurosci. 1997;114:921–928. doi: 10.1017/s0952523800011639. [DOI] [PubMed] [Google Scholar]
- 33.Marc RE, Sperling HG. Chromatic organization of primate cones. Science. 1977;196:454–456. doi: 10.1126/science.403607. [DOI] [PubMed] [Google Scholar]
- 34.Bowmaker JK, Mollon JD, Jacobs GH. Microspectrophotometric results for old and new world primates. In: Mollon JD, Sharpe LT, editors. Colour Vision. London: Academic Press; 1983. pp. 57–68. [Google Scholar]
- 35.Harosi FI. Cynomolgus and rhesus monkey visual pigments: application of Fourier transform smoothing and statistical techniques to the determination of spectral parameters. J Gen Physiol. 1987;89:717–743. doi: 10.1085/jgp.89.5.717. [DOI] [PMC free article] [PubMed] [Google Scholar]
- 36.Mollon JD, Bowmaker JK. The spatial arrangement of cones in the primate fovea. Nature. 1992;360:677–679. doi: 10.1038/360677a0. [DOI] [PubMed] [Google Scholar]
- 37.Roorda A, Williams DR. The arrangement of the three cone classes in the living human eye. Nature. 1999;397:520–522. doi: 10.1038/17383. [DOI] [PubMed] [Google Scholar]
- 38.Carroll J, Neitz J, Neitz M. Estimates of L:M cone ratio from ERG flicker photometry and genetics. J Vision. 2002;2:531–542. doi: 10.1167/2.8.1. [DOI] [PubMed] [Google Scholar]
- 39.Hofer H, Carroll J, Neitz J, Neitz M, Williams DR. Organization of the human trichromatic cone mosaic. J Neurosci. 2005;25:9669–9679. doi: 10.1523/JNEUROSCI.2414-05.2005. [DOI] [PMC free article] [PubMed] [Google Scholar]
- 40.Kremers J, Scholl HP, Knau H, Berendschot TT, Usui T, Sharpe LT. L/M cone ratios in human trichromats assessed by psychophysics, electroretinography and retinal densitometry. J Opt Soc Am A Opt Image Sci Vis. 2000;17:517–526. doi: 10.1364/josaa.17.000517. [DOI] [PubMed] [Google Scholar]