

Abstract
This study shows that two whole isolated preparations from the young mouse, the neocortical ‘slab’ and the hippocampal formation, are useful for imaging studies requiring both global monitoring using light transmittance (LT) imaging and high resolution cellular monitoring using 2-photon laser scanning microscopy (2PLSM). These preparations share advantages with brain slices such as maintaining intrinsic neuronal properties and avoiding cardiac or respiratory movement. Important additional advantages include the maintenance of all local input and output pathways, the absence of surfaces injured by slicing and the preservation of three-dimensional tissue structure. Using evoked extracellular field recording, we demonstrate long-term (hours) viability of both whole preparations. We then show that propagating cortical events such as anoxic depolarization (AD) and spreading depression (SD) can be imaged in both preparations, yielding results comparable to those in brain slices but retaining the tissue’s three-dimensional structure. Using transgenic mice expressing green fluorescent protein (GFP) in pyramidal and granule cell neurons, 2PLSM confirms that these preparations are free of the surface damage observed in sliced brain tissue. Moreover the neurons undergo swelling with accompanying dendritic beading following AD induced by simulated ischemia, similar to cortical damage described in vivo.
Keywords: 2-photon microscopy, light transmittance, GFP, Ischemia, Stroke, Spreading depression, Anoxic depolarization
1. Introduction
Adult brain slices as thick as 600 μm remain viable for several hours through diffusion of oxygen, glucose and salts from the artificial cerebrospinal fluid (aCSF) that superfuses the tissue. The whole hippocampal formation (HF) or neocortical ‘slab’ isolated from young mice (5–11 days old) are slightly thicker but it is likely that less myelination permits better permeation of aCSF constituents. In this study, both of these whole preparations are characterized and their usefulness examined for extracellular electrophysiological recordings, light transmittance (LT) imaging and 2-photon laser scanning microscopy (2PLSM).
The sudden depolarization of neurons and glia occurs in response to ischemia or high K+ causing propagating cortical events called anoxic depolarization (AD) or spreading depression (SD), respectively, in cortical brain slices (Anderson et al., 2005; Anderson and Andrew, 2002). The AD occurs in response to severe metabolic compromise. We examined AD and SD in the whole tissue preparations using LT imaging, 2PLSM and extracellular recordings of evoked field potentials. For the 2PLSM experiments we used 5–11 day old C57 black mice of the B6.Cg-TgN (thyl-GFP)MJrc strain (Feng et al., 2000) where green fluorescent protein (GFP) is expressed in a small proportion of the pyramidal neurons, particularly in neocortical layers II/III and V and in HF. The combination of 2PLSM and GFP allows for detailed examination of neuronal morphology of live neurons in real time before and after ischemic stress (Andrew et al., 2007). The 2PLSM imaging could focus from the surface of the whole preparations to a depth of ~400 microns.
Isolated whole preparations share several advantages with brain slices. They are superfused with aCSF and remain viable for several hours through diffusion of oxygen, glucose, and salts. Drugs are easily added to the aCSF superfusate and there is no cardiac or respiratory movement. Neuron-glia interactions, local synaptic circuitry and glia-glia electrotonic/metabolic coupling through gap junctions help maintain normal function as well as preserve ischemia-like responses during oxygen/glucose deprivation (OGD). Whole preparations avoid severing local input and output pathways (Khalilov et al., 1997) as well as surface injury during brain slice preparation. Here we show that these preparations are also useful for imaging propagating depolarizing events in three dimensions that is not possible in slices. Finally, whole preparations can confirm that events generated in acute brain slices also arise in unsliced tissue, lending further support that such events occur in vivo (Chuquet et al., 2007: Takano et al., 2007; Zhang et al., 2005; Zhang and Murphy, 2007).
The objectives of this study are to 1) Confirm that the whole hippocampal and neocortical preparations remain viable during aCSF superfusion by recording evoked field potentials; 2) By imaging changes in light transmittance, determine if the whole preparations support those spreading cortical events evoked in brain slices; 3) Using 2PLSM, investigate the appearance of pyramidal and granule cells and the extent of surface damage in whole preparations compared to acute brain slices; 4) Examine, with 2PLSM the injury that occurs to the pyramidal cells in the minutes following the propagation of AD through the preparation in response to OGD.
2. Materials and methods
2.1. Dissection
All procedures follow National Institutes of Health guidelines for the humane care and use of laboratory animals and undergo yearly review by the Animal Care and Use Committees at the Queen’s University and the Medical College of Georgia. C57 black mice 5–11 days old were anesthetized with sodium pentobarbital by intraperitoneal injection and then intracardially perfused with cold (4°C) oxygenated (95% O2, 5% CO2) aCSF with equiosmolar sucrose (210 mM) replacing NaCl (sucrose aCSF). Sucrose substitution protects neurons from swelling during dissection and subsequent incubation (Kirov et al., 2004b). Following perfusion with about 5 ml of sucrose aCSF, the mouse was decapitated using a guillotine. Fine scissors were used to cut away the cranium and the brain was quickly but carefully excised and placed on filter paper soaked with cold, oxygenated sucrose aCSF. It was then placed in a Petri dish with aCSF and cut down the midline. The hippocampal formation (HF) and overlying slab of neocortex were separated from the brainstem. A scalpel was used to separate the HF (Fig. 1A) and overlying neocortex (Fig. 1B) from the rest of the brain. Using a fine nylon brush placed into the lateral ventricle, the HF was rolled out from the overlying neocortex and severed at the subiculum. Both the HF and neocortex from each side were transferred to a net submerged in control aCSF gassed with 95% O2 – 5% CO2 at 22°C that was slowly warmed to 30°C over one hour prior to experimentation.
Figure 1.
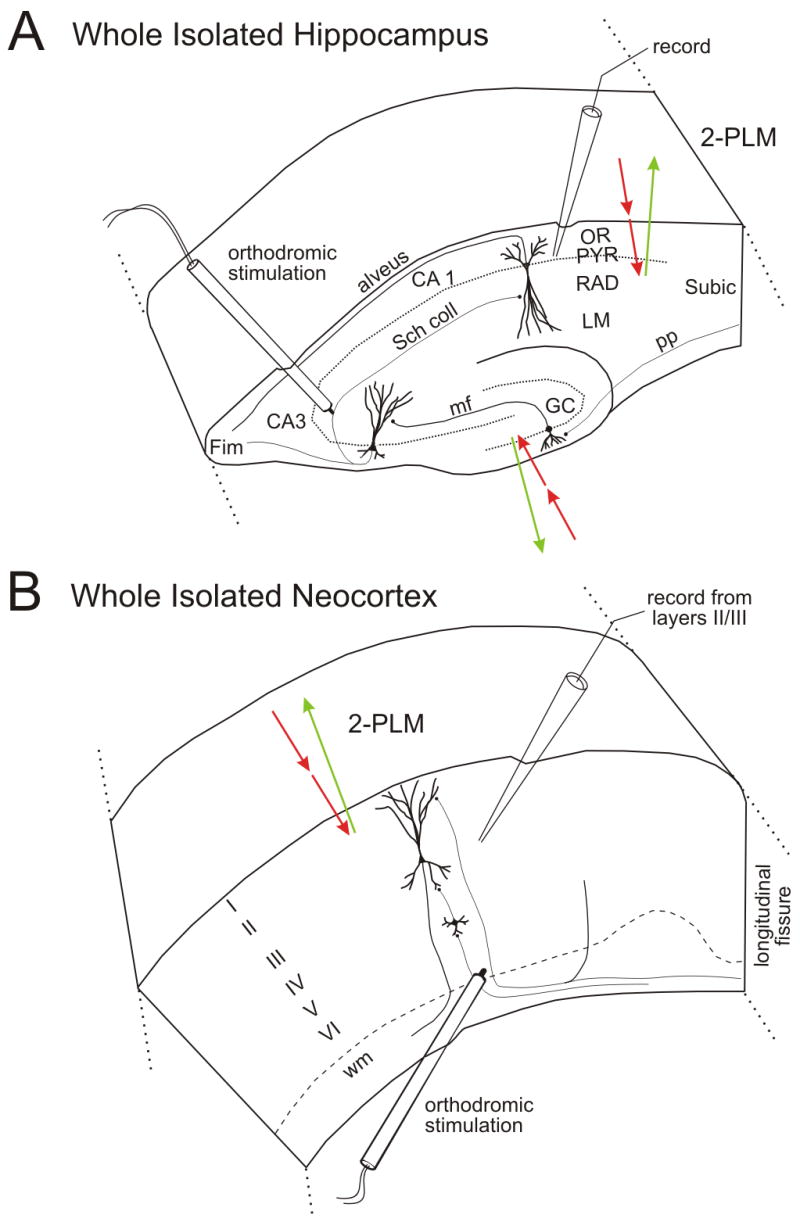
Electrode placement for evoked field potential and negative voltage shift recordings in the isolated whole hippocampus and neocortex. The red arrows represent the excitation light penetrating the tissue and the green arrow represents the emitted light. A: Hippocampus - The Schaffer collaterals were stimulated to record orthodromic field potentials in the CA1 pyramidal layer using a 5–10 MΩ micropipette. B: Neocortex - Evoked field potentials and negative shift was recorded using a micropipette placed in layers II/III while the neocortex received orthodromic stimulation in layer VI.
The control aCSF contained (in mM): 120 NaCl, 3.3 KCl, 26 NaHCO3, 1.3 MgSO4 7 H2O, 1.2 NaH2PO4, 11 glucose, and 1.8 CaCl2. These components were all dissolved in double-distilled water at pH 7.3–7.4. This was used as the incubation solution and throughout experiments as the control solution. For OGD aCSF, glucose was replaced with equiosmolar NaCl and the solution bubbled with 95% N2–5% CO2. For the high K+ aCSF, 26 mM KCl replaced equiosmolar NaCl. This was used to evoke spreading depression in the whole preparations.
2.2. Imaging change in light transmittance (ΔLT)
As the AD or SD front initiates and propagates in cortical slices, an increase in LT is observed at the front (Obeidat and Andrew, 1998; Jarvis et al., 1999). This increase in LT occurs because less light is scattered as cells swell (Cohen, 1973; Lipton, 1973; Andrew and MacVicar, 1994; Andrew et al. 1997). Within several minutes of the AD front passing, dendritic damage is imaged as a decrease in LT (Obeidat and Andrew, 1998) caused at least in part by the formation of dendritic beads that scatter visible and near-infrared light (Obeidat et al., 2000; Andrew et al., 2006). This LT decrease represents continued cell swelling that includes the formation of more and more dendritic beads which scatter light, overriding the initial LT increase.
To image LT changes, record electrophysiologically or image with 2PLSM, a whole preparation was transferred to a chamber and weighted down with silver wire at the edges or with a net bounded by an aluminum ring. The tissue was placed on the glass bottom of a 1 mL chamber and superfused with oxygenated aCSF flowing at 4 – 5 mL/min. (Note: The lack of aCSF perfusion beneath the preparation restricted the use of thicker, denser tissue from older animals. However it allowed us to optically image a large region of tissue without the obstruction of netting). Temperature was slowly increased from 30 – 35°C prior to experiments. For imaging LT changes, the preparation was illuminated using a broadband, voltage-regulated halogen light source mounted on an inverted light microscope (Fig. 2). The light travels through a band-pass filter transmitting near-infrared light (690–1,000 nm). A Cohu, Inc. (San Diego, CA) charge-coupled device (CCD) set at maximum gain and medium black level was used to acquire video frames. The frames recorded at 30 Hz were averaged and digitized with a frame grabber (DT 3155, Data Translation) in a Pentium computer controlled by Axon Imaging Workbench (AIW 2.2) software (Axon Instruments). An average of 128 frames was used to create each image of a series, which were saved to the hard drive. The first averaged image of the series was used as a control (Tcont). This was subtracted from each of the following experimental images (Texp), resulting in an image series that revealed the change in light transmittance over time. The LT change (ΔT) was expressed as the digital intensity of the subtracted images (Texp − Tcont). A pseudocolor intensity scale was used to display regional ΔT. The images were imported and figures were created and labeled using CorelDraw.
Figure 2.
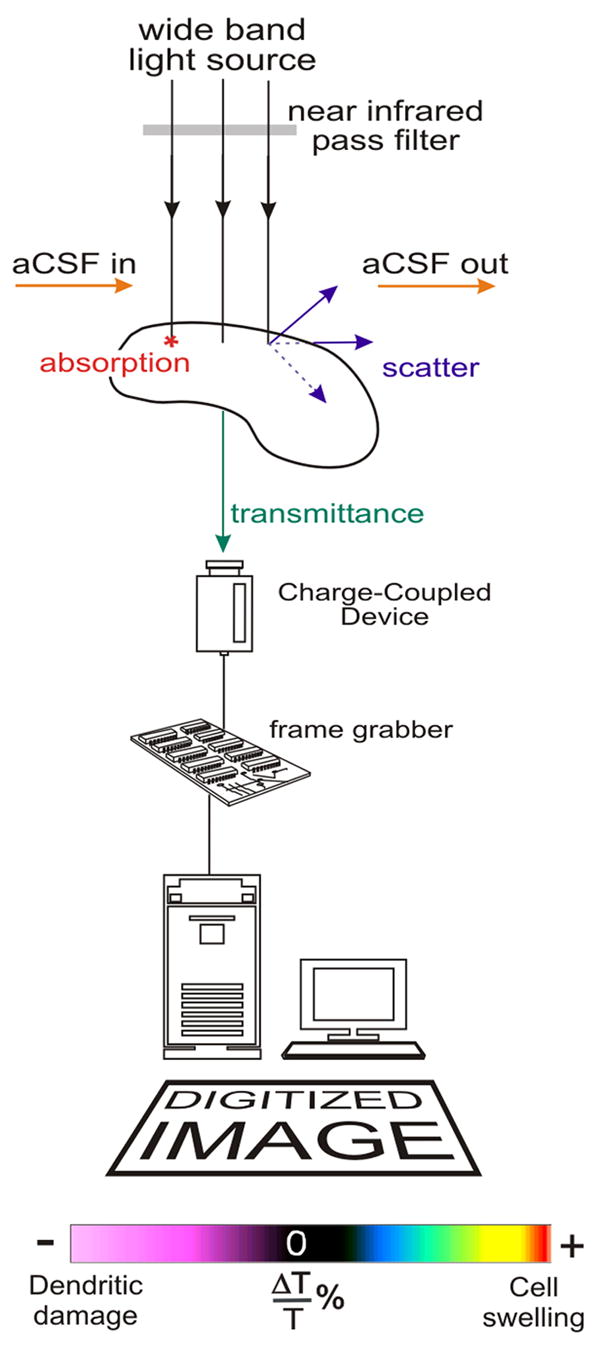
A schematic of the equipment used to image the change in light transmittance. It consists of a broadband voltage-regulated halogen light source filtered by a near-infrared pass filter. When the light reaches the tissue it is absorbed, scattered and transmitted. Transmitted light is collected and digitized with a charge-coupled device (CCD). After the image is digitized it is processed with a frame grabber board that is controlled by imaging software in a Pentium computer. (Image modified from Anderson and Andrew, 2002.)
2.3. Evoked field potentials and negative shift recordings
Evoked field potentials were recorded in both preparations to test for viability and to record the spontaneous negative voltage shift that is the electrophysiological signature of AD or SD (Somjen, 2001). A micropipette (~5 MΩ) was pulled from thin-walled capillary glass and filled with 2M NaCl. It was mounted on a three dimensional micromanipulator and connected to the amplifier probe by a chlorided silver wire. A 1 mV and 5 ms pulse was generated by a calibrator connected between the bath and the ground; the output monitored with an on-line oscilloscope. To record electrophysiologically from the whole hippocampal preparation (Fig. 1A), a concentric bipolar electrode (Rhodes Electronics) was used to stimulate the Schaffer collaterals with a current pulse (0.2 – 0.5 ms) and the resultant orthodromic field potential recorded in the CA1 pyramidal layer. Likewise the isolated neocortical ‘slab’ (Fig. 1B) was stimulated in layer VI and the field potential recorded in layers II/III. The evoked field potential responses were filtered at 1 kHz, digitized at 5 kHz, averaged (10 sweeps/trace), displayed, and plotted using pCLAMP software (Axon Instruments). Responses were also digitized using a NeuroData Instruments digitizer and recorded onto videocassette tape. A robust field potential demarcated a responsive site that would likely generate an abrupt negative voltage shift (representing the depolarization of many neurons) as the AD or SD front swept by the micropipette tip.
2.4. Imaging using 2-photon laser scanning microscopy (2PLSM)
With 2PLSM, simultaneous absorption of two long-wavelength photons excite a fluorophore to generate fluorescence that can be acquired from several hundred microns deep within living tissue. The penetrating depth of the long-wavelength photons is greater than the short-wavelength light used in single-photon excitation (Oheim et al., 2001). The intensity-squared requirement of two-photon excitation restricts fluorophore excitation and emission to a narrow plane exactly where the beam is focused. This reduces photodamage and photobleaching in thick living tissue, permitting repeated sampling (Konig et al., 1996; Potter et al., 1996; Periasamy, 1999). The intrinsic confocality of two-photon excitation results in thin optical sections that can be stacked to yield a 3-D image.
Both isolated whole hippocampus and neocortex preparations were obtained from 5–7 days old C57 black mice of the B6.Cg-TgN(thy1-GFP)MJrc strain. These mice have a small proportion of the pyramidal neuron population in hippocampus and neocortex as well as other projection neurons such as dentate granule cells that express green fluorescent protein (GFP) (Feng et al., 2000). Dendritic filopodia are abundant during this developmental period (Kirov et al., 2004a) and we did not discern between spines and filopodia in this study, so all dendrite protrusions are referred to as ‘‘dendritic spines”.
An imaging chamber was mounted on the fixed stage of an upright Axioscope II FS microscope (Carl Zeiss, Jena, Germany). In the HF, excitation light was directed through the alveus and down into the CA1 region in hippocampal gyrus or into the granule cell layer of the dentate gyrus (Fig. 1A). In the neocortical slab, excitation light penetrated the cortical surface, coursing into layers II/III (Fig. 1B). The Zeiss LSM 510 NLO META multiphoton system directly coupled with the Spectra-Physics (Mountain View, CA, USA) Mai-Tai Ti:Sapphire laser was used to image at an excitation wavelength of 870 nm. Emitted light was detected by an LSM 510 NLO scan module with the pinhole fully open. The Zeiss LSM 510 software controlled data acquisition. Utilizing the full width at half maximum of a point spread function measured with sub-resolution beads, the microscope resolution was calculated as 0.38 μm in the lateral dimension and 1.95 μm in the axial dimension. Neurons or their processes were first imaged in control aCSF and then during OGD for 10 minutes. Upon return to control aCSF, another series of images were obtained. For each treatment, a stack of optical sections was acquired at 0.5–1.0 μm increments using a 63×/0.9 NA water-immersion objective (Carl Zeiss).
3. Results
3.1. Evoked field potentials and the negative voltage shift
A robust neuronal population that fires action potentials simultaneously generates a large evoked population spike that demonstrates the health of a region within the preparation. Both the hippocampal and neocortical preparations yielded field potentials that were similar or larger in amplitude than those measured in respective slices. The CA1 pyramidal cell layer in the whole HF and in layers II/III of the neocortical ‘slab’ displayed average population spike amplitudes of 3.86 ± 0.16 mV (mean ± SE, n = 22) and 3.03 ± 0.12 mV (n = 18), respectively (Fig. 3A). A negative voltage shift denoting the onset of AD was recorded in both preparations within several minutes of exposure to OGD. The average amplitude of this shift in the HF was 4.60 ± 0.16 mV (mean ± SE) and in the neocortex was 6.37 ± 0.15 mV (Fig. 3B). In the HF and neocortical preparations, the negative shift onset latency was 11:03 ± 0:39 (min:sec ± SE, n = 16) and 4:52 ± 0:40 (n = 11) minutes following initial OGD exposure, respectively (Fig. 3C).
Figure 3.
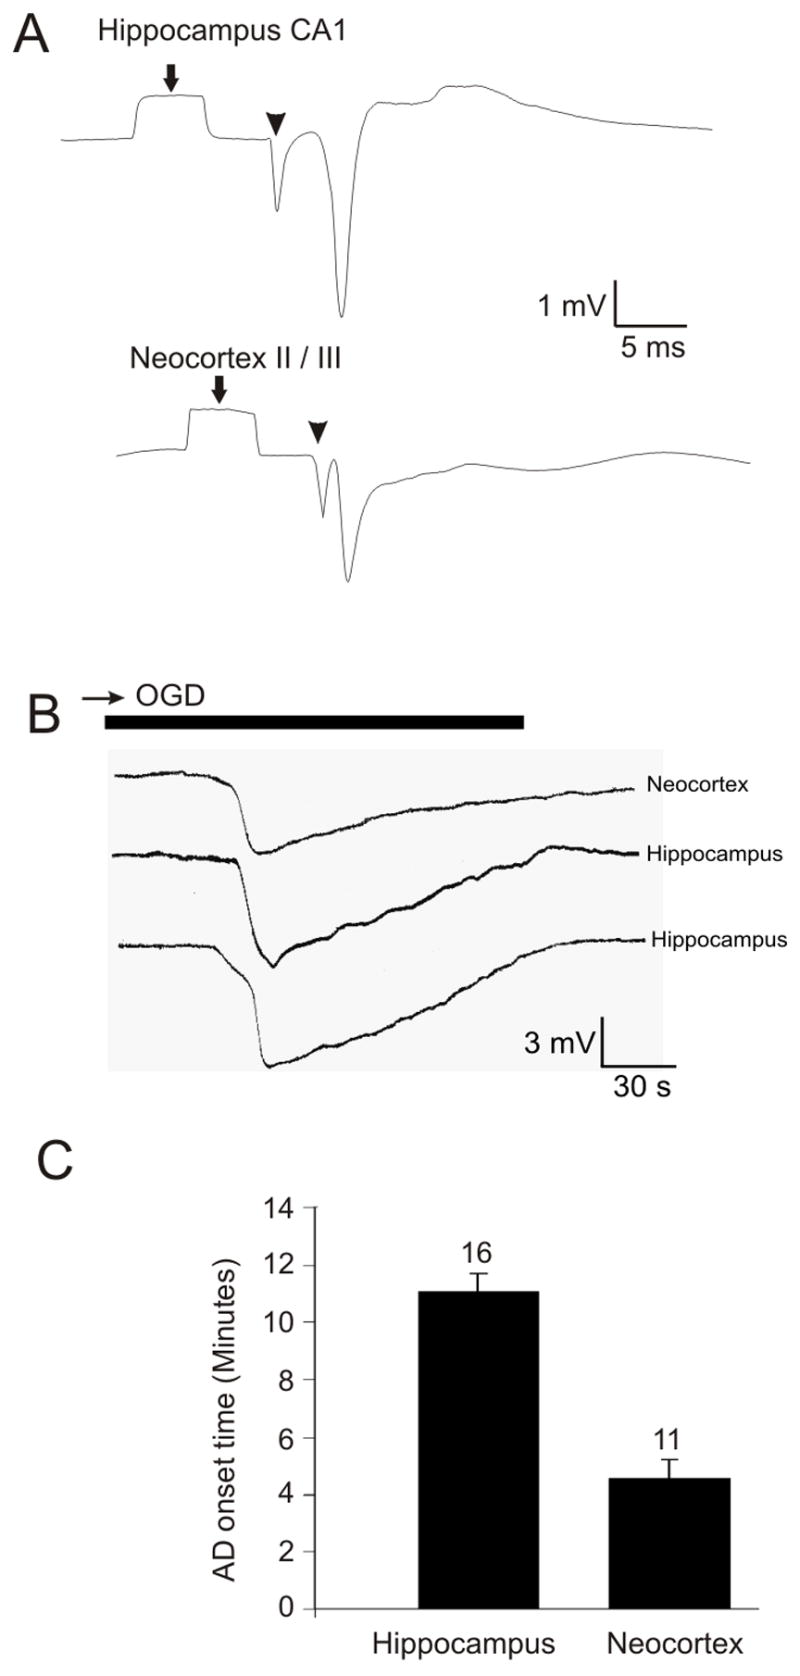
Electrophysiology data collected from isolated whole hippocampus and neocortex. A: Evoked field potential of hippocampal CA1 neurons and neocortical layer II/III neurons in the whole preparations. The preparations were superfused with aCSF at 35°C ± 1°C during electrophysiological experiments. Arrow indicates the calibration pulse and arrowhead indicates the stimulus artifact. B: During oxygen/glucose deprivation (OGD) a negative voltage shift was recorded as the anoxic depolarization (AD) front was moving past the recording electrode. AD was initiated within 10 minutes of OGD exposure at 35°C ± 1°C. C: The average AD onset time obtained from negative voltage shift recordings. AD was initiated in the isolated hippocampal and neocortical preparations at 11:03 ± 0:39 (min:sec ±SE) and 4:52 ± 0:40, respectively following exposure to OGD for 10 min.
3.2. Imaging anoxic depolarization and spreading depression events
Exposure to OGD for ~10 min in both the neocortical (Fig. 4) and hippocampal (Fig. 5A) preparations evoked a large focal increase in LT that continued as a propagating front across the gray matter at a rate of 2–3 mm/min. The increase in LT is represented by blue-green-yellow pseudocoloring. In the wake of this LT increase was an LT decrease that slowly developed during the ensuing 7–10 minutes, represented by the magenta on the pseudocolor scale.
Figure 4.
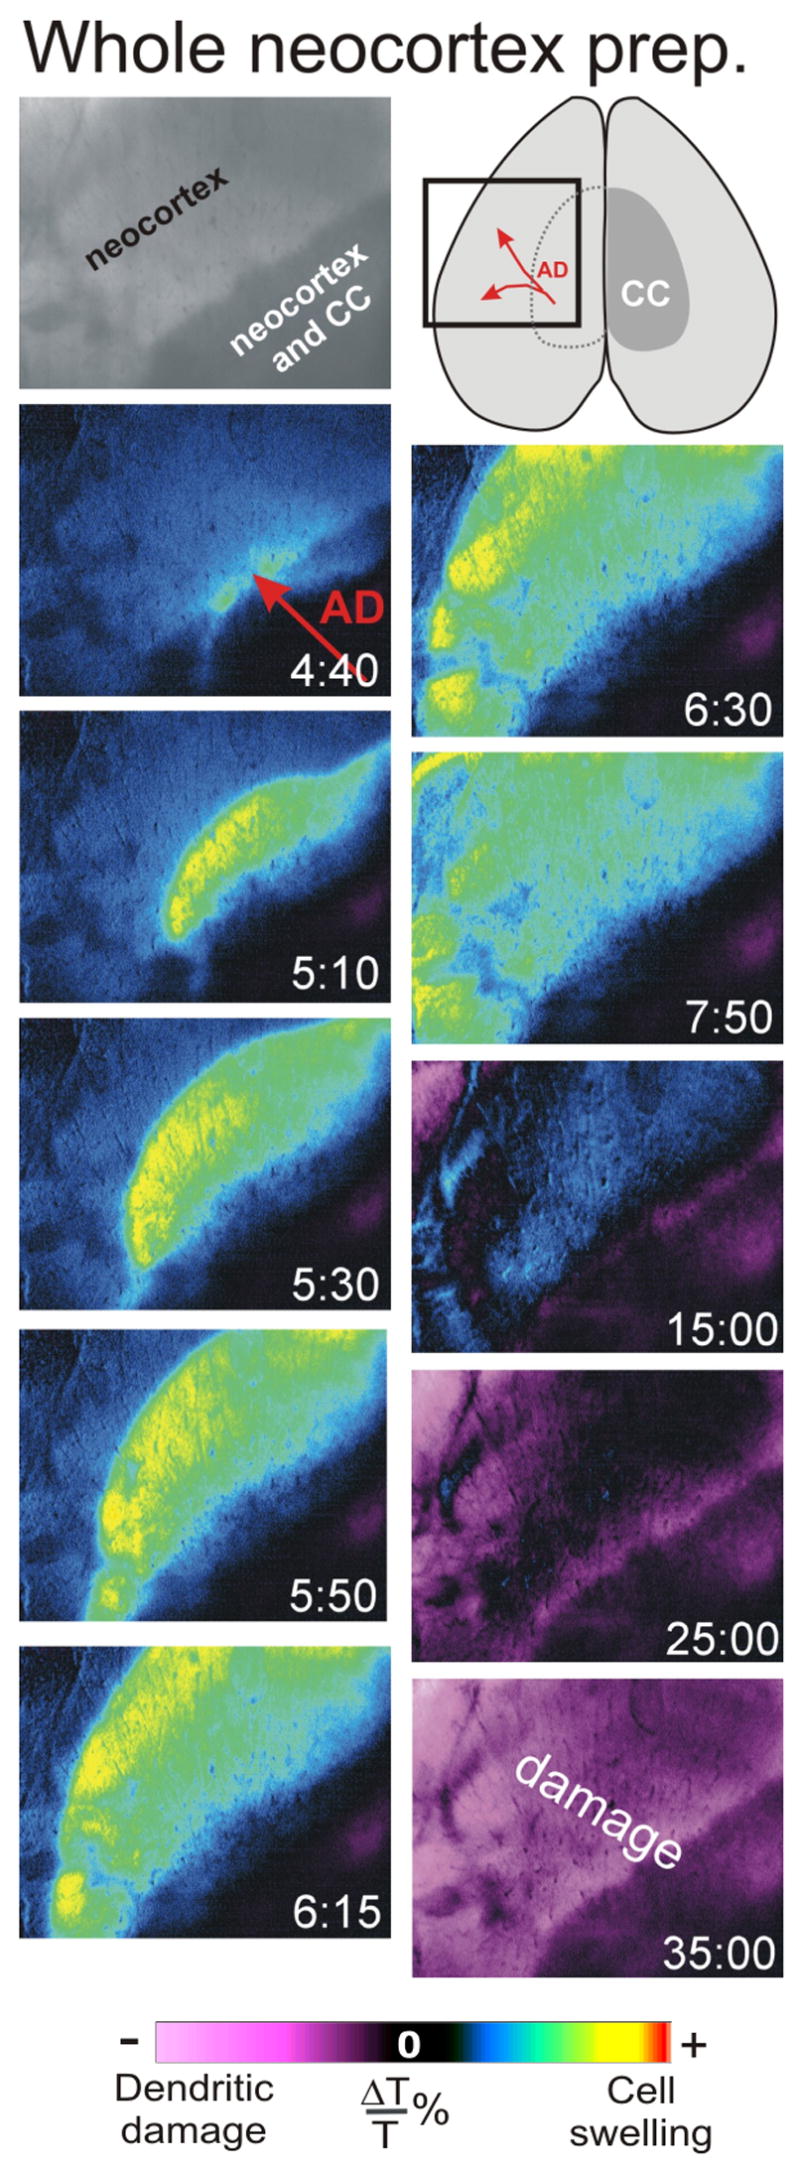
The AD front is imaged as a spreading region of elevated LT (blue/yellow pseudocoloring) that leaves a decrease LT (magenta pseudocoloring) in its wake. The AD front travels through the whole neocortical preparation after exposure to OGD at 35°C. The AD front initiates in the region overlying the corpus callosum (CC) medially. It then travels laterally to the periphery of the intact preparation.
Figure 5.
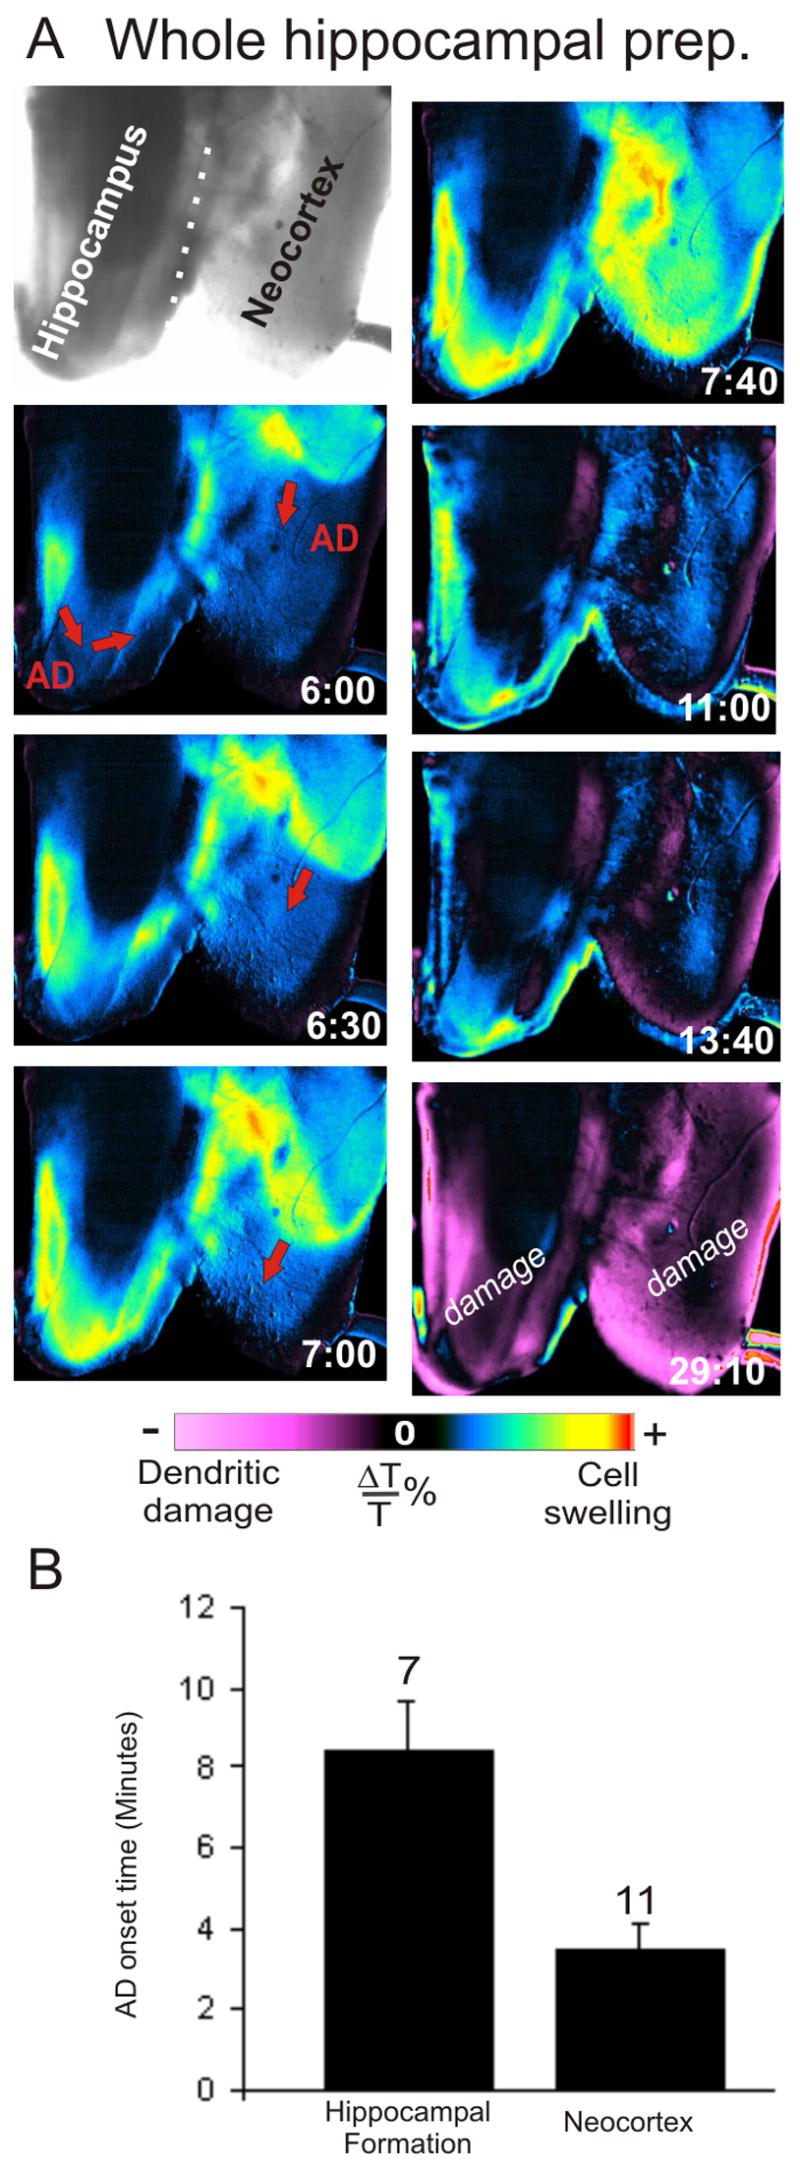
Anoxic depolarization initiated by OGD in the isolated whole hippocampus. A: The AD front travels through the whole hippocampal formation after OGD. AD is initiated in the neocortex, due to its increased sensitivity to ischemia, and travels into the hippocampal tissue. B: The average AD onset time obtained from imaging changes in light transmittance. AD was initiated when the isolated hippocampal and neocortical preparations were exposed to OGD for 8.4 ± 2.0 (min:sec ± SE, n = 7) and 3:42 ± 1:02 (n = 11), respectively.
In the HF, a front of elevated LT usually arose in the entorhinal cortex (probably because it had been cut during dissection) and spread into the CA1 region (Fig. 5A) at a rate of 2–3 mm/min, similar to the neocortical preparation. It then spread to CA3 where a faint wave could be observed traveling behind the main front, probably the result of co-propagation between the underlying dentate gyrus and overlying CA3 region. The co-propagation traveled from CA1 to CA3 and then usually traveled back along the upper and lower dentate gyrus in the opposite direction.
In the neocortex an OGD-induced LT front usually initiated near the midline of the overlying corpus callosum and spread outward toward the edge of the gray matter (Fig. 4). The opacity of the thicker midline cortex and white matter made LT changes difficult to image in that region. The average onset time for the front to initiate in the whole hippocampal preparation was 8:29 ± 1:36 (min:sec ± SE, n = 7) during OGD exposure, while in the neocortical slab it was 3:42 ± 0:42 (n = 11) (Fig. 5B). Based on similar propagation and onset times as well as similar LT changes observed in brain slices, these events are considered to represent AD propagation.
Exposure to 26 mM KCl aCSF also initiated a front of elevated LT that traveled across the gray matter in the neocortical slab at a rate of ~1.8 mm/min which was within the 1.5 – 7.5 mm/min range measured in coronal slices (Fig. 6). After the front subsided, LT returned to near baseline over the next 15 minutes while the preparation was again superfused with control aCSF. Once ΔLT had returned to baseline, 26 mM KCl aCSF was added again, initiating a similar propagating front starting from the same region and traveling in the same direction at comparable speed. The first event onset time was 3:21 ± 0:12 (min:sec ± SE, n = 23) upon exposure to 26 mM KCl aCSF while the second was earlier at 2:21 ± 0:15 (n = 14).
Figure 6.
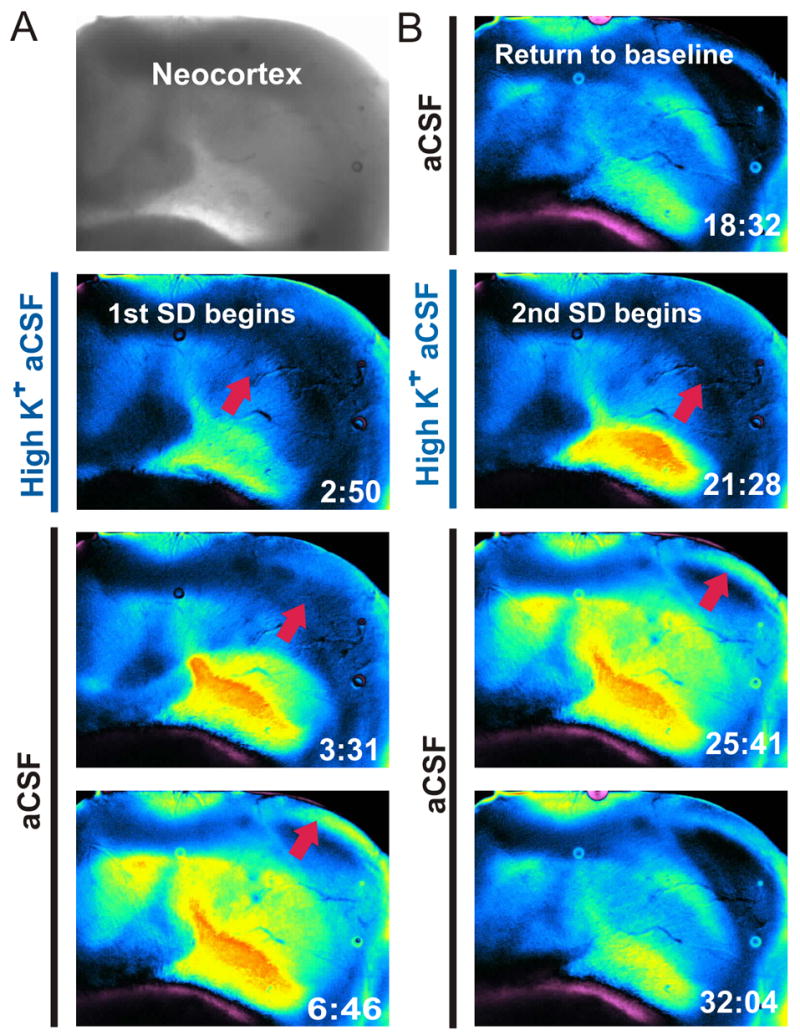
Spreading depression (SD) initiated with 26 mM KCl at 35°C ± 1°C in the isolated whole neocortex. A: The SD front does not leave damage in its wake and the spreading front can recur in the same tissue if it remains healthy. The change in light transmittance recording revealed the SD front moved across the isolated whole neocortex upon second KCl exposure. The magenta color seen in some of these images is not damage; however, is due to preparation floating in the aCSF. B: Once the SD front began the superfuse was switched back to aCSF. The SD front is imaged as a spreading region of elevated light transmittance (LT) (blue/yellow pseudocoloring) and later returns to baseline. The second SD is initiated the same way and is identical to the first. The front travels at 1.8 mm/min.
This spreading event imaged in the whole neocortex differs from the AD-like event in three ways. First, it was induced with elevated K+, not OGD. Second, whereas the increase in LT caused by the AD-like event was followed by a dramatic decrease in LT, this front was followed by a return of LT to near baseline. Third, whereas the AD-like event could only be induced once, this event could be induced more than once. All three properties are characteristic of SD, a mass depolarization of neurons and glia that has been recorded in vivo and in brain slices. As reported in brain slices, light scattering by dendritic beading (a more extreme form of neuronal swelling) appeared minimal in response to SD, unlike AD.
3.3. Two-photon laser scanning microscopy (2PLSM)
As revealed by 2PLSM of the whole hippocampus in these young animals, pyramidal neurons expressing GFP were sparsely distributed compared to the large proportion of GFP-positive granule cells in the dentate gyrus. Granule cell bodies were imaged ~100 μm deep to the ventral surface of the dentate gyrus. The cell bodies extended spiny dendrites into the molecular layer (Fig. 7A, ML). From a few cell bodies, an axon could be imaged extending orthogonal to the dendritic arbor (Fig. 7A, B, arrows).
Figure 7.
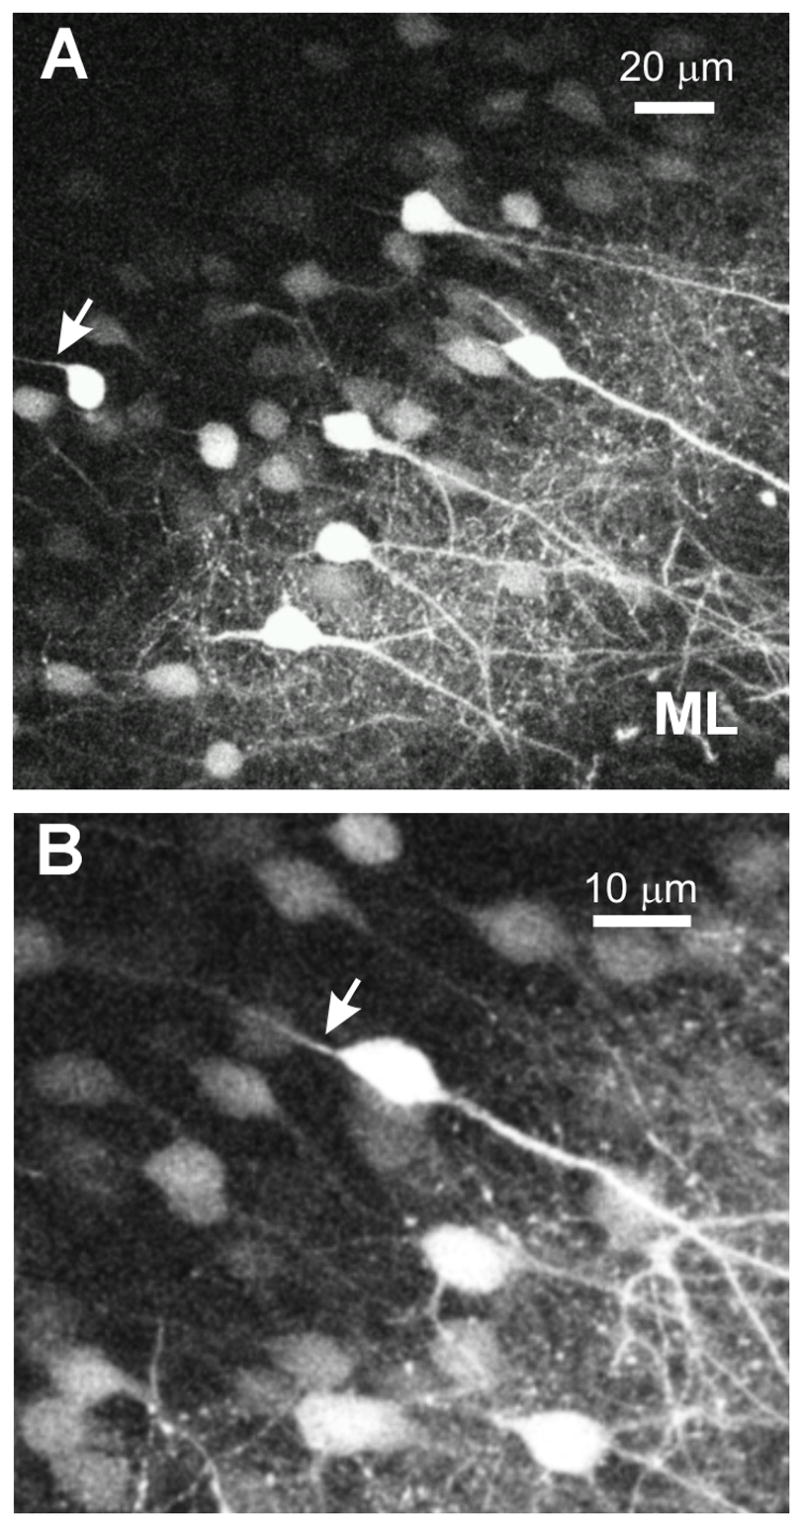
Dentate gyrus of the whole HF imaged with 2PLSM A: Granule cell layer and molecular layer of the dentate gyrus in the intact hippocampus. The dendrites of the granule cells are extending from the cell body through the molecular layer and out towards the surface. The arrow indicates an axon extending out of a granule cell body traveling away from the surface. B: A higher magnification image of granule cells in the dentate gyrus. The arrow indicates the axon exiting the cell body. The dendrites are extending from the other side of the soma and are traveling to the surface of the hippocampus.
The alveus is the efferent path of CA1 pyramidal cell axons coursing over the dorsal hippocampal surface just beneath the ependymal lining of the lateral ventricle (Fig. 1A). Thus during optical sectioning of the HF, the alveus was the first structure encountered at the dorsal surface (Fig. 8, 10A). Alvear axons were of 0.4 to 0.9 μm in diameter and were of uniform caliber with no varicosities, indicating no damage to the surface of the preparation. Immediately below the alveus, 2PLSM optical sectioning in the stratum oriens revealed the basal dendrites of CA1 neurons (Fig. 8B, 10A). Images taken at deeper optical planes confirmed that these were basal dendrites originating from CA1 somata in stratum pyramidal (Figs. 1A; 10B). These secondary dendrites were 0.5 to 1.5 μm in diameter with numerous protrusions emerging from dendrites that were filopodia-like in appearance (Kirov et al., 2004a). Also, the dendrites in 6–7 day old rats displayed normal 0.5–1.0 μm varicosities that become less frequent with age. In the current study, the lack of any apparent dendritic beading (that is, punctate swellings of 1 to 3 μm diameter) indicated that the tissue was metabolically healthy. Fine caliber axon collaterals with varicosities (Fig. 8B, Ax) representing presynaptic terminals emerged at 90 degrees from the alveus and intermingled with the CA1 dendrites.
Figure 8.
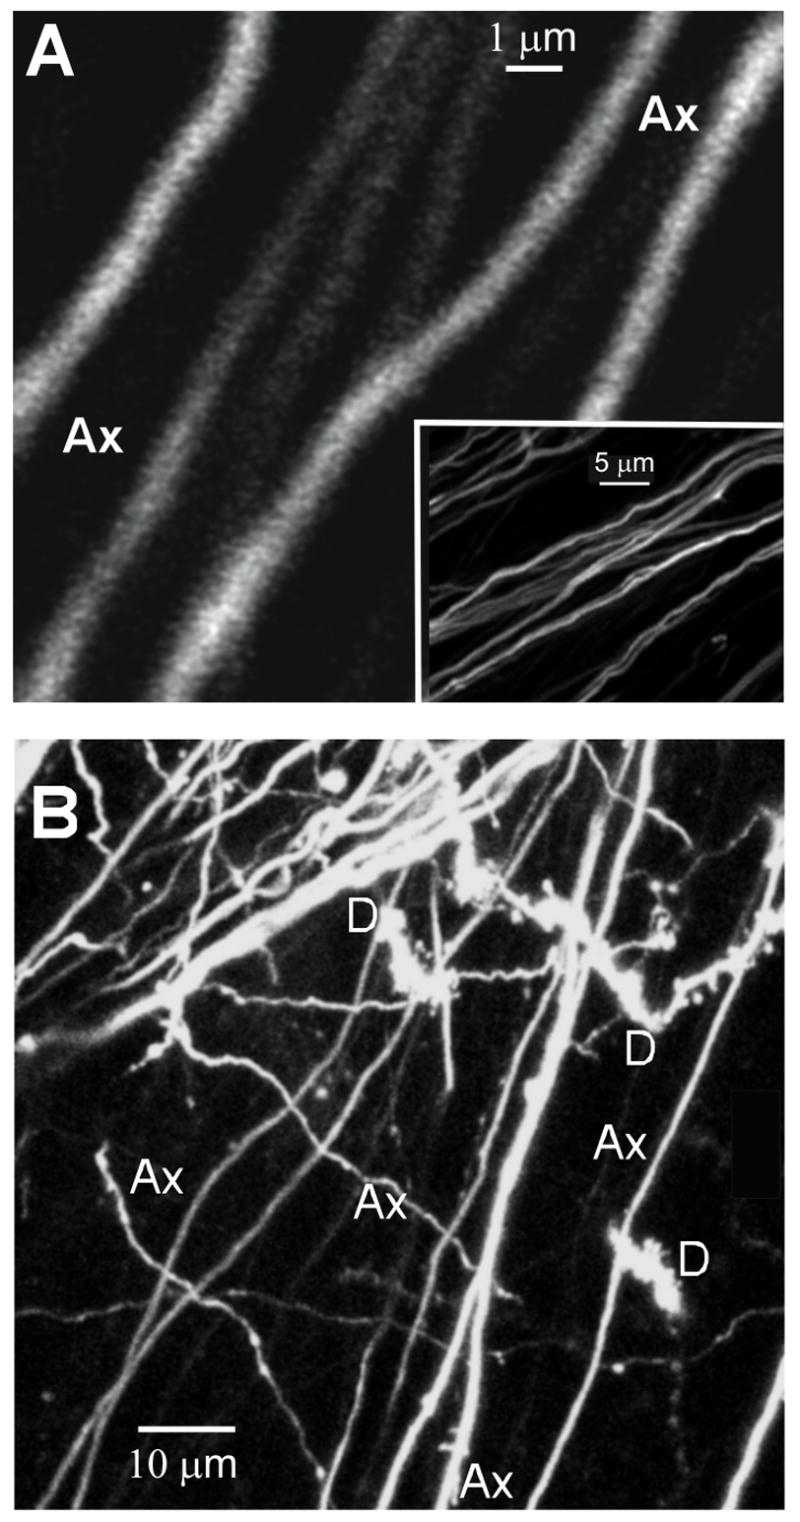
2PLSM images of the alveus at the surface of the HF. A: A high magnification image of alvear axons. Inset: A low magnification image of the same axons. B: This image reveals axons (Ax) and basal dendrites (D) at the surface of the whole hippocampal preparation. The dendrites have some spines and filopodia and lack dendritic beads of 1–3 μm, confirming that the surface of the preparation is undamaged.
Figure 10.
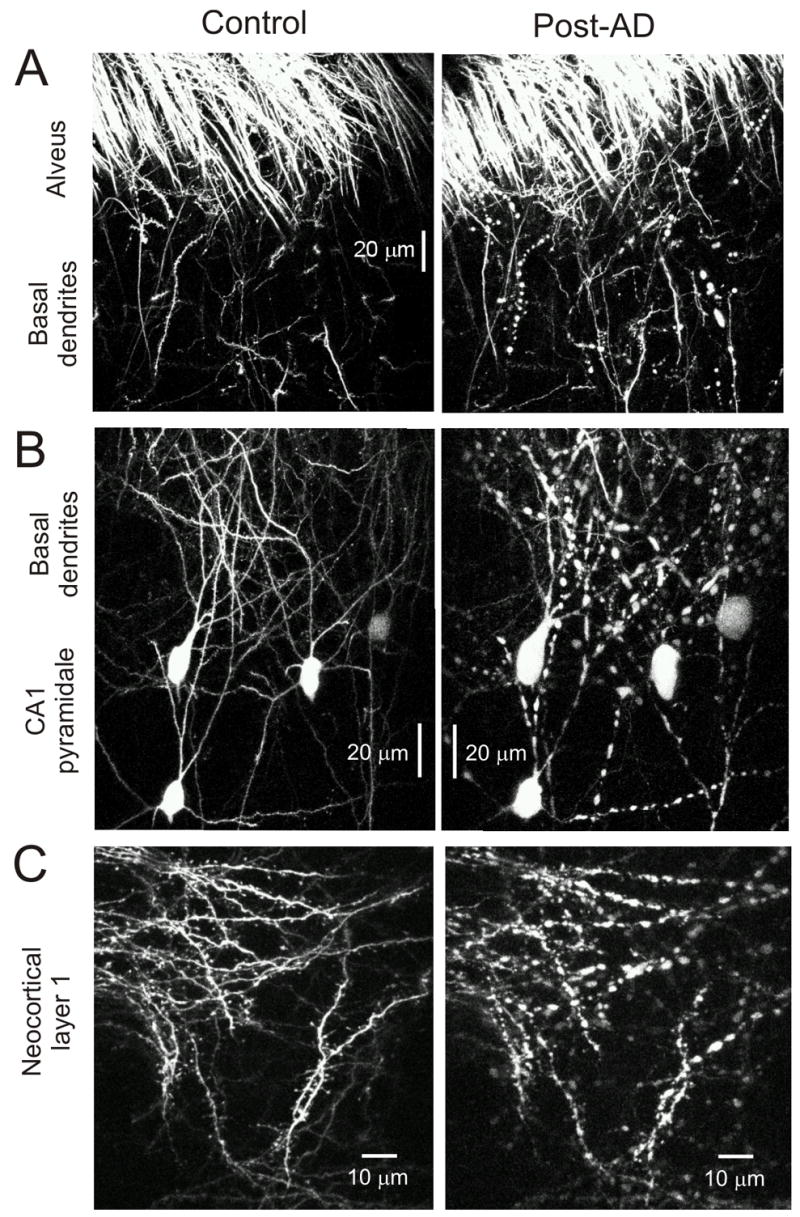
Surface of the whole preparations and CA1 cell bodies imaged with 2PLSM before and after OGD. The images of the neurons before and after OGD are from same field in the same preparation. A: These 2PLSM images are recorded from the surface of the hippocampal preparation. Undamaged dendrites and axons are observed among the CA1 dendrites just beneath the alveus. Post-OGD the dendrites become damaged as indicated by the large dendritic beads of 1–5μm diameter. The alveus and other en passant axons remain undamaged (i.e. no beading). B: The CA1 cell bodies and basal dendrites imaged by 2PLSM. Before exposure the cell bodies are pyramidal in shape and their boundaries are clearly demarcated. The dendrites are undamaged with numerous dendritic spines and filopodia. Post-OGD the cell bodies become swollen and lose their distinct pyramidal shape. The dendrites become beaded and the interbead segments become almost invisible due to shrinkage in these regions. C: These images are recorded from the surface of the whole neocortical preparation. Once again the dendrites are undamaged before treatment with OGD and after OGD the dendrites become beaded confirming acute damage to the dendritic tree of the neocortical neurons.
In contrast to the surface of the whole preparations, 2PLSM optical sectioning revealed that the sectioned face of a typical brain slice displayed considerable damage with injured processes in the exterior 45 μm of the gray matter (Fig. 9A). The few dendrites that were beaded as deep as 75 μm invariably could be traced back up to cell bodies either near to or severed at the slice surface. At >95 μm (Fig. 9B) there was no trace of injured dendrites; all dendrites displayed healthy looking dendrites and spines.
Figure 9.
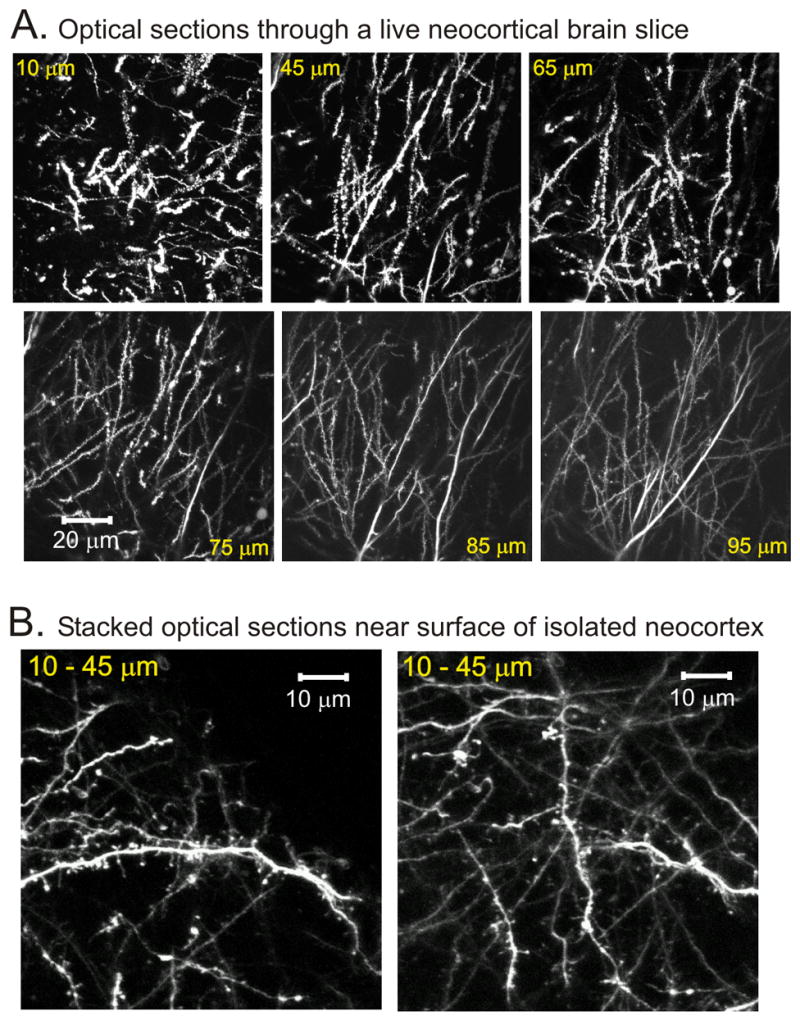
Brain slice of adult animal displays surface damage not seen in whole preparations. A: A series of 2PLSM images recorded from an adult brain slice. The number is the tissue depth from the cut slice surface where the optical section was imaged. The damage at the sliced surface is substantial based on the severe dendritic beading, but injury is minimal at a depth of 65–75 μm. B: 2PLSM images of the surface of the whole neocortical preparation. The presence of numerous dendritic spines and filopodia and the absence of large dendritic beads on apical dendrites even at shallow depths of 10–45 μm confirm that the surface of the whole neocortical preparation is undamaged.
Two-photon images of the neocortical slab were taken at the surface (Fig. 1B) with subsequent shifting the focal plane down into the tissue to create a maximum intensity projection image of apical dendrites (Figs. 9B, 10C). In contrast to cut brain slice surfaces (described above), the first 10–45 μm of the intact superficial neocortex appeared pristine. In each of three neocortical slabs, surface dendrites maintained spines and filopodia along their length and displayed no beading. Pyramidal neurons of neocortex layers II/II and V possessed their complete dendritic tree with one or two long apical dendrites leaving the cell body to reach the neocortical surface. Once near the surface the dendrites branched to form apical tufts that spread out beneath the pia (Fig. 10C). Dendritic profiles could be imaged to a maximum depth of 400 μm.
In the fifteen minutes following OGD exposure the morphology of the pyramidal neurons changed dramatically in both whole preparations. This was immediately after the AD propagated across the gray matter of either preparation as imaged by ΔLT experiments described above. Imaging with 2PLSM after OGD exposure revealed that the entire preparation expanded in volume by about 10% based on the increased number of optical sections required to capture a discrete volume of dendritic arbor as demarcated by specific landmarks._Simulating ischemia for 10 minutes altered all regions of the pyramidal cell except for the alveus.
Fifteen minutes post-OGD, there were no swelling or irregularities along the axons of the alveus. In contrast, OGD exposure caused the dendrites of the CA1 and the neocortical pyramidal neurons to develop beads along their length and all dendritic protrusions disappeared (Fig. 10). Often regions between the beads were not visible as a result of dendritic constriction in these_areas. The cell bodies of the CA1 pyramidal neurons became swollen and deformed (Fig. 10B). All of these morphological changes induced by AD were largely irreversible when the preparations were re-superfused with oxygenated aCSF with glucose.
Imaging the CA1 neurons ‘from above’, that is, looking into the pyramidal layer from the alvear surface during 2PLSM experiments (Fig. 1) meant that their characteristic pyramidal shape was not apparent from the x-y co-ordinates. In order to confirm this, we also examined optical stacks in x-z direction. For example, the neuron in Figure 11A is clearly pyramidal in shape with basal dendrites extending into the stratum oriens when viewed in the x-z plain. Note the swollen and beaded morphology after 10 minutes of OGD (Fig. 11C, D).
Figure 11.
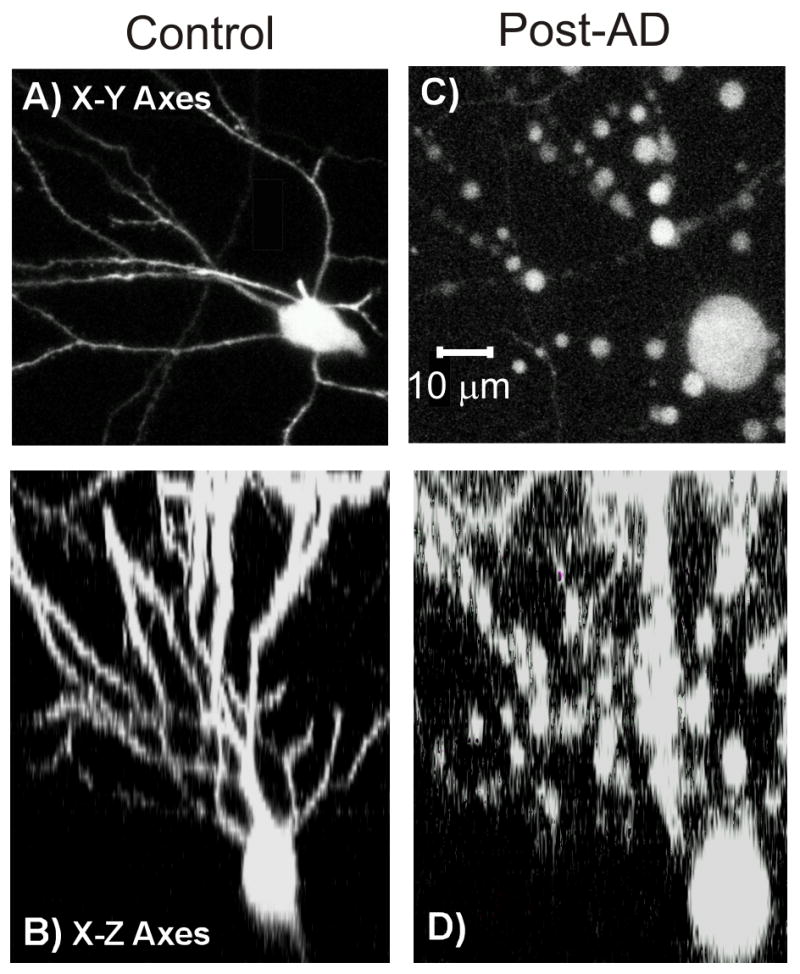
Confirmation that pyramidal CA1 neurons are the cells imaged beneath the alveus. A: An optical stack in the x-y direction of a pyramidal CA1 neuron. Before OGD the neuron is undamaged. However after OGD, the neuron is clearly damaged as indicated by the large dendritic beads of 1–5 μm diameter. B: An optical stack in the x-z direction of a pyramidal CA1 neuron. Viewing this neuron in x-y and x-z directions confirm its pyramidal shape. The dendritic beading post-OGD is also apparent in this view.
4. Discussion
Several isolated whole preparations have been developed to combine the accessibility of brain slices with the functionality of the intact brain. The isolated spinal cord from the newborn rat facilitated electrophysiological, pharmacological or developmental studies of the spinal cord (Otsuka and Konishi, 1974). Fulton (1986) examined populations of motoneurons through extracellular recording of ventral root reflexes and ventral horn field potentials. Bourque and Renaud (1983, 1984) developed a whole perfused hypothalamus from rat to study endocrine neurons in the supraoptic nucleus whose axons could be backfired from the posterior pituitary. Also the retina-lateral geniculate nucleus (LGN) preparation from the mouse pup (Mooney et al., 1996) was used to confirm that LGN neurons receive periodic postsynaptic inputs from the retina and fired highly correlated bursts of action potentials in response to this input without general anesthetics. Llinás and Mühlethaler (1988) established an isolated whole brain preparation from guinea pig that was perfused through the vertebral arteries. Federico et al. 1994 used it to image changes in light reflectance as cortical regions depolarized. It offered the advantage of imaging a large blood-free cortical region and allowed access to regions that could not be reached in situ.
Khalilov et al. 1997 developed an intact hippocampal formation (IHF) preparation from newborn rat that remained viable for up to ten hours. The morphological preservation was much improved from age-matched slices. It has been variously used to examine the formation of epileptogenic circuits in developing hippocampus (Khalilov et al., 2003, 2005; Abdelmalik et al., 2005), the activation of GABA-A receptors and NMDA induced long-term depression (LTD) (Pavlov et al., 2004), the embryonic expression of AMPA receptor function in the CA1 region (Diabira et al., 1999), the number of functional synapses after activity blockade (Lauri et al., 2003), the CA1-CA3 network activity and the contributions of AMPA and GABA-A receptors (Lamsa et al., 2000). The IHF was modified to include the entorhinal cortex and some neocortex in certain experiments (Luhmann et al., 2000; Quillichini et al., 2002). This is similar to our isolated HF in the current study. Our cortical slab is newly described; our LT studies required translucent (i.e. young) neocortical tissue superfused on a glass base at a moderate rate to maintain stability.
4.1. Electrophysiological experiments
Our isolated HF and neocortical preparations remained healthy as demonstrated by the maintenance of evoked extracellular field recordings during several hours of aCSF superfusion. Evoked population spikes in both preparations were steady and large-amplitude. The isolated HF yielded a response ~1 mV larger in mean amplitude than the whole neocortical preparation because the more stratified dendritic and cell body layers yield more focal current sources and sinks than neocortex (Varona et al., 2000). The fact that an orthodromic field potential could be evoked from the base of the neocortical slab and recorded ~100 μm from the upper surface in layersII/III, indicates that the intervening synapses in the slab interior were functional. Synaptic transmission is highly sensitive to anoxia in cortical slices (Anderson et al., 2005).
A sudden local depolarization of neurons and glia propagating through gray matter in vivo and in brain slices is represented by a negative shift of several millivolts lasting a minute or more (Somjen, 2001). In the current study the migrating event recorded following simulated stroke was AD (Jarvis et al. 2001). Within 10 minutes of exposure to OGD, the AD front moving past the recording electrode in both whole preparations was indistinguishable from those recorded in comparable brain slices from our laboratory (Joshi and Andrew, 2001).
4.2. Imaging change in light transmittance during AD
Propagating depolarizing events during metabolic compromise have been well characterized by imaging changes optical changes in cortical brain slices (Jarvis et al., 2001; Anderson et al., 2005) A moving front of elevated LT corresponds to the AD, followed over several minutes by a decrease in LT that represents neuronal damage (Andrew et al., 2007). This LT decrease actually represents continued cell swelling that includes the formation of more and more dendritic beads which scatter light, overriding the initial LT increase. This same LT sequence was imaged in both the whole hippocampal and whole neocortical preparations. We found that the isolated HF has a later AD onset time than the neocortical slab following exposure to OGD as also observed in both brain slices of rat (Jarvis et al., 2001) and mouse (Joshi and Andrew, 2001). This consistent difference suggests that the neocortex is generally more sensitive to AD. The AD onset time obtained from imaging changes in LT differed somewhat from that recorded as the negative voltage shift. One reason is that the negative shift onset time depends on precisely where the AD initiates and where its onset is first recorded. An initiation site distant to the recording electrode means a longer transit time for the front to reach the recording electrode. With the LT imaging, AD initiation is immediately discerned because the majority of the preparation is in the field of view.
When anoxic depolarization moves through gray matter, an important indicator of acute damage is dendritic beading caused by formation of dilations along the dendrite within a minute or so of AD passage (Obeidat et al., 2000). These beads are of a size (1–5 μm diameter) that is optically ideal for scattering light (Malm, 2000) thereby contributing to the decreased light transmittance following AD. Dendritic spine loss and beading have been recently imaged with 2PLSM immediately following AD in live brain slices (Andrew et al., 2007) and in vivo (Zhang and Murphy, 2007) so we used this approach in our whole preparations undergoing AD and SD.
4.3. Imaging change in light transmittance during spreading depression
In brain slices, as in vivo, SD is a wave of neural and glial depolarization moving through the tissue (Somjen, 2001) and has been recently imaged in vivo (Chuquet et al., 2007; Takano et al., 2007). SD has two defining characteristics distinct from anoxic depolarization as seen both in vivo and in slices. First, SD does not leave any damage in its wake because it moves through metabolically uncompromised tissue. Second as a result, multiple SD events can be induced in the same gray matter region (Nedergaard and Hansen, 1988; Takano et al., 2007; Somjen, 2001; Anderson and Andrew, 2002). Similarly in our whole neocortical preparation, imaging ΔLT during 26 mM KCl exposure revealed a front of elevated LT that returned to baseline in normal aCSF. KCl could once again be superfused and the same change in LT representing SD can be observed. As in brain slices (Anderson and Andrew, 2002) we show that the isolated neocortical preparation can undergo more than one SD event. This indicates that SD does not damage the tissue to the extent that it cannot recur. Each of the multiple SD events in the neocortical slab displays the same characteristics i.e., the front moves at similar speeds (~1.8 mm/min) in the same direction and initiates in the same tissue region. The lack of significant metabolic compromise following SD means that no long-term injury ensues.
4.4 Two-photon microscopy imaging of the isolated preparations
2PLSM images of GFP pyramidal neuronal cell bodies, their dendrites, their proximal axons coursing into the alveus and the alveus itself confirmed that the dorsal HF was not damaged during dissection and incubation. Likewise there was no damage to granule cell dendrites at the ventral HF surface whereas brain slices display injured dendrites extending from the cut surface as deep as 65–75 μm. This is in agreement with our previous findings from electron microscopy analyses demonstrating an optimal neuropil preservation between 100–200 μm from the cut surface (Kirov et al., 1999). Images taken at the dorsal surface of the HF show details of the alveus overlying the CA1 region. The GFP signal from the alveus is high because first, it is at the surface of the preparation and second, it contains many positive axons. At the ventral surface of the HF, the granule cell dendrites of the molecular area are undamaged and healthy, showing no sign of beading. The granule cell bodies of the lower blade are only 20–30 μm from the surface and so are also clearly defined. 2PLSM images of dendrites located at the surface of the neocortical slab show apical dendrites of uniform caliber with numerous dendritic spines. Likewise located just below the alveus are basal dendrites, complete with some spines, extending from the CA1 region. These spines are the primary location for excitatory glutamatergic synapses (Gray, 1959; Sorra and Kater, 1994) and their obliteration during beading follows loss of the evoked field potential in the CA1 region (Obediat et al., 2000) and in neocortical layers II/III (Andrew et al., 2007) immediately following AD. As noted above, it is clear that AD is generated in both the isolated hippocampal and neocortical preparations exposed to OGD. As they undergo AD, somata become swollen and dendritic beads form as spines are lost. The pearl necklace appearance is associated with damage in fixed brain slices (Polischuk et al., 1998; Obeidat et al., 2000) as well as live brain slices (Andrew et al., 2007).
Imaging of the same field 2PLSM allows for a direct comparison between the neurons before and after exposure to OGD. These images reveal that the alveus is the only area in the whole preparations that was not affected by OGD. Dendritic beading occurs in gray matter when the tissue is exposed to OGD; however the alvear axons have a normal appearance with no apparent damage following OGD. This apparent resistance to OGD may be because white matter does not support AD even though the originating cell bodies of the axons do. On the other hand, the pre-terminal axons and axon terminals imaged in cerebellar gray matter do display distinct swelling and dilations post-OGD (Andrew et al., 2007). Loss of spines during dendritic beading is not necessarily permanent and spines can re-form with high structural fidelity when tissue is not severely metabolically compromised in slices (Kirov et al., 2004) and in vivo following reperfusion (Zhang et al., 2005). This implies that while the post-synaptic membrane is grossly deformed, it retains its pre-synaptic connections. This needs to be confirmed ultrastructurally.
To summarize, our study shows that the isolated whole neocortex and hippocampal formation are useful in vivo experimental models. There are advantages to using isolated whole preparations over other models, including maintaining local input and output pathways. Imaging GFP-pyramidal neurons using 2PLSM confirms that these preparations do not have the damaged surfaces observed in live brain slices. They share many experimental advantages with brain slices such as remaining viable during aCSF superfusion, lack of cardiac or respiratory movement, maintenance of important neuron-glia interactions and retained glia-glia electrical/metabolic coupling. The study of spreading cortical events such as AD and SD can be carried out in both whole preparations comparable to those in brain slices while fully retaining three-dimensional structure. Moreover, the current study confirms that the same acute neuronal damage observed in slice preparations are generated in our whole preparations from young animals in real time, supporting the proposition that these events occur in vivo.
Acknowledgments
The founding mice of our GFP transgenic colony were a generous gift from Dr. Joshua Sanes, Harvard University. This work was funded by the Heart and Stroke Foundation of Ontario #T-4478 (RDA), the Canadian Institutes of Health Research #MOP 69044 (RDA) and the National Institutes of Health # NS057113 and #MH2000 (SAK). Conflict of Interest: None declared.
Footnotes
Publisher's Disclaimer: This is a PDF file of an unedited manuscript that has been accepted for publication. As a service to our customers we are providing this early version of the manuscript. The manuscript will undergo copyediting, typesetting, and review of the resulting proof before it is published in its final citable form. Please note that during the production process errors may be discovered which could affect the content, and all legal disclaimers that apply to the journal pertain.
References
- Abdelmalik PA, Burnham WM, Carlen PL. Increased seizure susceptibility of the hippocampus compared with the neocortex of the immature mouse brain in vitro. Epilepsia. 2005;46:356–366. doi: 10.1111/j.0013-9580.2005.34204.x. [DOI] [PubMed] [Google Scholar]
- Anderson TR, Andrew RD. Spreading depression: imaging and blockade in the rat neocortical brain slice. J Neurophysiol. 2002;88:2713–2725. doi: 10.1152/jn.00321.2002. [DOI] [PubMed] [Google Scholar]
- Anderson SA, Classey JD, Conde F, Lund JS, Lewis DA. Synchronous development of pyramidal neuron dendritic spines and parvalbumin-immunoreactive chandelier neuron axon terminals in layer III of monkey prefrontal cortex. Neurosci. 1995;67:7–22. doi: 10.1016/0306-4522(95)00051-j. [DOI] [PubMed] [Google Scholar]
- Anderson TR, Jarvis CR, Biedermann AJ, Molnar C, Andrew RD. Blocking the anoxic depolarization protects without functional compromise following simulated stroke in cortical brain slices. J Neurophysiol. 2005;93:963–979. doi: 10.1152/jn.00654.2004. [DOI] [PubMed] [Google Scholar]
- Andrew RD, Anderson TR, Biedermann AJ, Joshi I, Jarvis CR. Imaging the anoxic depolarization, a multifocal and propagating event. In: Krieglstein J, Klumpp S, editors. Pharmacology of Cerebral Ischemia 2000. Medpharm Scientific Publishers; Stuttgart: 2000. pp. 75–94. [Google Scholar]
- Andrew RD, Labron MW, Boehnke SE, Carnduff L, Kirov SA. Physiological evidence that pyramidal neurons lack functional water channels. Cerebral Cortex. 2007;17:787–802. doi: 10.1093/cercor/bhk032. [DOI] [PubMed] [Google Scholar]
- Andrew RD, Jarvis CR, Obeidat AS. Potential sources of intrinsic optical signals imaged in live brain slices. Methods. 1999;18:185–196. doi: 10.1006/meth.1999.0771. [DOI] [PubMed] [Google Scholar]
- Andrew RD, MacVicar BA. Imaging cell volume changes and neuronal excitation in the hippocampal slice. Neuroscience. 1994;62:371–383. doi: 10.1016/0306-4522(94)90372-7. [DOI] [PubMed] [Google Scholar]
- Back T. Pathophysiology of the ischemic penumbra - revision of a concept. Cell Mol Neurobiol. 1998;18(6):621–638. doi: 10.1023/A:1020629818207. [DOI] [PMC free article] [PubMed] [Google Scholar]
- Back T, Kohno K, Hossman KA. Cortical negative DC deflections following middle cerebral artery occlusion and KCl-induced spreading depression: effect on blood flow, tissue oxygenation, and electroencephalogram. J Cereb Blood Flow Metab. 1994;14:12–19. doi: 10.1038/jcbfm.1994.3. [DOI] [PubMed] [Google Scholar]
- Back T, Ginsberg MD, Dietrich D, Watson BD. Induction of spreading depression in the ischemic hemisphere following experimental middle cerebral artery occlusion: effect on infarct morphology. J Cereb Blood Flow Metab. 1996;16:202–213. doi: 10.1097/00004647-199603000-00004. [DOI] [PubMed] [Google Scholar]
- Benardo LS, Wong RKS. Inhibition in the cortical network. In: Gutnick MJ, Mody I, editors. The Cortical Neuron 1995. Oxford University Press; New York: 1995. pp. 141–155. [Google Scholar]
- Bennett MVL, Contreras JE, Bukauskas FF, Saez JC. New roles for astrocytes: gap junction hemichannels have something to communicate. Trend Neurosci. 2003;26:610–617. doi: 10.1016/j.tins.2003.09.008. [DOI] [PMC free article] [PubMed] [Google Scholar]
- Blank WF, Kirshner HS. The kinetics of extracellular potassium changes during hypoxia and anoxia in the cat cerebral cortex. Brain Res. 1977;123:113–124. doi: 10.1016/0006-8993(77)90646-1. [DOI] [PubMed] [Google Scholar]
- Bourque CW, Renaud LP. A perfused in vitro preparation of hypothalamus for electrophysiological studies on neurosecretory neurons. J Neuroscience Methods. 1983;7:203–214. doi: 10.1016/0165-0270(83)90002-x. [DOI] [PubMed] [Google Scholar]
- Bourque CW, Renaud LP. Activity patterns and osmosensitivity of rat supraoptic neurons in perfused hypothalamic explants. J Physiol. 1984;349:631–642. doi: 10.1113/jphysiol.1984.sp015178. [DOI] [PMC free article] [PubMed] [Google Scholar]
- Brinley FJ, Kandel ER, Marshall WH. Potassium outflux from rabbit cortex during spreading depression. J Neurophysiol. 1960;23:246–256. doi: 10.1152/jn.1960.23.3.246. [DOI] [PubMed] [Google Scholar]
- Chalfie M, Tu Y, Euskirchen G, Ward WW, Prasher DC. Green fluorescent protein as a marker for gene expression. Science. 1994;263:802–805. doi: 10.1126/science.8303295. [DOI] [PubMed] [Google Scholar]
- Chan DK, Hudspeth AJ. Ca2+ current-driven nonlinear amplification by the mammalian cochlea in vitro. Nature Neurosci. 2005;8:149–155. doi: 10.1038/nn1385. [DOI] [PMC free article] [PubMed] [Google Scholar]
- Chez G, Aitken PG, Somjen GG. Whole-cell membrane current and membrane resistance during hypoxic spreading depression. Neuroreport. 1992;3:197–200. doi: 10.1097/00001756-199202000-00019. [DOI] [PubMed] [Google Scholar]
- Chuquet J, Hollender L, Nimchinsky EA. High-resolution in vivo imaging of the neurovascular unit during spreading depression. J Neurosci. 2007;27:4036–4044. doi: 10.1523/JNEUROSCI.0721-07.2007. [DOI] [PMC free article] [PubMed] [Google Scholar]
- Clarke DD, Sokolff L. Circulation and energy metabolism of the brain. In: Seigel GJ, Agranoff BW, Albers RW, Molinoff PB, editors. Basic Neurochemistry 1994. Raven Press; New York: 1994. pp. 645–680. [Google Scholar]
- Cohen LB. Changes in neuron structure during action potential propagation and synaptic transmission. Physiol Rev. 1973;53:373–418. doi: 10.1152/physrev.1973.53.2.373. [DOI] [PubMed] [Google Scholar]
- Cotlet M, Goodwin PM, Waldo GS, Werner JH. A comparison of the fluorescence dynamics of single molecules of a green fluorescent protein: one- versus two-photon excitation. Chem Phys Chem. 2006;7:250–260. doi: 10.1002/cphc.200500247. [DOI] [PubMed] [Google Scholar]
- Dewar D, Yam P, McCulloch J. Drug development for stroke: importance of protecting cerebral white matter. Eur J Pharmacol. 1999;375:41–50. doi: 10.1016/s0014-2999(99)00280-0. [DOI] [PubMed] [Google Scholar]
- Diabira D, Hennou S, Chevassus-au-Louis N, Ben-Ari Y, Gozlan H. Late embryonic expression of AMPA receptor function in the CA1 region of the intact hippocampus in vitro. Eur J Neurosci. 1999;11:4015–4023. doi: 10.1046/j.1460-9568.1999.00831.x. [DOI] [PubMed] [Google Scholar]
- Do Carmo RJ, Martins-Ferreira H. Spreading depression of Leão probed with ion-selective microelectrodes in isolated chick retina. An Acad Bras Cienc. 1984;56:401–421. [PubMed] [Google Scholar]
- Duan S, Anderson CM, Keung EC, Chen Y, Chen Y, Swanson RA. P2X7 receptor-mediated release of excitatory amino acids from astrocytes. J Neurosci. 2003;23:1320–1328. doi: 10.1523/JNEUROSCI.23-04-01320.2003. [DOI] [PMC free article] [PubMed] [Google Scholar]
- Fabricius M, Fuhr S, Bhatia R, Boutelle M, Hashemi P, Strong AJ, Lauritzen M. Cortical spreading depression and peri-infarct depolarization in acutely injured human cerebral cortex. Brain. 2006;129:778–790. doi: 10.1093/brain/awh716. [DOI] [PubMed] [Google Scholar]
- Federico P, Borg SG, Šalkauskus AG, MacVicar BA. Mapping patterns of neuronal activity and seizure propagation by imaging intrinsic optical signals in the isolated whole brain of the guinea pig. Neuroscience. 1994;58:461–480. doi: 10.1016/0306-4522(94)90073-6. [DOI] [PubMed] [Google Scholar]
- Feng G, Mellor RH, Bernstein M, Keller-Peck C, Nguyen QT, Wallace M, Nerbonne JM, Lichtman JW, Sanes JR. Imaging neuronal subsets in transgenic mice expressing multiple spectral variants of GFP. Neuron. 2000;28:41–51. doi: 10.1016/s0896-6273(00)00084-2. [DOI] [PubMed] [Google Scholar]
- Fulton B. Motoneurone activity in an isolated spinal cord from the adult mouse. Neurosci Lett. 1986;71:175–180. doi: 10.1016/0304-3940(86)90554-9. [DOI] [PubMed] [Google Scholar]
- Gorji A, Scheller D, Straub H, Tegtmeier F, Köhling R, Höhling JM, Tuxhorn I, Ebner A, Wolf P, Panneck HW, Oppel F, Speckmann EJ. Spreading depression in human neocortical slices. Brain Res. 2001;906:74–83. doi: 10.1016/s0006-8993(01)02557-4. [DOI] [PubMed] [Google Scholar]
- Gouras P, Hoff M. Retinal function in an isolated, perfused mammalian eye. Invest Ophthalmol Vis Sci. 1970;9:388–399. [PubMed] [Google Scholar]
- Gray EG. Axo-somatic and axo-dendritic synapses of the cerebral cortex: An electron microscopic study. J Anat. 1959;93:420–433. [PMC free article] [PubMed] [Google Scholar]
- Hadjikhani N, Sanchez del Rio M, Wu O, Schwartz D, Bakker D, Fischi B, Kwong KK, Cutrer FM, Rosen BR, Tootell RBH, Sorensen AG, Moskowitz MA. Mechanisms of migraine aura revealed by functional MRI in human visual cortex. PNAS. 2001;98:4687–4692. doi: 10.1073/pnas.071582498. [DOI] [PMC free article] [PubMed] [Google Scholar]
- Hansen AJ, Lauritzen M. The role of spreading depression in acute brain disorders. Ann Acad Bras Cienc. 1984;56:457–480. [PubMed] [Google Scholar]
- Hansen AJ, Zeuthen T. Extracellular ion concentrations during spreading depression and ischemia in the rat brain cortex. Acta Physiol Scand. 1981;113:437–445. doi: 10.1111/j.1748-1716.1981.tb06920.x. [DOI] [PubMed] [Google Scholar]
- Hartings JA, Rolli ML, May Lu XC, Tortella FC. Delayed secondary phase of peri-infarct depolarizations after focal cerebral ischemia: relation to infarct growth and neuroprotection. J Neurosci. 2003;23:11602–11610. doi: 10.1523/JNEUROSCI.23-37-11602.2003. [DOI] [PMC free article] [PubMed] [Google Scholar]
- Jarvis CR, Anderson TR, Andrew RD. Anoxic depolarization mediates acute damage independent of glutamate in neocortical brain slices. Cerebral Cortex. 2001;11:249–259. doi: 10.1093/cercor/11.3.249. [DOI] [PubMed] [Google Scholar]
- Jarvis CR, Lilge L, Vipond GJ, Andrew RD. Interpretation of intrinsic optical signals and calcein fluorescence during excitotoxic insult in the hippocampal slice. Neuroimage. 1999;10:357–372. doi: 10.1006/nimg.1999.0473. [DOI] [PubMed] [Google Scholar]
- Johnston D, Miao-Sin Wu S. Foundations of cellular Neurophysiology. MIT Press; Massachusetts: 1995. pp. 423–439. [Google Scholar]
- Joshi I, Andrew RD. Imaging anoxic depolarization during ischemia-like conditions in the mouse hemi-brain slice. J Neurophysiol. 2001;85:414–424. doi: 10.1152/jn.2001.85.1.414. [DOI] [PubMed] [Google Scholar]
- Kaminogo M, Suyama K, Ichikura A, Onizuka M, Shibata S. Anoxic depolarization determines ischemic brain injury. Neurol Res. 1998;20:343–348. doi: 10.1080/01616412.1998.11740529. [DOI] [PubMed] [Google Scholar]
- Kandel ER. Cell and Molecular Biology of the Neuron. In: Kandel ER, Swartz JH, Jessell TM, editors. Principles of Neural Science 2000. McGraw-Hill; Toronto: 1991. pp. 158–159. [Google Scholar]
- Kelly JP. The neural basis of perception and movement. In: Kandel ER, Swartz JH, Jessell TM, editors. Principles of Neural Science. 2000. McGraw-Hill; Toronto: 1991. pp. 283–295. [Google Scholar]
- Khalilov I, Esclapez M, Medina I, Aggoun D, Lamsa K, Leinekugel X, Khazipov R, Ben-Ari Y. A novel in vitro preparation: the intact hippocampal formation. Neuron. 1997;19:743–749. doi: 10.1016/s0896-6273(00)80956-3. [DOI] [PubMed] [Google Scholar]
- Kirov SA, Goddard CA, Harris KM. Age-dependence in the homeostatic upregulation of hippocampal dendritic spine number during blocked synaptic transmission. Neuropharmacol. 2004a;47:640–648. doi: 10.1016/j.neuropharm.2004.07.039. [DOI] [PubMed] [Google Scholar]
- Kirov SA, Petrak LJ, Fiala JC, Harris KM. Dendritic spines disappear with chilling but proliferate excessively upon rewarming of mature hippocampus. Neurosci. 2004b;127:69–80. doi: 10.1016/j.neuroscience.2004.04.053. [DOI] [PubMed] [Google Scholar]
- Kirov SA, Sorra KE, Harris KM. Slices have more synapses than perfusion-fixed hippocampus from both young and mature rats. J Neurosci. 1999;19:2876–2886. doi: 10.1523/JNEUROSCI.19-08-02876.1999. [DOI] [PMC free article] [PubMed] [Google Scholar]
- Konig K, Liang H, Berns MW, Tromberg BJ. Cell damage in near-infrared multimode optical traps as a result of multiphoton absorption. Opt Lett. 1996;21:1090–1092. doi: 10.1364/ol.21.001090. [DOI] [PubMed] [Google Scholar]
- Kraig RP, Nicholson C. Extracellular ionic variations during spreading depression. Neuroscience. 1978;3:1045–1059. doi: 10.1016/0306-4522(78)90122-7. [DOI] [PubMed] [Google Scholar]
- Lamsa K, Matias Palva J, Ruusuvuori E, Kaila K, Taira T. Synaptic GABAA activation inhibits AMPA-Kainate receptor-mediated bursting in the newborn (P0–P2) rat hippocampus. J Neurophysiol. 2000;83:359–366. doi: 10.1152/jn.2000.83.1.359. [DOI] [PubMed] [Google Scholar]
- Lashley KS. Patterns of cerebral integration indicated by the scotomas of migraine. Arch Neurol Psychiatry. 1941;46:331–339. [Google Scholar]
- Lauri S, Lamsa K, Pavlov I, Riekki R, Johnson BE, Molnar E, Rauvala H, Taira T. Activity blockade increases the number of functional synapses in the hippocampus of newborn rats. Mol Cell Neurosci. 2003;22:107–117. doi: 10.1016/s1044-7431(02)00012-x. [DOI] [PubMed] [Google Scholar]
- Lauritzen M. Cerebral blood flow in migraine and cortical spreading depression. Acta Neurol Scan Suppl. 1987;113:1–40. [PubMed] [Google Scholar]
- Lauritzen M. Pathophysiology of migraine aura: The spreading depression theory. Brain. 1994;117:199–210. doi: 10.1093/brain/117.1.199. [DOI] [PubMed] [Google Scholar]
- Leão AAP. Spreading depression of activity in the cerebral cortex. J Neurophysiol. 1944;7:359–390. doi: 10.1152/jn.1947.10.6.409. [DOI] [PubMed] [Google Scholar]
- Lee HY, Camp AJ, Callister RJ, Brichta AM. Vestibular primary afferent activity in an in vitro preparation of the mouse inner ear. J Neurosci Meth. 2005;145:73–87. doi: 10.1016/j.jneumeth.2004.11.021. [DOI] [PubMed] [Google Scholar]
- Lipton P. Effects of membrane depolarization on light scattering by cerebral cortical slices. J Physiol. 1973;231:365–383. doi: 10.1113/jphysiol.1973.sp010238. [DOI] [PMC free article] [PubMed] [Google Scholar]
- Llinás RR, Mühlethaler M. An electrophysiological study of the in vitro, perfused brain stem-cerebellum of adult guinea pig. J Physiol Lond. 1988;404:215–240. doi: 10.1113/jphysiol.1988.sp017287. [DOI] [PMC free article] [PubMed] [Google Scholar]
- Lorente de Nó. Studies on the structure of the cerebral cortex. II. Continuation of the study of ammonic system. J Psychol Neurol. 1934;46:113–177. [Google Scholar]
- Luhmann HJ, Dzhala VI, Ben-Ari Y. Generation and propagation of the 4-AP-induced epileptiform activity in neonatal intact limbic structures in vitro. Eur J Neurosci. 2000;12:2757–2768. doi: 10.1046/j.1460-9568.2000.00156.x. [DOI] [PubMed] [Google Scholar]
- Macdonald RL, Stoodley M. Pathophysiology of cerebral ischemia. Neurol Med Chir (Tokyo) 1998;38:1–11. doi: 10.2176/nmc.38.1. [DOI] [PubMed] [Google Scholar]
- Malm WC. Introduction to visibility. Fort Collins, CO: Cooperative Institute for Research in the Atmosphere; Colorado State University: 2000. [Google Scholar]
- Mareš P, Køiž N, Brožek G, Bureš J. Anoxic changes of extracellular potassium concentration in the cerebral cortex of young rats. Exp Neurol. 1976;53:12–20. doi: 10.1016/0014-4886(76)90277-6. [DOI] [PubMed] [Google Scholar]
- Marshall WH. Spreading cortical depression of Leão. Physiol Rev. 1959;39:239–279. doi: 10.1152/physrev.1959.39.2.239. [DOI] [PubMed] [Google Scholar]
- Martini FH, Timmons MJ, McKinley MP. The Nervous System: The Brain and Cranial Nerves. In: Corey PF, editor. Human Anatomy 2000. Prentice-Hall, Inc; Toronto: 1995. pp. 392–393. [Google Scholar]
- Mel BW, Schiller J. On the fight between excitation and inhibition: location is everything. Sci STKE. 2004;250:1–3. doi: 10.1126/stke.2502004pe44. [DOI] [PubMed] [Google Scholar]
- Mooney R, Penn AA, Gallego R, Shatz CJ. Thalamic relay of spontaneous retinal activity prior to vision. Neuron. 1996;17:863–874. doi: 10.1016/s0896-6273(00)80218-4. [DOI] [PubMed] [Google Scholar]
- Müller M, Somjen GG. Na+ and K+ concentrations, extra- and intracellular voltages and the effect of TTX in hypoxic rat hippocampal slices. J Neurophysiol. 2000;83:735–745. doi: 10.1152/jn.2000.83.2.735. [DOI] [PubMed] [Google Scholar]
- Nedergaard M. Spreading depression as a contributor to ischemic brain injury. Adv Neurobiol. 1996;71:75–84. [PubMed] [Google Scholar]
- Nedergaard M, Hansen AJ. Spreading depression is not associated with neuronal injury in the normal brain. Brain Res. 1988;449:395–398. doi: 10.1016/0006-8993(88)91062-1. [DOI] [PubMed] [Google Scholar]
- Nicholson C. Comparative neurophysiology of spreading depression in the cerebellum. An Acad Bras Cienc. 1984;56:481–494. [PubMed] [Google Scholar]
- Niemeyer GG. Intracellular recording from the isolated perfused mammalian eye. Vision Res. 1973;13:1613–1618. doi: 10.1016/0042-6989(73)90018-7. [DOI] [PubMed] [Google Scholar]
- Obeidat AS, Andrew RD. Spreading depression determines acute cellular damage in the hippocampal slice during oxygen/glucose deprivation. Eur J Neurosci. 1998;10:3451–3461. doi: 10.1046/j.1460-9568.1998.00358.x. [DOI] [PubMed] [Google Scholar]
- Obeidat AS, Jarvis CR, Andrew RD. Glutamate does not mediate acute neuronal damage after spreading depression induced by O2/glucose deprivation in the hippocampal slice. J Cereb Blood Flow Metab. 2000;20:412–422. doi: 10.1097/00004647-200002000-00024. [DOI] [PubMed] [Google Scholar]
- Obrenovitch TP. The ischemic penumbra twenty years on. Cerebrovasc Brain Metab Rev. 1995;7:297–323. [PubMed] [Google Scholar]
- Ochs S. The nature of spreading depression in neural networks. Int Rev Neurobiol. 1962;4:1–70. [Google Scholar]
- Oheim M, Beaurepaire Chaigneau E, Mertz J, Charpak S. Two-photon microscopy in brain tissue: parameters influencing the imaging depth. J Neurosci Methods. 2001;111:29–37. doi: 10.1016/s0165-0270(01)00438-1. [DOI] [PubMed] [Google Scholar]
- Otsuka M, Konishi S. Electrophysiology of the mammalian spinal cord in vitro. Nature. 1974;252:733–734. doi: 10.1038/252733a0. [DOI] [PubMed] [Google Scholar]
- Pavlov I, Riekki R, Taira T. Synergistic action of GABA-A and NMDA receptors in the induction of long-term depression in glutamatgergic synapses in the newborn rat hippocampus. Eur J Neurosci. 2004;20:3019–3026. doi: 10.1111/j.1460-9568.2004.03806.x. [DOI] [PubMed] [Google Scholar]
- Periasamy A, Skoglund P, Noakes C, Keller R. An evaluation of two-photon excitation versus confocal and digital deconvolution fluorescence microscopy imaging in Xenopus morphogenesis. Microsc Res Tech. 1999;47:172–181. doi: 10.1002/(SICI)1097-0029(19991101)47:3<172::AID-JEMT3>3.0.CO;2-A. [DOI] [PubMed] [Google Scholar]
- Pietrobon D. Migraine: new molecular mechanisms. The Neuroscientist. 2005;11:373–386. doi: 10.1177/1073858405275554. [DOI] [PubMed] [Google Scholar]
- Polischuk TM, Jarvis CR, Andrew RD. Intrinsic optical signal denoting neuronal damage in response to acute excitotoxic insult by domoic acid in the hippocampal slice. Neurobiol Dis. 1998;4:423–437. doi: 10.1006/nbdi.1998.0172. [DOI] [PubMed] [Google Scholar]
- Potter SM, Wang C, Garrity PA, Fraser SE. Intravital imaging of green fluorescent protein using two-photon laser scanning microscopy. Gene. 1996;173:25–31. doi: 10.1016/0378-1119(95)00681-8. [DOI] [PubMed] [Google Scholar]
- Quilichini PP, Diabria D, Chiron C, Ben-Ari Y, Gozian H. Persistent epileptiform activity induced by low Mg2+ in intact immature brain structures. Eur J Neurosci. 2002;16:850–860. doi: 10.1046/j.1460-9568.2002.02143.x. [DOI] [PubMed] [Google Scholar]
- Ricchelli F, Beghetto C, Gobbo S, Tognon G, Moretto V, Crisma M. Structural modifications of the permeability transition pore complex in resealed mitochondria induced by matrix-entrapped disaccharides. Arch Biochem Biophys. 2003;410:155–160. doi: 10.1016/s0003-9861(02)00667-7. [DOI] [PubMed] [Google Scholar]
- Russell MB, Olesen J. A nosographic analysis of the migraine aura in a general population. Brain. 1996;119:355–361. doi: 10.1093/brain/119.2.355. [DOI] [PubMed] [Google Scholar]
- Siesjö BK, Zhao Q, Pahlmark K, Siesjö P, Katsura K, Folbergrová J. Glutamate, calcium, and free radicals as mediators of ischemic brain damage. Ann Thorac Surg. 1995;59:1316–1320. doi: 10.1016/0003-4975(95)00077-x. [DOI] [PubMed] [Google Scholar]
- Silver IA, Erecinska M. Intracellular and extracellular changes of [Ca2+] in hypoxia and ischemia in rat brain in vivo. J Gen Physiol. 1990;95:837–866. doi: 10.1085/jgp.95.5.837. [DOI] [PMC free article] [PubMed] [Google Scholar]
- Somjen GG. Mechanisms of spreading depression and hypoxic spreading depression-like depolarization. Physiol Rev. 2001;81:1065–1096. doi: 10.1152/physrev.2001.81.3.1065. [DOI] [PubMed] [Google Scholar]
- Somjen GG, Aitken PG. The ionic and metabolic responses associated with neuronal depression of Leão’s type in cerebral cortex and in hippocampal formation. An Acad Bras Cienc. 1984;56:495–504. [PubMed] [Google Scholar]
- Somjen GG, Aitken PG, Czeh GL, Herreras O, Jing J, Young JN. Mechanism of spreading depression: a review of recent findings and a hypothesis. Can J Physiol Pharmacol. 1992;70(Suppl):S248–S254. doi: 10.1139/y92-268. [DOI] [PubMed] [Google Scholar]
- Sorra KE, Harris KM. Stability in synapse number and size at 2h after long-term potentiation in hippocampal area CA1. J Neurosci. 1998;18:658–671. doi: 10.1523/JNEUROSCI.18-02-00658.1998. [DOI] [PMC free article] [PubMed] [Google Scholar]
- Strong AJ, Fabricius M, Boutelle MG, Hibbons SJ, Hopwood SE, Jones R, Parkin MC, Lauritzen M. Spreading and synchronous depressions of cortical activity in acutely injured human brain. Stroke. 2002;33:2738–2743. doi: 10.1161/01.str.0000043073.69602.09. [DOI] [PubMed] [Google Scholar]
- Sweeney MI, Yager JY, Walz W, Juurlink BH. Cellular mechanisms involved in brain ischemia. Can J Physiol Pharmacol. 1995;73:1525–1535. doi: 10.1139/y95-211. [DOI] [PubMed] [Google Scholar]
- Takano T, Tian GF, Peng W, Lou N, Lovatt D, Hansen AJ, Kasischke KA, Nedergaard M. Cortical spreading depression causes and coincides with tissue hypoxia. Nat Neurosci. 2007;10:754–762. doi: 10.1038/nn1902. [DOI] [PubMed] [Google Scholar]
- Tanaka E, Yamamoto S, Onokuchi H, Isagai T, Higashi H. Membrane dysfunction induced by in vitro ischemia in rat hippocampal CA1 pyramidal neurons. J Neurophysiol. 1999;81:1872–1880. doi: 10.1152/jn.1999.81.4.1872. [DOI] [PubMed] [Google Scholar]
- Yu DY, Su EN, Cringle SJ, Yu PK. Isolated preparations of ocular vasculature and their applications in ophthalmic research. Progress in Retinal and Eye Research. 2003;22:135–169. doi: 10.1016/s1350-9462(02)00044-7. [DOI] [PubMed] [Google Scholar]
- Varona P, Ibarz JM, López-Aguado L, Herreras O. Macroscopic and subcellular factors shaping population spikes. J Neurophys. 2000;83:2192–2208. doi: 10.1152/jn.2000.83.4.2192. [DOI] [PubMed] [Google Scholar]
- Virginio C, MacKenzie A, Rassendren FA, North RA, Surprenant A. Pore dilation of neuronal P2X receptor channels. Nat Neurosci. 1999;2:315–321. doi: 10.1038/7225. [DOI] [PubMed] [Google Scholar]
- Vyskoèil F, Køiž N, Bureš J. Potassium-selective microelectrodes used for measuring the extracellular brain potassium during spreading depression and anoxic depolarization in rats. Brain Res. 1972;39:255–259. doi: 10.1016/0006-8993(72)90802-5. [DOI] [PubMed] [Google Scholar]
- Witter MP. A survey of the anatomy of the hippocampal formation, with emphasis on the septotemporal organization of its intrinsic and extrinsic connections. Adv Exp Med Biol. 1986;203:67–82. doi: 10.1007/978-1-4684-7971-3_5. [DOI] [PubMed] [Google Scholar]
- Xie Y, Zacharias E, Hoff P, Tegtmeier F. Ion channel involvement in anoxic depolarization induced by cardiac arrest in rat brain. J Cereb Blood Flow Metab. 1995;15:587–594. doi: 10.1038/jcbfm.1995.72. [DOI] [PubMed] [Google Scholar]
- Zhang S, Boyd J, Delaney K, Murphy TH. Rapid reversible changes in dendritic spine structure in vivo gated by the degree of ischemia. J Neurosci. 2005;25:5333–5338. doi: 10.1523/JNEUROSCI.1085-05.2005. [DOI] [PMC free article] [PubMed] [Google Scholar]
- Zhang S, Murphy TH. Imaging the impact of cortical microcirculation on synaptic structure and sensory-evoked hemodynamic responses in vivo. PLoS Biol. 2007;5:e119. doi: 10.1371/journal.pbio.0050119. [DOI] [PMC free article] [PubMed] [Google Scholar]