Abstract
The exo isomer of aflatoxin B1 (AFB1) 8,9-epoxide appears to be the only product of AFB1 involved in reaction with DNA and reacts with the N7 atom of guanine via an SN2 reaction from an intercalated state. Although the epoxide hydrolyzes rapidly in H2O (0.6 s−1 at 25°C), very high yields of DNA adduct result. Experimental binding data were fit to a model in which the epoxide forms a reversible complex with calf thymus DNA (Kd = 0.43 mg ml−1, or 1.4 mM monomer equivalents) and reacts with guanine with a rate of 35 s−1. Stopped-flow kinetic analysis revealed attenuation of fluorescence in the presence of DNA that was dependent on DNA concentration. Kinetic spectral analysis revealed that this process represents conjugation of epoxide with DNA, with an extrapolated rate maximum of 42 s−1 and half-maximal velocity at a DNA concentration of 1.8 mg ml−1 (5.8 mM monomer equivalents). The rate of hydrolysis of the epoxide was accelerated by calf thymus DNA in the range of pH 6–8, with a larger enhancement at the lower pH (increase of 0.23 s−1 at pH 6.2 with 0.17 mg DNA ml−1). The same rate enhancement effect was observed with poly[dA-dT]⋅poly[dA-dT], in which the epoxide can intercalate but not form significant levels of N7 purine adducts, and with single-stranded DNA. The increased rate of hydrolysis by DNA resembles that reported earlier for epoxides of polycyclic hydrocarbons and is postulated to involve a previously suggested localized proton field on the periphery of DNA. The epoxide preferentially intercalates between base pairs, and the proton field is postulated to provide acid catalysis to the conjugation reaction.
Keywords: aflatoxin, chemical carcinogenesis
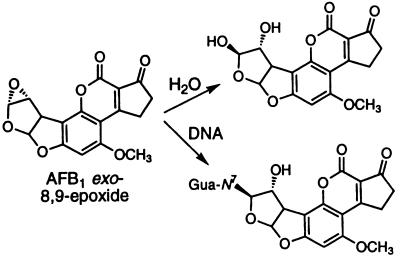
Aflatoxin B1 (AFB1) exposure is a major factor in human liver cancer in some parts of the world. The compound is a natural product of the Aspergillus genus of molds, which grow on several foodstuffs stored in hot moist conditions, and is among the most potent hepatocarcinogens and genotoxins presently known. AFB1 is enzymatically activated by cytochrome P450 3A4 to a very reactive epoxide (1, 2). AFB1 exo-8,9-epoxide is the genotoxic isomer and reacts efficiently with DNA at the N7 position of Gua, evidently after intercalation (Fig. 1) (3). We recently showed that AFB1 exo-8,9-epoxide reacts spontaneously with H2O with a pseudo-first order rate of 0.6 s−1 at 25°C (4). Although DNA adduct yields have been determined (5), the instability of the AFB1 exo-8,9-epoxide has precluded direct measurement of the reaction rate and the affinity for DNA.
Figure 1.
A proton-rich or low pH microenvironment at the surface of DNA molecules has recently been alleged, based on Poisson–Boltzmann distributions and Monte Carlo mathematical simulations (6, 7). We previously found the hydrolysis of AFB1 exo-8,9-epoxide to be elevated by acid catalysis at pH < 5.4 but not base-catalyzed (4). Consequently, we considered this to be an excellent system for testing the theory of a proton-rich microenvironment around DNA, because such a field should enhance the hydrolysis rate. We show here that the presence of DNA provides acid catalysis in excess of what is a very fast spontaneous rate and have also defined parameters of reaction rates to form DNA adducts from AFB1 exo-8,9-epoxide.
MATERIALS AND METHODS
Chemicals.
AFB1, calf thymus DNA, and poly[dA-dT]⋅poly[dA-dT] [poly d(AT)] were purchased from Sigma. Single-stranded (ss) DNA was formed by heating double-stranded (ds) DNA at 100°C for 10 min and cooling quickly on ice. AFB1 8,9-epoxide was synthesized using dimethyldioxirane (8), and the exo isomer was purified by recrystallization (9).
HPLC.
HPLC (9) was used to assay AFB1 8,9-dihydrodiol (AFB diol) after the addition of AFB1 exo-8,9-epoxide (final concentration, 18 μM) to aqueous solutions of DNA at various concentrations (in 10 mM potassium phosphate, pH 7.2). Reactions were done in triplicate, and the areas of the AFB-diol HPLC peaks were averaged. These were subtracted from the control experiment (AFB1 exo-8,9-epoxide added to buffer only) to determine the extent of reaction with DNA. Each data point was reiteratively modeled by the mathematical equations derived from the kinetic scheme to estimate kinetic parameters. The DNA was analyzed for the Gua-N7 adduct in the same samples (10), and the results were complementary, but the AFB-diol data are considered more accurate because of the low production of AFB-diol in most samples.
Kinetics.
Stopped-flow measurements used an Applied Photophysics (Leatherhead, U.K.) SX-17MV apparatus. The reactions were initiated by rapidly mixing AFB1 exo-8,9-epoxide in anhydrous (CH3)2CO with buffered solutions in a volumetric ratio of 1:10 (4).
RESULTS AND DISCUSSION
Kinetic Parameters Estimated from Product Analysis.
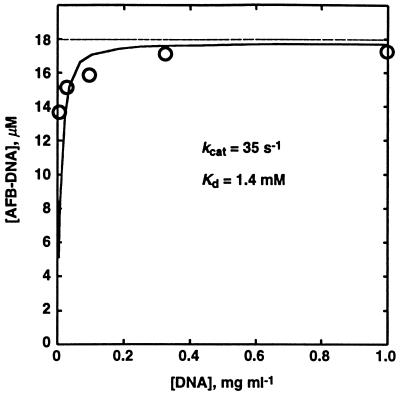
An approach to the estimation of conjugation rates has been developed based on the rate of spontaneous degradation of the very unstable AFB1 exo-8,9-epoxide in H2O (4) and quantitation of stable hydrolysis and conjugation products formed under conditions of varying levels of dsDNA. A simple kinetic model is applied, where two unknowns are estimated to fit by reiteration in the context of the experimentally determined yields.† A set of kinetic parameters can be estimated by converging on a set describing the hydrolysis product (AFB-diol) and the product conjugate (AFB–DNA) determined for all DNA concentrations here and previously (5). A plot of the experimental data and a line representing the concentration of adduct predicted by the model at these concentrations of DNA show good agreement (Fig. 2). The kinetic parameters thus estimated are a forward rate constant, kcat ≈ 35 s−1, and an apparent dissociation constant, Kd ≈ 0.43 mg ml−1 = 1.4 mM monomer equivalents, quantifying the competition with the reaction with H2O (0.6 s−1) and indicating a reasonably high apparent affinity for DNA and a very high rate of reaction with DNA.
Figure 2.
 |
Spectroscopic Analysis of the Reaction with DNA.
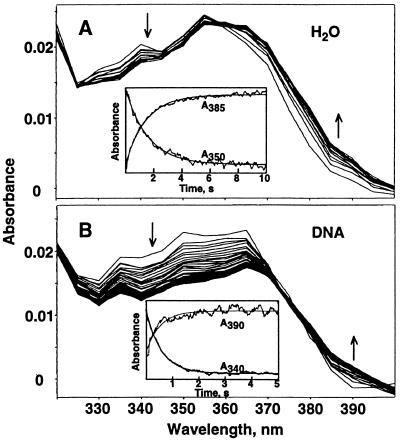
The spectral change upon hydrolysis of AFB1 8,9-epoxide is a slight red shift, illustrated in Fig. 3A (4). The absorbance decreases in the region of 330–355 nm and increases between 365 and 390 nm, with an isosbestic point at 360 nm. The rate of the reaction can, therefore, be determined by the rate of change at 385 or 350 nm, as shown (Fig. 3A Inset) to be 0.6 s−1. This spectral change upon hydrolysis must be dominated by the qualities of oxirane ring opening. Thus, conjugation with DNA should have similar attributes at a gross level, yet distinct because the products are different. The spectral change for conjugation of AFB1 epoxide with DNA has a large absorbance decrease between 330 and 365 nm and a modest increase ≈390 nm, with an isosbestic point at 373 nm (Fig. 3B). The rate of the reaction can be determined by the rate of change at 390 or 340 nm and is about triple the hydrolysis rate under these conditions. This result is consistent with a differing reaction pathway, namely conjugation with DNA.
Figure 3.
Spectral changes during reaction of AFB1 exo-8,9-epoxide with H2O and DNA. The spectra are at equal intervals over a 10-s span and are reconstructed from individual kinetic traces at 5-nm intervals. The arrows indicate the direction of absorbance change during the course of the reaction. (Insets) Selected individual kinetic traces for the wavelengths indicated. The rate of the reaction with H2O is 0.6 s−1 (A), and the rate of the reaction with DNA (0.10 mg ml−1= 0.32 mM monomer equivalents) is 1.9 s−1 (B).
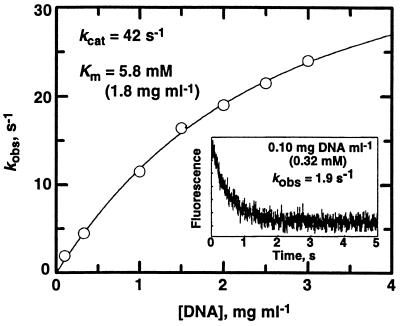
A very interesting aspect of the reaction is the remarkable fluorescence change in the presence of the above concentrations of DNA. In great contrast to the known 103-fold fluorescence increase upon hydrolysis (4), a major decrease was observed. The rate of change in the presence of 0.1–2.0 mg of DNA ml−1 is single-exponential and exactly the same as that measured by absorbance at 340 or 390 nm. Moreover, the rate is dependent on DNA concentration (Fig. 4).‡ These data were fit to a quadratic equation for a hyperbola to yield the kinetic parameters kcat = 42 s−1 and Km = 1.8 mg⋅ml−1 (5.8 mM monomer equivalents). This rate is extremely fast, even by comparison to the hydrolysis rate (0.6 s−1), and in the presence of an adequate amount of DNA base pairs, the AFB1 epoxide must nearly all be garnered to DNA conjugates. This result explains the meager 2% remaining AFB-diol in the product assays from incubations containing >0.3 mM DNA (Fig. 2). The reactivity is best appreciated by measuring it directly, because 1–2% of contaminating AFB diol in the epoxide solution is capable of significantly confounding the results. Analysis of Gua-N7 AFB-DNA adducts is also problematic because of the need to carefully estimate differences in low levels of AFB-diol.
Figure 4.
Rate of reaction of AFB1 exo-8,9-epoxide with DNA measured by fluorescence changes. (Inset) Rate of fluorescence decrease upon reaction in the presence of DNA (0.10 mg⋅ml−1 = 0.32 mM monomer equivalents). The observed pseudo-first order single exponential rate is 1.9 s−1. These data were fit to a quadratic equation for a hyperbola represented by the line.
The view has been expressed that electrophiles of intermediate reactivity are the most genotoxic because the more highly reactive ones will hydrolyze instead (13). However, the reaction products of AFB1 exo-8,9-epoxide can be virtually all DNA conjugates, although this compound is 10-fold more reactive with H2O than other major genotoxins {benzo[a]pyrene diol epoxide (BPDE), methylating agents, and mustards}, many of which only yield about 1–10% DNA conjugates (13–15).
The course to conjugation mirrors classic enzymatic reaction in that binding energy (intercalation) fortuitously positions the target (oxirane carbon) proximal to the reactive site (Gua-N7) for efficient reactivity. The chemical reaction is assisted by proton association (acid catalysis), with the developing oxyanion at the minor groove. Because an apparent Km, in the most simplified sense, is (k−1 + k2)/k1 and Kd = k−1/k1 (16), it follows that with the high rate of reaction, the apparent Km is significantly greater than Kd because of the contribution of k2.
If intercalation is a facet of the pathway, then ssDNA should produce much less of an effect. Indeed, 6.5-fold more ssDNA was needed to observe any fluorescence decrease, compared with dsDNA.§ Thus, the decrease in fluorescence is attributed to intercalation preceding covalent reaction.
Because DNA is located distant from the enzymatic source of the epoxide in the context of the cell, it is important to consider the rate of encounter with DNA in light of the remarkable instability of the AFB1 exo-8,9-epoxide. The rate of diffusion-limited encounter can be estimated by the application of equations that account for viscosity, temperature, molecule size, and diffusion theory. By assuming that the viscosity of the media in the cell is similar to that of H2O and that DNA does not move relative to the diffusion in the media, a rate of encounter can be estimated at ∼2.5 × 10⁹ M−1 s−1 (17).¶ The second-order rate constant of AFB1 exo-8,9-epoxide with H2O is the pseudo-first order rate of 1 s−1 (37°C) divided by the concentration of H2O (55 M), 0.02 M−1⋅s−1, which is ≈11 orders of magnitude slower than the rate of encounter with an immobile molecule such as DNA. Including the caveats mentioned, as well as the obvious effect the nucleus boundary will have, the enormous difference in these rates should offer some rationale for the adduction of DNA by the very unstable AFB1 exo-8,9-epoxide.
This general method should, in principle, allow the direct determination of conjugation reaction rates with specific sequences of DNA. Obvious targets would be critical genes shown to be involved in growth regulation, i.e., oncogenes and tumor suppressor genes.
DNA-Induced Acid Catalysis.
Double helical DNA, with its exposed phosphate backbone, is a polyanion of high axial charge density. Therefore, it is a negatively charged cylinder for which the surface has a local accumulation of high concentration of cations and excludes anions from the vicinity of DNA. Recent calculations (Poisson–Boltzmann approximations) suggest that the local environment of DNA has a high concentration of protons or hydronium ions in a hyperbolic gradient reaching nearly 40 Å away from the surface of DNA (6, 7). Acidic domains around DNA polymers have clear relevance to protein–DNA, enzyme–DNA, and genotoxin–DNA interactions. The DNA-induced electrostatic potential must affect the affinity and recognition of proteins for DNA and pKa values of ionizable residues of enzyme active sites. Moreover, the ability of the increased concentration of protons to catalyze reactions of carcinogens is of obvious significance–e.g., many epoxides react with DNA and involve acid-catalyzed reactions. The local concentration of protons has been mathematically modeled by combining Poisson–Boltzmann, Monte Carlo, and molecular mechanics techniques (6), and the theory has been shown to fit some experimental data well (7). The hydrolysis of BPDE has a spontaneous as well as an acid-catalyzed component that elevates the rate in acidic medium (18). The presence of either ds or ssDNA has been shown to clearly enhance the rate of hydrolysis of both the syn and anti isomers and is DNA-concentration-dependent (19–21).
With a spontaneous chemical hydrolysis rate of 0.6 s−1 and an acid-catalyzed hydrolysis rate of 2.5 × 10³ M−1⋅s−1 (4), AFB1 exo-8,9-epoxide is 30- and 1,200-fold more reactive than syn-BPDE and anti-BPDE, respectively, at pH ≥ 7 (18). AFB1 exo-8,9-epoxide has similar acid-catalyzed rates of hydrolysis, 3.4-fold higher than syn-BPDE and 1.4 times that of anti-BPDE (18). Thus, AFB1 exo-8,9-epoxide should provide a good system for testing the DNA acidic domain/DNA-mediated acid catalysis theory because of its instability in H2O.
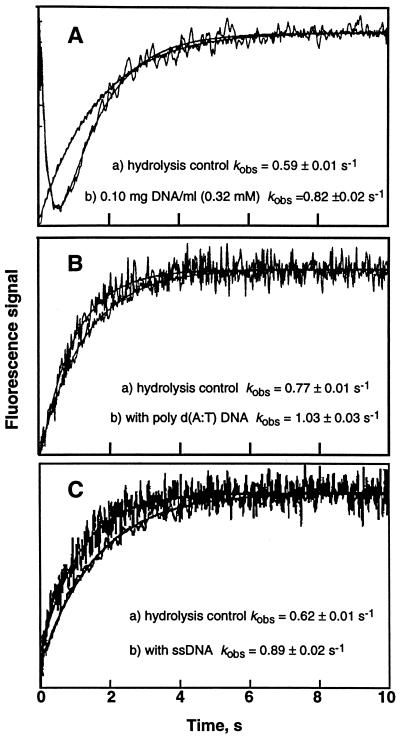
Kinetics were measured using fluorescence detection in the presence of a final calf thymus DNA concentration of 0.10 mg⋅ml−1 (0.32 mM monomer equivalents) at pH 6.2 and 25°C.‖ At a pH of 6.2, the bulk solution is clearly within the range of pH where virtually all hydrolysis is via the spontaneous chemical reaction. Assuming a suggested ΔpH of ≈2 (7), the immediate surface of DNA would, therefore, be moderately in the range of acid-catalyzed mechanism (4) at pH ≈ 4.2 and provide some rate enhancement. An enhancement of 39% over the control reaction was observed (Fig. 5), with an error of 3%.** There is also a clear and repeatable fluorescence emission quench occurring in <1 s with a rate of ≈5 s−1, which is a contribution of the conjugation reaction with DNA.†† ssDNA, which does not intercalate, also produced this enhancement of hydrolysis. Because AFB1 exo-8,9-epoxide reacts with adenine bases only 1% as effectively as Gua (22), we also investigated the effect of poly d(AT), which is necessarily duplex helical DNA and shown to intercalate AFB1 (5); its presence produced a 33% rate enhancement (Fig. 5). Simple catalysis mediated by isolated phosphate anions in solution was ruled out by experiments with an excessive concentration (0.6 mM) of deoxyguanosine 5′-monophosphate or sodium phosphate, both of which resulted in no detectable change. The polymeric structure of DNA appears to be necessary for the putative acidic domain.
Figure 5.
Fluorescence changes associated with AFB1 exo-8,9-epoxide interaction with DNA. A solution of the epoxide [7 μM in (CH3)2CO] was mixed with 10 volumes of either (a) 10 mM sodium EDTA buffer (pH 6.2) or (b) the same buffer containing DNA under the same conditions (temperature, reagent sample, buffer, instrument parameters, and others). The solid lines show exponential fits. (A) Hydrolysis control reaction kobs = 0.59 ± 0.01 s−1; + 0.10 mg⋅ml−1 dsDNA (= 0.32 mM monomer equivalents), kobs = 0.82 ± 0.02 s−1 (39% difference). (B) Hydrolysis control reaction kobs = 0.77 ± 0.01 s−1; + poly d(AT) 0.20 mg⋅ml−1, kobs = 1.03 ± 0.03 s−1 (33% difference). (C) Hydrolysis control reaction kobs = 0.62 ± 0.01 s−1, + 0.15 mg⋅ml−1 ssDNA, kobs = 0.89 ± 0.02 s−1 (40% difference).
If the DNA surface lowers the reference bulk pH by a gradient with a maximum ΔpH at the surface estimated to be ≈2 (7), then in higher pH buffer (e.g., refs. 20 and 22), there should be a diminished effect on acid catalysis. Experiments at pH 6.2, 7.0, and 8.0 (Table 1) show a trend that is expected in a pH region that provides acid catalysis. The acid-catalyzed enhancement is diminished at pH 8 to nearly nondetectable, as would be expected by a relative acidic domain in the microenvironment around DNA.
Table 1.
Rates of hydrolysis of AFB1 exo-8,90epoxide
| pH |
k, s−1
|
|
|---|---|---|
| Buffer | Calf thymus DNA, 0.17 mg⋅ml−1 (0.55-mM monomer equivalents) | |
| 6.2 | 0.59 ± 0.004 | 0.82 ± 0.02 |
| 7.0 | 0.59 ± 0.004 | 0.77 ± 0.03 |
| 8.0 | 0.59 ± 0.004 | 0.66 ± 0.02 |
Sodium EDTA buffer was used in all cases (20 mM).
Poly d(AT) and ssDNA did not yield the rapid fluorescence quenching exhibited in the initial 0.5 s with calf thymus DNA. Intercalation would likely quench emission; the fluorescence traces with and without DNA start at the same emission level, indicating that the presence of DNA is not changing the emission during the mixing time of the instrument. The amplitude for the hydrolysis is about 5-fold less in the presence of dsDNA and is likely due to intercalation of the adducted AFB1 epoxide. It is noteworthy that the amplitude of the reaction in the presence of the poly d(AT) is >60% of the control, indicating that most of the signal is actually observed. ssDNA did not exhibit the initial quench and appears to intercalate much less, consistent with the proposal that AFB1 exo-8,9-epoxide intercalates into dsDNA (5, 23).
Conclusions.
Stopped-flow kinetics have been used to augment earlier observations on the kinetics and mechanism of hydrolysis of AFB1 exo-8,9-epoxide (4). We have used hydrolysis kinetics and yield data to estimate an apparent Kd (0.43 mg ml−1 = 1.4 mM monomer equivalents) and kcat (35 s−1) for the covalent binding of AFB1 exo-8,9-epoxide to DNA at pH 7.2 and directly measured the rate of reaction with DNA via fluorescence and absorbance changes (kcat = 42 s−1, Km = 1.8⋅mg ml−1 = 5.8 mM monomer equivalents). Thus, nearly all of the covalent binding of AFB1 exo-8,9-epoxide occurs by a very rapid reaction of the DNA-intercalated epoxide. DNA also assists in the acid catalysis of the epoxide by hastening the reaction by k ≈0.2 s−1 (Table 1), apparently due to the proton field surrounding DNA. This proton field likely provides acid catalysis to the conjugation reaction as well.
Acknowledgments
We thank Z. Deng for preparing the initial sample of AFB1 8,9-epoxide and Prof. T. M. Harris for helpful discussion and comments on the manuscript. This research was supported by U. S. Public Health Service Grants R35 CA44353 and P30 ES00267 (to F.P.G.). W.W.J. is the recipient of U. S. Public Health Service Award F32 ES05663.
ABBREVIATIONS
- AFB1
aflatoxin B1
- poly d(AT)
poly[dA-dT]⋅poly[dA-dT]
- ss
single stranded
- ds
double stranded
- AFB diol
AFB1 8,9-dihydrodiol
- BPDE
benzo[a]pyrene diol epoxide (7,8-dihydro-7,8-dihydroxy-9,10-oxo-benzo[a]pyrene)
Footnotes
The chemical pathways are the following: AFB1 exo-8,9-epoxide → AFB diol and AFB1 exo-8,9-epoxide + DNA ⇄ DNA⋅AFB exo-8,9-epoxide → DNA–AFB. We recently determined the rate of the first reaction (4) and, in this work, have experimentally measured yields of DNA–AFB adducts at several DNA concentrations. These two equations are converted to a form suitable for use with the kinetics modeling program HopKINSIM (11) allowing rational convergence on a set of kinetic parameters, Kd (dissociation constant for DNA) and kcat (forward rate constant for conjugation with DNA). We use the term kcat here because of our evidence that DNA provides rate acceleration for the conjugation and hydrolysis reactions, although DNA is consumed in the conjugation reaction. An extended explanation of the approach as applied to a different system is presented in another report (12).
The calculated maximum rate is 42 s−1, and the Km is 1.8 mg ml−1 or 5.8 mM DNA monomer equivalents. DNA is a macro-viscogen not a micro-viscogen and, therefore, will not effect diffusion of a small molecule at the lower to medium concentrations. However, at high concentration (i.e., 5 mg⋅ml−1 = 16 mM monomer equivalents), there are technical problems, i.e., flow, bubbles, speed, and others. Consequently, the data are reasonable only up to the concentrations shown.
The “ssDNA,” defined by heating calf thymus DNA at 100°C and rapid cooling on ice, contains some dsDNA.
 |
A very limited range of DNA concentration is allowable using this technique. Numerous attempts to use higher DNA concentrations resulted in quenching of much of the emission, burying the fluorescence change, and lower DNA concentrations were insufficient in catalyzing detectable differences. A higher concentration of DNA would presumably produce a larger effect with a hyperbolic limit, if it were possible to do the experiments.
This enhancement of rate was consistently exhibited when the comparison was made directly between the same conditions–i.e., epoxide solution, buffer, and temperature. The traces shown are averages of data from 12 individual reactions.
References
- 1.Busby W F, Wogan G N. In: Chemical Carcinogens. Searle C E, editor. Washington, DC: Am. Chem. Soc.; 1984. pp. 945–1136. [Google Scholar]
- 2.Ueng Y-F, Shimada T, Yamazaki H, Guengerich F P. Chem Res Toxicol. 1995;8:218–225. doi: 10.1021/tx00044a006. [DOI] [PubMed] [Google Scholar]
- 3.Iyer R, Coles B, Raney K D, Thier R, Guengerich F P, Harris T M. J Am Chem Soc. 1994;116:1603–1609. [Google Scholar]
- 4.Johnson W W, Harris T M, Guengerich F P. J Am Chem Soc. 1996;118:8213–8220. [Google Scholar]
- 5.Raney K D, Gopalakrishnan S, Byrd S, Stone M P, Harris T M. Chem Res Toxicol. 1990;3:254–261. doi: 10.1021/tx00015a011. [DOI] [PubMed] [Google Scholar]
- 6.Lamm G, Pack G R. Proc Natl Acad Sci USA. 1990;87:9033–9030. doi: 10.1073/pnas.87.22.9033. [DOI] [PMC free article] [PubMed] [Google Scholar]
- 7.Lamm G, Wong L, Pack G R. J Am Chem Soc. 1996;118:3325–3331. [Google Scholar]
- 8.Baertschi S W, Raney K D, Stone M P, Harris T M. J Am Chem Soc. 1988;110:7929–7931. [Google Scholar]
- 9.Raney K D, Coles B, Guengerich F P, Harris T M. Chem Res Toxicol. 1992;5:333–335. doi: 10.1021/tx00027a002. [DOI] [PubMed] [Google Scholar]
- 10.Shimada T, Guengerich F P. Proc Natl Acad Sci USA. 1989;86:462–465. doi: 10.1073/pnas.86.2.462. [DOI] [PMC free article] [PubMed] [Google Scholar]
- 11.Barshop B A, Wrenn R F, Frieden C. Anal Biochem. 1983;130:134–145. doi: 10.1016/0003-2697(83)90660-7. [DOI] [PubMed] [Google Scholar]
- 12.Johnson W W, Ueng Y-F, Mannervik B, Widersten M, Hayes J D, Sherratt P J, Ketterer B, Guengerich F P. Biochemistry. 1997;36:3056–3060. doi: 10.1021/bi962537o. [DOI] [PubMed] [Google Scholar]
- 13.Lawley P D. In: Chemical Carcinogens. Searle C E, editor. Washington, DC: Am. Chem. Soc.; 1984. pp. 324–484. [Google Scholar]
- 14.Davidson N E, Egner P A, Kensler T W. Cancer Res. 1990;50:2251–2255. [PubMed] [Google Scholar]
- 15.Humphreys W G, Kim D-H, Cmarik J L, Shimada T, Guengerich F P. Biochemistry. 1990;29:10342–10350. doi: 10.1021/bi00497a008. [DOI] [PubMed] [Google Scholar]
- 16.Walsh C. Enzymatic Reaction Mechanisms. San Francisco: Freeman; 1979. p. 34. [Google Scholar]
- 17.Alberty R A, Hammes G G. J Phys Chem. 1958;62:154–159. [Google Scholar]
- 18.Whalen D L, Montemarano J A, Thakker D R, Yagi H, Jerina D M. J Am Chem Soc. 1977;99:5522–5524. doi: 10.1021/ja00458a069. [DOI] [PubMed] [Google Scholar]
- 19.Geacintov N E, Yoshida H, Ibanez V, Harvey R G. Biochemistry. 1982;21:1864–1869. doi: 10.1021/bi00537a025. [DOI] [PubMed] [Google Scholar]
- 20.Michaud D P, Gupta S C, Whalen D L, Sayer J M, Jerina D M. Chem Biol Interact. 1983;44:41–52. doi: 10.1016/0009-2797(83)90128-x. [DOI] [PubMed] [Google Scholar]
- 21.Islam N R, Whalen D L, Yagi H, Jerina D M. J Am Chem Soc. 1987;109:2108–2111. [Google Scholar]
- 22.Iyer R S, Voehler M W, Harris T M. J Am Chem Soc. 1994;116:8863–8869. [Google Scholar]
- 23.Gopalakrishnan S, Byrd S, Stone M P, Harris T M. Biochemistry. 1989;28:726–734. doi: 10.1021/bi00428a047. [DOI] [PubMed] [Google Scholar]


