Abstract
We used a force-measuring laser tweezers apparatus to determine the elastic properties of λ-bacteriophage DNA as a function of ionic strength and in the presence of multivalent cations. The electrostatic contribution to the persistence length P varied as the inverse of the ionic strength in monovalent salt, as predicted by the standard worm-like polyelectrolyte model. However, ionic strength is not always the dominant variable in determining the elastic properties of DNA. Monovalent and multivalent ions have quite different effects even when present at the same ionic strength. Multivalent ions lead to P values as low as 250–300 Å, well below the high-salt “fully neutralized” value of 450–500 Å characteristic of DNA in monovalent salt. The ions Mg2+ and Co(NH3)63+, in which the charge is centrally concentrated, yield lower P values than the polyamines putrescine2+ and spermidine3+, in which the charge is linearly distributed. The elastic stretch modulus, S, and P display opposite trends with ionic strength, in contradiction to predictions of macroscopic elasticity theory. DNA is well described as a worm-like chain at concentrations of trivalent cations capable of inducing condensation, if condensation is prevented by keeping the molecule stretched. A retractile force appears in the presence of multivalent cations at molecular extensions that allow intramolecular contacts, suggesting condensation in stretched DNA occurs by a “thermal ratchet” mechanism.
Ions strongly affect such biologically significant behavior of DNA as wrapping around nucleosomes, packaging inside bacteriophage capsids, and binding to proteins involved in transcriptional initiation and elongation. While such influence is often explained by relatively simple ion exchange equilibria (1, 2), in many cases ions appear to exert their effect by modifying the structure and mechanical properties of DNA—its bending and torsional rigidity. The study of the ionic dependence of the elastic properties of DNA is therefore essential to understand the energetics of these key biological processes.
Recent technical advances in nanomanipulation have allowed the mechanical behavior of single DNA molecules to be studied. Magnetic beads (3, 4), micro fibers (5), optical traps (6), and hydrodynamic flow (7) have been used to apply a wide range of forces to individual bacteriophage DNA molecules. Smith et al. (6) have recently described three regimes in the elastic response of λ-bacteriophage DNA (λ DNA) molecules. Between 0.01 and 10 pN, the molecule behaves as an entropic spring and is well described by the worm-like chain (WLC) model (8–10), from which a persistence length, P, and a contour length, Lo, can be obtained. Between 10 and 65 pN, the molecule deviates from the predictions of the inextensible WLC as it extends beyond its B-form contour length. From this “enthalpic elasticity” regime an elastic stretch modulus, S, can be obtained. Finally, at about 65 pN, the molecule suddenly yields in a highly cooperative fashion and overstretches ≈1.7 times. A more recent study using an optical trapping interoferometer (11) has probed the entropic and enthalpic elasticity of single plasmid-length DNA molecules.
In this paper we used a force-measuring optical trap instrument (6) to determine the elastic properties of λ DNA as a function of ionic strength and in the presence of multivalent cations. Our results show the following effects, some of them unexpected, of ion concentration, valence, and structure on DNA elasticity: (i) The electrostatic contribution to P varies as the inverse of the ionic strength, I, in monovalent salt, as predicted by the standard uniformly charged cylinder model (12, 13). However, ionic strength is not always the dominant variable in determining the elastic properties of DNA; monovalent and multivalent ions have quite different effects even when present at the same ionic strength. Multivalent ions lead to persistence lengths as low as 250–300 Å, well below the high-salt “fully neutralized” value of 450–500 Å characteristic of DNA in monovalent salt. (ii) Ions in which the charge is centrally concentrated [Mg2+, Co(NH3)63+] lead to lower P values than those in which the same charge is linearly distributed (putrescine2+, spermidine3+). (iii) The elastic stretch modulus and persistence length display opposite trends with ionic strength—a direct contradiction of macroscopic elasticity theory. (iv) DNA is still well described by the WLC model at concentrations of trivalent cations capable of inducing DNA collapse or condensation, if collapse is prevented by keeping the molecule stretched. (v) No evidence of the buckling transition that has been postulated to underlie condensation (14) is observed. Instead, a retractile force appears in the presence of multivalent cations at molecular extensions that allow intramolecular contacts, suggesting the existence of a “thermal ratchet” condensation mechanism in stretched DNA.
WLC Elastic Behavior
The WLC model describes the behavior of a DNA molecule as intermediate between a rigid rod and a flexible coil, accounting for both local stiffness and long-range flexibility (15). The flexibility of the chain is described by the persistence length P, the distance over which two segments of the chain remain directionally correlated. An interpolation formula that describes the extension x of a WLC with contour length Lo in response to a stretching force F is (8, 9)
 |
1 |
where k = the Boltzmann constant and T = absolute temperature. This equation describes the entropic elasticity of the WLC, arising from the reduced entropy of the stretched chain (x ≤ 16 μm for λ DNA), and assumes that the DNA is inextensible.
Near full extension, x approaches Lo as F−1/2 (8, 9, 16). In this regime DNA can also be enthalpically stretched beyond the contour length defined by B-DNA geometry (6). An equation that describes this extensible WLC regime (14 ≤ x ≤ 17 μm for λ DNA) is (10)
 |
2 |
where S is the elastic stretch modulus. The first two terms on the right hand side of Eq. 2 describe the extension of the molecule as x → Lo and correspond to the strong-stretching limit of Eq. 1. The third term describes the extension of the molecule beyond its canonical B-DNA length; i.e., it is the enthalpic component of the elasticity. The range of applicability for Eq. 1 may be extended by including this enthalpic component (11); however, nearly identical values of P, Lo, and S are obtained.
At extensions beyond these two elastic regimes, DNA undergoes a reversible overstretch transition to a form ≈70% longer than canonical B-DNA (5, 6).
Behavior and Analysis of Force–Extension Curves
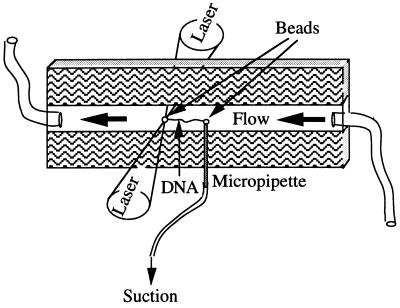
λ DNA molecules were tethered between two streptavidin-coated latex beads (diameter = 3.54 μm). One bead was held by a micropipette while the other was optically trapped by force-measuring laser tweezers (Fig. 1). The extension of the DNA molecule was determined from the distance between beads. The force acting on the molecule was inferred from the displacement of the laser beams on position-sensitive photodetectors, and it was calibrated against the viscous drag on a bead by using Stokes law (ref. 6; C.B., D. Keller, and S.B.S., unpublished work).
Figure 1.
Schematic diagram showing the geometry of the experiment. Two counter propagating laser beams “trap” a bead in the middle of a specially designed fluid chamber, far (>100 μm) from the chamber walls. The other bead is held by a micropipette introduced inside the chamber. The micropipette is moved to increase or decrease the tension in the DNA molecule that bridges the two beads. The environment around the molecule can be altered simply by exchanging the solution inside the chamber.
The 5′-overhangs of λ DNA (methylated c1857ind 1 Sam 7; New England Biolabs) were biotinylated with the Klenow fragment of DNA polymerase using biotin-11-dCTP (Sigma), dATP, dGTP, and dUTP as described previously (6). Single-strand nicks were repaired with DNA ligase. After biotinylation and nick ligation, DNA stocks were stored in an EDTA-containing buffer. Monovalent salt solutions were prepared by diluting 100 mM cacodylate pH 7 buffer stocks (86.2 mM sodium cacodylate, 13.8 mM cacodylic acid) supplemented with either 100 or 500 mM NaCl (total Na+ concentration ca. 186 and 586 mM, respectively). MgCl2⋅2H2O (Baker), putrescine⋅2HCl (Sigma), spermidine⋅3HCl (Sigma), and hexaammine cobalt(III) trichloride (Eastman), hereafter referred to as Co(NH3)63+, were utilized without further purification and prepared as 0.1 M stocks in deionized water (ρ ≥ 12 MΩ⋅cm). Final concentrations of the di- and trivalent cations were prepared in background buffer (BB): 1 mM NaCl/1 mM cacodylate, pH 7 (total Na+ concentration ≈1.86 mM). Complete buffer exchange between experiments was ensured by monitoring the conductivity of the fluid chamber eluant. Experimental buffers containing Mg2+ were purged from the chamber by extensive washing with an EDTA-containing buffer.
Dependence of F–x Curves on Monovalent Salt Concentration.
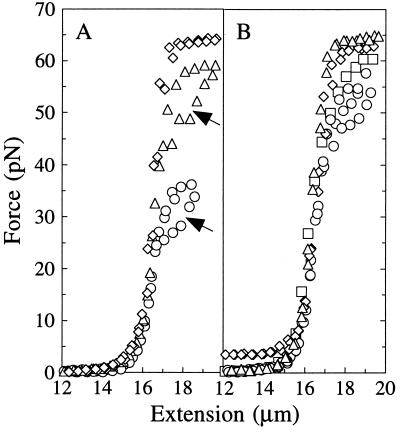
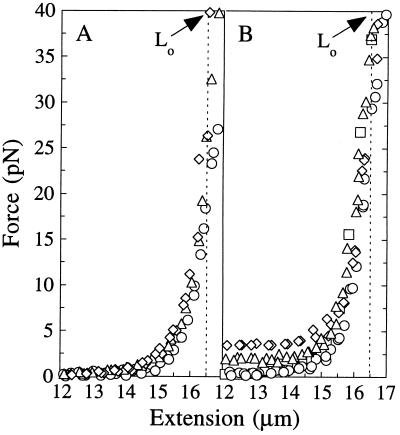
Force vs. extension curves for single λ DNA molecules at NaCl concentrations of 1, 50, and 500 mM are plotted in Fig. 2A. The entropic and enthalpic stretching regimes are enlarged in Fig. 3A, distinctly showing that P decreases and S increases as the salt concentration is raised. A lower value of P causes the force curve to rise more abruptly at low extensions, since the more flexible chain exists in a less extended conformation than the stiffer chain with higher P. Increases in S are readily apparent as increased slopes of the F–x curves at extensions approaching the contour length. As observed previously (6), decreasing monovalent ionic strength lowers the force at which λ DNA cooperatively overstretches to a conformation ≈1.7 times longer than B-DNA. Individual molecules often display hysteresis (Fig. 2A, arrows) upon relaxation of this form.
Figure 2.
Ionic effects on the elastic response of single λ DNA molecules. A portion of the overstretch transition is shown for all molecules. (A) Stretching λ DNA in 1 (○), 50 (▵), and 500 (◊) mM NaCl. Individual molecules often display melting hysteresis (arrows) upon relaxation of the overstretched form. (B) Stretching λ DNA in the presence of di- and trivalent cations with BB: 100 μM MgCl2 (□), 100 μM putrescine2+ (○), 100 μM spermidine3+ (▵), or 25 μM Co(NH3)63+ (◊) . To compare behavior in BB alone refer to the F–x curve for 1 mM NaCl.
Figure 3.
Ionic effects on the entropic and enthalpic elasticity of single λ DNA molecules. The B-form contour length (Lo) is 16.5 μm (broken line). (A) Stretching λ DNA in 1 (○), 50 (▵), and 500 (◊) mM NaCl. (B) Stretching λ DNA in the presence of di- and trivalent cations with BB: 100 μM MgCl2 (□), 100 μM putrescine2+ (○), 100 μM spermidine3+ (▵), or 25 μM Co(NH3)63+ (◊). To compare behavior in BB alone refer to the F–x curve for 1 mM NaCl. The nonzero force (1–5 pN) observed at x < 14 μm with spermidine3+ and Co(NH3)63+ was reproducible and is thought to represent intramolecular condensation.
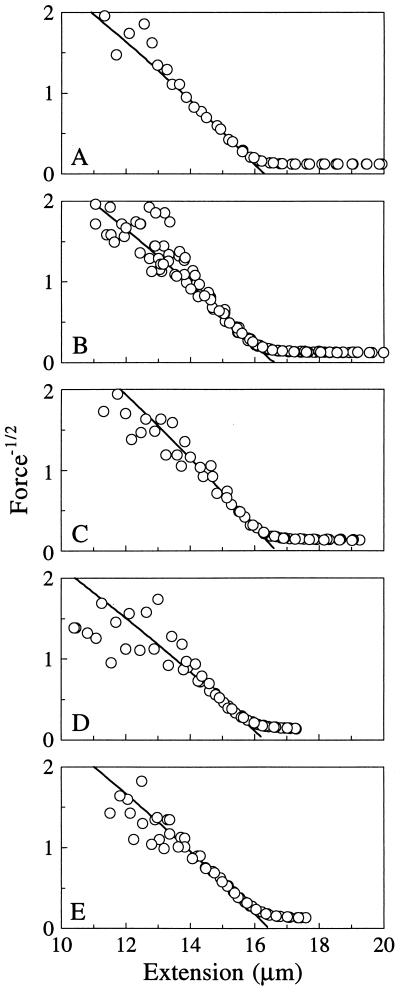
The persistence lengths, contour lengths, and elastic stretch moduli were extracted by fitting the entropic and enthalpic stretching data with the appropriate WLC models: inextensible WLC (Eq. 1), strong-stretching limit (Eq. 2 without F/S term), and extensible WLC (complete Eq. 2). P and S values are shown in Table 1. Lo was 16.5 ± 0.2 μm, and it showed no trend with ionic strength. This corresponds to 3.40 ± 0.04 Å/base pair (bp), within the range determined from crystallography for B-DNA (3.32 ± 0.19 Å) (18, 19). At the strong-stretching limit where P dominates the elasticity (x ≈ 14–16 μm), λ DNA follows the WLC behavior predicted by Eq. 2 without the enthalpic stretching term F/S. A plot of data for 500 mM NaCl and the predicted WLC behavior (solid line) are shown in Fig. 4A.
Table 1.
Effect of monovalent ionic strength on the persistence length and elastic modulus
| Ionic strength, mM | Inextensible WLC P, Å | Strong stretching limit P, Å | Extensible WLC
|
|
|---|---|---|---|---|
| P, Å | S, pN | |||
| 1.86 | 963 ± 48 | 862 ± 49 | 949 ± 59 | 649 ± 82 |
| 3.72 | 704 ± 36 | 668 ± 32 | 757 ± 25 | 745 ± 100 |
| 5.58 | 605 ± 34 | 629 ± 20 | 767 ± 54 | 476 ± 142 |
| 7.44 | 479 ± 30 | 494 ± 83 | 622 ± 37 | 686 ± 65 |
| 9.30 | 621 ± 83 | 656 ± 97 | 652 ± 27 | 452 ± 35 |
| 18.6 | 523 ± 54 | 521 ± 56 | 529 ± 95 | 532 ± 67 |
| 93.0 | 438 ± 14 | 521 ± 31 | 511 ± 18 | 1,006 ± 2 |
| 186 | 561 ± 31 | 541 ± 33 | 525 ± 124 | 1,401 ± 313 |
| 586 | 451 ± 21 | 472 ± 21 | 559 ± 32 | 1,435 ± 160 |
Results are reported as the mean ± standard error, n ≥ 3.
Figure 4.
Ionic effects on the high-force entropic elastic response of single λ DNA molecules. These molecules display strong-stretching WLC behavior for x ≈ 14–16 μm as denoted by the linear relation between force−1/2 and x. A linear fit of these data yields the contour (Lo) and persistence (P) lengths: (A) 500 mM NaCl, Lo = 16.5 μm, and P = 446 Å; (B) 100 μM MgCl2 + BB, Lo = 16.6 μm, and P = 419 Å; (C) 100 μM putrescine2+ + BB, Lo = 16.6 μm, and P = 560 Å; (D) 5 μM Co(NH3)63+ + BB, Lo = 16.3 μm, and P = 379 Å; and (E) 25 μM spermidine3+ + BB, Lo = 16.5 μm, and P = 443 Å. The data for x < 13 μm were not included in these fits.
Dependence of F–x Curves on Multivalent Cations.
The elastic response of λ DNA molecules in BB with Mg2+, putrescine, spermidine, and Co(NH3)63+ is shown in Fig. 2B. P, Lo, and S were derived from the entropic and enthalpic elastic behavior of λ DNA (Fig. 3B) as explained above. P and S are given in Table 2. Lo values did not differ significantly from those observed in monovalent salt, showing that multivalent cations do not provoke observable secondary structure transitions in λ DNA under the conditions employed here. The di- and trivalent cations strongly reduce P and increase S of λ DNA. As shown in Fig. 4 B–E, strong-stretching WLC behavior is still followed (solid lines) despite the large reductions in P. Multivalent cations also increase the force at which the molecule overstretches, yielding values characteristic of high monovalent salt (Fig. 2B).
Table 2.
Effect of multivalent cations on the persistence length and elastic modulus
| Solution condition | Inextensible WLC P, Å | Strong-stretching limit P, Å | Extensible WLC
|
|
|---|---|---|---|---|
| P, Å | S, pN | |||
| BB | 963 ± 48 | 862 ± 49 | 949 ± 59 | 649 ± 82 |
| 100 μM Mg2+ + BB | 409 ± 37 | 455 ± 74 | 508 ± 103 | 957 ± 203 |
| 100 μM Put2+ + BB | 581 ± 48 | 560 ± 19 | 684 ± 31 | 945 ± 68 |
| 200 μM Put2+ + BB | 329 ± 20 | 341 ± 6 | 309 ± 31 | 1,094 ± 360 |
| 25 μM Spd3+ + BB | 320 ± 18 | 368 ± 75 | 419 ± 47 | 1,006 ± 193 |
| 100 μM Spd3+ + BB | 440 ± 13 | 375 ± 44 | 463 ± 65 | 1,175 ± 141 |
| 2 μM Co(NH3)63+ + BB | 407 ± 48 | 476 ± 126 | 422 ± 1 | 696 ± 183 |
| 5 μM Co(NH3)63+ + BB | 243 ± 18 | 382 ± 101 | 352 ± 32 | 1,144 ± 134 |
| 25 μM Co(NH3)63+ + BB | 299 ± 21 | 177 ± 30 | 265 ± 46 | 1,010 ± 229 |
Results are reported as the mean ± standard error, n ≥ 3. Put, putrescine; Spd, spermidine.
The nonzero force (1–5 pN) observed with 25 μM Co(NH3)63+ and 100 μM spermidine at x < 14 μm (Fig. 3B) is likely to be due to side-by-side association of the DNA which, if unconstrained, would lead to intramolecular collapse. This phenomenon was frequently observed with concentrations of spermidine and Co(NH3)63+ sufficient to condense DNA (20, 21); it was reversible, and could be avoided by keeping the molecule stretched. A nonzero force baseline was added to Eqs. 1 and 2 when fitting these F–x curves. The advantages of single-molecule manipulations are obvious here, as we are able to determine the elastic properties of DNA at concentrations of spermidine and Co(NH3)63+ that would cause condensation in bulk.
Persistence Length
Monovalent Salt Dependence of P.
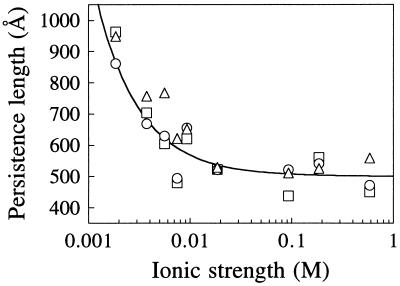
P values tabulated in Table 1 as a function of monovalent ionic strength are plotted in Fig. 5. The three WLC fits (data points in Fig. 5) yield very similar values of P (normally within 10%). Models which incorporate chain extensibility yield essentially the same P as those that do not, probably because the entropic and enthalpic components dominate the elastic behavior of the molecule in different parts of the F–x curve. The nonelectrostatic contribution dominates P at I > 20 mM, in accord with previous experimental determinations using light scattering (22) and flow birefringence (23) with phage DNA, and electro-optical measurements (24) with short (41–256 bp) DNA fragments.
Figure 5.
Dependence of persistence length (P) on monovalent (Na+) ionic strength. Points are from Table 1: □, inextensible WLC; ○, strong-stretching limit; ▵, extensible WLC. Line calculated from Eq. 3 with Po = 500 Å.
Throughout the range of I investigated here, the data are well fit with a nonlinear Poisson–Boltzmann theory for uniformly charged cylinders (12, 13)
 |
3 |
where Po and Pel are the nonelectrostatic and electrostatic contributions to P, 1/κ is the Debye–Hückel screening length, and lB is the Bjerrum length (7.14 Å in water at 25°C for double-stranded DNA). The last equality gives P in Å with I in molar units. The curve in Fig. 5 is drawn with Po = 500 Å; values between 450 and 500 Å fit equally well, in agreement with most previous determinations (25).
Values of P with Multivalent Cations.
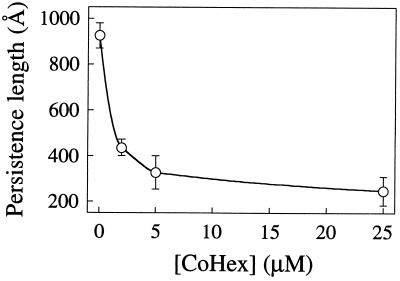
The values of P with Mg2+, putrescine2+, spermidine3+, or Co(NH3)63+ are strikingly lower than those at essentially the same ionic strength but with Na+ as the only cation. Twenty-five micromolar spermidine and 5 μM Co(NH3)63+ are the critical concentrations required to condense DNA under these buffer conditions (20, 21). At these concentrations, P was reduced 2- to 4-fold relative to low monovalent salt buffer. Higher concentrations did not produce significant further reductions. The effects of Co(NH3)63+ on the entropic elasticity are dramatic (Fig. 6): as little as 2 μM Co(NH3)63+ reduced P to roughly the same extent as 100 μM spermidine3+, and the plateau value of P at higher Co(NH3)63+ concentrations is near 250 Å, half the limiting value for monovalent salt. This fact may have some bearing on the efficiency with which Co(NH3)63+ condenses DNA (21) (see below). Mg2+ and putrescine2+ cannot condense DNA in aqueous solution, yet also reduce P by 2- to 3-fold at low ionic strength. We note that Co(NH3)63+ reduces P more strongly than isovalent spermidine, and Mg2+ more than putrescine2+. This is probably due to the central concentration of charge in Co(NH3)63+ and Mg2+ compared with the linear distribution of charges in the polyamines.
Figure 6.
Dependence of persistence length (P) on Co(NH3)63+ (CoHex) concentration for λ DNA in BB. Points and error bars are mean and standard deviations of the P values in Table 2 obtained from fits to the three different WLC models.
These effects of Mg2+, spermidine3+, and Co(NH3)63+ on the entropic elasticity of DNA agree well with those found previously. Electro-optical studies of short DNA fragments showed that 100 μM Mg2+ and 10 μM Co(NH3)63+ reduced P to ≈350 Å and 200 Å, respectively, in low monovalent salt (26). Linear dichroism and viscometry studies of T7 DNA showed that a precondensation spermidine concentration of 20 μM decreased P to ≈445 Å (27). Our result for 100 μM spermidine, ≈430 Å, shows this to be a limiting value, very near the accepted value of Po.
Despite the large alteration of the entropic elasticity by multivalent cations, λ DNA still follows the linear behavior predicted by the strong-stretching limit of the WLC model (Fig. 4 B–E). Changes in the persistence length of a WLC could be due to changes in permanent static bending, thermally induced dynamic bending, or both (28). Although, strictly speaking, our data cannot differentiate between ion-induced changes in static vs. dynamic bending, large permanent bends would probably cause deviations from the behavior predicted by the strong-stretching limit (Eq. 2), and this is not observed (C.B., D. Keller, and S.B.S., unpublished work). Furthermore, site-binding is usually invoked to explain the formation of static bends, yet NMR studies of di- and multivalent cation mobility show most ions are loosely associated with random DNA sequences rather than tightly bound (29–31). We suggest that decreases in P arise mainly from enhanced bending fluctuations skewed toward the concentrated positive charge at sites of transiently associated di- or multivalent counterions. Theory (I. Rouzina and V.A.B., unpublished work) predicts a few transiently associated cations per persistence length, each inducing a bend of ≈20° distributed over 6 bp, would be sufficient to cause the observed decrease in P. Thermal fluctuations result in an ≈4° bend per bp, thus the postulated transient bending is similar in magnitude to thermal bending and should not perturb the B-form helix.
The reduced P caused by multivalent cations will decrease the volume occupied by the DNA coil, enhancing the close packing of DNA and increasing the probability of intrachain contacts through a reduction in search space. However, an increase in DNA flexibility alone will not drive the collapse of DNA, since divalent cations do not produce this effect. Rather, the driving force for DNA collapse must also reside in the ability of a cation to reduce most, but not all, of the DNA phosphate charge while influencing helix hydration (32), helix secondary structure (33), and/or electrostatic attractions through ion correlation (34, 35).
Stretch Elasticity
Dependence of S on Monovalent Salt.
The elastic stretch modulus of single λ DNA molecules in monovalent salt buffer was determined by fitting F–x data to the extensible WLC model, Eq. 2, yielding the S values shown in Table 1. The scatter for individual S values is high (mean SD ≈ 28%), but S clearly decreases as the ionic strength is lowered, a trend opposite to that of P. This presents a surprising contradiction to the predictions of macroscopic elasticity theory for a homogeneous elastic rod. According to that theory (36), if a uniform rod of cross-sectional area A has a stretch modulus of S, then the Young’s modulus E of the material constituting that rod is given by
 |
4 |
The bending rigidity of the rod, B, varies with the Young’s modulus and the cross-sectional area moment of inertia M as
 |
5 |
The persistence length of a WLC is given by P = B/kT (37) so that
 |
6 |
For a cylindrical molecule, A = πr2 and M = πr4/4 and therefore
 |
7 |
Eq. 7 indicates that P and S should vary in the same way with I if r remains approximately constant, while Table 1 shows that they change in opposite directions. Taking a high-salt value for S of 1400 pN from Table 1 and using r = 10 Å gives E = 4.5 × 10⁸ Pa from Eq. 4 and P = 845 Å from Eq. 6, clearly too large for the high-salt case. A typical low-salt value for S of 500 pN would give P = 400 Å by Eq. 7, whereas the geometric persistence length in low salt has increased by electrostatic effects to beyond 800 Å.
Relaxing the assumption that the molecular radius remains constant cannot account for these variations. To make Eq. 7 consistent with the measured S and P values from Table 1 requires that the radius increase from 8 Å at high salt to 16 Å at low salt, a prediction totally at variance with experiment. Fluorescence polarization anisotropy measurements of intercalated ethidium showed that the radius of 48-bp DNA fragments increased by only 0.3 Å between 100 and 20 mM Na+ (38).
The decrease in S with decreasing I implies that, as the ionic strength is lowered, DNA becomes more susceptible to enthalpic elongation. This effect is more complex than a simple increase in electrostatic repulsion among the DNA phosphates. A charged Hookean spring would adopt a longer equilibrium contour length if the ionic strength were reduced, and its spring constant (S value) would also increase. A possible explanation for the decrease of S with I is that at low I there is localized melting in A+T-rich regions. Increases in I would reduce both local melting and intramolecular electrostatic repulsion, thus simultaneously increasing S and decreasing P. Thus it appears that ionic strength effects on S and P reflect different molecular mechanisms, and therefore are not governed by macroscopic elasticity theory.
This is not the first indication that DNA does not behave like a classical macroscopic cylinder. Other evidence comes from a comparison of the bending rigidity and the constant of torsional rigidity C (39). These are related as
 |
8 |
where σ is the Poisson ratio–i.e., the negative of the ratio of radial compression to axial elongation (36). For an incompressible rod, σ = ½, and thermodynamic stability requires −1 < σ < ½. Values of σ < 0 correspond to a thickening of the rod as it is stretched, a behavior unknown in homogeneous, isotropic elastic material. From Eq. 5, B = 2 × 10⁻¹⁹ erg⋅cm at 25°C if P = 500 Å. Values of C vary considerably from one investigation to the next, but are generally in the range 2 × 10⁻¹⁹ to 3.4 × 10⁻¹⁹ erg⋅cm (for reviews see refs. 25 and 40). These values give σ from 0 to −0.4.
Of course, there is no reason to assume that double-stranded DNA, with its external phosphates, internal stacked base pairs, and major and minor grooves, should behave like an isotropic, homogeneous, cylindrical rod. Indeed, its volume and mass are not strictly fixed, since the presence of a spine of hydration may depend on mechanical stress, temperature, or type of salt. But the simple rod assumption is commonly made in modeling DNA behavior, and the results we discuss here are a dramatic illustration of the limitations of this point of view.
S with Multivalent Cations.
Fits to the extensible WLC model show that di- and trivalent cations stabilize the DNA duplex against enthalpic elongation (Table 2). Condensing concentrations of spermidine3+ (≥25 μM) and Co(NH3)63+ (≥5 μM) stabilize λ DNA against elongation as if it were in 50 mM NaCl. Mg2+ and putrescine2+ also increase S to similar levels. These observations parallel results with di- and trivalent cations in DNA melting temperature experiments (41–44), and they support localized melting as a possible explanation for decreases in S as discussed above. Mg2+ and the naturally occurring polyamines may act in vivo to oppose forces which destabilize or melt duplex DNA during supercoiling, replication, and transcription.
Concluding Remarks
Single-molecule methods offer several advantages over bulk studies: (i) The three elastic regimes can be investigated separately, making it possible to distinguish their possibly different molecular origins. (ii) Molecules of different lengths can be studied in a variety of solution conditions at molecular extensions where excluded volume effects, which often complicate the interpretation of bulk experiments (ref. 22 and references therein), may be neglected. (iii) DNA is condensed into compact particles by multivalent cations. In single-molecule experiments the extension of the molecule can be controlled so as to prevent its condensation, making it possible to separate the effects of condensation from changes in the elasticity of DNA induced by these cations. (iv) Manipulations of DNA at molecular extensions that preclude intramolecular contacts can be used, as reported here, to test the competing hypotheses that cation-induced condensation is due to attractive intersegmental free energy arising from electrostatics, hydration, and helix perturbation (17), or from abrupt buckling transitions (14). (v) Condensation of single molecules probably involves loop formation to yield a stable toroidal nucleus. Since this mechanism requires slack in the molecule, it can be prevented by applying external tension. The retractile force seen in Fig. 3B may have been generated when thermal motion created temporary slack, thus enabling loops to form and side-by-side association to occur. Such association acted like a pawl in a ratchet to take up any slack and prevent the reversal of thermal motion. Since the permanent tension generated in the molecule could not have occurred without thermal motion, the constrained condensation behaves as a “thermal ratchet.”
Acknowledgments
We thank Dr. Steven Block for many helpful discussions. This work was supported in part by National Science Foundation Grant MBC 9118482 and National Institutes of Health Grant GM 32543 to C.B., National Institutes of Health Grant GM 28093 to V.A.B., and a National Institutes of Health Traineeship (GM 08277) to C.G.B.
ABBREVIATIONS
- BB
background buffer
- WLC
worm-like chain
References
- 1.Manning G S. Q Rev Biophys. 1978;11:179–246. doi: 10.1017/s0033583500002031. [DOI] [PubMed] [Google Scholar]
- 2.Record M T, Jr, Anderson C F, Lohman T M. Q Rev Biophys. 1978;11:103–178. doi: 10.1017/s003358350000202x. [DOI] [PubMed] [Google Scholar]
- 3.Smith S B, Finzi L, Bustamante C. Science. 1992;258:1122–1126. doi: 10.1126/science.1439819. [DOI] [PubMed] [Google Scholar]
- 4.Strick T R, Allemand J-F, Bensimon D, Bensimon A, Croquette V. Science. 1996;271:1835–1837. doi: 10.1126/science.271.5257.1835. [DOI] [PubMed] [Google Scholar]
- 5.Cluzel P, Lebrun A, Heller C, Lavery R, Viovy J-L, Chatenay D, Caron F. Science. 1996;271:792–794. doi: 10.1126/science.271.5250.792. [DOI] [PubMed] [Google Scholar]
- 6.Smith S B, Cui Y, Bustamante C. Science. 1996;271:795–799. doi: 10.1126/science.271.5250.795. [DOI] [PubMed] [Google Scholar]
- 7.Perkins T T, Smith D E, Larson R G, Chu S. Science. 1995;268:83–87. doi: 10.1126/science.7701345. [DOI] [PubMed] [Google Scholar]
- 8.Bustamante C, Marko J F, Siggia E D, Smith S. Science. 1994;265:1599–1600. doi: 10.1126/science.8079175. [DOI] [PubMed] [Google Scholar]
- 9.Marko J F, Siggia E D. Macromolecules. 1995;28:8759–8770. [Google Scholar]
- 10.Odijk T. Macromolecules. 1995;28:7016–7018. [Google Scholar]
- 11.Wang M D, Yin H, Landick R, Gelles J, Block S M. Biophys J. 1997;72:1335–1346. doi: 10.1016/S0006-3495(97)78780-0. [DOI] [PMC free article] [PubMed] [Google Scholar]
- 12.Odijk T. J Polym Sci Polym Phys Ed. 1977;15:477–483. [Google Scholar]
- 13.Skolnick J, Fixman M. Macromolecules. 1977;10:944–948. [Google Scholar]
- 14.Manning G S. Biopolymers. 1980;19:37–59. doi: 10.1002/bip.1980.360190104. [DOI] [PubMed] [Google Scholar]
- 15.Grosberg A Y, Khokhlov A R. Statistical Physics of Macromolecules. New York: Am. Inst. Phys. Press; 1994. p. 3. , 5, 217–220. [Google Scholar]
- 16.Kovac J, Crabb C C. Macromolecules. 1982;15:537–541. [Google Scholar]
- 17.Bloomfield V A. Curr Opin Struct Biol. 1996;6:334–341. doi: 10.1016/s0959-440x(96)80052-2. [DOI] [PubMed] [Google Scholar]
- 18.Dickerson R E, Drew H R, Conner B N, Wing R M, Fratini A V, Kopka M L. Science. 1982;216:475–485. doi: 10.1126/science.7071593. [DOI] [PubMed] [Google Scholar]
- 19.Saenger W. Principles of Nucleic Acid Structure. New York: Springer; 1984. [Google Scholar]
- 20.Wilson R W, Bloomfield V A. Biochemistry. 1979;18:2192–2196. doi: 10.1021/bi00578a009. [DOI] [PubMed] [Google Scholar]
- 21.Widom J, Baldwin R L. J Mol Biol. 1980;144:431–453. doi: 10.1016/0022-2836(80)90330-7. [DOI] [PubMed] [Google Scholar]
- 22.Sobel E S, Harpst J A. Biopolymers. 1991;31:1559–1564. doi: 10.1002/bip.360311311. [DOI] [PubMed] [Google Scholar]
- 23.Cairney K L, Harrington R E. Biopolymers. 1982;21:923–934. doi: 10.1002/bip.360210506. [DOI] [PubMed] [Google Scholar]
- 24.Porschke D. Biophys Chem. 1991;40:169–179. doi: 10.1016/0301-4622(91)87006-q. [DOI] [PubMed] [Google Scholar]
- 25.Hagerman P J. Annu Rev Biophys Biophys Chem. 1988;17:265–286. doi: 10.1146/annurev.bb.17.060188.001405. [DOI] [PubMed] [Google Scholar]
- 26.Porschke D. J Biomolec Struct Dyn. 1986;4:373–389. doi: 10.1080/07391102.1986.10506356. [DOI] [PubMed] [Google Scholar]
- 27.Baase W A, Staskus P W, Allison S A. Biopolymers. 1984;23:2835–2851. doi: 10.1002/bip.360231210. [DOI] [PubMed] [Google Scholar]
- 28.Schellman J A, Harvey S C. Biophys Chem. 1995;55:95–114. doi: 10.1016/0301-4622(94)00144-9. [DOI] [PubMed] [Google Scholar]
- 29.Rose D M, Polnaszek C F, Bryant R G. Biopolymers. 1982;21:653–664. doi: 10.1002/bip.360210312. [DOI] [PubMed] [Google Scholar]
- 30.Berggren E, Nordenskiöld L, Braunlin W H. Biopolymers. 1992;32:1339–1350. doi: 10.1002/bip.360321008. [DOI] [PubMed] [Google Scholar]
- 31.Wemmer D E, Srivenugopal K S, Reid B R, Morris D R. J Mol Biol. 1985;185:457–459. doi: 10.1016/0022-2836(85)90418-8. [DOI] [PubMed] [Google Scholar]
- 32.Rau D C, Parsegian V A. Biophys J. 1992;61:246–259. doi: 10.1016/S0006-3495(92)81831-3. [DOI] [PMC free article] [PubMed] [Google Scholar]
- 33.Reich Z, Ghirlando R, Minsky A. Biochemistry. 1991;30:7828–7836. doi: 10.1021/bi00245a024. [DOI] [PubMed] [Google Scholar]
- 34.Oosawa F. Polyelectrolytes. New York: Dekker; 1971. [Google Scholar]
- 35.Rouzina I, Bloomfield V A. J Phys Chem. 1996;100:9977–9989. [Google Scholar]
- 36.Landau L D, Lifshitz E M. Theory of Elasticity. Oxford: Pergamon; 1986. [Google Scholar]
- 37.Landau L D, Lifshitz E M. Statistical Physics. Oxford: Pergamon; 1970. [Google Scholar]
- 38.Fujimoto B S, Miller J M, Ribeiro N S, Schurr J M. Biophys J. 1994;67:304–308. doi: 10.1016/S0006-3495(94)80481-3. [DOI] [PMC free article] [PubMed] [Google Scholar]
- 39.Manning G S. Cell Biophys. 1985;7:57–89. doi: 10.1007/BF02788639. [DOI] [PubMed] [Google Scholar]
- 40.Crothers D M, Drak J, Kahn J D, Levene S D. Methods Enzymol. 1992;212:3–29. doi: 10.1016/0076-6879(92)12003-9. [DOI] [PubMed] [Google Scholar]
- 41.Dove W F, Davidson N. J Mol Biol. 1962;5:467–478. [Google Scholar]
- 42.Eichhorn G L, Shin Y A. J Am Chem Soc. 1968;90:7323–7328. doi: 10.1021/ja01028a024. [DOI] [PubMed] [Google Scholar]
- 43.Thomas T J, Bloomfield V A. Biopolymers. 1984;23:1295–1306. doi: 10.1002/bip.360230713. [DOI] [PubMed] [Google Scholar]
- 44.Thomas T J, Kulkarni G D, Greenfield N J, Shirahata A, Thomas T. Biochem J. 1996;319:591–599. doi: 10.1042/bj3190591. [DOI] [PMC free article] [PubMed] [Google Scholar]


