

Abstract
Exposure to rotenone, a widely used pesticide, has been suggested to increase the risk of developing Parkinson’s disease. Studies indicate that the neurotoxicity of rotenone may be related to its ability to generate reactive oxygen species. The present work was conducted to determine to what extent (−)-epigallocatechin-3-gallate (EGCG), a widely-used dietary supplement, modulates the cytotoxicity of rotenone in human neuroblastoma SH-SY5Y cells. Our results indicate that EGCG shows concentration-dependent effects on ROS production and cytotoxicity in SH-SY5Y cells. Treatment of these dopaminergic cells with rotenone (1–50 μM) alone or EGCG (25 or 50 μM) alone caused a significant decrease in cell viability. Pretreatment of SH-SY5Y cells with 25 or 50 μM EGCG potentiated the cytotoxicity of rotenone. The exacerbating effect of EGCG on rotenone toxicity may involve an apoptotic mechanism as shown by the enhancement of caspase-3 activity and activation of other caspases in rotenone-treated SH-SY5Y cells. The potentiating effect of EGCG on rotenone toxicity may be attributed to the enhanced production of intracellular superoxide in SH-SY5Y cells. The enhanced intracellular production of ROS by rotenone-EGCG combination may also account for the increased formation of protein carbonyls in 10,000 × g fraction of SH-SY5Y cells detected by anti-HNE antibody. For instance, core histones and nuclear ribonuclear proteins were identified as major putative in vivo targets of HNE. Our present findings indicate that more detailed mechanistic studies are necessary to fully understand the chemistry of EGCG and to justify its use as potentially health-promoting dietary supplement, e.g. in the prevention of neurodegenerative diseases associated with oxidative stress.
Keywords: Parkinson’s disease, neuroblastoma cells, SH-SY5Y cells, rotenone, EGCG, superoxide, protein carbonyls
1. Introduction
A number of studies suggest that oxidative stress that results in the excess production of reactive oxygen species may be involved in the development of neurodegenerative disorders such as Parkinson’s disease (Mandel et al., 2005; Sayre et al., 2005; Zhang et al., 2000). Rotenone is a complex 1 inhibitor and is one of the common neurotoxic agents used to examine the development of Parkinson’s disease in animal models (Przedborski and Ischiropoulos, 2005). This pesticide increases the formation of ROS and induces toxicity in primary dopaminergic cultures from embryonic mouse mesencephala (Radad et al., 2006), in rat PC12 cells (Wang et al., 2005) and human neuroblastoma SH-SY5Y cells (Molina-Jimenez et al., 2003).
Plant polyphenols are commonly considered as dietary antioxidants and, as such, may protect against neuronal cell injury caused by neurotoxic agents that act via the production of ROS. Indeed, epigallocatechin gallate (EGCG), a major polyphenol in green tea, was found to protect neuronal cells against the cytotoxic effects of 6-hydroxydopamine (Levites et al., 2002a), N-methyl-4-phenyl-1,2,3,6-tetrahydropyridine (MPTP) (Levites et al., 2001), amyloid β peptide (Choi et al, 2001; Levites et al., 2003), N-methyl-D-aspartate (Lee et al., 2004), 3-hydroxykynurenine (Jeong et al., 2004), and hydrogen peroxide (Koh et al., 2004). Possible neuroprotective mechanisms of EGCG not only include simple radical scavenging and metal-chelating properties but also involve cellular mechanisms such as the stimulation of protein kinase C, modulation of cell survival/cell cycle genes (Levites et al., 2002b), inhibition of death signals including GSK-3 (Koh et al., 2004), and modulation of mitochondrial function (Mandel et al., 2005). However, more recently, studies indicated that polyphenolic compounds may have concentration-dependent mode of actions associated with the extent of redox imbalance and cell type (Elbling et al., 2005).
The present work was carried out to determine to what extent EGCG would modulate the cytotoxic effects of rotenone in SH-SY5Y neuroblastoma cells, a commonly used cellular PD model (Molina-Jimenez et al., 2003; Shamoto-Nagai et al, 2003). Our results demonstrate that EGCG exacerbated rather than prevented the cytotoxic and apoptotic effects of rotenone in SH-SY5Y cells.
2. Results
2.1. Cytotoxicity of rotenone and EGCG
Initial experiments were first performed to determine whether rotenone alone or EGCG alone was toxic to human neuroblastoma cells (SH-SY5Y) by measuring LDH in the culture medium. During necrosis or late apoptosis, there is a loss of membrane integrity and LDH is released into the surrounding media. Fig. 1A showed that rotenone significantly increased LDH activity in a dose-dependent manner indicating that this compound caused cytotoxicity in SH-SY5Y cells. In contrast, EGCG showed cytotoxicity only at 50 μM as indicated by the increase in LDH activity. Based on the dose-response data from Fig. 1, the concentrations of 5 and 10 μM rotenone were chosen to evaluate the influence of EGCG on rotenone toxicity in SH-SY5Y cells.
Fig. 1.

LDH activity in culture medium of SH-SY5Y cells exposed to increasing concentrations of rotenone (A) or EGCG (B) for 24 h. The data are expressed as means ± S.E. of 4 experiments. *P < 0.05 versus control (Con) group.
The MTT assay was performed to further assess the toxicity of rotenone and EGCG in SH-SY5Y cells and to determine the influence of EGCG on rotenone toxicity in these cells. This assay is used to measure cell viability and is based on the reduction of MTT to a blue formazan product by dehydrogenase enzymes of intact mitochondria. Thus, unlike the LDH assay, the MTT assay measures mitochondrial function or integrity. The results of the MTT showed that rotenone induce cytotoxicity in SH-SY5Y cells from 1 to 50 μM (Fig. 2A), with no marked differences in the degree of toxicity among the doses used. In the case of EGCG, cell viability measured by the MTT assay was significantly decreased at 25 and 50 μM concentrations (Fig. 2B).
Fig. 2.

Effect of rotenone (A) or EGCG (B) on cell viability. SH-SY5Y cells were treated with increasing concentrations of rotenone or EGCG for 24 h and then cell viability was measured by the MTT assay. The data are expressed as means ± S.E. of 4 experiments. *P < 0.05 versus control (Con) group.
The MTT assay was also used to determine the influence of EGCG on rotenone toxicity in SH-SY5Y cells. Pretreatment with 10, 25 and 50 μM EGCG enhanced the toxicity of 5 μM rotenone (Fig. 3A) or 10 μM rotenone (Fig. 3B). However, at 1 or 5 μM concentrations, EGCG did not modify the cytotoxicity of rotenone as determined by the MTT assay.
Fig. 3.

Effect of EGCG pretreatment on viability of SH-SY5Y cells exposed to 5 μM (A) or 10 μM (B) rotenone. The SH-SY5Y cells were treated with different concentrations of EGCG (0 to 50 μM) for 30 min prior to the addition of rotenone to the culture medium. Twenty-four h following rotenone treatment, cell viability was assessed by the MTT assay. The data are expressed as means ± S.E. of 4 experiments. . #P < 0.05, when cell viability is compared with that of the control (Con) group; *P < 0.05, when cell viability is compared with that of the cells treated with only 5 (A) or 10 μM (B) rotenone (no EGCG pretreatment).
To confirm the enhancing effect of EGCG on rotenone toxicity, SH-SY5Y cells were treated with rotenone alone, EGCG alone or EGCG + rotenone in phenol-red free and serum-free RPMI medium. Unlike EMEM/F12 media which contained 1.5 mM pyruvate, the RPMI medium did not contain pyruvate. Both rotenone (10 μM) and EGCG (25 μM) significantly increased LDH activity whereas a combination of rotenone and EGCG produced a much higher increase in LDH activity than rotenone alone or EGCG alone (Fig. 4).
Fig. 4.

LDH activity in culture medium of SH-SY5Y cells exposed to rotenone (10 μM), EGCG (25 μM), or a combination of rotenone (10 μM) and EGCG (25 μM) for 24 h. The data are expressed as means ± S.E. of 4 experiments. #P < 0.05 versus control (Con) group. *P < 0.05, compared to rotenone- or EGCG-treated group.
2.2. Effect of rotenone and EGCG on caspase-3 activity
The caspase-3 activity of SH-SY5Y cells was measured to determine if EGCG would prevent or enhance rotenone-induced apoptosis in these cells. Rotenone has been reported to induce apoptosis in SH-SY5Y cells as shown by the activation of caspase-3 (Wang et al, 2005; De Sarno et al., 2003; Sanchez-Reus et al., 2005). Fig. 5 shows that rotenone (10 μM) or EGCG (25 μM) significantly increased caspase-3 activity in SH-SY5Y cells. Pretreatment of the cells with 25 μM EGCG markedly enhanced the rotenone-induced increase in caspase-3 activity. The concentration of rotenone (10 μM) used in our study was within the range of rotenone concentrations (5–100 μM) that has shown to induce apoptosis in HL-60 (promyelocytic leukemia) and BJAB cells (B-cell lymphoma) (Tada-Oikawa et al., 2003).
Fig. 5.
Effect of pretreatment with rotenone, EGCG and rotenone plus EGCG on caspase-3 activity of SH-SY5Y cells. The cells were exposed to the rotenone (10 μM) alone, EGCG (25 μM) alone, or rotenone (10 μM) plus EGCG (25 μM) for 24 h before measuring caspase-3 activity of cell lysates using Ac-DEVD-AMC as a substrate. The data are expressed as means ± S.E. of 4 experiments. *P < 0.05 vs. control group.
2.3. Analysis of apoptotic cells by flow cytometry
SH-SY5Y cells undergoing various stages of apoptosis (early, mid-stage and late stage) were analyzed by flow cytometry following staining with SR-VAD-FMK and 7-AAD. Early to mid-stage apoptotic cells are SR-VAD-FMK (+) and 7-AAD (−) whereas late apoptotic cells are SR-VAD-FMK (+) and 7-AAD (+). In contrast, dead cells are SR-VAD-FMK (−) and 7-AAD (+). Based on these criteria, we found that treatment of SH-SY5Y cells with rotenone (10 μM) or EGCG (25 μM) significantly increased the percentage of late stage apoptotic cells (Fig. 6). When cells were treated with both rotenone and EGCG, there was a further increase in late stage apoptotic cells compared to rotenone alone or EGCG alone. No significant difference in early to mid-stage apoptotic cells was observed between control and treated groups (data not shown).
Fig. 6.
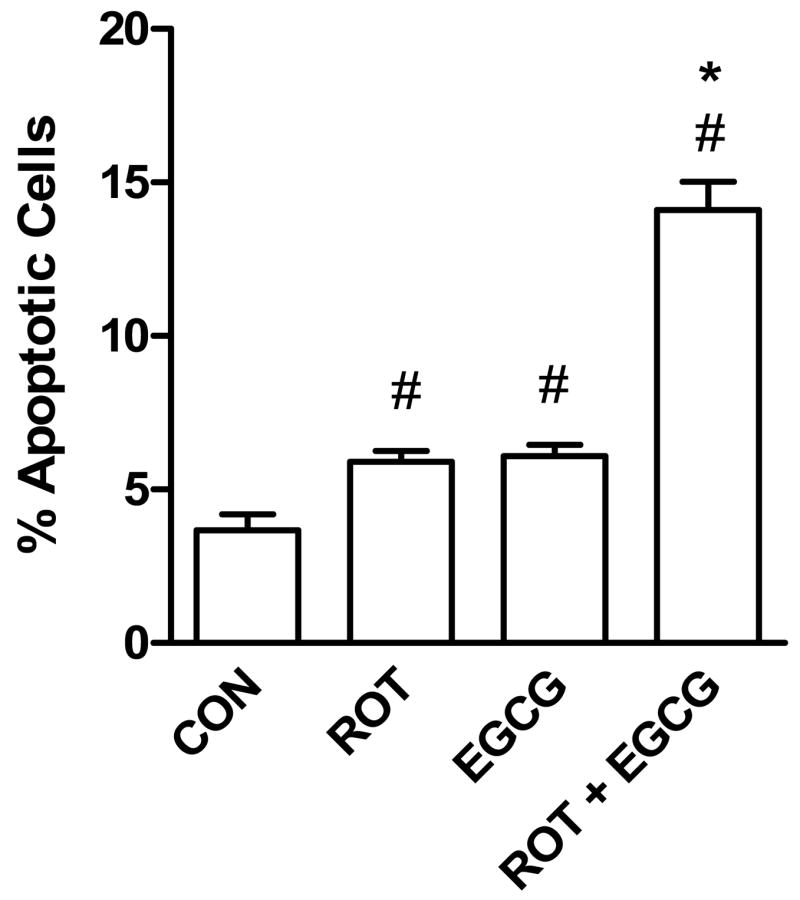
Induction of late apoptosis [SR-VAD-FMK (+) 7-AAD (+)] in SH-SY5Y cells by rotenone (10 μM) alone, EGCG (25 μM) alone, or rotenone (10 μM) plus EGCG (25 μM). The cells were treated by the test compounds for 20 h before measuring apoptosis by flow cytometry. Cells undergoing late apoptosis were identified by positive staining with the fluorescent compounds, SR-VAD-FMK (which binds covalently to activated caspases) and with 7-amino-actinomycin D (7-AAD) which permeates later stage apoptotic and dying cells. The data are expressed as means ± S.E. of 4 experiments. #P < 0.05 versus control (Con) group. *P < 0.05, compared to rotenone- or EGCG-treated group.
2.4. Intracellular superoxide production
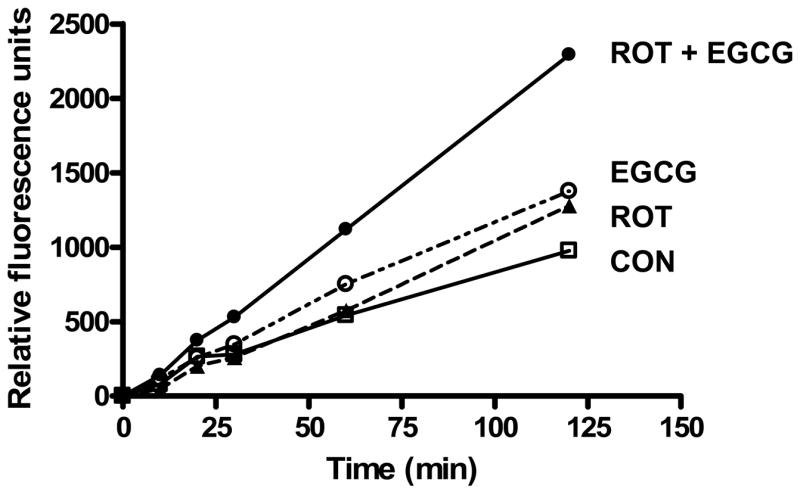
Both rotenone (Molina-Jimenez et al., 2005) and EGCG (Chan et al., 2006) have been reported to induce the intracellular production of superoxide and other ROS. In the present study, we also found that rotenone and EGCG significantly increased superoxide production in SH-SY5Y cells (Fig. 7). When cells were preincubated with EGCG for 30 min prior to rotenone treatment, the intracellular production of superoxide was significantly increased over that of rotenone alone or EGCG alone.
Fig. 7.

Effect of pretreatment with rotenone, EGCG and rotenone plus EGCG on intracellular superoxide anion production in SH-SY5Y cells. The cells, seeded on a 96-well plate, were incubated with rotenone (10 μM), EGCG (25 μM), or rotenone (10 μM) plus EGCG (25 μM) for 20 h prior to the addition of hydroethidine (5 μM). The increase in fluorescence measured at excitation wavelength of 510 nm and emission wavelength of 590 nm was followed over a 4-h period. The data are expressed as means ± S.E. of 4 experiments.
2.5. Extracellular hydrogen peroxide production
Studies have shown that in certain instances, the biological effects of EGCG may be mediated by H2O2 produced in the culture medium (Halliwell et al., 2000 and Halliwell, 2003). Therefore, we determined the concentrations of H2O2 in the culture media obtained from control and treated cells grown in phenol-red free RPMI media with and without 1.5 mM pyruvate. The addition of rotenone (1 to 50 μM) to SH-SY5Y cells fed media with no pyruvate did not cause an increase in the formation of hydrogen peroxide in the culture medium (Table 1). However, the addition of EGCG to the cells fed pyruvate-free media produced a slight increase in the production of H2O2 to a maximum of 1.72 μM, with 50 μM EGCG. Combined treatment of cells with rotenone and EGCG did not cause a further increase in H2O2 production in the culture media. When pyruvate (1.5 mM) was added to the culture medium, the formation of H2O2 in the culture medium induced by 10 or 25 μM EGCG was completely neutralized and H2O2 produced by 50 μM EGCG was significantly reduced.
Table 1.
Effect of EGCG and rotenone on hydrogen peroxide content of culture media.
| Treatment | Hydrogen peroxide (μM)
|
|
|---|---|---|
| No pyruvate media | With 1.5 μM pyruvate media | |
| Control | ND | ND |
| Rotenone | ||
| 1 μM | ND | ND |
| 5 μM | ND | ND |
| 10 μM | ND | ND |
| 25 μM | ND | ND |
| 50 μM | ND | ND |
| EGCG | ||
| 1 μM | ND | ND |
| 5 μM | ND | ND |
| 10 μM | 0.33 ± 0.04 | ND |
| 25 μM | 0.72 ± 0.04 | ND |
| 50 μM | 1.72 ± 0.10 | 0.87 ± 0.03* |
| Rotenone (RT) + EGCG | ||
| 1 μM EGCG + 10 μM RT | ND | ND |
| 5 μM EGCG + 10 μM RT | 0.30 ± 0.04 | ND |
| 10 μM EGCG + 10 μM RT | 0.58 ± 0.04 | ND |
| 25 μM EGCG + 10 μM RT | 0.99 ± 0.04 | ND |
| 50 μM EGCG + 10 μM RT | 1.90 ± 0.03 | 0.5 ± 0.03* |
SH-SY5Y cells were treated with rotenone alone, EGCG alone or a combination of the two in serum-free and phenol-red free RPMI 1640 media. After 24 h of treatment, aliquots of media were analyzed for H2O2 by using the PeroXOquant Quantitative Peroxide Assay Kit (Pierce, Rockford, IL, USA). Each value represents the means ± SE of 4 experiments.
Significantly different from corresponding no pyruvate-containing media, P < 0.05, by Student’s t-test.
2.6. Western blot and tandem mass spectrometric analysis of protein-HNE adducts
We attempted to detect oxidatively-modified proteins in control and treated SH-SY5Y cells using anti-HNE IgG in Western blot analysis and identify these proteins by MALDI-tandem mass spectrometry. In this report we focused on the 10,000g fraction. Several proteins were identified after in-gel trypsin digestion of excised selected bands of sample D (rotenone + EGCG) that matched the immunoreactive bands in the Western blot (Fig. 8). As putative targets of modification by HNE, several nuclear proteins were identified: the polypyrimidine tract-binding protein-associated-splicing factor (gel region 1), the nuclear ribonucleoproteins A3 (gel region 7) and A2/B1 (gel region 8), and the core histones H2, H3 and H4 (gel region 13 and 14). Other proteins, that were assigned as targets of lipid peroxidation products, were the mitochondrial proteins ADP/ATP translocase 3 (gel region 10) and the voltage-dependent anion-selective channel protein 1 (gel region 9), the heat shock protein 90 (gel region 2) and the glutathione transferase P1 (gel region 12). The HNE-positive protein bands appeared to have higher intensities in sample D (rotenone + EGCG) than in sample A (control) in the Western blot in agreement with our findings of increased oxidative stress (intracellular superoxide) in cells with the combined treatment (Fig. 7).
Fig. 8.
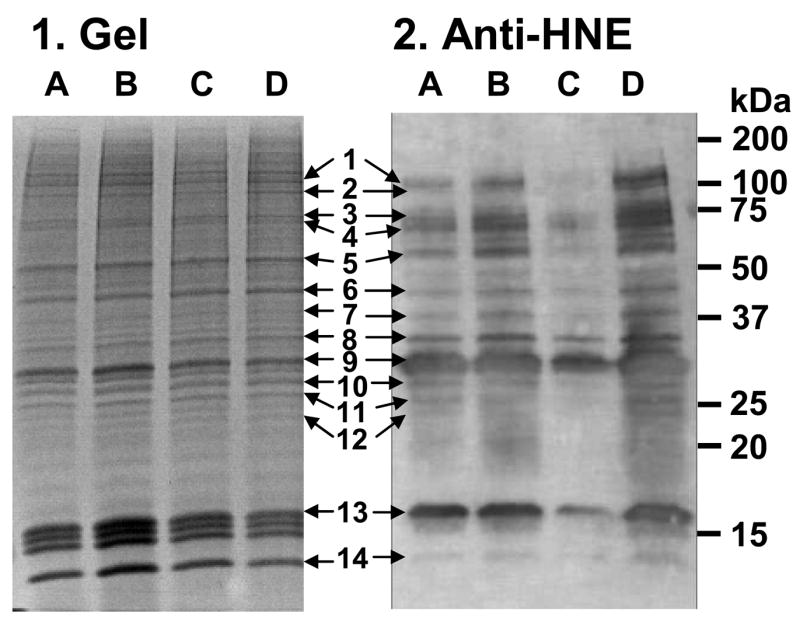
SDS-PAGE and Western blot of crude 10,000g-fractions of SH-SY5Y cells treated with rotenone and/or EGCG for 24 h. Twenty μg of protein were loaded into 12% Tris-HCl gel. The gel (panel 1) was stained with IEF Gel staining solution. The blot (panel 2) was incubated with anti-HNE IgG for detection of immunoreactive bands. A: DMSO, B: 10 μM rotenone, C: 25 μM EGCG, D: EGCG (25 μM) + rotenone (10 μM). The identified proteins in sample D that matched with the Western blot are; 1: Splicing factor, 2: Heat shock protein 90-β, 3: Heat shock protein 71, 4: not assigned, 5: not assigned, 6: β-Actin, 7: Nuclear ribonucleoprotein A3, 8: Nuclear ribonucleoprotein A2/B1, 9: Voltage-dependent anion-selective channel protein 1, 10: ADP/ATP translocase 3, 11: not assigned, 12: Gluthathione S-transferase P, 13: Histone H2B, H2AV, H3.1t, and 14: Histone H4.
3. Discussion
Exposure to certain pesticides has been reported to increase the risk for Parkinson’s disease (Ascherio et al., 2006). In experimental animals, pesticides such as rotenone (Sherer et al., 2003) and paraquat (McCormack et al., 2002) cause dopaminergic degeneration in the substantia nigra and they also accelerate the rate of formation of alpha-synuclein fibrils in vitro (Uversky et al., 2001). The causal mechanisms by which rotenone causes dopaminergic injury are not well understood. The binding of rotenone to the ubiquinone-binding sites of complex 1 stimulates ROS generation which has been associated with its neurotoxicity (Shamoto-Nagai et al., 2003). ROS may induce apoptosis which could partially explain the neurotoxic effects of rotenone in human neuroblastoma SH-SY5Y cells (Wang et al., 2002). Our results confirmed the ability of rotenone to induce toxicity in SH-SY5Y cells as shown by the LDH and MTT assays.
Since oxidative stress may be involved in the neurotoxic action of rotenone (Zhang et al., 2000), we examined the role of the antioxidant, EGCG, in preventing the cytotoxicity of this pesticide in SH-SY5Y cells. We have chosen to examine EGCG as a cytoprotective agent against rotenone-induced toxicity because previous studies (Levites et al., 2001, 2002a, 2003;Choi et al., 2001; Lee et al., 2004; Jeong et al., 2004; Koh et al., 2004; Jung et al., 2007) showed that EGCG protects against oxidative-stress related neuronal cell death or injury. In particular, Koh et al. (2004) reported that EGCG, at 50 to 200 μM, significantly increased cell viability of neuronal-differentiated N18D3 cells exposed to 100 μM H2O2. However, in our present study, we found that EGCG, at 25 or 50 μM, potentiated substantially the toxicity of rotenone in SH-SY5Y cells (Figs. 3A and 3B). This finding may be explained by the ability of EGCG itself to decrease the viability of SH-SY5Y cells (Fig. 2B), confirming the results of Weinreb et al. (2003) who reported an IC50 of 35 μM for EGCG in these cells. Other studies showed that EGCG, at concentrations greater than 10 μM, promotes, rather than prevents, neuronal cell damage induced by 6-hydroxydopamine (Levites et al., 2002a).
Rotenone may induce cell death by apoptosis through various mechanisms, one of which is the activation of caspase-3 (Newhouse et al., 2004). Our results (Fig. 5) showed that rotenone significantly increased caspase-3 activity and that EGCG dramatically enhanced this rotenone-induced activation of caspase-3. The enhanced activation of caspases in apoptotic cells by EGCG-rotenone treatment was confirmed by flow cytometry following staining of the cells with the detection reagents, SR-VAD-FMK and 7-AAD (Fig. 6). EGCG may accentuate mitochondria-mediated apoptosis since caspase-3 is a downstream target of caspase-9 which is involved in the mitochondria-initiated pathway of apoptotic cell death. Das et al. (2006) have previously reported that EGCG may induce apoptosis in SH-SY5Y cells in part by the activation of caspases.
Additional studies are needed to elucidate other mechanisms by which EGCG enhances rotenone toxicity in SH-SY5Y cells. Rotenone has been found to increase intracellular H2O2 and superoxide production in SH-SY5Y cells (Molina-Jimenez et al., 2005) and EGCG has been reported to generate ROS (H2O2 and superoxide) intracellularly in other cell lines such as human promyelocytic leukemic HL60 cells (Elbling et al., 2005), murine RAW 264.7 cells (Elbling et al., 2005) and ovarian cancer cells (Chan et al., 2006). In our study, we showed that treatment of SH-SY5Y cells with a combination of rotenone and EGCG cause an increase in the intracellular superoxide greater than that elicited by rotenone alone or EGCG alone. This enhancement of superoxide production by the combined treatment may have led to a greater production of intracellular ROS to induce greater apoptosis in cells exposed to the two compounds.
EGCG, at high concentrations (0.1–1 mM), has been shown to induce the production of H2O2 by interacting with cell culture media, in the absence of cells (Long et al., 2000). Halliwell et al. (2000) and Halliwell (2003) have suggested that the effects of EGCG on cells may be due to artefactual formation of H2O2 in the culture media arising from the oxidation of EGCG. Therefore, we measured the formation of H2O2 in the culture medium containing EGCG and/or rotenone. There was a minimal increase in H2O2 production in the culture media after a 24-h incubation of SH-SY5Y cells with EGCG (Table 1). The increase in H2O2 formation induced by low concentrations of EGCG (10 or 25 μM) was completely abolished by the inclusion of pyruvate in the culture media. This finding confirms the previous observation that pyruvate neutralized the EGCG-induced formation of H2O2 in the culture media (Chan et al., 2006). Pyruvate is a potent scavenger of H2O2 and suppresses superoxide production by submitochondrial particles (Wang et al., 2007). Pyruvate (0.5 mM) present in 1:1 mixture of Dulbecco’s Minimum Essential and Ham’s F-12 media has been shown to accelerate the disappearance of exogenous H2O2 (200 μM) in culture media with or without cells (Giandomenico et al., 1997). Thus, the exacerbating effect of EGCG on rotenone toxicity in SH-SY5Y cells is unlikely related to the artifactual formation of H2O2 in the culture medium from the autoxidation of EGCG as reported in other cell culture studies (Halliwell et al., 2000).
Oxidative stress may lead to the generation of lipid peroxidation products (LPOs) such as HNE that may bind to nucleophilic sites of proteins by Michael addition (Chavez et al., 2006). Fig. 8 shows that anti-HNE antibody recognized proteins in SH-SY5Y cells providing evidence that HNE protein adducts were formed in these cells. Treatment with a combination of rotenone and EGCG caused an increase in the intensity of these immunoreactive bands suggesting enhanced formation of HNE-protein adducts in the treated cells. Increased formation of HNE-protein adducts is consistent with the enhanced production of ROS in cells treated by the rotenone-EGCG combination. In the 10,000g-fraction used in the Western blot analysis, nuclear (histones and ribonuclear proteins), mitochondrial (ADP/ATP translocase 3, voltage-dependent anion-selective channel protein 1 and the heat shock protein 90), and cytosolic (glutathione transferase P) proteins were identified as putative proteins recognized by the anti-HNE antibody. Histone carbonylation in PC 12 cells was previously reported by Wondrak et al. (2000). Carbonylation of nuclear proteins may have important implications for chromatin integrity and more studies will be required to shed light on the diverse chemical mechanisms and the extent of carbonylation reactions. In order to identify unique HNE-conjugated peptides in the proteins detected by the anti-HNE antibody enrichment procedures using affinity chromatography in combination with mass spectrometry will be needed (Chavez et al., 2006).
In conclusion, the results of our present study suggest that EGCG, at least at higher concentrations, e.g. 25 μM, does not protect against neuronal damage induced by rotenone but rather enhance the neurotoxicity of this pesticide. The mechanisms for the potentiating effect of EGCG on rotenone toxicity may involve an enhancement of apoptosis and intracellular production of superoxide. These findings may have important implications in the use of large doses of EGCG for the prevention of neurodegenerative diseases such as Parkinson’s disease associated with exposure to rotenone and other neurotoxic pesticides.
4. Experimental procedures
4.1. Chemicals
Rotenone, EGCG, MTT, sodium pyruvate, and NADH were purchased from Sigma (St. Louis, MO, USA). N-acetyl-Asp-Glu-Val-Asp-AMC (7-amino-4-methylcoumarin) (Ac-DEVD-AMC) was obtained from EMD Biosciences, Inc. (San Diego, CA, USA). SH-SY5Y cells and tissue culture media, Eagle’s Minimum Essential Medium (EMEM and F-12K Medium (Kaighn’s Modification of Ham’s F-12 Medium), were purchased from the American Type Culture Collection (ATCC), Manassas, VA, USA. Heat-inactivated fetal bovine serum (FBS), phenol red-free RPMI 1640, streptomycin, penicillin and trypsin-EDTA were obtained from Invitrogen Corporation (Carlsbad, CA, USA). The cell culture plates and culture flasks (75 cm2) were purchased from BD Biosciences, San Jose, CA, USA.
4.2. Cell culture of SH-SY5Y cells
SH-SY5Y cells were initially grown in1:1 mixture of EMEM and F12K Medium supplemented with 10% fetal 100 U/ml penicillin, and 100 μg/ml streptomycin in a 75 cm2 vented culture flask. In separate experiments, SH-SY5Y cells were grown in phenol red-free RPMI-1640 medium containing 10% FBS, 1% MEM non-essential amino acids, penicillin and streptomycin. The cultures were incubated at 37°C in 5% CO2/95% humidified air. When cells had reached 80–90% confluence in the flask, they were trypsinized and seeded onto 96-well plates or 6-well plates.
4.3. LDH and MTT assays
The LDH (lactate dehydrogenase) and MTT [3-(4,5-dimethylthiazol-2-yl)-2,5-diphenyltetrazolium bromide] assays were used to measure cell membrane integrity and cell viability, respectively, following treatment with EGCG and/or rotenone. SH-SY5Y cells, seeded in 96-well plates, were exposed to various concentrations of EGCG or rotenone alone in serum-free EMEM/F12 or RPMI 1640 media for 24 h. The media collected from the control (vehicle-treated) and treated wells were centrifuged at 10,000 × g for 10 min to remove floating cells and aliquots of the supernatants were used for the LDH assay using a 96-well plate. The reaction mixture consisted of 50 mM phosphate buffer, pH 7.4, 1 mM pyruvate and 0.2 mM NADH in a total volume of 0.2 ml/well. The oxidation of NADH was followed kinetically by measuring the change in absorbance at 340 nm over 5 min at 25°C.
In the MTT assay, the cells were grown in 96-well plates and exposed to EGCG and/or rotenone. After 24 h, the media was replaced with fresh media containing MTT (0.5 mg/ml). After an additional 3-h incubation at 37°C, the MTT-containing media was removed. Isopropanol containing 0.04 N HCl (200 μl) was then added to each well and the plate was shaken for 10 min to dissolve the formazan product. The absorbance at 570 nm of the formazan product was determined using a microplate reader (SpectraMax 250, Molecular Devices, Sunnyvale, CA, USA). The viability of SH-SY5Y cells in each well was expressed as the percentage of control (untreated) cells.
The effect of EGCG on the cytotoxicity of rotenone was determined by pretreating the SH-SY5Y cells with different concentrations of EGCG for 30 min and then rotenone (5 or 10 μM) was added to the cells. Twenty-four h after rotenone treatment, LDH and MTT assays were performed as described above.
4.4. Caspase-3 activity
Caspase-3 activity in culture was measured using the caspase-3 substrate, Ac-DEVD-AMC. Briefly, control and treated cells grown in 6-well plates were rinsed twice with Dulbecco’s phosphate-buffered saline (PBS) and transferred to microtubes using a cell scraper. The cells were sonicated in caspase-3 buffer (25 mM HEPES, pH 7.4, 10% glycerol, and 1 mM EDTA) and then centrifuged at 10,000 g for 5 min. The caspase-3 activity of the supernatant fraction was determined by incubating an aliquot equivalent to 20 μg of protein with Ac-DEVD-AMC in caspase-3 buffer in a total volume of 0.2 ml in a 96-well plate at room temperature. The increase in fluorescence intensity (excitation at 380 nm and emission at 460 nm) with time was measured using a microplate fluorescence reader (SpectraMax Gemini, Molecular Devices, Sunnyvale, CA).
4.5. Analysis of apoptotic cells by flow cytometry
The different stages of apoptosis in control and treated SH-SY5Y cells were analyzed by flow cytometry using the MultiCaspase Detection kit according to the manufacturer’s directions (Guava Technologies, Hayward, CA). This detection kit contains sulforhodamine-valyl-alanyl-aspartyl-fluoromethyl-ketone (SR-VAD-FMK), and 7-amino-actinomycin D (7-AAD). (SR-VAD-FMK) binds covalently to activated caspases in apoptotic cells whereas 7-AAD permeates late apoptotic and dying cells but not live, healthy and early to mid-stage apoptotic cells. In this assay, SH-SY5Y cells were seeded in 6-well plates and with treated with rotenone (10 μM), EGCG (25 μM), or rotenone (10 μM) plus EGCG (25 μM) for 20 h. Cells were harvested using trypsin and then stained first with SR-VAD-FMK, followed by staining with 7-AAD before analysis by flow cytometry.
4.6. Measurement of superoxide anion production
Hydroethidine was used to evaluate the intracellular production of superoxide. The cells, seeded on a 96-well plate, were incubated with rotenone (10 μM), EGCG (25 μM), or rotenone (10 μM) plus EGCG (25 μM) for 20 h. The cells were washed with phenol red-free RPMI and then hydroethidine (5 μM) was added to the cells. The increase in red fluorescence as a result of the oxidation of hydroethidine by superoxide was measured in a fluorescence plate reader (SpectraMax Gemini) at excitation wavelength of 510 nm and emission wavelength of 590 nm at 30 min-intervals over a 4-h period.
4.7. Determination of H2O2 in culture media
SH-SY5Y cells were treated with increasing concentrations of rotenone or EGCG, alone, or in combination, in phenol red-free RPMI medium in the presence and absence of 1.5 mM pyruvate. After 24 h, aliquots of the culture media were analyzed for H2O2 by the PeroXOquant Quantitative Peroxide Assay Kit (Pierce, Rockford, IL, USA). This assay is based on the oxidation of ferrous to ferric iron by hydroperoxides in the presence of xylenol orange. Various concentrations of H2O2 were used to generate a standard curve for estimating the H2O2 concentrations of the culture media.
4.8. Immunodetection of protein-bound HNE
SH-SY5Y cells seeded in 75 cm2 flasks were treated with 10 μM rotenone or 25 μM EGCG for 24 h. Other cells were preincubated with 25 μM EGCG for 30 min prior to incubation with 10 μM rotenone for 24 h. Cells were harvested using a cell scraper and lysed by freeze-thaw cycles and sonication. The lysed cells were centrifuged at 900 × g for 3 min to remove nuclei and unbroken cells and the resulting supernatant was centrifuged at 10,000 × g for 10 min. The 10K pellet was resuspended in PBS for Western blot analysis. The proteins (20 μg) were mixed with Laemmli sample buffer (Bio-Rad cat. no. 161-0737), heated at 95°C for 5 min, and then loaded onto a 10-well 12% Tris-HCl gel (Bio-Rad Cat. no. 161-1102) with SDS-PAGE molecular marker (Bio-Rad, 161-0363). After electrophoresis, the proteins were transferred to a nitrocellulose membrane and blocked with 5% non-fat milk in TBS (Tris-buffered saline) for 1 h at room temperature. The membrane was probed with anti-HNE IgG (Oxis International, Inc.). The membrane was washed 6 times with TBS-T (TBS with 0.1% tween-20) and then incubated with goat anti-mouse IgG-HRP conjugate. After washing, the membrane was incubated with SuperSignal West Pico Chemiluminescent Substrate (Pierce) for 5 min. The HNE-positive bands were then visualized on X-ray film.
4.9. Identification of immunoreactive proteins in SH-SY5Y cells by tandem mass spectrometry
To identify the proteins recognized by anti-HNE antibody, a parallel gel was stained with IEF gel staining solution (Bio-Rad, 161-0434) for 2 h at room temperature. The gel was destained with 40% methanol-10% acetic acid. The bands of interest were excised. The protein bands were digested with trypsin and desalted with Ziptip C18 (Millipore, ZTC18S096). The extracted peptides were analyzed by tandem mass spectrometry using a MALDI-ToF/ToF instrument (Applied Biosystem, 4700 Proteome Analyzer, Foster City, CA) as described by Chavez et al. (2006). Mascot software (Matrix Science, London, UK) was used to aid in the interpretation of tandem mass spectral data. Trypsin was selected as the digesting enzyme allowing for the possibility of up to one missed cleavage site. The following variable peptide modifications were allowed: carbamidomethyl (C), phosphorylation (STY) and oxidation of methionine (M).
4.10. Statistical analysis
All values are expressed as mean ± S.E.M. Statistical analysis was carried out using Student’s t-test for comparisons between two groups, with P-values less than 0.05 considered significant.
Table 2.
Mass spectrometry data of proteins identified in the gel regions 1 to 14 (Fig. 8).
| Region No. | Proteins | Mass | pI | Sequence coverage | Peptide No. | Mascot scorea |
|---|---|---|---|---|---|---|
| 1. | Splicing factor (SFPQ_HUMAN) | 76,102 | 9.45 | 11% | 4 | 166 |
| Peptides | Start-end | Observed Mr. | Mascot score | |||
| QHHPPYHQQHHQGPPPGGPGGR | 246 – 267 | 2403.13 | 26 | |||
| LFVGNLPADITEDEFKR | 299 – 315 | 1964.01 | 47 | |||
| NLSPYVSNELLEEAFSQFGPIER | 377 – 399 | 2639.29 | 34 | |||
| FAQHGTFEYEYSQR | 480 – 493 | 1762.79 | 54 | |||
| 2. | Heat shock protein 90β (HS90B_HUMAN) | 83,212 | 4.97 | 5% | 3 | 84 |
| HNDDEQYAWESSAGGSFTVR | 149 – 168 | 2255.90 | 25 | |||
| HFSVEGQLEFR | 320 – 330 | 1348.64 | 29 | |||
| ALLFIPR | 331 – 337 | 829.51 | 30 | |||
| 3. | Heat shock protein 71 (HSP7C_HUMAN) | 70,854 | 5.37 | 8% | 3 | 112 |
| TVTNAVVTVPAYFNDSQR | 138 – 155 | 1981.95 | 28 | |||
| FEELNADLFR | 302 – 311 | 1253.60 | 51 | |||
| QTQTFTTYSDNQPGVLIQVYEGER | 424 – 447 | 2774.25 | 33 | |||
| 4. | Not assigned | |||||
| 5. | Not assignedb | |||||
| 6. | β-Actin (ACTA_HUMAN) | 41,710 | 5.29 | 20% | 6 | 324 |
| AGFAGDDAPR | 19 – 28 | 976.47 | 32 | |||
| AVFPSIVGR | 29 – 37 | 945.58 | 41 | |||
| VAPEEHPVLLTEAPLNPK | 96 – 113 | 1954.09 | 48 | |||
| GYSFTTTAER | 197 – 206 | 1132.55 | 34 | |||
| SYELPDGQVITIGNER | 239 – 254 | 1790.92 | 83 | |||
| QEYDESGPSIVHR | 360 – 372 | 1516.74 | 86 | |||
| 7 | 1) Nuclear ribonucleoprotein A3 (ROA3_HUMAN) | 39,571 | 9.10 | 8% | 2 | 106 |
| IFVGGIKEDTEEYNLR | 128 – 143 | 1883.00 | 49 | |||
| GFAFVTFDDHDTVDK | 168 – 182 | 1713.81 | 36 | |||
| 2) Nuclear ribonucleoproteins C1/C2 (HNRPC_HUMAN) | 33,650 | 4.95 | 6% | 2 | 92 | |
| GFAFVQYVNER | 51 – 61 | 1329.65 | 47 | |||
| VPPPPPIAR | 143 – 151 | 943.56 | 45 | |||
| 8. | Nuclear ribonucleoproteins A2/B1 (ROA2_HUMAN) | 37,407 | 8.97 | 26% | 6 | 358 |
| KLFIGGLSFETTEESLR | 22 – 38 | 1927.06 | 39 | |||
| LFIGGLSFETTEESLR | 23 – 38 | 1798.97 | 74 | |||
| NYYEQWGK | 39 – 46 | 1087.52 | 47 | |||
| GFGFVTFDDHDPVDK | 154 – 168 | 1695.81 | 95 | |||
| GGGGNFGPGPGSNFR | 214 – 228 | 1377.67 | 64 | |||
| NMGGPYGGGNYGPGGSGGSGGYGGR | ||||||
| Oxidation (M) | 326 – 350 | 2205.95 | 39 | |||
| 9. | Voltage-dependent anion-selective channel protein 1 (VDAC1_HUMAN) | 30,754 | 8.62 | 10% | 2 | 117 |
| WTEYGLTFTEK | 64 – 74 | 1374.66 | 32 | |||
| WNTDNTLGTEITVEDQLAR | 75 – 93 | 2176.05 | 85 | |||
| 10. | ADP/ATP translocase 3 (ADT3_HUMAN | 32,845 | 9.76 | 12% | 4 | 127 |
| EQGVLSFWR | 64 – 72 | 1121.58 | 47 | |||
| GNLANVIR | 73 – 80 | 856.49 | 28 | |||
| YFPTQALNFAFK | 81 – 92 | 1446.73 | 27 | |||
| GAWSNVLR | 273 – 280 | 902.49 | 25 | |||
| 11. | Not assigned | |||||
| 12. | Glutathione S-transferase P (GSTP1_HUMAN) | 23,341 | 5.43 | 12% | 2 | 101 |
| PPYTVVYFPVR | 2 – 12 | 1337.73 | 53 | |||
| FQDGDLTLYQSNTILR | 56 – 71 | 1883.94 | 48 | |||
| 13. | 1)Histone H2B (H2B1D_HUMAN) | 13,928 | 10.31 | 33% | 5 | 198 |
| QVHPDTGISSK | 48 – 58 | 816.46 | 43 | |||
| AMGIMNSFVNDIFER Oxidation (M) | 59 – 73 | 1159.82 | 31 | |||
| AMGIMNSFVNDIFER 2 Oxidation (M) | 59 – 73 | 1175.82 | 54 | |||
| EIQTAVR | 94 – 100 | 816.46 | 43 | |||
| LLLPGELAK | 101 – 109 | 953.61 | 27 | |||
| 2)Histone H2AV (H2AV_HUMAN) | 13,501 | 10.58 | 12% | 2 | 91 | |
| AGLQFPVGR | 35 – 43 | 944.56 | 32 | |||
| HLQLAIR | 86 – 92 | 850.55 | 59 | |||
| 3)Histone H3.1t (H31T_HUMAN) | 15,499 | 11.13 | 11% | 2 | 71 | |
| YRPGTVALR | 42 – 50 | 1032.61 | 31 | |||
| STELLIR | 58 – 64 | 831.51 | 40 | |||
| 14. | Histone H4 (H4_HUMAN) | 11,360 | 11.36 | 29% | 3 | 170 |
| DNIQGITKPAIR | 25 – 36 | 1325.76 | 45 | |||
| ISGLIYEETR | 47 – 56 | 1180.63 | 66 | |||
| VFLENVIR | 61 – 68 | 989.59 | 59 | |||
Tandem mass spectra that obtained Mascot scores of 30 or high were considered as “high confident” identifications; spectra that obtained scores between 25 and 29 were considered as tentative identifications and were only listed if at least one other peptide of the same protein was identified.
tentatively identified as Tubulin beta-2A chain (TBB2A_HUMAN) by peptide aa 242–251, FPGQLNADLR, Mascot score 43.
Acknowledgments
This research was supported in part by the Oregon Agricultural Research Foundation and the National Institute on Aging (AG025372). The authors acknowledge the use of the Mass Spectrometry facility and the Cell Culture facility of the Environmental Health Sciences Center supported by the National Institutes of Health grant ES00210.
Footnotes
Publisher's Disclaimer: This is a PDF file of an unedited manuscript that has been accepted for publication. As a service to our customers we are providing this early version of the manuscript. The manuscript will undergo copyediting, typesetting, and review of the resulting proof before it is published in its final citable form. Please note that during the production process errors may be discovered which could affect the content, and all legal disclaimers that apply to the journal pertain.
References
- Ascherio A, Chen H, Weisskopf MG, O’reilly E, McCullough MI, Calle EE, Schwarzschild MA, Thun MJ. Pesticide exposure and risk for Parkinson’s disease. Ann Neurol. 2006;60:197–203. doi: 10.1002/ana.20904. [DOI] [PubMed] [Google Scholar]
- Chan MM, Soprano KJ, Weinstein K, Fong D. Epigallocatechin-3-gallate delivers hydrogen peroxide to induce death of ovarian cancer cells and enhances their cisplatin susceptibility. J Cell Physiol. 2006;207:389–396. doi: 10.1002/jcp.20569. [DOI] [PubMed] [Google Scholar]
- Chavez J, Wu J, Han B, Chung WG, Maier CS. New role for an old probe: affinity labeling of oxylipid protein conjugates by N′-aminooxymethylcarbonylhydrazino D-biotin. Anal Chem. 2006;78:6847–6854. doi: 10.1021/ac0607257. [DOI] [PubMed] [Google Scholar]
- Choi YT, Jung CH, Lee SR, Bae JH, Baek WK, Suh MH, Park J, Park CW, Suh SI. The green tea polyphenol (−)-epigallocatechin gallate attenuates beta-amyloid-induced neurotoxicity in cultured hippocampal neurons. Life Sci. 2001;70:603–614. doi: 10.1016/s0024-3205(01)01438-2. [DOI] [PubMed] [Google Scholar]
- Das A, Banik NL, Ray SK. Mechanism of apoptosis with the involvement of calpain and caspase cascades in human malignant neuroblastoma SH-SY5Y cells exposed to flavonoids. Int J Cancer. 2006;119:2575–2585. doi: 10.1002/ijc.22228. [DOI] [PubMed] [Google Scholar]
- De Sarno P, Shestopal SA, King TD, Zmijewska A, Song L, Jope RS. Muscarinic receptor activation protects cells from apoptotic effects of DNA damage, oxidative stress, and mitochondrial inhibition. J Biol Chem. 2003;278:11086–11093. doi: 10.1074/jbc.M212157200. [DOI] [PMC free article] [PubMed] [Google Scholar]
- Elbling L, Weiss RM, Teufelhofer O, Uhl M, Knasmueller S, Schulte-Hermann R, Berger W, Micksche M. Green tea extract and (−)-epigallocatechin-3-gallate, the major tea catechin, exert oxidant but lack antioxidant activities. FASEB J. 2005;19:807–809. doi: 10.1096/fj.04-2915fje. [DOI] [PubMed] [Google Scholar]
- Giandomenico AR, Cerniglia GE, Biaglow JE, Stevens CW, Koch CJ. The importance of sodium pyruvate in assessing damage produced by hydrogen peroxide. Free Radic Biol Med. 1997;23:426–434. doi: 10.1016/s0891-5849(97)00113-5. [DOI] [PubMed] [Google Scholar]
- Halliwell B. Oxidative stress in cell culture: an under-appreciated problem? FEBS Lett. 2003;540:3–6. doi: 10.1016/s0014-5793(03)00235-7. [DOI] [PubMed] [Google Scholar]
- Halliwell B, Clement MV, Ramalingam J, Long LH. Hydrogen peroxide. Ubiquitous in cell culture and in vivo? IUBMB Life. 2000;50:251–257. doi: 10.1080/713803727. [DOI] [PubMed] [Google Scholar]
- Jeong JH, Kim HJ, Lee TJ, Kim MK, Park ES, Choi BS. Epigallocatechin 3-gallate attenuates neuronal damage induced by 3-hydroxykynurenine. Toxicology. 2004;195:53–60. doi: 10.1016/j.tox.2003.08.007. [DOI] [PubMed] [Google Scholar]
- Jung JY, Han CR, Jeong YJ, Kim HJ, Lim HS, Lee KH, Park HO, Oh WM, Kim SH, Kim WJ. Epigallocatechin gallate inhibits nitric oxide-induced apoptosis in rat PC12 cells. Neurosci Lett. 2007;411:222–227. doi: 10.1016/j.neulet.2006.09.089. [DOI] [PubMed] [Google Scholar]
- Koh SH, Kwon H, Kim KS, Kim J, Kim MH, Yu HJ, Kim M, Lee KW, Do BR, Jung HK, Yang KW, Appel SH, Kim SH. Epigallocatechin gallate prevents oxidative-stress-induced death of mutant Cu/Zn-superoxide dismutase (G93A) motorneuron cells by alteration of cell survival and death signals. Toxicology. 2004;202:213–225. doi: 10.1016/j.tox.2004.05.008. [DOI] [PubMed] [Google Scholar]
- Lee H, Bae JH, Lee SR. Protective effect of green tea polyphenol EGCG against neuronal damage and brain edema after unilateral cerebral ischemia in gerbils. J Neurosci Res. 2004;77:892–900. doi: 10.1002/jnr.20193. [DOI] [PubMed] [Google Scholar]
- Levites Y, Weinreb O, Maor G, Youdim MBH, Mandel S. Green tea polyphenol (−)-epigallocatechin-3-gallate prevents N-methyl-4-phenyl-1,2,3,6-tetrahydropyridine-induced dopaminergic neurodegeneration. J Neurochem. 2001;78:1073–1082. doi: 10.1046/j.1471-4159.2001.00490.x. [DOI] [PubMed] [Google Scholar]
- Levites Y, Youdim MBH, Maor G, Mandel S. Attenuation of 6-hydroxydopamine (6-OHDA)-induced nuclear factor-kappaB (NF-kappaB) activation and cell death by tea extracts in neuronal cultures. Biochem Pharmacol. 2002a;63:21–29. doi: 10.1016/s0006-2952(01)00813-9. [DOI] [PubMed] [Google Scholar]
- Levites Y, Amit T, Youdim MB, Mandel S. Involvement of protein kinase C activation and cell survival/cell cycle genes in green tea polyphenol (−)-epigallocatechin 3-gallate neuroprotective action. J Biol Chem. 2002b;277:30574–30580. doi: 10.1074/jbc.M202832200. [DOI] [PubMed] [Google Scholar]
- Levites Y, Amit T, Mandel S, Youdim MB. Neuroprotection and neurorescue against Abeta toxicity and PKC-dependent release of nonamyloidogenic soluble precursor protein by green tea polyphenol (−)-epigallocatechin-3-gallate. FASEB J. 2003;17:952–954. doi: 10.1096/fj.02-0881fje. [DOI] [PubMed] [Google Scholar]
- Long LH, Clement MV, Halliwell B. Artifacts in cell culture: rapid generation of hydrogen peroxide on addition of (−)-epigallocatechin, (−)-epigallocatechin gallate, (+)-catechin, and quercetin to commonly used cell culture media. Biochem Biophys Res Commun. 2000;273:50–53. doi: 10.1006/bbrc.2000.2895. [DOI] [PubMed] [Google Scholar]
- Mandel SA, Avramovich-Tirosh Y, Reznichenko L, Zheng H, Weinreb O, Amit T, Youdim MB. Multifunctional activities of green tea catechins in neuroprotection. Modulation of cell survival genes, iron-dependent oxidative stress and PKC signaling pathway. Neurosignals. 2005;14:46–60. doi: 10.1159/000085385. [DOI] [PubMed] [Google Scholar]
- McCormack AL, Thiruchelvam M, Manning-Bog AB, Thiffault C, Langston JW, Cory-Slechta DA, Di Monte DA. Environmental risk factors and Parkinson’s disease: selective degeneration of nigral dopaminergic neurons caused by the herbicide paraquat. Neurobiol Dis. 2002;10:119–127. doi: 10.1006/nbdi.2002.0507. [DOI] [PubMed] [Google Scholar]
- Molina-Jimenez MF, Sanchez-Reus MI, Benedi J. Effect of fraxetin and myricetin on rotenone-induced cytotoxicity in SH-SY5Y cells: comparison with N-acetylcysteine. Eur J Pharmacol. 2003;472:81–87. doi: 10.1016/s0014-2999(03)01902-2. [DOI] [PubMed] [Google Scholar]
- Molina-Jimenez MF, Sanchez-Reus MI, Cascales M, Andres D, Benedi J. Effect of fraxetin on antioxidant defense and stress proteins in human neuroblastoma cell model of rotenone neurotoxicity. Comparative study with myricetin and N-acetylcysteine. Toxicol Appl Pharmacol. 2005;209:214–225. doi: 10.1016/j.taap.2005.04.009. [DOI] [PubMed] [Google Scholar]
- Newhouse K, Hsuan SL, Chang SH, Cai B, Wang Y, Xia Z. Rotenone-induced apoptosis is mediated by p38 and JNK MAP kinases in human dopaminergic SH-SY5Y cells. Toxicol Sci. 2004;79:137–146. doi: 10.1093/toxsci/kfh089. [DOI] [PubMed] [Google Scholar]
- Przedborski S, Ischiropoulos H. Reactive oxygen and nitrogen species: weapons of neuronal destruction in models of Parkinson’s disease. Antioxid Redox Signal. 2005;7:685–693. doi: 10.1089/ars.2005.7.685. [DOI] [PubMed] [Google Scholar]
- Radad K, Rausch WD, Gille G. Rotenone induces cell death in primary dopaminergic culture by increasing ROS production and inhibiting mitochondrial respiration. Neurochem Int. 2006;49:379–386. doi: 10.1016/j.neuint.2006.02.003. [DOI] [PubMed] [Google Scholar]
- Sanchez-Reus MI, Peinado II, Molina-Jimenez MF, Benedi J. Fraxetin prevents rotenone-induced apoptosis by induction of endogenous glutathione in human neuroblastoma cells. Neurosci Res. 2005;53:48–56. doi: 10.1016/j.neures.2005.05.009. [DOI] [PubMed] [Google Scholar]
- Sayre LM, Moreira PI, Smith MA, Perry G. Metal ions and oxidative protein modification in neurological disease. Ann Ist Super Sanita. 2005;41:143–164. [PubMed] [Google Scholar]
- Shamoto-Nagai M, Maruyama W, Kato Y, Isobe K, Tanaka M, Naoi M, Osawa T. An inhibitor of mitochondrial complex I, rotenone, inactivates proteasome by oxidative modification and induces aggregation of oxidized proteins in SH-SY5Y cells. J Neurosci Res. 2003;74:589–597. doi: 10.1002/jnr.10777. [DOI] [PubMed] [Google Scholar]
- Sherer TB, Betarbet R, Kim JH, Greenamyre JT. Selective microglial activation in the rat rotenone model of Parkinson’s disease. Neurosci Lett. 2003;341:87–90. doi: 10.1016/s0304-3940(03)00172-1. [DOI] [PubMed] [Google Scholar]
- Tada-Oikawa S, Hiraku Y, Kawanishi M, Kawanishi S. Mechanism for generation of hydrogen peroxide and change of mitochondrial membrane potential during rotenone-induced apoptosis. Life Sci. 2003;73:3277–3288. doi: 10.1016/j.lfs.2003.06.013. [DOI] [PubMed] [Google Scholar]
- Uversky VN, Li J, Fink AL. Pesticides directly accelerate the rate of alphasynuclein fibril formation: a possible factor in Parkinson’s disease. FEBS Lett. 2001;500:105–108. doi: 10.1016/s0014-5793(01)02597-2. [DOI] [PubMed] [Google Scholar]
- Wang G, Qi C, Fan GH, Zhou HY, Chen SD. PACAP protects neuronal differentiated PC12 cells against the neurotoxicity induced by a mitochondrial complex I inhibitor, rotenone. FEBS Lett. 2005;579:4005–4011. doi: 10.1016/j.febslet.2005.06.013. [DOI] [PubMed] [Google Scholar]
- Wang X, Perez E, Liu R, Yan LJ, Mallet RT, Yang SH. Pyruvate protects mitochondria from oxidative stress in human neuroblastoma SK-N-SH cells. Brain Res. 2007;1132:1–9. doi: 10.1016/j.brainres.2006.11.032. [DOI] [PMC free article] [PubMed] [Google Scholar]
- Wang X, Qin ZH, Leng Y, Wang Y, Jin X, Chase TN, Bennett MC. Prostaglandin A1 inhibits rotenone-induced apoptosis in SH-SY5Y cells. J Neurochem. 2002;83:1094–1102. doi: 10.1046/j.1471-4159.2002.01224.x. [DOI] [PubMed] [Google Scholar]
- Weinreb O, Mandel S, Youdim MB. cDNA gene expression profile homology of antioxidants and their antiapoptotic and proapoptotic activities in human neuroblastoma cells. FASEB J. 2003;17:935–937. doi: 10.1096/fj.02-0712fje. [DOI] [PubMed] [Google Scholar]
- Wondrak GT, Cervantes-Laurean D, Jacobson EL, Jacobson MK. Histone carbonylation in vivo and in vitro. Biochem J. 2000;351:769–777. [PMC free article] [PubMed] [Google Scholar]
- Zhang Y, Dawson VL, Dawson TM. Oxidative stress and genetics in the pathogenesis of Parkinson’s disease. Neurobiol Dis. 2000;7:240–250. doi: 10.1006/nbdi.2000.0319. [DOI] [PubMed] [Google Scholar]