

Abstract
Objectives
Recent work using classical test theory (CTT) and item response theory (IRT) has found that the self-report (QIDS-SR16) and clinician-rated (QIDS-C16) versions of the 16-item Quick Inventory of Depressive Symptomatology were generally comparable in outpatients with nonpsychotic major depressive disorder (MDD). This report extends this comparison to a less well-educated, more treatment-resistant sample that included more ethnic/racial minorities using IRT and selected classical test analyses.
Methods
The QIDS-SR16 and QIDS-C16 were obtained in a sample of 441 outpatients with nonpsychotic MDD seen in the public sector in the Texas Medication Algorithm Project (TMAP). The Samejima graded response IRT model was used to compare the QIDS-SR16 and QIDS-C16.
Results
The nine symptom domains in the QIDS-SR16 and QIDS-C16 related well to overall depression. The slopes of the item response functions a), which index the strength of relationship between overall depression and each symptom, were extremely similar with the two measures. Likewise, the CTT and IRT indices of symptom frequency (item means and locations of the item response functions, bi) were also similar with these two measures. For example, sad mood and difficulty with concentration/decision making were highly related to the overall depression severity with both the QIDS-C16 and QIDS-SR16. Likewise, sleeping difficulties were commonly reported, even though they were not as strongly related to overall magnitude of depression.
Conclusion
In this less educated, socially disadvantaged sample, differences between the QIDS-C16 and QIDS-SR16 were minor. The QIDS-SR16 is a satisfactory substitute for the more time-consuming QIDS-C16 in a broad range of adult, nonpsychotic, depressed outpatients.
Keywords: Quick Inventory of Depressive Symptomatology, Inventory of Depressive Symptomatology, Item response theory, Samejima graded response model, depressive symptoms
OBJECTIVES
The accurate, rapid, and cost-efficient measurement of depressive symptoms serves both clinical and research purposes. Clinicians can gauge the benefit of treatment and make timely adjustments in the treatment plan. Research, on the other hand, can be made less costly if such measures are available. The Quick Inventory of Depressive Symptomatology (QIDS) is a 16-item scale that measures each of the nine symptom domains that define a major depressive episode based on DSM-IV TR (American Psychiatric Association 2000). Since the QIDS comes in a clinician-rated (QIDS-C16) and self-report (QIDS-SR16) version, we have begun to examine whether a self-report can reliably substitute for a clinician rating.
A recent study (Rush et al. in press) compared three versions of QIDS (Rush et al. 2000, 2003b; Trivedi et al. 2004a): the QIDS-SR16, QIDS-C16, and a version provided by a telephone-based system (QIDS-IVR16). Both classical test theory (CTT), which defines depression in terms of an observable test score, and item response theory (IRT) (see Embretson & Reise 2000), which defines depression as a latent trait, were employed. The particular IRT model we employed was developed by Samejima (1969, 1997) to examine graded responses. The recent study (Rush et al. in press) focused on a subset of patients with nonpsychotic major depressive disorder (MDD) derived from the Sequenced Treatment Alternatives to Relieve Depression (STAR*D) trial (Fava et al. 2003; Rush et al. 2004a). These patients were reasonably well educated as a group and were drawn from both primary and psychiatric care settings. They were selected to not be treatment resistant. Results were generally comparable between the scales, though clinicians were less likely to use the most extreme category in rating restlessness/agitation.
This paper compares the QIDS-SR16 and QIDS-C16 using methods previously employed by Rush et al. (in press) to evaluate the generalizability of our previous findings. The sample for this report was obtained in the Texas Medication Algorithm Project (TMAP, Rush et al. 2003a; Trivedi et al. 2004b). These patients drawn only from the public sector were less educated and more socially disadvantaged, and they were more treatment resistant (Rush et al. 2004b). In addition, more participants in this report were from racial/ethnic minority groups.
METHODS
Subjects
TMAP was conducted in accordance with international guidelines for good clinical practice and the Declaration of Helsinki and was approved by the institutional review boards at The University of Texas Southwestern Medical Center and the University of Texas, Austin, as well as by each local institutional review board where applicable. Patients provided written informed consent prior to study participation.
The participants in this report were previously described adult outpatients with nonpsychotic MDD (Rush et al. 2003a; Trivedi et al. 2004b). The original sample of 547 was reduced to 441 by excluding those with psychotic symptoms. Compared with published results using the first 1500 STAR*D patients (Marcus et al. 2005), these patients were older (42.5 years (11.3) vs. 40.5 years (13.2), F1, 1937=8.26, p=.0041), had fewer years of education (11.2 years (SD=3.2) vs. 13.6 years (3.2), F1, 1935=189.4, p<.0001), more often nonwhite (44.9% vs. 24.2%, x2=71.0, p<.0001), and more often unemployed (80.5% vs. 34.7%, x2=276.2, p<.0001).
Measures
At baseline and exit visits in the TMAP project, both the self-report and clinician-rated versions of the 30-item Inventory of Depressive Symptomatology (Rush et al. 1986, 1996, 2000; Trivedi et al. 2004a) were obtained (in English or Spanish) by a Research Coordinator not involved in the treatment of patients. The order of test administration was not strictly randomized, but the IDS-C30 was completed without knowledge of the IDS-SR30 responses. The 16 items in the IDS-C30 and IDS-SR30 that comprise the QIDS were extracted from the relevant IDS measure. The QIDS-SR16 and the QIDS-C16 each measure the nine symptom domains (Sleep, Sad Mood, Appetite/Weight, Concentration/Decision Making, Self View, Thoughts of Death or Suicide, General Interest, Energy Level, and Restlessness/Agitation) that define a major depressive episode (American Psychiatric Association 2000). The score for each of three domains (Sleep, Appetite/Weight, and Restlessness/Agitation) is based upon the maximum score (most pathological) of two or more questions. The remaining domains are each rated by a single item. Each domain is scored from 0 to 3 reflecting increasing amounts of pathology, so the total test score can range from 0 to 27 (Rush et al. 2000).
Statistical Methods
The methods used in this report are detailed in Rush et al. (in press). The nine domains scored by the QIDS-C16 and QIDS-SR16 serve the role of items in these analyses.
Both the IRT model discussed below and classical test theory recognize that a test should be unidimensional. Dimensionality was inferred from a principal component analysis employing parallel analysis (PA) (Horn 1965; Humphreys & Ilgen 1969; Humphreys & Montanelli 1975; Montanelli & Humphreys 1976). In PA, one factors a matrix containing the same number of observations and variables as the real data (441 and 9, respectively, in the present case) but simulated from a population in which all correlations are zero. Multiple matrices of this form may be generated. The results are averaged to provide for a more stable estimate and standard errors. In order for a solution to conform to a unidimensional solution, the first principal component obtained from the real data must be larger than the first principal component obtained from the simulation, but all subsequent components from the actual data must be smaller than their simulated counterparts. PA is designed to replace the “λ >1” (Kaiser-Guttman, see Guttman 1954; Kaiser 1960) criterion that is the traditional default in factor analysis programs.
The Samejima (1969, 1997) graded response IRT model was designed for use with multicategory scales, which are typical of most tests used in psychiatry. The trait of interest (depression) is conceived of as a latent variable, symbolized Θ. In the present case, the model generates three item response functions (item operating characteristic curves, or trace lines) for each item. The first function describes the probability of choosing any pathological response category relative to the normal category (i.e., a response of 1, 2, or 3 vs. a response of 0) as a function of Θ. The second function describes the probability of choosing the moderate or severe categories relative to the normal or mild categories (2 or 3 vs. 0 or 1) as a function of Θ, and the third describes the probability of choosing the severe category relative to the remaining categories (3 vs. 0, 1, or 2) as a function of Θ. The three curves are S-shaped of a form known as the logistic and have a common slope, symbolized a. This a parameter describes the strength of relation between each of the nine domains and Θ. The a parameter is similar to the item-total correlation generated by classical test theory analyses, but it is computed differently. The three different locations of the functions are symbolized b0, b1, and b2 (bi generically). They indicate how often the designated response category is chosen relative to its alternative; their role is similar to the item mean in CTT. Thissen’s (2003) Multilog for Windows was used to obtain relevant Samejima estimates.
A particular advantage of IRT is that it facilitates comparison among groups or conditions, such as the versions of the QIDS under consideration here. A test of difference in the value of a for a given domain may be accomplished by comparing the fit of a model in which all values of a and bi are allowed to vary freely vs. one in which the value of a is constrained to equality among groups or conditions (test forms in the present case). The difference between the two can be expressed as a form of chi-square, symbolized G2, to test the proposition that the constraint degrades the fit of the model, i.e., the two values of a are unequal. A significant value of G2 implies that the values of a differ. A corresponding test may be made involving differences in values of bi when they are left free to vary vs. constrained to equality. Differences in a and/or bi are denoted differential item functioning (DIF). The presence of DIF is generally undesirable in personnel selection contexts, where it is perhaps most often studied, because it implies a difference due to method of measurement. However, it may be of interest in elucidating differences between subgroups, e.g., between patients with bipolar and unipolar depression. In general, DIF due to differences in a parameters relative to bi parameters is perhaps more serious because it implies that the same domain relates differentially to depression in the groups or conditions being compared. In contrast, present differences in bi suggest that respondents are more or less willing to endorse a symptom domain when answering directly than when informing a rater or, equivalently, the rater amplifies or diminishes what the patient says. While important to know, it can be more easily compensated for in a final judgment.
A final standard IRT result to be presented is the test information function for the two tests at baseline and at exit. This function represents the sensitivity of the scale to changes in θ. The higher the value, the more sensitive the scale is at that value of Θ.
Three additional statistics derived from the CTT tradition are also presented. Response was defined as a 50% or greater reduction in QIDS scores (baseline to exit). Remission was defined as a score of five or less for each QIDS rating. Finally, effect sizes were defined as the ratio of the mean change from baseline to exit divided by the standard deviation of that change, which allows comparability with our previous report (Rush et al. in press) that used this definition.
RESULTS
Response and Remission
In terms of response, the QIDS-C16 and QIDS-SR16 agreed in 88% of patients. The remaining 12% were divided equally between cases in which response was declared based on the QIDS-C16 but not on the QIDS-SR16 and vice versa. In terms of remission, the two scales agreed 94% of the time. The disagreements were also split nearly equally: in 2% of the cases, patients remitted according to the QIDS-C16 but not the QIDS-SR16, while in 4% of cases, the converse was true.
Effect sizes
Table 1 presents effect sizes for each scale overall. The effect sizes were much smaller in this study than in our previous report (Rush et al. in press) where effect sizes were ≥0.50, likely due to the more treatment-resistant nature of this sample. In addition, QIDS-SR16 effect sizes tended to be larger than the QIDS-C16 effect sizes with one exception (appetite). In other words, patients saw themselves as improving more than others saw them as improving.
Table 1.
Effect Sizes for the QIDS-C16 and the QIDS-SR16
| DOMAIN | QIDS-C16 | QIDS-SR16 |
|---|---|---|
| Sleep | .17 | .25 |
| Sad Mood | .33 | .42 |
| Appetite | .36 | .23 |
| Concentration/Decision Making | .23 | .26 |
| Self View | .30 | .32 |
| Thoughts of Death or Suicide | .32 | .36 |
| General Interest | .20 | .32 |
| Energy Level | .27 | .28 |
| Restlessness/Agitation | .26 | .32 |
| Total | .46 | .50 |
Dimensionality
As Figure 1 indicates, both the QIDS-C16 and QIDS-SR16 were unidimensional at baseline and at exit in that the observed first component was always much larger than that generated from random data (PA), but the observed second component was always smaller than that generated from random data. This unidimensionality is important because the basic Samejima model assumes unidimensionality.
Figure 1.
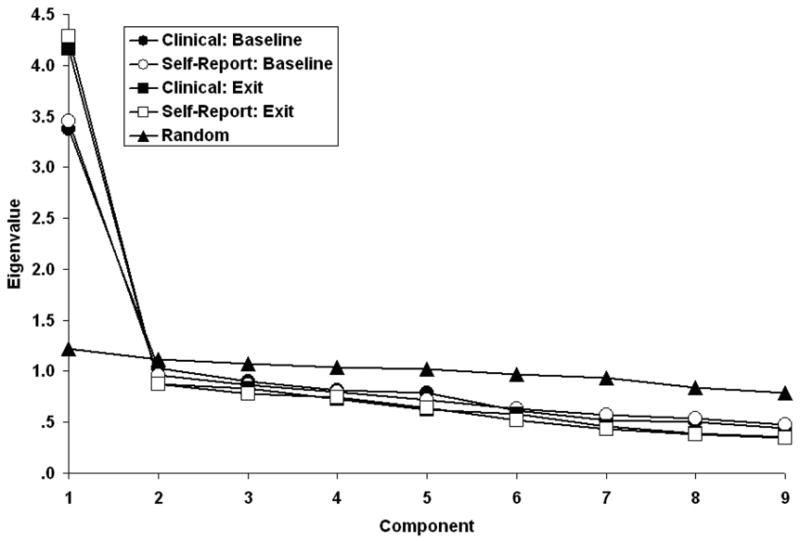
Scree plot of the QIDS-C16 and QIDS-SR16 at baseline and exit with randomly generated scree (parallel analysis)
Item Response Theory (IRT) Findings
Table 2 contains the IRT parameter estimates for the QIDS-C16 and QIDS-SR16 at baseline. Table 3 contains the comparable data obtained at exit. In all cases, the estimates were obtained from models in which parameters were free to vary. Note that the sad mood and general interest domains most characterize depression as inferred from the two versions of the QIDS since their slope (a) parameters are the largest among the domains. Second, the parameter estimates for the two versions are similar to one another both at baseline and at exit, though more formal tests will be reported in the next section, which is concerned with DIF. Third, the slopes increased in all cases save one (concentration/decision making for the QIDS-C16) from baseline to exit. This reflects the increased variability at exit as compared to baseline scores, the same process that caused the overall internal consistencies to increase from .78 to .86 (though these data are properly part of a CTT rather than IRT analysis). Fourth, the intercepts also all increased from baseline to exit in all cases save one (restlessness/agitation for the QIDS-SR16 at response level 3). This reflects therapeutic improvement, i.e., the reduction in reported symptoms as therapy or time progresses. The slope and intercept parameters of Tables 2 and 3 may be compared to the classical test theory analyses in terms of item/total correlations and item means previously reported (Trivedi et al. 2004a).
Table 2.
IRT Parameter Estimates at Baseline for the QIDS-C16 and QIDS-SR16
| DOMAINS | QIDS-C16 | QIDS-SR16 | ||||||
|---|---|---|---|---|---|---|---|---|
| a | b0 | b1 | b2 | a | b0 | b1 | b2 | |
| Sleep | .88 | −3.66 | −2.49 | −.67 | .83 | −4.28 | −2.74 | −.83 |
| Sad Mood | 2.29 | −1.88 | −.51 | .57 | 2.44 | −2.00 | −.51 | .39 |
| Appetite | .66 | −3.08 | −1.34 | .62 | .80 | −2.38 | −.60 | .88 |
| Concentration/Decision Making | 1.52 | −1.44 | −.12 | 1.34 | 1.68 | −1.55 | −.14 | 1.46 |
| Self View | 1.56 | −.86 | .17 | 1.00 | 1.47 | −.88 | .19 | .69 |
| Thoughts of Death or Suicide | 1.35 | −.21 | 1.14 | 2.70 | 1.18 | −.23 | 1.42 | 2.76 |
| General Interest | 1.94 | −.85 | −.05 | .96 | 1.97 | −.95 | .02 | .73 |
| Energy Level | 1.73 | −1.24 | −.39 | 1.11 | 1.60 | −1.42 | −.31 | 1.12 |
| Restlessness/Agitation | .78 | −2.83 | .15 | 4.73 | 1.03 | −2.23 | .01 | 1.51 |
Table 3.
IRT Parameter Estimates at Exit for the QIDS-C16 and QIDS-SR16
| DOMAINS | QIDS-C16 | QIDS-SR16 | ||||||
|---|---|---|---|---|---|---|---|---|
| a | b0 | b1 | b2 | a | b0 | b1 | b2 | |
| Sleep | 1.28 | −2.55 | −1.39 | −.13 | 1.18 | −2.44 | −1.49 | −.01 |
| Sad Mood | 2.90 | −1.00 | −.02 | .94 | 2.89 | −1.04 | .12 | .92 |
| Appetite/Weight | .78 | −1.16 | .14 | 1.41 | .88 | −1.22 | .17 | 1.30 |
| Concentration/Decision Making | 1.75 | −.60 | .30 | 1.23 | 2.10 | −.61 | .31 | 1.27 |
| Self View | 2.26 | −.10 | .62 | 1.18 | 2.32 | −.01 | .59 | .95 |
| Thoughts of Death or Suicide | 1.88 | .40 | 1.52 | 2.90 | 1.82 | .52 | 1.69 | 2.75 |
| General Interest | 2.31 | −.33 | .34 | 1.10 | 2.50 | −.26 | .51 | 1.12 |
| Energy Level | 1.86 | −.56 | .25 | 1.16 | 2.09 | −.60 | .26 | 1.13 |
| Restlessness/Agitation | 1.33 | −1.11 | .64 | 3.29 | 1.44 | −.86 | .56 | 1.68 |
Differential Item Functioning
As noted above, tests of DIF were performed by comparing the model in which all parameters were free to vary, whose results are presented in Tables 2 and 3 above, with models in which the a parameters were constrained to equality but the bi parameters were free to vary and, conversely, models in which the a parameters were free to vary but the bi parameters were constrained to equality. The first group of models test for slope differences, and the second tests for intercept differences. In both cases, the difference in fit is expressed as a form of chi-square symbolized G2 but using the same tables of significance as the more frequently encountered Pearson value, χ2.
Neither baseline nor exit differences in a between the two forms were significant, all df = 1. However, four differences in bi were significant at baseline: appetite, self-view, general interest, and restlessness/agitation, df = 3, ps < .05, .05, .01, and .01. At exit, only one difference was significant: restlessness/agitation, df = 3, p < .01. In fact, only the restlessness/agitation difference was large in absolute value at either time point (see Tables 2 and 3). The values of G2(3) were 57.1 and 31.7, but both largely reflect differences at the b3 intercept. In both cases, clinicians were less likely to assign a rating of “3” for agitation/retardation to patients than patients were to rate themselves in this manner. This replicated our previous finding (Rush et al. in press). The next largest difference was found at baseline, but not exit, for appetite at levels b1 and b2.
One additional finding is that differences between versions at baseline were larger than differences at exit. One index is the square root of the average squared discrepancy between versions (i.e., the root-mean-square error). This decreased from .69 at baseline to .33 at exit. Removing the restlessness/agitation domain (#9) from this computation reduced the respective values to .29 at baseline and .10 at exit. Obviously, this increased agreement occurred because of changes in the patients rather than the raters.
In sum, differences between the two forms were limited to differences in the tendency to report symptoms rather than the relation between symptoms and depression. The differences in tendency to report symptoms were largely limited to one item (psychomotor domain) at the most severe level.
Test Information
A test information function represents the ability of the scale as a whole to discriminate across values of θ. Figure 2 contains these information functions for the two tests at baseline and at exit. One important point is that the depression (Θ) axis is somewhat different at baseline than at exit because the zero point represents a patient of average depression for the sample in question. This average point changed from baseline to exit. It is appropriate to note that the scale at exit was more discriminating than the scale at baseline starting at approximately −1.5 z-score units below the mean, which is another manifestation of the increase in reliability. Perhaps more important, though, is that the two versions are equally discriminating at baseline and, if anything, the QIDS-SR16 is somewhat more discriminating among patients of average to above average depression magnitude (values of Θ between- and +1) at exit.
Figure 2.
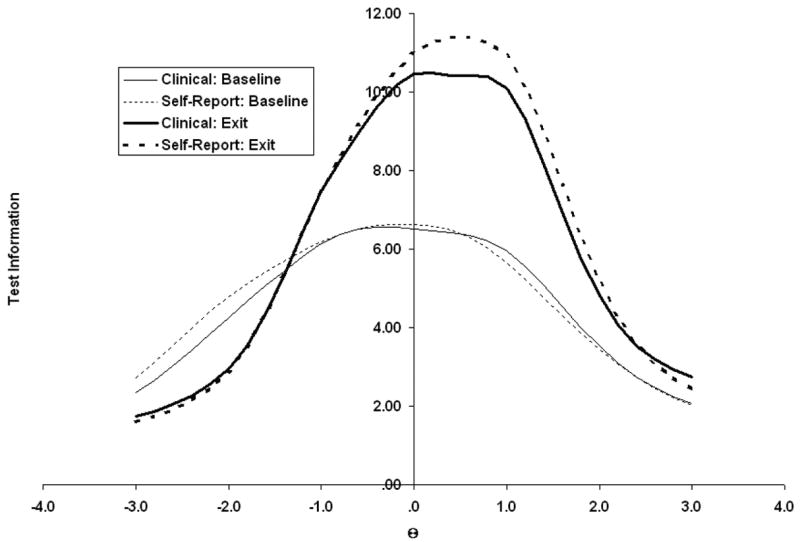
Test information functions for the QIDS-C16 and QIDS-SR16 at baseline and exit
DISCUSSION
This study found that the QIDS-C16 and the QIDS-SR16 are very similar to one another. These results are very similar to those by Rush et al. (in press). The finding of greatest clinical significance is that the two versions are highly comparable. Individual domains relate equally well to overall depression with the two scales. The largest difference involved the relative infrequency with which clinicians used the most extreme category for one item, restlessness/agitation. If anything, the self-report version was slightly superior in discriminating those of average to above average depression in this sample. These results indicate the utility of both versions. The self-report performed very well, even in a somewhat poorly educated, socially disadvantaged population.
CTT findings and the present IRT results (Trivedi et al. 2004a) produce very comparable findings. For example, the CTT item-total correlations were reflected in the a (slope) parameter found with IRT. Similarly, findings based on the CTT item means were also noted with the bi (location) parameters of IRT. However, the present IRT findings provided for very straightforward testing of both kinds of differences between test versions, whereas CTT only did so for the item means. In addition, IRT afforded an explicit basis to equate scores on two different tests (Rush et al. 2003b). For a more extensive discussion of some of the advantages and disadvantages of IRT over CRT, see Nunnally and Bernstein (1994, pp. 394–396 and 433–435).
Some previous psychiatric applications of IRT have employed the Rasch (1960) model (Bech et al. 1981; Cialdella et al. 1992). However, the Rasch model makes one assumption that we feel unfortunately severely limits its utility in the present context — namely, that all items have the same slope (a parameter). Empirically, this was clearly not the case in the present report nor is it likely in any clinical setting. This requirement precludes the determination of the differential contributions of the various symptoms to the overall definition of depression, which is an important aspect of this investigation. Unlike applications in industrial/organizational psychology, where weakly discriminating items can be eliminated, such symptoms need to be considered in psychiatric diagnosis. For example, although Suicidal Ideation is less discriminating than Low Energy or Sad Mood, it would be a grave omission not to ask questions about less commonly but clinically important symptoms. It is suggested that the Rasch model is most useful in settings where the same general type of question can be asked, such as presenting randomly selected pairs three digit numbers for addition to evaluate arithmetic ability in young children. In our view, this model seems less appropriate for medical settings where a wide range of symptoms with varying sensitivity need be considered.
Consider the limitations of the Rasch model in the context of measuring the severity of a psychiatric or general medical syndrome such as major depression, schizophrenia, nephrotic syndrome, congestive heart failure, etc. Virtually all medical syndromes are based on a listing of commonly occurring clusters of signs and symptoms. No one patient is required to have each and every sign and symptom relevant to the diagnosis. The syndrome of major depression, for example, requires either sad mood or reduced interest and only four of the remaining seven criterion symptom items to qualify for the diagnosis. In some patients, some signs/symptoms will be more common, while others will be less common. Over time, some new signs/symptoms may develop. Others may abate. Thus, an analytic model like the Samejima model that allows for a grading of the severity of each diagnostic criterion sign/symptom, and that allows investigators to gauge the likelihood of each specific sign/symptom being endorsed in a heterogeneous syndrome, provides greater flexibility in assessing test performance.
As noted in the introduction, IRT is becoming widely used to study depressive symptomatology, and much of this work has examined DIF, e.g., Azocar et al. (2001), Evans et al. (2004), Iwata and Buca (2002), and Iwata et al. (2002). Unlike these reports, this study deals with a questionnaire that was developed specifically within psychiatry and which was designed to evaluate symptoms of depression that follow from its DSM definition (American Psychiatric Association 2000). In that sense, it is related to the work of Gibbons et al. (1993). The papers by Azocar and Iwata et al. studied tests like the Beck Depression Inventory that have been more wisely used in nonclinical populations than the QIDS. In contrast, it is perhaps more important to consider the implications of DIF, when it is present, for tests when they are applied to clinical populations.
One possibility is to treat DIF in the present context as it is usually treated in employment (industrial/organizational) settings. In that case, it is usually interpreted as being highly undesirable, and much effort goes into eliminating or at least rewriting such items. Indeed, the term “item bias” has largely been replaced by DIF. In the present case, this would involve the appetite/weight and restlessness/agitation domains. It is possible that suitable instructions to the clinical interviewers could reduce these differences. However, there is no assurance that other domains may not possess DIF when applied to different ethnic groups, genders, etc. Moreover, unless these changes can preserve the essential characteristics of the domain, one runs the risk of failing to cover the DSM criteria, which was the goal of constructing the scale in the first place. Furthermore, as more and more relevant groups are compared, the probability of finding DIF in a given item or domain in at least one group increases, e.g., even though an item may not possess DIF by gender or in a racial (e.g., black/white) comparison, it may for an ethnic comparison (e.g., white Hispanic vs. white non-Hispanic).
An alternative is to consider these instances of DIF as legitimate group differences that should be taken into account in diagnosis. Indeed, this may be quite necessary should DIF emerge among subtypes of depression. As noted earlier, the presence of DIF implies that a single dimension, depression in this case, is not sufficient to account for all differences among patients, i.e., patients at the same level of depression might differ in some other respect. This is a likely possibility that simply should be kept open along with the present findings that different methods of inferring QIDS responses differ slightly, but perhaps legitimately. In other words, it is reasonable to assume that scores on scales like the QIDS may be influenced by dimensions of relevance other than depression, per se.
Limitations
It is probable that a major factor underlying the equivalence of the clinical and self-report versions in this study is the fact that there were no major incentives to either exaggerate or minimize the symptoms of depression. It is not unreasonable to assume that the presence of such factors would lead to differences between the two methods, though it should not be forgotten that even the clinical version is based heavily upon patient report. In addition, there are a variety of other samples (e.g., bipolar depression) for whom possible equivalence has not been examined.
Conclusions
The two versions of the QIDS16 are highly similar, even in this less educated, more socially disadvantaged sample. In particular, this means that self-report is an adequate method of assessing depression and has the advantage of taking less clinician time.
Acknowledgments
This project was funded in part by the National Institute of Mental Health (NIMH), National Institutes of Health (MH-68851 to the University of Texas Southwestern Medical Center at Dallas, A. John Rush, M.D., PI, and by MH-68852 to the University of Texas at Arlington, Ira H. Bernstein, Ph.D., PI). This research was also supported by NIMH Grant MH-53799, the Robert Wood Johnson Foundation, the Meadows Foundation, the Lightner-Sams Foundation, the Nanny Hogan Boyd Charitable Trust, the Texas Department of Mental Health and Mental Retardation, the Center for Mental Health Services, the Betty Jo Hay Distinguished Chair in Mental Health and the Rosewood Corporation Chair in Biomedical Science (AJR), the United States Pharmacopoeia Convention, Inc., Mental Health Connections, a partnership between Dallas County Mental Health and Mental Retardation (MHMR) and the Department of Psychiatry of the University of Texas Southwestern Medical Center, which receives funding from the Texas State Legislature and the Dallas County Hospital District and the University of Texas at Austin College of Pharmacy, and the Southwestern Drug Corporation Centennial Fellowship in Pharmacy. The following pharmaceutical companies provided unrestricted educational grants: Abbott Laboratories, AstraZeneca, Bristol-Myers Squibb, Eli Lilly & Company, Forest Laboratories, GlaxoSmithKline, Janssen Pharmaceutica, Novartis, Organon, Pfizer, Inc. and WyethAyerst Laboratories, Inc.
References
- American Psychiatric Association. Diagnostic and Statistical Manual of Mental Disorders. 4. Washington DC: American Psychiatric Press; 2000. Text Revision. [Google Scholar]
- Azocar F, Areán P, Miranda J, Muñoz RF. Differential item functioning in a Spanish translation of the Beck Depression Inventory. Journal of Clinical Psychology. 2001;57:365–355. doi: 10.1002/jclp.1017. [DOI] [PubMed] [Google Scholar]
- Bech P, Allerup P, Gram LF, Reisby N, Rosenberg R, Jacobsen O, Nagy A. The Hamilton Depression Scale. Evaluation of objectivity using logistic models. Acta Psychiatrica Scandinavica. 1981;63:290–299. doi: 10.1111/j.1600-0447.1981.tb00676.x. [DOI] [PubMed] [Google Scholar]
- Cialdella P, Guillaud-Bataille JM, Gausset MF, Terra JL, Gerin P, Palliard E, Jouishomme JC. Study of the unidimensionality of the Yesavage-Brinck geriatric depression scale. Comparison between classical methods and Rasch’s model. Encephale. 1992;18:537–544. [PubMed] [Google Scholar]
- Embretson SE, Reise SP. Item Response Theory for Psychologists. Mahwah, N. J.: Lawrence E. Erlbaum Associates; 2000. [Google Scholar]
- Evans KR, Sills T, DeBrota DJ, Gelwicks S, Engelhardt N, Santor D. An item response analysis of the Hamilton Depression Rating Scale using shared data from two pharmaceutical companies. Journal of Psychiatric Research. 2004;38:275–284. doi: 10.1016/j.jpsychires.2003.11.003. [DOI] [PubMed] [Google Scholar]
- Fava M, Rush AJ, Trivedi MH, Nierenberg AA, Thase ME, Sackeim HA, Quitkin FM, Wisniewski S, Lavori PW, Rosenbaum JF, Kupfer DJ. Background and rationale for the sequenced treatment alternatives to relieve depression (STAR*D) study. Psychiatric Clinics of North America. 2003;26(2):457–494. doi: 10.1016/s0193-953x(02)00107-7. [DOI] [PubMed] [Google Scholar]
- Gibbons RD, Clark DC, Kupfer DJ. Exactly what does the Hamilton Depression Rating Scale measure? Journal of Psychiatric Research. 1993;27:259–273. doi: 10.1016/0022-3956(93)90037-3. [DOI] [PubMed] [Google Scholar]
- Guttman L. Some necessary conditions for common factor analysis. Psychometrika. 1954;19:149–162. [Google Scholar]
- Horn JL. An empirical comparison of various methods for estimating common factor scores. Educational and Psychological Measurements. 1965;25:313–322. [Google Scholar]
- Humphreys LG, Ilgen D. Note on a criterion for the number of common factors. Educational and Psychological Measurements. 1969;29:571–578. [Google Scholar]
- Humphreys LG, Montanelli RG., Jr An investigation of the parallel analysis criterion for determining the number of common factors. Multivariate Behavioral Research. 1975;10:193–206. [Google Scholar]
- Iwata N, Buka S. Race/ethnicity and depressive symptoms: A cross-cultural/ethnic comparison among university students in East Asia, North and South America. Social Science and Medicine. 2002;55:2243–2252. doi: 10.1016/s0277-9536(02)00003-5. [DOI] [PubMed] [Google Scholar]
- Iwata N, Turner RJ, Lloyd DA. Race/ethnicity and depressive symptoms in community-dwelling young adults: a differential item functioning analysis. Psychiatry Research. 2002;110:281–289. doi: 10.1016/s0165-1781(02)00102-6. [DOI] [PubMed] [Google Scholar]
- Kaiser HF. The application of electronic computers to factor analysis. Educational and Psychological Measurement. 1960;20:141–151. [Google Scholar]
- Marcus SM, Young EA, Kerber KB, Kornstein AH, Mitchell J, Wisniewski SR, Balasubramani GK, Trivedi MH, Rush AJ. Gender differences in depression: Findings from the STAR*D study. Journal of Affective Disorders. 2005;87:141–150. doi: 10.1016/j.jad.2004.09.008. [DOI] [PubMed] [Google Scholar]
- Montanelli RG, Jr, Humphreys LG. Latent roots of random data correlation matrices with squared multiple correlations on the diagonal: A Monte Carlo Study. Psychometrika. 1976;41:341–348. [Google Scholar]
- Nunnally JC, Bernstein IH. Psychometric Theory. 3. New York: McGraw-Hill; 1994. [Google Scholar]
- Rasch G. Probabilistic models for some intelligence and attainment tests. Copenhagen: Denmarks Paedagogiske Institut; 1960. [Google Scholar]
- Rush AJ, Bernstein IH, Trivedi MH, Carmody TJ, Wisniewski S, Mundt JC, Shores-Wilson K, Biggs MM, Nierenberg AA, Fava M. An evaluation of the Quick Inventory of Depressive Symptomatology and the Hamilton Rating Scale for Depression: a STAR*D report. Biological Psychiatry. 2005 doi: 10.1016/j.biopsych.2005.08.022. in press. [DOI] [PMC free article] [PubMed] [Google Scholar]
- Rush AJ, Carmody TJ, Reimitz PE. The Inventory of Depressive Symptomatology (IDS): clinician (IDS-C) and self-report (IDS-SR) ratings of depressive symptoms. International Journal of Methods in Psychiatric Research. 2000;9:45–59. [Google Scholar]
- Rush AJ, Crismon ML, Kashner TM, Toprac MG, Carmody TJ, Trivedi MH, Suppes T, Miller AL, Biggs MM, Shores-Wilson K, Witte BP, Shon SP, Rago WV, Altshuler KZ. Texas Medication Algorithm Project, phase 3 (TMAP-3): rationale and study design. Journal of Clinical Psychiatry. 2003a;64:357–369. doi: 10.4088/jcp.v64n0402. [DOI] [PubMed] [Google Scholar]
- Rush AJ, Fava M, Wisniewski SR, Lavori PW, Trivedi MH, Sackeim HA, Thase ME, Nierenberg AA, Quitkin FM, Kashner TM, Kupfer DJ, Rosenbaum JF, Alpert J, Stewart JW, McGrath PJ, Biggs MM, Shores-Wilson K, Lebowitz BD, Ritz L, Niederehe G. Sequenced Treatment Alternatives to Relieve Depression (STAR*D): rationale and design. Controlled Clinical Trials. 2004a;25(1):119–142. doi: 10.1016/s0197-2456(03)00112-0. [DOI] [PubMed] [Google Scholar]
- Rush AJ, Giles DE, Schlesser MA, Fulton CL, Weissenburger J, Burns C. The Inventory for Depressive Symptomatology (IDS): preliminary findings. Psychiatry Research. 1986;18:65–87. doi: 10.1016/0165-1781(86)90060-0. [DOI] [PubMed] [Google Scholar]
- Rush AJ, Gullion CM, Basco MR, Jarrett RB, Trivedi MH. The Inventory of Depressive Symptomatology (IDS): psychometric properties. Psychological Medicine. 1996;26:477–486. doi: 10.1017/s0033291700035558. [DOI] [PubMed] [Google Scholar]
- Rush AJ, Trivedi MH, Ibrahim HM, Carmody TJ, Arnow B, Klein DN, Markowitz JC, Ninan PT, Kornstein S, Manber R, Thase ME, Kocsis JH, Keller MB. The 16-Item Quick Inventory of Depressive Symptomatology (QIDS), clinician rating (QIDS-C), and self-report (QIDS-SR): a psychometric evaluation in patients with chronic major depression. Biological Psychiatry. 2003b;54:573–583. doi: 10.1016/s0006-3223(02)01866-8. [DOI] [PubMed] [Google Scholar]
- Rush AJ, Trivedi MH, Carmody TJ, Biggs MM, Shores-Wilson K, Ibrahim H, Crismon ML. One-year clinical outcomes of depressed public sector outpatients: a benchmark for subsequent studies. Biological Psychiatry. 2004b;56:46–53. doi: 10.1016/j.biopsych.2004.04.005. [DOI] [PubMed] [Google Scholar]
- Samejima F. Graded response model. In: van Linden WJ, Hambleton RK, editors. Handbook of modern item response theory. New York: Springer-Verlag; 1997. pp. 85–100. [Google Scholar]
- Samejima F. Estimation of latent ability using a response pattern of graded scores. Psychological Monographs. 1969;4:2. [Google Scholar]
- Thissen D. Multilog for Windows. Lincolnwood, IL: Scientific Software International; 2003. [Google Scholar]
- Trivedi MH, Rush AJ, Crismon ML, Kashner TM, Toprac MG, Carmody TJ, Key T, Biggs MM, Shores-Wilson K, Witte B, Suppes T, Miller AL, Altshuler KZ, Shon SP. The Texas Medication Algorithm Project (TMAP): Clinical results for patients with major depressive disorder. Archives of General Psychiatry. 2004b;61(7):669–680. doi: 10.1001/archpsyc.61.7.669. [DOI] [PubMed] [Google Scholar]
- Trivedi MH, Rush AJ, Ibrahim HM, Carmody TJ, Biggs MM, Suppes T, Crismon ML, Shores-Wilson K, Toprac MG, Dennehy EB, Witte B, Kashner TM. The Inventory of Depressive Symptomatology, Clinician Rating (IDS-C) and Self-Report (IDS-SR), and the Quick Inventory of Depressive Symptomatology, Clinician Rating (QIDS-C) and Self-Report (QIDS-SR) in public sector patients with mood disorders, a psychometric evaluation. Psychological Medicine. 2004a;34:73–82. doi: 10.1017/s0033291703001107. [DOI] [PubMed] [Google Scholar]