Abstract
We perform Monte Carlo simulations to show that the dual-axes (DA) confocal architecture has superior rejection of multiply scattered photons in tissue to that of single axis. As a result, the DA configuration provides improved signal-to-noise ratio and dynamic range, and thus is sensitive to ballistic photons from deeper within tissue, features that are particularly useful for performing vertical cross-sectional reflectance images in tissue.
Scanning confocal optical microscopes use a pinhole or single-mode optical fiber to reject out-of-focus light scattered by tissue, and in the single-axis (SA) configuration, the pinhole or fiber is aligned with the optical axis of the objective. This is the most common architecture for confocal systems [1,2]. Imaging through several hundred micrometers of tissue in hollow organs has great clinical relevance because the epithelium that lines the surface has this approximate thickness and is the original site of most forms of cancer. However, tissue scattering can significantly degrade image resolution, contrast, and dynamic range. Previously, it has been experimentally and theoretically shown that the use of low NA objectives and the separation of the illumination and collection beams into a dual-axes (DA) configuration can produce a confocal microscope that has a long working distance (WD) with high axial resolution [3–6]. This architecture has been shown experimentally to provide a sufficient dynamic range to collect vertical cross-sectional (perpendicular to surface) images of tissue [5,6], revealing the relationship among differing tissue microstructures that a pathologist uses to make a diagnosis of disease.
Here, we carry out a Mie scattering calculation, with a Monte Carlo simulation of reflection microscopy, based on Prahl’s work [7–10], to show that the DA architecture significantly improves the rejection of multiply scattered photons. This provides greater signal-to-noise ratio (SNR) and dynamic range, resulting in better tissue penetration than that of SA, given the same axial resolution.
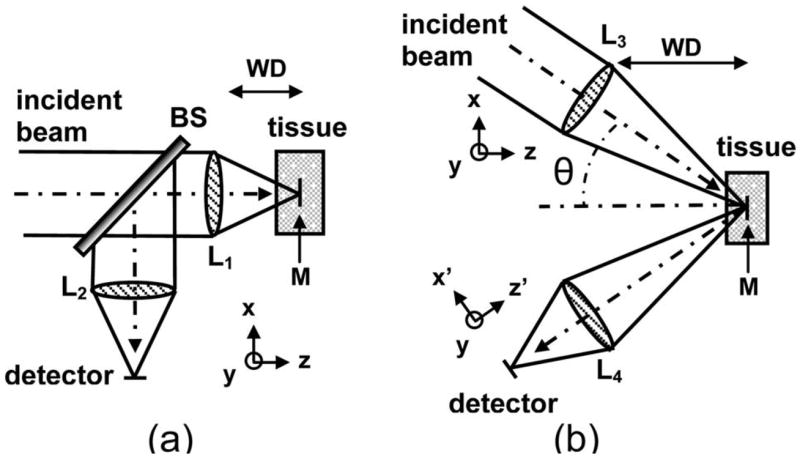
Using this approach, a nonsequential ray tracing program, which takes random scattering into account, is employed to model the SA and DA confocal architectures and tissue scattering (ASAP 2006 Breault Research Organization, Tucson, Ariz.). Figure 1 shows the optical surfaces associated with the (a) SA and (b) the DA. For the SA configuration, the incident Gaussian beam is focused into the tissue by an ideal lens (L1). A mirror (M) is embedded in the tissue at the focal plane (parallel to the x–y plane) of the objective lens L1. The reflected rays from the mirror pass back through the lens L1 and a beam splitter(BS) and are then focused by an ideal lens (L2) on to a detector in the y–z plane. Note that the BS reduces the original flux by 25%, thus the SA results are scaled up accordingly. The NA for the SA and DA configurations are defined as 0.58 and 0.21, respectively, to achieve an equivalent −3 dB (FWHM) axial resolution as the mirror is moved. For the DA architecture, the incident Gaussian beam is focused into the tissue by an ideal lens (L3) with its axis at an angle θ=30° to the z axis, and an ideal lens (L4) focuses the backscattered beam onto the detector, with its axis z′ at an angle −30° to the z axis. As before, a mirror (M) in the x–y plane and passing through the coincident foci of the lenses is embedded in the tissue to reflect the incident light to the detector.
Fig. 1.

Schematic for (a) SA and (b) DA architectures used in the Monte Carlo simulations.
From diffraction theory, the theoretical transverse and axial resolutions for the point spread function for this DA geometry at a wavelength λ=633 nm with an average tissue refractive index of 1.4 and NA=0.21 are found to be Δx=1.16 μm, Δy=1.00 μm, and Δz =2.00 μm [5,6]. A Gaussian beam profile is chosen since it is representative of light delivered through a fiber, and the focal plane (mirror) for both SA and DA configurations is located 200 μm below the tissue surface, a representative dimension of epithelial tissues. Three assumptions are made in this simulation study: (1) Multiple scattering of an incoherent beam dominates over diffraction effects, (2) the nonscattering optical medium surrounding the lenses and the tissue (the scattering medium) is index matched to eliminate aberrations, and (3) absorption is not included to simplify this model and because there is much larger attenuation owing to the scattering of ballistic photons. We also assume that the lens system has a magnification of 1 from the focal plane to the detector pinhole plane.
The angular dependence of scattering, the phase function p(θ), and the optical properties of nonabsorbing spheres are calculated from the Henyey–Greenstein phase scattering function, given by [9]:
| (1) |
where g, the anisotropy factor, is defined as
| (2) |
Given the size, refractive index, and concentration of tissue scatterers, the attenuation coefficient μs and anisotropy g are determined and then supplied as ASAP simulation parameters. For a tissue phantom composed of polystyrene spheres of diameter 0.48 μm, with refractive index 1.59, and a concentration of 0.0394 spheres/μm3 in water, Mie theory is used to calculate g=0.81 and μs =5.0 mm−1 at λ=633 nm [7–9].
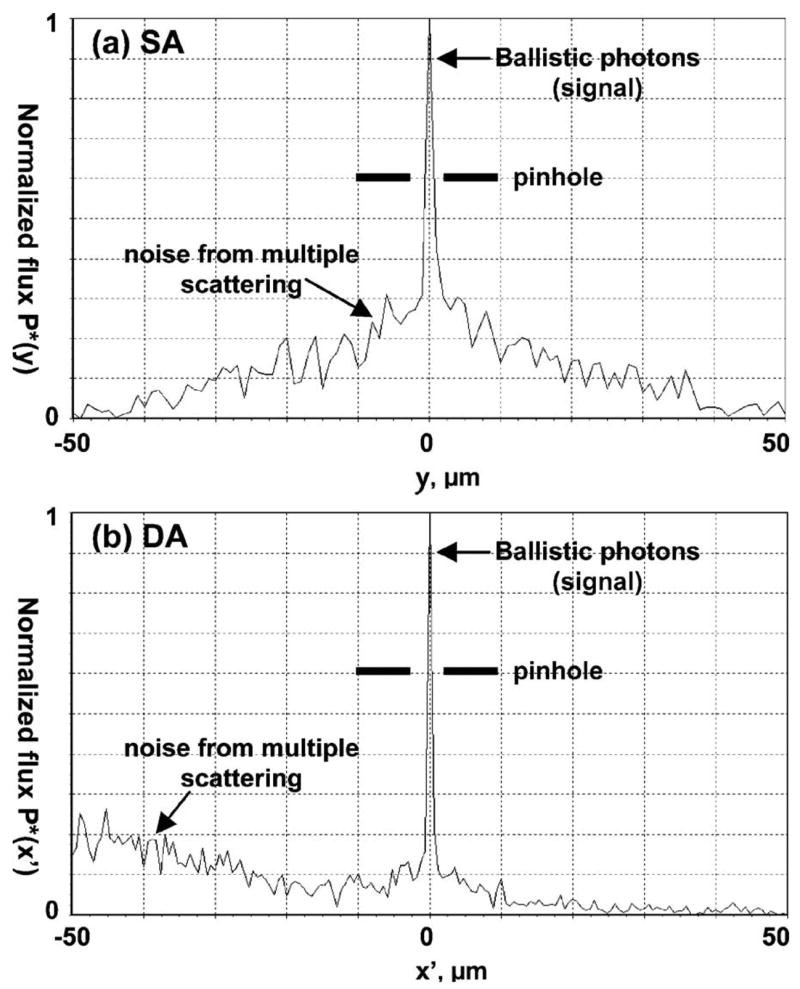
P(y,z) is defined to be the photon flux distribution on the SA detector. We consider only one line (z=0) of this distribution along the y axis. Define P*(y)=P(y,0)/Pmax to be the normalized photon flux distribution where Pmax is the maximum flux at the detector. Figure 2(a) shows this normalized flux distribution P*(y) for the SA model. It consists of two components, the ballistic photons (signal) and the photons from multiple scattering (noise). The maximum flux of ballistic photons occurs at the center of the detector. Some multiply scattered photons will also reach the detector center. Placing a pinhole in front of the detector can filter out some but not all of the noise. Ideally, if there were sufficient ballistic photons available, we would choose the pinhole size to be comparable with the spot diameter given by diffraction theory, as shown in Fig. 2(a). Otherwise to obtain a sufficient signal, we might have to compromise and use a somewhat larger pinhole size. For the DA case, the detector is tilted by 30° from the x–y plane to the x′–y plane, as shown in Fig. 1(b). P(x′,y) is defined to be the photon flux distribution on the DA detector. Figure 2(b) shows the normalized photon flux distribution P*(x′) =P(x′ 0)/Pmax for the DA configuration along the x′ axis. It also exhibits the ballistic and noise components. The major difference for DA is that most of the multiply scattered photons arrive at the detector off the optic (collection) axis away from the pinhole. Thus, a higher number of ballistic to multiply scattered photons is collected at the DA detector, increasing the SNR.
Fig. 2.

Normalized photon flux distribution P* at the detector for (a) SA and (b) DA systems.
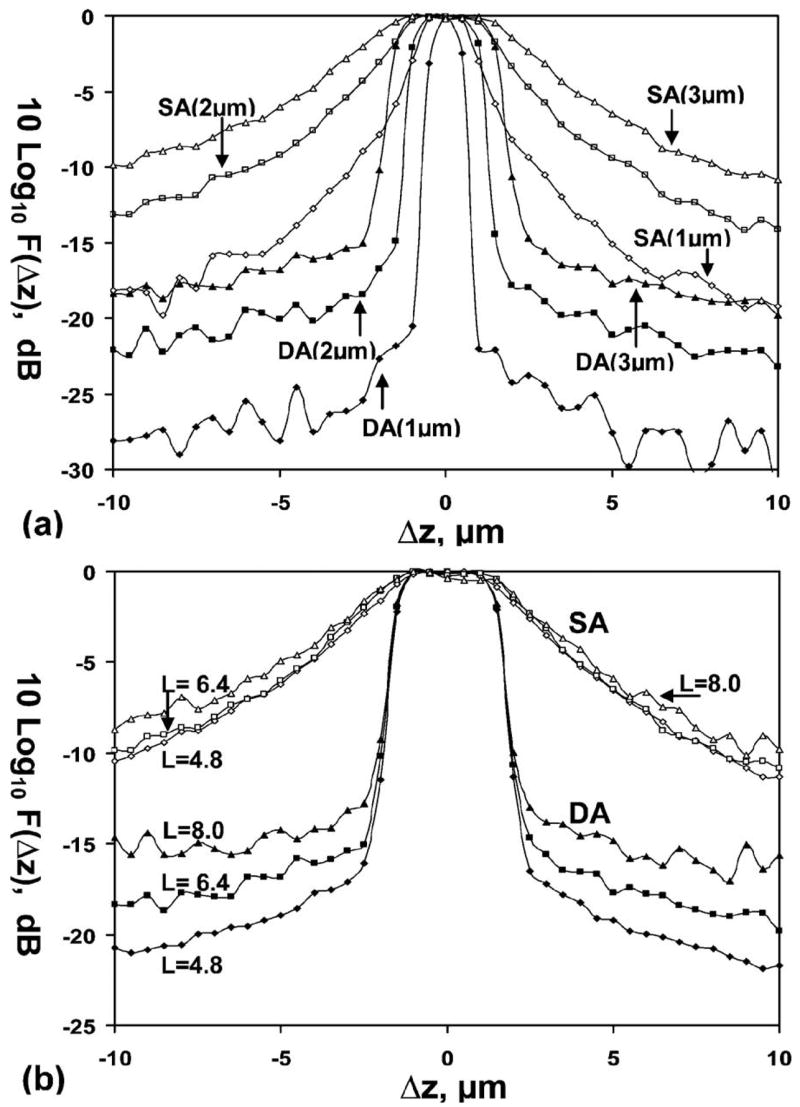
An implication of this result is that the DA confocal architecture has improved dynamic range compared with that of the SA, which can be shown by moving the mirror in the tissue along the z axis over the range −10 μm <Δz <10 μm and measuring the flux at the detector. The detector is divided into 101 bins along its length, and the sum of the photon flux is determined for all the bins that fall within a given pinhole diameter (D). We define f(Δz) to be the detector flux where the mirror is at location Δz with respect to the focal plane at z=0. Define F(Δz) =f(Δz)/f(0) to be the normalized flux. The axial response is shown as a plot of this normalized flux F(Δz) versus Δz. We define the total optical length of the tissue region, L, to be twice the product of the scattering coefficient μs and the tissue depth t, or L=2 μst. The factor of 2 arises because the total path length is twice the tissue depth. For the SA and DA configurations, we take the pinhole diameters to be D=1,2, and 3 μm, corresponding to typical fiber core dimensions, and L =6.4, corresponding to typical parameters of gastrointestinal epithelium (μs =16 mm−1 and t=200 μm). The axial responses on a logarithmic scale, [10 log10 F(Δz)], are shown in Fig. 3(a). These plots show improved dynamic range for the DA confocal architecture compared to that of SA with all three core diameters. Note, however, that this result does not take into account the diffraction of the ballistic component, which will be accounted for in a future development of this theory.
Fig. 3.

Axial response of normalized photon flux shows improved dynamic range for the DA over the SA configuration. (a) Pinhole diameters, D=1, 2, and 3 μm for fixed optical length L=6.4; (b) optical lengths L=4.8, 6.4, and 8.0 for fixed pinhole diameter of D=3 μm.
The normalized axial responses F(Δz) on a logarithmic scale for SA and DA at optical lengths L =4.8, 6.4, and 8.0, and D=3 μm, are shown in Fig. 3(b). At λ=633 nm, μs is approximately 7 mm−1 foresophagus tissue [11] and approximately 20 mm−1 for normal colon mucosa. The range of tissue depths spanned by L=4.8 to 8 is 340 to 570 μm for theesophagus and 120 to 200 μm for the colon. The simulation provides sufficient photon statistics over this range of L; for example for L=8, the worst case, a beam with 28×106 incident photons results in approximately 14,000 photons reflected from the focal plane and approximately 700 collected when the mirror is 10 μm away from the focal plane. For a given pinhole diameter, in this case D=3 μm, the DA configuration has significantly better dynamic range than that of the SA over a physiologically relevant range of optical lengths.
The superior DA axial response has a simple geometric explanation. In the DA case, when the mirror moves away from the focal plane by ±Δz, the centroid of the beam is steered away from the optic axis, where the center of the pinhole is located, by ±2Δz sin θ. Even taking into consideration diffraction and the broadening of the out-of-focus beam, the beam intensity decreases exponentially when Δz > D/2 (for θ=30°). But in the SA case, some photons scattered from the vicinity of the focal planes can still be collected by the detector through the pinhole. Thus the spatial filtering effect by a pinhole for SA is not as effective as for DA. The implication for imaging is evident. In the SA case, those multiply scattered photons in the direction of the ballistic photons, starting from the surface to deep within the tissue, are gathered by the detector in spite of a pinhole to filter out-of-focus light. This explains why in Fig. 2(a) the SA configuration has a large noise component alongside the ballistic component. Thus the DA confocal architecture provides optical sectioning capability that is superior to that of the conventional SA in terms of SNR and dynamic range, and this result can be generalized to a range of relevant pinhole sizes. As a result, the DA architecture allows for imaging with greater tissue penetration depths and is thus capable of imaging in the vertical cross section. The implementation of the DA confocal configuration to an endoscope has significant implications for in vivo imaging.
Acknowledgments
This work was funded, in part, by grants from the National Institutes of Health, including K08 DK067618 (TDW), U54 CA105296, and R33 CA109988. L.K. Wong also acknowledges the support of the Center for Biophotonics, a National Science Foundation Center managed by the University of California, Davis, PHY 0120999. The authors thank Chris Contag and J. T. C. Liu for reviewing the manuscript.
References
- 1.Dickensheets DL, Kino GS. Opt Lett. 1996;21:764. doi: 10.1364/ol.21.000764. [DOI] [PubMed] [Google Scholar]
- 2.Yelin D, Rizvi I, White WM, Motz JT, Hasan T, Bouma BE, Tearney GJ. Nature. 2006;443:765. doi: 10.1038/443765a. [DOI] [PubMed] [Google Scholar]
- 3.Webb RH, Rogomentich F. Appl Opt. 1999;38:4870. doi: 10.1364/ao.38.004870. [DOI] [PubMed] [Google Scholar]
- 4.Wang TD, Mandella MJ, Contag CH, Chan NY, Kino GS. Opt Lett. 2003;28:414. doi: 10.1364/ol.28.000414. [DOI] [PMC free article] [PubMed] [Google Scholar]
- 5.Wang TD, Contag CH, Mandella MJ, Chan NY, Kino GS. Opt Lett. 2003;28:1915. doi: 10.1364/ol.28.001915. [DOI] [PMC free article] [PubMed] [Google Scholar]
- 6.Liu JTC, Mandella MJ, Friedland S, Soetikno R, Crawford JH, Contag CH, Kino GS, Wang TD. J Biomed Opt. 2006;11:054019. doi: 10.1117/1.2363363. [DOI] [PMC free article] [PubMed] [Google Scholar]
- 7.Prahl S. Mie scattering calculator. http://omlc.ogi.edu/calc/mie_calc.html.
- 8.Bohren C, Huffman D. Absorption and Scattering of Light by Small Particles. Wiley; 1983. [Google Scholar]
- 9.Henyey L, Greenstein J. Astrophys J. 1941;93:70. [Google Scholar]
- 10.Prahl SA, Keijzer M, Jacques SL, Welch AJ. Proc SPIE. 1989;5:102. doi: 10.1002/lsm.1900090210. [DOI] [PubMed] [Google Scholar]
- 11.Bays R, Wagnieres G, Robert D, Braichotte D, Savary JF, Monnier P, van den Bergh H. Appl Opt. 1996;35:1756. doi: 10.1364/AO.35.001756. [DOI] [PubMed] [Google Scholar]


