

Abstract
We present a novel approach to optical mammography and initial clinical results. We have designed and developed a frequency-domain (110-MHz) optical scanner that performs a transillumination raster scan of the female breast in approximately 3 min. The probing light is a dual-wavelength (690 and 810 nm, 10-mW average power), 2-mm-diameter laser beam, and the detection optical fiber is 5 mm in diameter. The ac amplitude and phase data are processed with use of an algorithm that performs edge effect corrections, thereby enhancing image contrast. This contrast enhancement results in a greater tumor detectability compared with simple light intensity images. The optical mammograms are displayed on a computer screen in real time. We present x-ray and optical mammograms from two patients with breast tumors. Our initial clinical results show that the frequency-domain scanner, even at the present stage of development, has the potential to be a useful tool in mammography.
As the number-one killer of women, breast cancer annually fells more than 44,000 women in the United States alone. Early diagnosis of the disease is the key to successful treatment. Currently, the most effective screening and clinical tool is x-ray mammography. Because x-ray mammography exposes the patient to ionizing radiation, thus causing risk of cancer induction, a number of diagnostic techniques, including positron emission tomography, MRI, ultrasound, and thermography, have developed. In some instances, for example with ultrasound data, extensive computer enhancement algorithms may substantially improve the utility of the resulting images in detecting tissue inhomogeneities in the breast. Optical imaging holds appeal as an alternative tool in mammography because it uses nonionizing radiation (permitting continuous or repeated exposure), is noninvasive, does not require injection of contrast agents, is relatively portable, and is economical compared with positron emission tomography or MRI. Optical techniques measure unique optical characteristics of tissue that are not detected by the other methodologies cited above. These techniques also offer the potential to provide quantitative measurements, including functional information about the tissue (1).
In optical imaging, the choice of visible/near-infrared radiation is dictated by its relatively high penetration in breast tissue, which permits transillumination of the female breast. Cutler (2) first proposed breast transillumination in the 1920s. Progressive improvements of the method in the 1970s by Gros et al. (3) and in the 1980s by Carlsen (4) lead to a renewed enthusiasm and to the introduction of the terms “diaphanography” and “lightscanning,” respectively. These approaches to optical mammography employ a broad beam of visible and near-infrared continuous wave light, which illuminates one side of the breast. On the opposite side of the breast, a video camera sensitive in the near-infrared acts as the detector. Notwithstanding some encouraging results (5), medical acceptance of diaphanography has been subdued because of clinical studies that reported low sensitivity or a relatively high number of false positive results (6, 7).
The primary difficulty with optical mammography arises from the strongly diffusive nature of light propagation in breast tissue. As a result, contrast (8) and resolution (9) of optical images are reduced. In particular, diaphanography has performed poorly in the presence of small and deep tumors (8, 10). Improved contrast and resolution can be achieved by employing a narrow-beam light source and by scanning it in tandem with a localized optical detector (11). This approach enhances detectability of deep optical inhomogeneities and provides high sensitivity to superficial structures near both the source side and the detector side (whereas diaphanography is highly sensitive only at the detector side). Continuous wave light further limits diaphanography. At a given wavelength, the only directly measurable quantity is transmitted intensity. A richer information content can be achieved with time-resolved spectroscopy in either the time domain, where the light source is pulsed (12), or in the frequency domain, where the light source intensity is sinusoidally modulated.¶ Specifically, time-resolved methods allow for the explicit separation of absorption and scattering coefficients of the tissue, which can result in diagnostic capabilities. Furthermore, contrast in the raw image can be enhanced by applying diffusion theory, thereby improving tumor detectability. Of course, further enhancements may be obtained by computer image processing.
In this article, we describe a novel potential diagnostic technique with strong promise for light mammography. It is based on a narrow-beam transillumination scan of the female breast with frequency-domain methods. In this approach, the detected signal is due to all the photons transmitted through the breast tissue, regardless of their diffusive path length in breast tissue. In addition to intensity attenuation, a measurement of the frequency-domain phase shift enables one to determine the mean path length of the transmitted photons as a second parameter. An alternative approach is constituted, in the time domain, by time-gated detection methods (13–15), by which only the photons with the shortest times of flight are detected. While time-gated methods have produced improved image contrast and resolution, with respect to methods that collect all the transmitted photons, they provide a low signal-to-noise ratio in the transillumination of a 4- to 7-cm-thick breast tissue. Therefore, to obtain a signal-to-noise ratio sufficient for detection of optical inhomogeneities, we use the whole diffusive portion of transmitted light. The research prototype, which implements our frequency-domain approach to optical mammography, is currently undergoing a first clinical examination. The objective of this article is to demonstrate the superior performance of this frequency-domain technology in optical mammography with respect to diaphanography and lightscanning. We introduce a projection image transformation algorithm for contrast enhancement and present the initial optical images of clinically identified tissue inhomogeneities in the breast. The transformation algorithm is based on an analysis of the physical properties of light propagation in the breast (16).
METHODS
Optical Mammography Apparatus.
The scientific research prototype, light mammography apparatus (LIMA), developed at Carl Zeiss, is based on the principles of frequency-domain spectroscopy (17). A schematic diagram of the system is shown in Fig. 1. This apparatus uses two laser diodes, emitting at 690 nm and 810 nm. The laser intensities are sinusoidally modulated at frequencies of 110.0010 MHz and 110.0008 MHz, respectively. The average emitted power is about 10 mW. The two laser beams (2 mm cross-section diameter) are collimated and made collinear, and an optical fiber (5 mm in diameter) located on the opposite side of the breast delivers light to the detector. The detector is a photomultiplier tube (PMT) whose gain is modulated at a frequency of 110 MHz. The differences between the modulation frequencies of the light sources and the modulation frequency of the PMT gain are Δf1 = 1 kHz (relative to the signal at 690 nm) and Δf2 = 0.8 kHz (relative to the signal at 810 nm), and are called cross-correlation frequencies. The output signal of the PMT contains harmonic components at the two cross-correlation frequencies, which are isolated by an electronic filtering procedure and then processed. The ac amplitude and phase of the signals at Δf1 and Δf2 are determined and constitute the raw data of the frequency-domain measurement. In this fashion, not only do we translate the information content of the high frequency signal (110 MHz) to lower frequency components (1 kHz and 0.8 KHz), which are more easily processed, we also provide an electronic separation of the signals at the two wavelengths. The instrument works in the transmission mode, with the breast occupying the space between the light source and the detector optical fiber. The breast is slightly compressed between two parallel glass plates. The dual-wavelength laser beam and the detector fiber are scanned in tandem along the upper and lower plane, respectively. They always face each other so that the source–detector distance is fixed. The entire compression assembly with the two glass plates can be rotated by 90° to allow for data acquisition in craniocaudal and mediolateral projections. The scanning process is entirely automatic, in the sense that both the scanning region and the optimal PMT average gain level are automatically determined. The extension of the scanning step, and hence the image pixel size, can be set by software. In the mammograms presented in this article, the scanning step was 1.5 mm in both scanning directions. The total acquisition time for an optical mammogram is about 3 min, but it can be reduced at the expense of signal-to-noise ratio. The phase noise is typically 0.2°, whereas the ac noise is typically 0.1%. Initial clinical data on 15 patients affected by breast cancer were collected with the frequency-domain LIMA. The degree of breast compression was adjusted to the patient’s perception of discomfort to avoid any pain. Optical mammograms were obtained in craniocaudal and mediolateral projections for each breast. We carefully verified that the patients examined did not present hematomas due to prior fine needle biopsy.
Figure 1.

Schematic diagram of the frequency-domain LIMA. A radiofrequency oscillator (RF-Osc.) provides sinusoidally modulated current signals at two frequencies, namely f + Δf1 and f + Δf2 (f = 110 MHz, Δf1 = 1 kHz, and Δf2 = 0.8 kHz). These two signals supply two laser diodes (LD1 emitting at 690 nm and LD2 emitting at 810 nm) whose output beams (≈10 mW in power) are delivered to the breast. The radiofrequency oscillator also provides a signal at frequency f that modulates the gain of the detector. The frequency-domain raw data, ac amplitude and phase, are determined after signal processing of the detector output and are made available to the edge correction computer algorithm. The computer also controls the mechanical tandem scan of the laser beams and of the detector fiber, along the glass plates used for slight breast compression.
Projection Image Transformation Algorithm.
The main difficulty in the interpretation of the raw data collected by the frequency-domain LIMA in this sampling geometry (transmission mode and breast compression) is given by photon lateral losses through the sides of the breast, and by breast thickness variability within the scanned area. As a result, the strongest effects visible in the raw data are an increase in the ac amplitude and a decrease in the frequency-domain phase as the scanner approaches the edges of the breast. The presence of an optical inhomogeneity such as a tumor appears as a slight deformation of this general pattern and is not easily discernible in the raw data images. To enhance the features related to tissue inhomogeneities and to reduce the effects of lateral losses and thickness variability (collectively called edge effects), we have developed a particular method of data processing. This method for edge correction is described in detail elsewhere (16). The basic idea is to use the phase information in a given pixel (x, y) to obtain an estimate of the breast thickness r(x, y) in that pixel. As a second step, we model the dependence of the ac amplitude with tissue thickness r, with the empirically determined inverse dependence 1/r, in the optically homogeneous case. Because the 1/r dependence of the ac amplitude takes into account the edge effects, we define a dimensionless parameter, which we call N, which is particularly insensitive to edge effects. In each pixel (x, y), N is defined as follows:
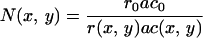 |
1 |
where r0 is the geometrical separation between the two compression plates, ac0 is the ac amplitude at a specific pixel where breast thickness is r0, and ac(x, y) is the amplitude measured at pixel (x, y). In Figs. 2 and 3, we show both the N images (B and E in both figures) and the ac amplitude images (C and F in both figures) for the two projections of a breast affected by cancer. A comparison of the N and ac amplitude images shows that the N image effectively corrects for edge effects and provides a better detectability of optical inhomogeneities with respect to the intensity image, which is equivalent to the lightscanning image. We stress that the improved detectability afforded by the N image is a result of employing frequency-domain techniques. N(x, y) is the parameter we plot in our optical mammograms (Figs. 2 B and E and 3 B and E), which are bidimensional projection images of the breast. The optical mammograms based on the N image are sensitive to both scattering and absorbing defects, but they are not capable of discriminating scattering from absorbing perturbations.
Figure 2.

X-ray mammograms (A, craniocaudal; D, mediolateral) and optical mammograms (B, craniocaudal; E, mediolateral) based on the N parameter of a female left breast with a tumor. C (craniocaudal) and F (mediolateral) are the optical mammograms obtained using simple light intensity data and show the lower contrast of these images with respect to the N images. Specifically, this figure refers to a 55-year-old Caucasian woman with an invasive ductal breast cancer [UICC pT2 pN0 (0/29) M0 G2 L0 V0] in the left breast (lateral lower quadrant). The major tumor is 3.0 cm in diameter. Clinical examination, highly suspect; x-ray mammography, malignoma; breast ultrasound, malignoma. The dimensions of the breast portion shown in the x-ray mammograms are as follows: (A) craniocaudal projection, 18 cm (base width) × 11 cm (protrusion); (D) mediolateral projection, 18 cm (base width) × 10 cm (protrusion). We observe that the x-ray and optical images cannot be compared point by point because the degree of compression and the compression geometry are different in the x-ray and optical approaches.
Figure 3.

X-ray mammograms (A, craniocaudal; D, mediolateral) and optical mammograms (B, craniocaudal; E, mediolateral) based on the N parameter of a female right breast with a tumor. C (craniocaudal) and F (mediolateral) are the optical mammograms obtained using simple light intensity data and show the lower contrast of these images with respect to the N images. Specifically, this figure refers to a 72-year-old Caucasian woman with an invasive ductal carcinoma of the breast, with a concomitant noninvasive ductal carcinoma in situ (UICC pT1a Nx M0 G2 L0 V0). The major tumor is 0.5 cm in diameter. Clinical examination, negative; x-ray mammography, slowly proliferating microcalcifications; in the craniocaudal mammogram, 0.5-mm suspect density correlating to microcalcifications. The dimensions of the breast portion shown in the x-ray mammograms are as follows: (A) craniocaudal projection, 18 cm (base width) × 12 cm (protrusion); (D) mediolateral projection, 18 cm (base width) × 9 cm (protrusion). We observe that the x-ray and optical images cannot be compared point by point because the degree of compression and the compression geometry are different in the x-ray and optical approaches.
Clinical Results.
The clinical data were acquired in the Robert Roessle Hospital of the Humboldt University. Written, informed consent was obtained from the patients before optical mammography was performed. The patients examined with optical mammography were also examined with x-ray and ultrasound, and they underwent surgery. In all cases, we know the type, the location, and the dimension of the tumor. We present the x-ray and optical mammograms for two representative patients to illustrate the different features of the two methods.
Figs. 2 and 3 show x-ray mammograms (A and D in both figures) and frequency-domain optical mammograms (B and E in both figures) for the two selected patients. A suspicious region, associated with a tissue inhomogeneity, is clearly visible in the optical mammograms, in both projections and at both wavelengths. (Figs. 2 and 3 show optical images at 810 nm, but similar results were obtained at 690 nm). The suspicious regions were verified as tumors after surgery. In particular, Fig. 2 shows an image for a 55-year-old Caucasian woman with an invasive ductal cancer in the left breast. The major tumor is 3.0 cm in diameter. Fig. 3 shows an image for a 72-year-old Caucasian woman who suffers from an invasive ductal carcinoma with concomitant noninvasive ductal carcinoma in situ, located in the right breast. The major tumor is 0.5 cm in diameter. We point out that the gray scale plots representing the optical mammograms are linear scales in which white corresponds to the lowest value of N in the image and black corresponds to the highest value. There is no adjustment to the scale or in the distribution of gray levels. The optical images can thus be displayed in real time during the clinical examination with no additional manipulations. As can be seen in Figs. 2 and 3, the x-ray and optical mammograms appear quite different. The x-ray mammograms show multiple structures, and the identification of a tumor relies on the recognition of spatial patterns among these structures. Such recognition requires a well trained and experienced clinician, and it has been shown that two examiners do better than one. Currently, researchers are striving to develop computer programs capable of interpreting x-ray mammograms. By contrast, the gray level plots of the optical mammograms show spatial variations of the breast’s optical properties. Because of the intrinsically lower resolution of the optical approach with respect to the x-ray methods, the optical mammograms appear as smooth images compared with the fine-structured x-ray mammograms. On the basis of random walk theory, the resolution limit of optical mammography is believed to be approximately 1 cm for deep tumors (9). In cases similar to those shown in Figs. 2 and 3, where the optical properties of the cancerous tissue are significantly different than those of the healthy tissue, optical mammograms clearly show the presence of the tumor. The tumor determines a 4-fold contrast in Figs. 2B and 3 B and E, and a 10-fold contrast in Fig. 2E. The interpretation of optical mammograms, which are made of digitized and quantitative data, is potentially less problematic, and might permit automatic diagnosis or risk indication.
The two representative cases shown in Figs. 2 and 3 are selected from data collected on 15 patients affected by breast cancer. In 11 of these cases, the frequency-domain optical mammograms showed an area of higher N value corresponding to the tumor position in both perpendicular views (craniocaudal and mediolateral). This result shows the practical applicability of our technique. The assessment of the clinical effectiveness of the method goes beyond the purpose of this paper and requires a systematic clinical study on a statistically significant sample population.
DISCUSSION
The purpose of showing the success of frequency-domain optical mammography in the case reported in Fig. 2 is to demonstrate the potential effectiveness of the method. The tumor reported in Fig. 2 was easily detected by clinical examination and by x-ray mammography. The tumor reported in Fig. 3 is a more challenging case. This tumor, only 5 mm in diameter, is clearly detected by optical mammography. Although the spatial resolution of our optical method under the present experimental conditions is approximately 1 cm, it is possible to detect smaller objects provided that the optical contrast is sufficient. Our research has shown that the difference in the N parameter between tumor and healthy tissue does not necessarily change between 690 and 810 nm. In most cases, the images at the two wavelengths were similar. In two cases, however, we found some differences between the images at the two wavelengths. Thus, the choice of appropriate wavelengths may enhance tumors’ spectral differences. In fact, some recent studies have been conducted to investigate the differences between the spectral absorbances of cancerous and healthy tissue (18–21). We note that in the two cases showing a wavelength dependence, the single-wavelength N image was also able to detect the tumor.
CONCLUSIONS
The initial clinical results presented in this article show a significant advance in optical mammography as a result of the use of both the frequency-domain technique and a transformation algorithm for edge effect corrections. The frequency-domain method is compatible with compact and relatively inexpensive instrumentation (Fig. 1). The edge correction parameter N significantly improves image contrast, and hence tumor detectability, with respect to conventional diaphanography. The promise of optical methods lies in high contrast, detectability, and specificity rather than high spatial resolution, which is intrinsically limited by the diffusive nature of light propagation in tissue. Further enhancement in contrast can be achieved by introducing additional light sources, wavelengths, modulation frequencies, and/or multiple detectors. The ultimate goal of optical mammography is in diagnostic rather than in radiological capabilities. In addition to contrast enhancement, time-resolved methods (either in the frequency domain or the time domain) have the potential to provide an in situ optical biopsy by measuring localized optical properties (20–22). The information necessary to determine the local absorption and scattering values is contained in the time-resolved signal, and it may provide an additional avenue to discriminate healthy from diseased tissue.
Acknowledgments
We are grateful to C. Wetzel, M.D., for provision of and support in reading the x-ray mammograms. We also thank W. Walch for technical support. The work at Carl Zeiss is supported in part by the Bundesministerium für Forschung und Technologie. The Laboratory for Fluorescence Dynamics is supported by National Institutes of Health Grants RR03155 and CA57032, and by the University of Illinois at Urbana-Champaign.
ABBREVIATIONS
- LIMA
light mammography apparatus
- PMT
photomultiplier tube
Footnotes
Gratton, E., Mantulin, W. W., vande Ven, M. J., Fishkin, J. B., Maris, M. B. & Chance, B., Proceedings of the Third International Conference for Peace Through Mind/Brain Science, Aug. 5–10, 1990, Hamamatsu City, Japan, pp. 183–189.
References
- 1.Benaron D A, Van Houten J P, Cheong W, Kermit E L, King R A. Proc SPIE Int Soc Opt Eng. 1995;2389:582–596. [Google Scholar]
- 2.Cutler M. Surg Gynecol Obstet. 1929;48:721–727. [Google Scholar]
- 3.Gros C M, Quenneville Y, Hummel Y. J Radiol Electrol Med Nucl. 1972;53:297–306. [PubMed] [Google Scholar]
- 4.Carlsen E. Diagn Imaging. 1982;4:28–34. [Google Scholar]
- 5.Bartrum R J, Crow H C. Am J Roentgenol. 1984;142:409–414. doi: 10.2214/ajr.142.2.409. [DOI] [PubMed] [Google Scholar]
- 6.Sickles E A. Am J Roentgenol. 1984;142:841–844. doi: 10.2214/ajr.142.4.841. [DOI] [PubMed] [Google Scholar]
- 7.Alveryd A, Andersson I, Aspegren K, Balldin G, Bjurstam N, et al. Cancer. 1990;65:1671–1677. doi: 10.1002/1097-0142(19900415)65:8<1671::aid-cncr2820650802>3.0.co;2-a. [DOI] [PubMed] [Google Scholar]
- 8.Navarro G A, Profio E. Med Phys. 1988;15:181–187. doi: 10.1118/1.596249. [DOI] [PubMed] [Google Scholar]
- 9.Gandjbakhche A H, Nossal R, Bonner R F. Med Phys. 1994;21:185–191. doi: 10.1118/1.597298. [DOI] [PubMed] [Google Scholar]
- 10.Drexler B, Davis J L, Schofield G. Radiology. 1985;157:41–44. doi: 10.1148/radiology.157.1.4034975. [DOI] [PubMed] [Google Scholar]
- 11.Jarry G, Ghesquiere S, Maarek J M, Fraysse F, Debray S, Hung B M, Laurent D. J Biomed Eng. 1984;6:70–74. doi: 10.1016/0141-5425(84)90013-x. [DOI] [PubMed] [Google Scholar]
- 12.Patterson M S, Chance B, Wilson B C. Appl Opt. 1989;28:2331–2336. doi: 10.1364/AO.28.002331. [DOI] [PubMed] [Google Scholar]
- 13.Andersson-Engels S R, Berg R, Svanberg S, Jarlman O. Opt Lett. 1990;15:1179–1181. doi: 10.1364/ol.15.001179. [DOI] [PubMed] [Google Scholar]
- 14.Benaron D A, Stevenson D K. Science. 1993;259:1463–1466. doi: 10.1126/science.8451643. [DOI] [PubMed] [Google Scholar]
- 15.Wang L, Ho P P, Liu C, Zhang G, Alfano R R. Science. 1991;253:769–771. doi: 10.1126/science.253.5021.769. [DOI] [PubMed] [Google Scholar]
- 16.Fantini S, Franceschini M A, Gaida G, Gratton E, Jess H, Mantulin W W, Moesta K T, Schlag P M, Kaschke M. Med Phys. 1996;23:149–157. doi: 10.1118/1.597696. [DOI] [PubMed] [Google Scholar]
- 17.Kaschke M, Jess H, Gaida G, Kaltenbach J M, Wrobel W. Proc Opt Soc Am. 1994;21:88–92. [Google Scholar]
- 18.Ertefai S, Profio A E. Med Phys. 1985;12:393–400. doi: 10.1118/1.595701. [DOI] [PubMed] [Google Scholar]
- 19.Heusmann H, Kölzer J, Otto J, Puls R, Friedrich T, Heywang-Köbrunner S, Zinth W. Proc SPIE Int Soc Opt Eng. 1995;2326:370–382. [Google Scholar]
- 20.Fishkin J B, Coquoz O, Anderson E A, Brenner M, Tromberg B J. Appl Opt. 1997;26:10–20. doi: 10.1364/ao.36.000010. [DOI] [PubMed] [Google Scholar]
- 21.Tromberg, B. J., Coquoz, O., Fishkin, J. B., Pham, T., Anderson, E. R., Butler, J., Cahn, M., Gross, J. D., Venugopalan, V. & Pham, D. (1997) Philos. Trans. R. Soc. London B, in press. [DOI] [PMC free article] [PubMed]
- 22.Kang K A, Chance B, Zhao S, Srinivasan S, Patterson E, Troupin R. Proc SPIE Int Soc Opt Eng. 1993;1888:487–499. [Google Scholar]