Abstract
Continuous segments of synaptic noise were recorded in vivo from teleost Mauthner cells and were studied with the methods of nonlinear analysis. As in many central neurons, this ongoing activity is dominated by consecutive inhibitory postsynaptic potentials. Recurrence plots and first or third order Poincaré maps combined with surrogate shuffling revealed nonrandom patterns consistent with the notion that synaptic noise is a continuously varying mixture of periodic and chaotic phases. Chaos was further demonstrated by the occurrence of unstable periodic orbits. The nonrandom component of the noise is reproducibly and persistently reduced when the level of background sound, a natural stimulus for networks afferent to the Mauthner cell, is briefly elevated. These data are consistent with a model involving a reciprocally connected inhibitory network, presynaptic to the Mauthner cell and its intrinsic properties. The presence of chaos in the inhibitory synaptic noise that regulates the excitability of the Mauthner cell and its sensitivity to external stimuli suggests that it modulates this neuron’s function, namely to trigger a fast escape motor reaction following unexpected sensory information.
Keywords: chaos, recurrence plot, unstable periodic orbit, auditory inputs, attention
The membrane potential of vertebrate central neurons fluctuates constantly. Although this process, called synaptic noise, is ubiquitous, its fine structure is poorly documented. Synaptic noise is due to the postsynaptic actions of packets of neurotransmitters, or quanta, released from afferent synapses as a consequence of intermittent firing of the parent neurons. It has been suggested that these summed fluctuations reflect the firing pattern of presynaptic networks, that they modulate the input/output relations of neurons (1–3), and that they are necessary for the implementation of some theoretical neuronal networks (4, 5).
Synaptic noise has been commonly considered to be stochastic (2, 6, 7) and is often modelled as such (8, 9). However, it is now possible to generate a refined description of its structure with nonlinear dynamic analysis, which has been particularly useful in various fields in which apparently random phenomena have hidden specific structures that cannot be resolved with linear tools (10). The question of the presence of nonlinear dynamics in the brain (11–13), and particularly of chaos, arises naturally in view of its properties (sensitivity to initial conditions and ability to switch among many different modes), which also characterize biological behaviors (13).
Despite the severe limitations in identifying chaos due to the possible mixture of different dynamics (14), we have applied this methodology to study the temporal structure of synaptic noise recorded in vivo from a central neuron, namely the Mauthner cell (M-cell) of teleosts. We show features of chaos in this signal.
Synaptic Noise in the M-Cell
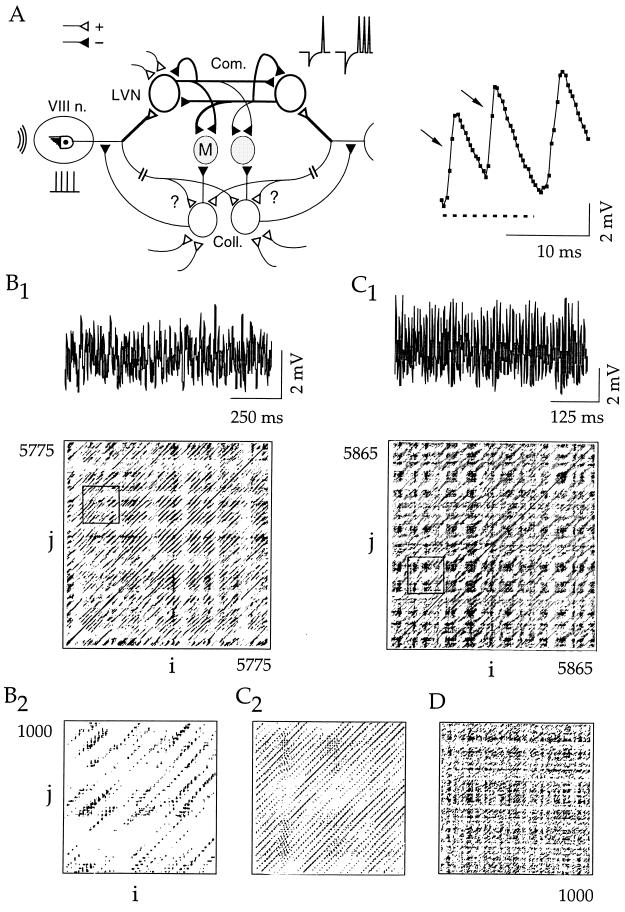
Spontaneous activity was recorded with KCl-filled microelectrodes in the proximal part of the M-cell lateral dendrite of adult goldfish (Carassius auratus, n = 5) and zebrafish (Brachydanio rerio, n = 5) with similar results for both. Animals were anaesthetized with 3-aminobenzoic ethyl ester acid (MS 222; Sandoz Pharmaceutical), immobilized with Flaxedil (Rhône-Poulenc) or pancuronium bromide, and continuously perfused with water. As shown in Fig. 1A, this activity is generated by two groups of glycinergic interneurons, one of which can be driven by auditory inputs (15) and it consists, mainly (1), of consecutive inhibitory postsynaptic potentials (IPSPs). With Fourier analysis, most spectra were dominated by a noisy broadband background, which could reflect either a stochastic process or chaos (10). Thus, more sophisticated tools were required to identify deterministic structures (such as periodic and/or chaotic ones) that could otherwise be considered as stochastic. For this purpose, synaptic noise was first digitized at 24 kHz for visual inspection. To achieve a compromise between computation time and sampling rate, the latter was taken as 1.5 or 3 kHz for RPs and 3 kHz for Poincaré maps. As shown in Fig. 1A (Right) this rate was sufficient for representing the whole signal, including its fast rising time to peak and for studies of correlations between closely spaced IPSPs. The analysis was done with homemade programs written in Labview 4 for Macintosh Power Computers.
Figure 1.
Continuous variations of synaptic noise. (A Left) Representation of the M-cell’s (M) feed forward inhibitory networks (▴, −) and their excitatory inputs (▵, +) issued by eighth nerve primary fibers (VIII n.). Two sets of inhibitory interneurons are shown: the commissural ones (Com.) with their somata in the lateral vestibular nucleus (LVN) and the collateral cells (Coll.). Note the presence of reciprocal connections and feedback loops. Thicker lines outline the connections incorporated in a model, which also includes a history-dependent postanodal firing of the interneurons (Inset). Acoustic waves activate hair cells and induce repetitive discharges (vertical bars) in VIII n. fibers. (Right) Typical background activity with inverted unitary IPSPs (arrows), sampled at 3 kHz (dots), and reference baseline (dashed). (B and C) Analysis of 2 sec of synaptic noise (sampling rate = 3 kHz). (B1 and C1) Digitized data (Upper) and corresponding recurrence plots (RPs; Lower) from two fish showing checkerboard structures with a small scale background suggesting chaos (B1) and long lines parallel to the main diagonal indicating periodic activities embedded in aperiodic ones (C1). (B2 and C2) Larger magnifications of the areas indicated by boxes in the B1 and C1. (D) Fragment of a homogeneous RP obtained with a model of Gaussian series. For all plots, embedding dimensions = 10; Σj=1NeNj = 2.5%Ne2 ± 2,500 dots; and lag = 8.4, 5, and 0.66 msec for B, C, and D, respectively.
Evidence in RPs for Nonrandom Components of Synaptic Noise
We first used RP analysis to locate recurring patterns and to reveal dynamic behaviors possibly hidden in the biological signal (16). For RPs, minimal size or stationarity, which are not often observed in biological systems, are not necessary. RPs portray the dynamics of the embedded signals in the form of distinctive patterns of dots interspersed in a square matrix. Plots were constructed (Appendix A) with a d-dimensional signal using the method of time delays applied on 2-sec epochs of activity (Fig. 1 B1 and C1). These plots already suggested the existence of nonrandom motions. For example, they showed dot organizations resembling chaos (Fig. 1 B1 and B2) or a periodical activity, regular or intermittent, ranging from 20 to 80 Hz superimposed with aperiodic figures, also compatible with nonlinear dynamics (Fig. 1 C1 and C2). A significant variability of these patterns was apparent not only among different preparations but also during the same experiment (data not shown). In contrast, homogenous fillings indicative of a stochastic process, as exemplified in Fig. 1D, were never observed in our RPs.
Two parameters were available to validate the conclusions obtained with the visual inspection of the RPs (17). The first, called ratio (R), is the number of dots included in upward diagonal line segments, divided by the total number of points; it quantifies the degree to which the signal is deterministic. The second, or entropy (E), describes the distribution of the lengths of the different line segments. Both terms are temporal sequence-sensitive (Appendix A). They were used to assess the statistical significance of the RPs with the help of surrogates (Appendix B), i.e., of randomized representations of the original data files according to random, Gaussian scaled (18), and Fourier shuffle (19) algorithms. In this experimental series, R and E were calculated on RPs obtained from series of nonoverlapping 1-sec successive segments with the same cutoff, r, in each experiment, a lag of 33 msec (first minimum of the autocorrelation function), an embedding dimension of 5, and a sampling frequency Fe = 1.5 kHz, and they were compared with those obtained with n = 100 Fourier shuffle surrogates. The null hypothesis was rejected in 239/275 successive 1-sec windows, extracted from the four experiments that were tested.
Different Patterns of Noise Identified with Poincaré Maps (PMs)
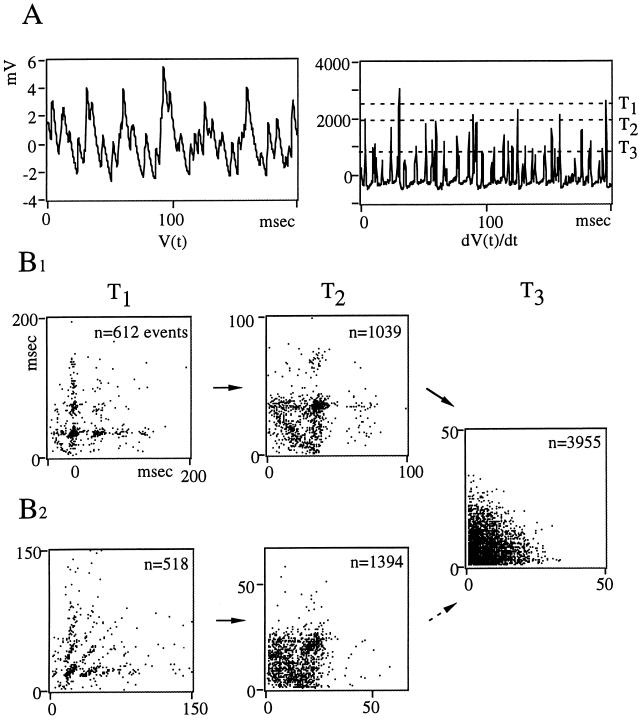
Several converging approaches are necessary to identify nonlinear patterns and avoid spurious identification of chaos. Also, RPs treat signals as a whole, including instrumental noise. Thus we converted the signals into sequences of events (In, In+1) to obtain PMs of interevent intervals (20). These events were extracted from the raw data (Fig. 2A Left) using the time derivative of the individual synaptic potentials (Fig. 2A Right), a procedure that allows the detection of IPSPs even when they overlap. As the threshold T used for constructing maps was lowered, the number of detected events increased, and several typical patterns emerged, indicating that synaptic noise can combine several dynamics. For example, PMs changed from periodic, with constant intervals between points, indicating a frequency of 35 Hz (Fig. 2B1, T1), to high dimensional, i.e., without evidence of a typical structure (Fig. 2B1, T3). The transition between these extremes was marked by a triangular motif, due presumably to the random occurrence of at most one event between each period (Fig. 2B1, T2). Chaotic patterns characterized by extended structures that are not sets of points could also be present at high thresholds (Fig. 2B2, T1), and they were progressively blurred at lower values of T (Fig. 2B2, T2 and T3). Finally, high dimensional organizations could dominate in the return maps (not shown).
Figure 2.
Mixtures of dynamic behaviors revealed by first order PMs. (A) Sampled (3-kHz) synaptic noise (Left) and its first derivative (Right), illustrating the threshold method; events detected above a given level (labeled T1, T2, and T3) were used to plot the nth interval against the previous one. (B1 and B2) Resulting maps obtained from 30 sec of continuous recordings, in two different experiments. (B1) From the same data set as that partially shown in A. As the threshold is lowered, the pattern initially periodic (Left, T1) becomes triangular (Center, T2). (B2) The return maps show series of points which are not space filling and suggest chaos (Left) or attracting clusters centered around a period of 25 msec (Center). Note that in both experiments, the return maps are high dimensional for the lowest values of T (T3, Right).
In retrospect, it was noted that the most effective thresholds for distinguishing these contrasting patterns were those which isolated the largest IPSPs, including composite ones (for T1 and T2) or which included all signals, except most monoquantal IPSPs and small excitatory events propagated from the distal dendrite (for T3).
Confirmation of Chaotic Patterns with Unstable Periodic Orbits (UPOs)
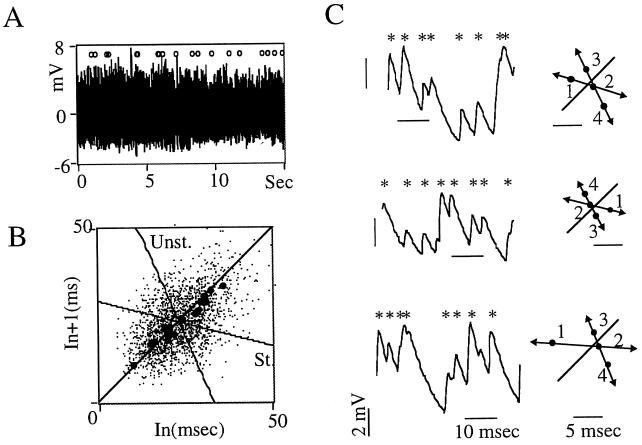
We searched for UPOs (20–23), as an alternative to conventional measures of chaos that yield equivocal results in living tissues (20, 23, 24). UPOs found in PMs (Fig. 3 A and B) consist of sequences of points approaching a fixed one on the identity line with ever-decreasing separations, followed by a sequence of points departing at ever-increasing distances (22). Evidence that they obey the specific rules of unstable fixed point behavior (20, 22, 23) is illustrated in Fig. 3C. The occurrence of UPOs (>1 per 100 events) was more common in low threshold maps. Their significance was tested with Fourier shuffle surrogates (Appendix B) constructed for each threshold series (n = 500), with values of K ≥ 2.5 in six out nine fish tested.
Figure 3.
UPOs in third order PMs. (A) A 15-sec segment of synaptic noise (digitized at 3 kHz) displayed at a slow sweep speed with the location of UPOs (n = 20) indicated by ○. (B) Return plot showing the centers of the UPOs (•) signaled in A, and the mean of their stable (St.) and unstable (Unst.) directions. Note that most centers are clustered, suggesting multiple approaches to the same fixed point, as expected from candidate UPOs. (C) Examples of synaptic events (asterisks) selected with a value of T3 similar to that in Fig. 2B (Left), and reconstruction of the UPOs that they generate (Right). The numbered dots indicate the corresponding interevent intervals and delineate almost parallel stable (arrows 1 and 2) and unstable directions (arrows 2–4). Statistical tests indicated K values of 3.7, 2.82, and 2.72 for random, Gaussian scaled, and Fourier shuffle surrogates, respectively. A, B, and C are from the same experiment.
Sudden Sounds Modify Chaotic Patterns
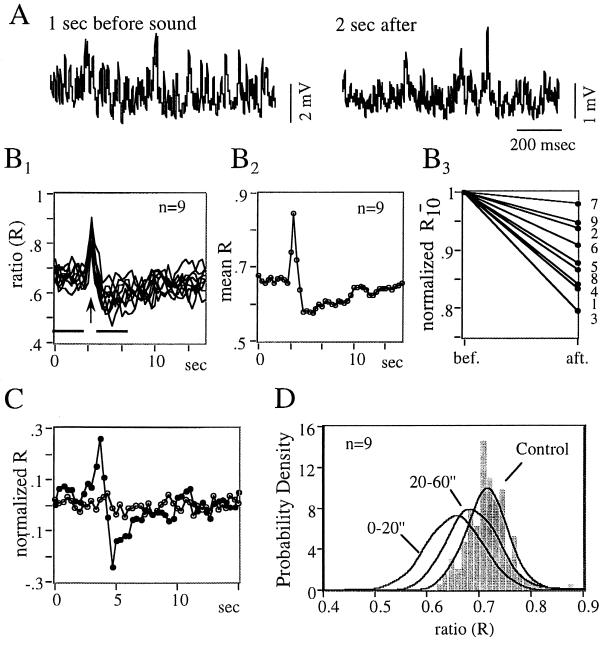
To test whether this dynamic system is sensitive to environmental changes, we investigated the effects of sensory stimuli known to reach the M-cell. In all trials, sounds (100 msec, 500 Hz, 75–90 dB) initiated bursts of excitatory synaptic events which, as expected (25) were in phase with the acoustic signal and were at twice its frequency (data not shown). These were accompanied by transient changes in the composition of the inhibitory synaptic noise (Fig. 4A) consisting of an initial increase followed by a longer lasting decrease in R (Fig. 4 B1–B3), a result found in 17 of 21 trials, in the four fish that were tested. This persistent decrease was due to changes in noise pattern rather than in amplitude distribution, as confirmed by the stability of R derived from surrogates (Fig. 4C) having the same mean and variance as the original data (P. Rapp, personal communication). While a reduction in this parameter indicates a corresponding decrement of the nonrandom component, it does not allow one to distinguish the relative shifts of the periodic and chaotic signals. Regardless, its modifications persisted for at least 60 sec (Fig. 4D), even though visually, synaptic noise had apparently returned to its control state earlier.
Figure 4.
Modifications of dynamics by sensory stimuli. All data are from the same experiment. (A) Segments of synaptic noise (sampling rate 1.5 kHz) recorded before (Left) and 2 sec after (Right) a tone. Note the decrease in signal amplitude, despite similar membrane potential (not shown). (B1–B3) Variations of the ratio, R, after sounds (B1). Superimposed plots of the R values versus time in a series of nine consecutive stimulations (arrow) repeated every minute. Each trace was constructed using 46 windows (RPs) of 1 sec, overlapping each other by 2/3 of a second, embedding dimension = 5, lag = 33 msec, and cutoff chosen so that = 2.5%Ne2 ± 1,000 dots (this constant value compensates for changes in signal amplitude). (B2) Mean biphasic change of R. (B3) Diagrams of normalized ratios of 10 epochs (R10, ordinate) before (bef.) and after (aft.) sounds, at times signaled by horizontal bars in B1. Numbers on the right indicate the order of stimulus presentations. (C) Plots obtained in one trial, of R versus time (•) and of its mean derived from surrogates (○, n = 50 per point). (D) Persistence of R modifications. Probability density function of R values obtained from consecutive windows of 1 sec each, for n = 160 sec of control period, 20 sec and 40 sec after each sound (nonoverlapping, same parameters as for B1). The probability density functions were estimated with a classical histogram (shown for the control) and with more accurate nonparametric methods known as Parzen estimators (thick lines) (26). Kolmogorov Smirnov tests ruled out that the three histograms originated from the same distribution (Qks < 10−5).
Discussion
Taken together, our results suggest that the spike-evoked components of synaptic noise are “deterministic” and controlled by sensory inputs. Specifically, the revealed nonrandom patterns represent nonstationary mixtures of periodic and chaotic phases. These features are typical of biological systems that do not allow the use of correlation dimensions and Lyapunov exponents to further quantify chaos (10, 17, 27).
It is remarkable that inhibitory processes exhibit chaotic properties in vivo, including a deterministic control by natural stimuli, such as sound. The origin of this nonlinear dynamic is unclear, but its most likely explanations must take into consideration the organization of the networks that generate synaptic noise in the M-cell. Fig. 1A shows that primary auditory fibers activate the commissural interneurons on each side of the brain. The question then becomes whether a reciprocal inhibitory circuit can undergo a sustained activity, which is required for generating complex dynamics (28, 29). We designed a numerical model (unpublished work) incorporating the VIII n. activated connections (outlined in Fig. 1A), with internal self-sustained excitatory reentries generated by the postanodal excitations that always follow hyperpolarizations in M-cell presynaptic interneurons (30). External drives of the system were “spike activities” in the VIII n., designed to include both stochastic and periodic discharges as demonstrated experimentally (25, 31). This model showed that once activated, the presynaptic networks produce most patterns found in this study. As also noted elsewhere (32), “chaos” is not observed when the postanodal rebounds are omitted. Conversely, it is more conspicuous if large hyperpolarizations generate bursts of action potentials rather than single spikes (Fig. 1A Inset). It remains to be determined if additional network features are necessary to account for dynamic modifications of R. For example, if other excitatory drives to the inhibitory interneurons (Fig. 1A) or learning properties of inhibitory synapses (33) have a significant role.
In vivo studies should reveal comparable situations in higher vertebrate structures, such as hippocampus, cerebellum, and cortex (34), where synaptic noise is intense, and also predominantly inhibitory, and neural connections include rhythmically firing cells and oscillators.
It is difficult to envision the role of nonlinear dynamics at the cellular level, but it is known that chaotic systems can be controlled by external perturbations. Relevant here is that inhibition guarantees that the M-cell-mediated escape reaction is triggered by appropriate stimuli (15). Thus, inhibitory noise is part of a process that, similar to that underlying attention in higher vertebrates, filters improper information (35). Accordingly, the M-cell’s adaptive motor function could be eased by the stabilizing properties of UPOs (20, 22, 36), chaos also favoring state transitions initiated by varying sensory cues (29).
Acknowledgments
We thank N. Ankri (our laboratory), Profs. D. S. Faber and P. Rapp (Allegheny University, Philadelphia), and Prof. D. Ruelle (Institut des Hautes Études Scientifiques, Paris) for valuable comments and kind help during this work. This work was supported by Direction des Recherches Etudes et Techniques Grant 951223 to P.F.
ABBREVIATIONS
- M-cell
Mauthner cell
- IPSP
inhibitory postsynaptic potential
- VIII n.
eighth nerve
- RP
recurrence plot
- PM
Poincaré map
- UPO
unstable periodic orbit
RPs
Let X(i) be the ith point on an orbit describing the system in a d-dimensional space. Then RPs are N ∗ N arrays, in which a dot is placed at (i, j) whenever X(i) is close to X(j). Given a voltage value V(i) at time iΔt, the d-dimensional signal X(i) can be obtained using the time delays method X(i) = (Vi, Vi+L, . . . , Vi+(d−1)L), where d and L are the embedding dimension and the lag, respectively. Each matrix contains Ne2 points, where Ne is the number of vectors. For this study, L was chosen as the first minimum of the average mutual information function or of the autocorrelation function. A dot was plotted at each point (i, j) whenever X(i) and X(j) were located within a given radius, r. If Nj is the number of vectors near X(j), there are Σj=1NeNj2 dots in the RP. In this work, r was fixed (constant volume construction) and determined so that Σj=1NeNj2 = k, to allow comparisons between successive plots. The ratio (R) and entropy (E) were calculated on RPs using windows of 1 sec. This short duration guarantees a minimal stationarity of the signal and allows R and E to be used as sensitive detectors of minimal variations in dynamics. If Nl is the number of dots that form upward diagonal line segments, R = Nl/Σj=1NeNj2 and E = ΣPi log Pi, where Pi is the probability that an upward diagonal line segment contains i dots (i ∈ [2, max length]).
Surrogates
With a finite time series of noisy data, the problem of detecting nonlinearity is a matter of statistical measure. Several randomized representations of the original data can be used. This method is known as that of the surrogate strategy (18). The statistical significance of the derived values (ratio, entropy, and number of UPOs) was assessed using K = (N − 〈Ns〉)/σ, where N is the value of the measure in the original series, and 〈Ns〉 and σ are the mean and standard deviation, respectively, of these parameters in surrogates. Assuming Gaussian statistics, the probability Pg that Ns ≤ N is given by Pg = P(Ns ≤ N) = (1 + erf(σ/ )). A limit of K = 2.5 indicates a confidence level of >99.4%.
References
- 1.Burnod Y, Korn H. Proc Natl Acad Sci USA. 1989;86:352–356. doi: 10.1073/pnas.86.1.352. [DOI] [PMC free article] [PubMed] [Google Scholar]
- 2.Softky W R, Koch C. J Neurosci. 1993;13:334–350. doi: 10.1523/JNEUROSCI.13-01-00334.1993. [DOI] [PMC free article] [PubMed] [Google Scholar]
- 3.Holt R G, Softky W R, Koch C, Douglas R J. J Neurophysiol. 1996;75:1806–1814. doi: 10.1152/jn.1996.75.5.1806. [DOI] [PubMed] [Google Scholar]
- 4.Hopfield J J. Proc Natl Acad Sci USA. 1982;79:2554–2558. doi: 10.1073/pnas.79.8.2554. [DOI] [PMC free article] [PubMed] [Google Scholar]
- 5.Buhmann J, Schulten K. Biol Cybern. 1987;56:313–327. doi: 10.1007/BF00319512. [DOI] [PubMed] [Google Scholar]
- 6.Calvin W, Stevens C. Science. 1967;155:842–844. doi: 10.1126/science.155.3764.842. [DOI] [PubMed] [Google Scholar]
- 7.Shadlen M N, Newsome W T. Curr Opin Neurobiol. 1994;4:569–579. doi: 10.1016/0959-4388(94)90059-0. [DOI] [PubMed] [Google Scholar]
- 8.Mainen Z F, Sejnowski T J. Science. 1995;268:1503–1506. doi: 10.1126/science.7770778. [DOI] [PubMed] [Google Scholar]
- 9.van Vreeswijk C, Sompolinsky H. Science. 1996;274:1724–1726. doi: 10.1126/science.274.5293.1724. [DOI] [PubMed] [Google Scholar]
- 10.Eckmann J P, Ruelle D. Rev Mod Phys. 1985;57:617–656. [Google Scholar]
- 11.Babloyantz A, Destexhe A. Proc Natl Acad Sci USA. 1986;83:3513–3517. doi: 10.1073/pnas.83.10.3513. [DOI] [PMC free article] [PubMed] [Google Scholar]
- 12.Skarda C A, Freeman W J. Behav Brain Sci. 1987;10:161–195. [Google Scholar]
- 13.Elbert T, Ray W J, Kowalik Z J, Skinner J E, Graf K E, Birbaumer N. Physiol Rev. 1994;74:1–47. doi: 10.1152/physrev.1994.74.1.1. [DOI] [PubMed] [Google Scholar]
- 14.Theiler J, Rapp P E. Phys Lett A. 1996;196:335–341. [Google Scholar]
- 15.Faber D S, Korn H. Neurobiology of the Mauthner Cell. New York: Raven; 1978. [Google Scholar]
- 16.Eckmann J P, Kamphorst S O, Ruelle D. Europhys Lett. 1987;4:973–977. [Google Scholar]
- 17.Webber C L, Zbilut J P. J Appl Physiol. 1994;76:965–973. doi: 10.1152/jappl.1994.76.2.965. [DOI] [PubMed] [Google Scholar]
- 18.Theiler J, Eubank S, Longtin A, Galdrikian B, Farmer J D. Physica D. 1992;58:77–94. [Google Scholar]
- 19.Schiff S J, Jerger K, Chang T, Sauer T, Aitken P G. Biophy J. 1994;67:684–691. doi: 10.1016/S0006-3495(94)80527-2. [DOI] [PMC free article] [PubMed] [Google Scholar]
- 20.Garfinkel A, Spano M L, Ditto W L, Weiss J N. Science. 1992;257:1230–1235. doi: 10.1126/science.1519060. [DOI] [PubMed] [Google Scholar]
- 21.Ott E, Grebogi C, Yorke J A. Phys Rev Lett. 1990;64:1196–1199. doi: 10.1103/PhysRevLett.64.1196. [DOI] [PubMed] [Google Scholar]
- 22.Schiff S J, Jerger K, Duong D H, Chang T, Spano M L, Ditto L W. Nature (London) 1994;370:615–620. doi: 10.1038/370615a0. [DOI] [PubMed] [Google Scholar]
- 23.Pei X, Moss F. Nature (London) 1996;379:618–621. doi: 10.1038/379618a0. [DOI] [PubMed] [Google Scholar]
- 24.Rapp P E. Biologist (London) 1993;40:89–94. [Google Scholar]
- 25.Furukawa T, Ishii Y. J Neurophysiol. 1967;30:1377–1403. doi: 10.1152/jn.1967.30.6.1377. [DOI] [PubMed] [Google Scholar]
- 26.Parzen E. Ann Math Stat. 1962;33:1065–1076. [Google Scholar]
- 27.Eckmann J P, Ruelle D. Physica D. 1992;56:185–187. [Google Scholar]
- 28.Mackey M C, Milton J G. Ann NY Acad Sci. 1987;504:16–32. doi: 10.1111/j.1749-6632.1987.tb48723.x. [DOI] [PubMed] [Google Scholar]
- 29.Freeman W J, Barrie J M. In: Temporal Coding in the Brain. Buzsaki G, editor. Berlin: Springer; 1994. [Google Scholar]
- 30.Faber D S, Korn H. Nature (London) 1983;305:802–804. doi: 10.1038/305802a0. [DOI] [PubMed] [Google Scholar]
- 31.Fay R R. J Acoust Soc Am. 1978;63:136–146. doi: 10.1121/1.381705. [DOI] [PubMed] [Google Scholar]
- 32.Coombes S, Dool S H. Dyn Stab Syst. 1996;11:193–217. [Google Scholar]
- 33.Korn H, Oda Y, Faber D S. Proc Natl Acad Sci USA. 1992;89:440–443. doi: 10.1073/pnas.89.1.440. [DOI] [PMC free article] [PubMed] [Google Scholar]
- 34.Otis T S, Staley K J, Mody I. Brain Res. 1991;545:142–150. doi: 10.1016/0006-8993(91)91280-e. [DOI] [PubMed] [Google Scholar]
- 35.Moran J, Desimone R. Science. 1985;229:782–784. doi: 10.1126/science.4023713. [DOI] [PubMed] [Google Scholar]
- 36.Babloyantz A, Lourenco C. Proc Natl Acad Sci USA. 1994;91:9027–9031. doi: 10.1073/pnas.91.19.9027. [DOI] [PMC free article] [PubMed] [Google Scholar]


