Abstract
High glucose and high insulin, pathogenic factors in type 2 diabetes, induce rapid synthesis of the matrix protein laminin-β1 in renal proximal tubular epithelial cells by stimulation of initiation phase of mRNA translation. We investigated if elongation phase of translation also contributes to high glucose and high insulin induction of laminin-β1 synthesis in proximal tubular epithelial cells. High glucose or high insulin rapidly increased activating Thr56 dephosphorylation of eEF2 and inactivating Ser366 phosphorylation of eEF2 kinase, events that facilitate elongation. Studies with inhibitors showed that PI3 kinase-Akt-mTOR-p70S6 kinase pathway controlled changes in phosphorylation of eEF2 and eEF2 kinase induced by high glucose or high insulin. Renal cortical homogenates from db/db mice in early stage of type 2 diabetes showed decrease in eEF2 phosphorylation and increment in eEF2 kinase phosphorylation in association with renal hypertrophy and glomerular and tubular increase in laminin-β1 content. Rapamycin, an inhibitor of mTOR, abolished diabetes-induced changes in phosphorylation of eEF2, eEF2 kinase, and p70S6 kinase and ameliorated renal hypertrophy and laminin-β1 protein content, without affecting hyperglycemia. These data show that mTOR is an attractive target for amelioration of diabetes-induced renal injury.
Renal hypertrophy and matrix accumulation are signal events that occur sequentially in the course of renal disease in diabetes. The relevance of early onset renal hypertrophy to long-term complications has been controversial. Recent findings have suggested that interruption of renal hypertrophy in diabetes may ameliorate some but not all aspects of chronic changes in the renal structure and function.1 These data emphasize the need to understand fully the pathogenesis of early changes that occur in the kidney in diabetes. Protein synthesis constitutes the common underlying process for both hypertrophy and matrix accumulation in the diabetic kidney. However, the control mechanisms involved in modulation of protein synthesis in the kidney in diabetes are not well understood. Although transcriptional mechanisms and altered degradation contribute to changes in protein content, the role of mRNA translation as a site of dysregulation has not been investigated in depth in diabetic renal disease. mRNA translation is the process of synthesis of a polypeptide chain in the ribosome in accordance with the sequence of codons present in the mRNA.2,3 mRNA translation undergoes both spatial and temporal regulation. The temporal sequence of events in mRNA translation has been classified into initiation, elongation, and termination phases. In the initiation phase, under the control of eukaryotic initiation factors (eIFs), the ribosome attaches to the mRNA and is localized to the first codon, usually for methionine. During the elongation phase, sequential addition of amino acids occurs directed by the codon sequence with the participation of amino acyl tRNA; it is tightly regulated by eukaryotic elongation factors (eEFs).2 During the termination phase, the peptide is released from the ribosomal complex after faithful synthesis of the full-length peptide.
Studies in db/db mice with type 2 diabetes have shown that accumulation of the renal matrix protein laminin-β1 is not associated with increase in its mRNA, suggesting potential regulation by mRNA translation.4 This possibility was directly studied in an in vitro model of type 2 diabetes. Incubation of renal proximal tubular epithelial cells (MCT cells) with high glucose or high insulin, two important pathogenic factors in type 2 diabetes, resulted in stimulation of laminin-β1 synthesis within minutes.5 The rapid phase synthesis of laminin-β1 was not associated with changes in mRNA level; it could be blocked by cycloheximide but not by actinomycin D, suggesting regulation by mRNA translation.5 Studies showed involvement of initiation phase of mRNA translation under the control of PI3 kinase-Akt-mTOR axis in high glucose and high insulin regulation of laminin-β1 translation.5 In the current study we tested the hypothesis that the elongation phase of translation is also regulated by high glucose and high insulin in rapid phase synthesis of laminin-β1 in MCT cells. We characterized the signaling pathways that regulate elongation phase. Because the mammalian target of rapamycin (mTOR) plays a central role in regulation of elongation phase, we evaluated whether administration of rapamycin, a selective inhibitor of mTOR, would ameliorate pathological processes in the kidney in type 2 diabetes that require augmented protein synthesis. In contrast to the initiation phase of translation, the role of elongation phase has not been well studied, particularly, in in vivo models of disease.
Materials and Methods
Cell Culture
SV-40 immortalized murine proximal tubular epithelial (MCT) cells (kindly provided by Dr. Eric Neilson, Vanderbilt University, Nashville, TN) were grown in Dulbecco’s modified Eagle’s medium (Gibco-Invitrogen, Carlsbad, CA) containing 7% fetal bovine serum (Hyclone Laboratories Inc., Logan, UT), 5 mmol/L glucose with no added insulin, 100 μg/ml penicillin, 100 μg/ml streptomycin, and 2 mmol/L glutamine. MCT cells express in vivo properties of proximal tubular epithelial cells.6 The cells were grown to 90% confluence and then growth-arrested for 18 hours in serum-free Dulbecco’s modified Eagle’s medium before experiments that used 30 mmol/L glucose or 1 nmol/L insulin to represent high glucose and high insulin levels encountered in mice with type 2 diabetes.4,5 Five mmol/L glucose + twenty-five mmol/L mannitol were used as osmotic control for glucose.
Animals
C57BLKsJ lepr−/− db/db mice and their lean littermate controls (db/m) were purchased from the Jackson Laboratory, Bar Harbor, ME. The db/db mice develop kidney disease related to type 2 diabetes resembling human disease, ie, hypertrophy, extracellular matrix accumulation, and albuminuria.4,7 Experiments were initiated at 2 weeks after the appearance of hyperglycemia in db/db mice. Blood glucose measured by an Accucheck instrument (Bayer Diagnostics, Tarrytown, NY). The db/m and db/db mice were each divided into two groups. Control and diabetes groups received either vehicle of 0.2% of methylcellulose and 0.25% of polysorbate-80 in water or rapamycin (2 mg/kg/day) (LC Laboratories, Woburn, MA)8 administered intraperitoneally daily for 2 weeks. Kidney weight and blood glucose levels were measured at the time of sacrifice. The Institutional Animal Care and Use Committee of the University of Texas Health Science Center at San Antonio approved these animal studies.
Morphometry and Immunohistochemical Studies
At termination of the experiment, kidneys were excised, sliced, and fixed in neutral buffered formalin for routine paraffin embedding and subsequent sectioning and staining with hematoxylin and eosin. Glomerular area in stained sections was measured by computer-assisted image analysis as previously described.9 Photographic images were taken from 25 random glomeruli from each mouse using an Olympus AX70 research microscope equipped with a ×20 objective and DP70 digital camera (Olympus America Inc., Melville, NY). In each digital image, the circumference of the glomerulus was outlined and glomerular area calculated using the polygonal tracing tool of Image-Pro Plus 4.5 software (Media Cybernetics, Silver Spring, MD). All images were calibrated to a stage micrometer. Image analysis was also used to measure glomerular and tubular basement membrane expression of laminin-β1 in each of the groups. Indirect immunoperoxidase histochemistry was performed on fresh frozen sections using antibody to laminin-β1 (Biomeda, Foster City, CA) and detected by the ABC technique (Vector Laboratories, Burlingame, CA) using diaminobenzidine as substrate according to previously reported methods.10 The area occupying diaminobenzidine reaction product was measured in digital images by selecting a lower and upper range of gray scale within the limits of background and the highest intensity of diaminobenzidine staining. For glomerular staining, the circumference of each glomerulus was outlined, as above; the image of the reaction product identified by pseudo-coloring and area of specific staining calculated as a percentage of total glomerular area.10 Likewise, reaction product in the tubular basement membrane was measured as a percentage of a predetermined area of renal parenchyma excluding glomeruli.
Real-Time Reverse Transcriptase-Polymerase Chain Reaction (RT-PCR)
Total RNA was isolated from kidney cortex using TRI reagent (Sigma, St. Louis, MO) as previously described.5 Two μg of total RNA from each sample was reverse-transcribed with random hexamers using a commercially available kit from Invitrogen (Carlsbad, CA). Mouse laminin-beta1 (Primer Bank ID no. 21595540a2) and mouse GAPDH (Primer Bank ID no. 6679937a1) were amplified using PCR primer sequences obtained from Primer Bank, a public resource for PCR primers.11 Two μl of cDNA was amplified using SYBR Green PCR master mix (Applied Biosystems, Foster City, CA) containing 100 nmol/L forward and reverse primers. PCR amplification was performed using 7900HT sequence detection system (Applied Biosystems). Dissociation curve analysis was performed after PCR amplification to confirm the specificity of the primers. Relative mRNA expression was calculated using the ΔΔCt method.
Immunoblotting
Western blotting was performed as described.12 In brief, equal amounts of cell extract protein (10 to 50 μg) were mixed with sample loading buffer and separated under reducing conditions on 7.5% gel. Proteins were electrotransferred onto a nitrocellulose membrane. The membrane was probed with primary antibody overnight and blocked for an hour in 5% nonfat dry milk. After washes in Tris-buffered saline containing 0.1% Tween-20, the membrane was incubated with antibodies against phospho Thr389-p70S6kinase, phospho-Thr56-eEF2, total eEF2, phospho-Ser366-eEF2 kinase, total eEF2 kinase (Cell Signaling Technology, Beverly, MA), actin (Sigma Aldrich, St. Louis, MO), and laminin-β1 (US Biologicals, Swampscott, MA) at 1:1000 for 3 hours. The membranes were then washed and incubated with secondary antibodies linked to horseradish peroxidase (Jackson ImmunoResearch Laboratories, Inc., West Grove, PA). The reactive bands were detected by chemiluminescence using the ECL system (Pierce Biotechnology, Rockford, IL). Signal intensity was assessed by densitometric analysis.
Transfection
MCT cells were transiently transfected with either control plasmid without a cDNA insert (pRK7) or a plasmid containing K100R mutation in p70S6 kinase (kinase dead; kindly provided by Dr. John Blenis, Ph.D., Addgene, Cambridge, MA). Transfection was performed using lipofectamine and Lipo-plus reagent (Invitrogen) as described.13
Adenovirus Infection
MCT cells were infected with adenovirus vector expressing dominant-negative HA-tagged Akt (Ad-DN-Akt).14 Adenovirus containing green fluorescence protein (Ad-GFP) was used as control.
Statistical Analysis
Values are expressed as mean ± SE from a minimum of three experiments. Statistical comparisons between multiple groups were performed by analysis of variance with post testing correction by the Newman-Keuls method. Student’s t-test was used for comparing two groups. Results were considered statistically different at P < 0.05.
Results
We have previously shown that synthesis of laminin-β1 was stimulated within 5 minutes in MCT cells incubated with high glucose or high insulin.5 The rapid phase stimulation of laminin-β1 synthesis involved activation of initiation phase of mRNA translation under mTOR regulation.5 Because both initiation and elongation phases of mRNA translation are under the control of mTOR,5 we embarked on analysis of elongation phase regulation by high glucose and high insulin in the current study.
High Glucose and High Insulin Regulate Phosphorylation of eEF2 and eEF2 Kinase
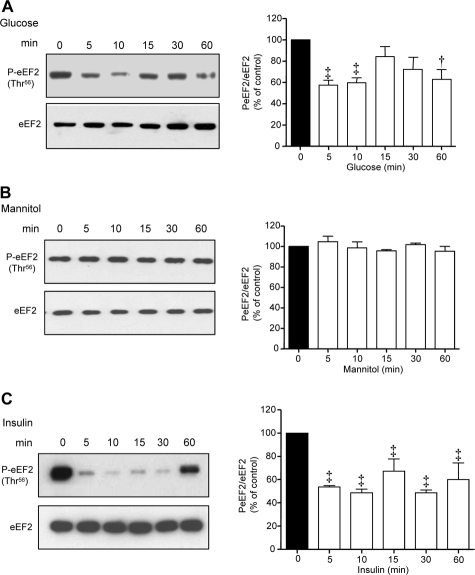
During the elongation phase of translation, the shift of amino acyl tRNA from the aminoacyl (A) site to the peptidyl (P) site on the ribosome is regulated by eEF2, which is active when dephosphorylated on Thr56.15,16 Both high glucose and high insulin caused rapid dephosphorylation of eEF2 to ∼50% of its basal level at 5 minutes; whereas the effect of high glucose was biphasic, that of insulin was persistent for up to 60 minutes (Figure 1, A and C). Equimolar mannitol did not affect eEF2 phosphorylation (Figure 1B) or laminin-β1 content (data not shown) suggesting that high glucose regulation was not attributable to its osmotic effect. The temporal profile of eEF2 dephosphorylation induced by high glucose and high insulin was consonant with that of increment in laminin-β1 synthesis reported recently.5
Figure 1.
High glucose and high insulin regulate eEF2 phosphorylation in MCT cells. Serum-deprived MCT cells were incubated with high glucose (30 mmol/L) (A), 5 mmol/L glucose + 25 mmol/L mannitol (B), or high insulin (1 nmol/L) (C) for the indicated period of time. Equal amounts of proteins were used for immunoblotting with Thr56 phospho-specific eEF2 antibody. Bottom panels show immunoblot analysis of the same samples with eEF2 antibody to assess loading. A representative blot from three to four independent experiments is shown and composite data are shown in histograms (‡P < 0.01, †P < 0.05 versus control by analysis of variance).
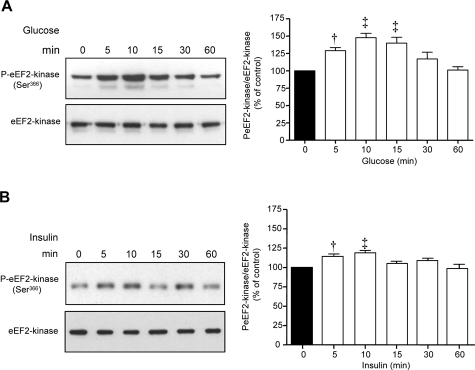
Phosphorylation of eEF2 on Thr56 is under the control of eEF2 kinase, a calcium-calmodulin-dependent kinase III.17 Activity of eEF2 kinase is reduced by phosphorylation on Ser366, which is regulated by p70S6 kinase.18 Both high glucose and high insulin significantly augmented Ser366 phosphorylation of eEF2 kinase, which began at 5 minutes and peaked at 10 minutes (Figure 2, A and B). At 60 minutes, there was discordance between reduction in eEF2 phosphorylation induced by high glucose and high insulin and predicted changes in Ser366 phosphorylation of eEF2 kinase. These data suggest that another factor such as a phosphatase may also be involved in regulation of eEF2 phosphorylation.
Figure 2.
High glucose and high insulin promote Ser366 phosphorylation of eEF2 kinase in MCT cells. Equal amounts of lysate proteins from cells incubated with high glucose (A) or high insulin (B) were immunoblotted with antibody against Ser366-phosphorylated eEF2 kinase. Bottom panels show assessment of loading by immunoblot analysis of the same samples with eEF2 kinase antibody. Composite data from three to four individual experiments are shown in histograms (‡P < 0.01, †P < 0.05 versus control).
Signaling Regulation of High Glucose- and High Insulin-Induced Changes in Phosphorylation of eEF2 and eEF2 Kinase
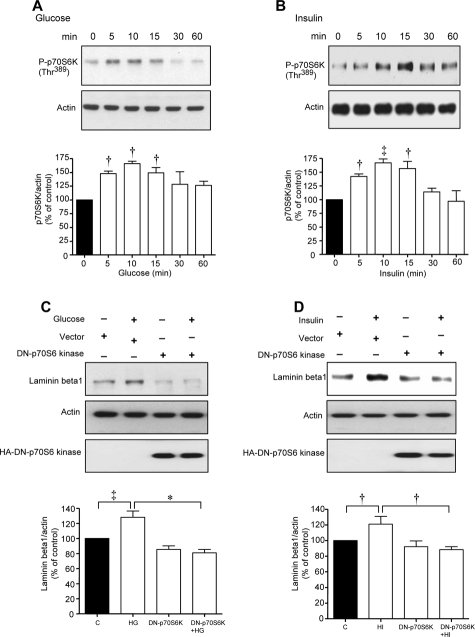
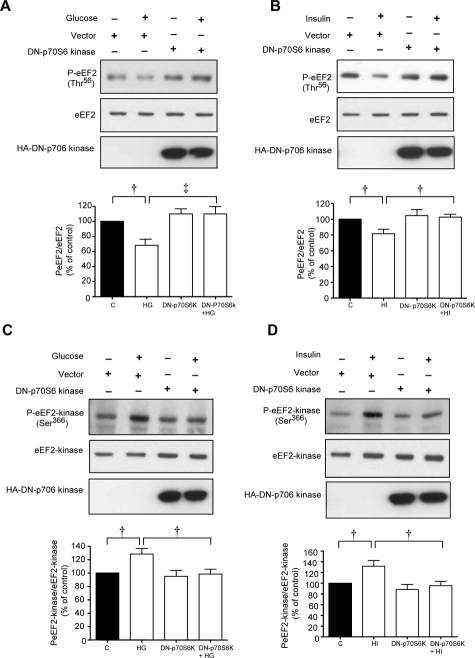
Immunoblotting with phospho-specific antibodies showed that high glucose and high insulin augmented Thr389 phosphorylation of p70S6 kinase corresponding to changes in phosphorylation of eEF2 and eEF2 kinase (Figure 3, A and B). MCT cells were transiently transfected with control empty plasmid or a plasmid carrying a hemagglutinin (HA)-tagged kinase-dead construct of p70S6 kinase with K100R mutation. High glucose and high insulin stimulated laminin-β1 synthesis in cells expressing the control vector but not in those expressing dominant-negative p70S6 kinase mutant (Figure 3, C and D). Additionally, high glucose and high insulin promptly reduced Thr56 phosphorylation of eEF2 (Figure 4, A and B) and augmented Ser366 phosphorylation of eEF2 kinase (Figure 4, C and D) in control cells transfected with empty plasmid; these changes were abrogated by the expression of kinase dead p70S6 kinase (Figure 4). These data showed the requirement of p70S6 kinase for changes in phosphorylation of eEF2 kinase and eEF2 and laminin-β1 synthesis induced by high glucose or high insulin.
Figure 3.
Activation of p70S6 kinase is required for high glucose- or high insulin-induced laminin-β1 synthesis in MCT cells. Equal amounts of lysate proteins from cells treated with high glucose (A) or high insulin (B) were immunoblotted with an antibody against Thr389-phosphorylated p70S6 kinase. Bottom panels show immunoblot analysis of the same lysates with actin antibody to assess loading. Composite data from three to four individual experiments are shown in histograms (‡P < 0.01, †P < 0.05 versus control by analysis of variance). C and D: Lysates from cells incubated with high glucose or high insulin after transfection with empty vector or plasmid carrying DN-p70S6 kinase construct were immunoblotted with antibody against laminin-β1 (top) or actin (middle). Immunoblotting with anti-HA antibody was done to demonstrate the expression of dominant-negative p70S6 kinase (bottom). A–D: Representative blots from three to four experiments are shown. Composite data from three to four individual experiments are shown in histograms (‡P < 0.01, †P < 0.05, *P < 0.001 by analysis of variance).
Figure 4.
Activation of p70S6 kinase is required for high glucose- or high insulin-induced phosphorylation of eEF2 and eEF2 kinase. Equal amounts of lysate protein from cells incubated with high glucose or high insulin transfected with control plasmid or plasmid carrying DN-p70S6 kinase construct were immunoblotted with antibody against Thr56-phosphorylated eEF2 (A and B) or Ser366-phosphorylated eEF2 kinase (C and D). Loading was assessed by immunoblotting with antibody against eEF2 (A and B) or eEF2 kinase (C and D). Immunoblotting with anti-HA antibody was done to demonstrate the expression of dominant-negative p70S6 kinase (bottom). A–D: Representative blots from three experiments are shown. Composite data from three individual experiments are shown in histograms (‡P < 0.01, †P < 0.05 by analysis of variance).
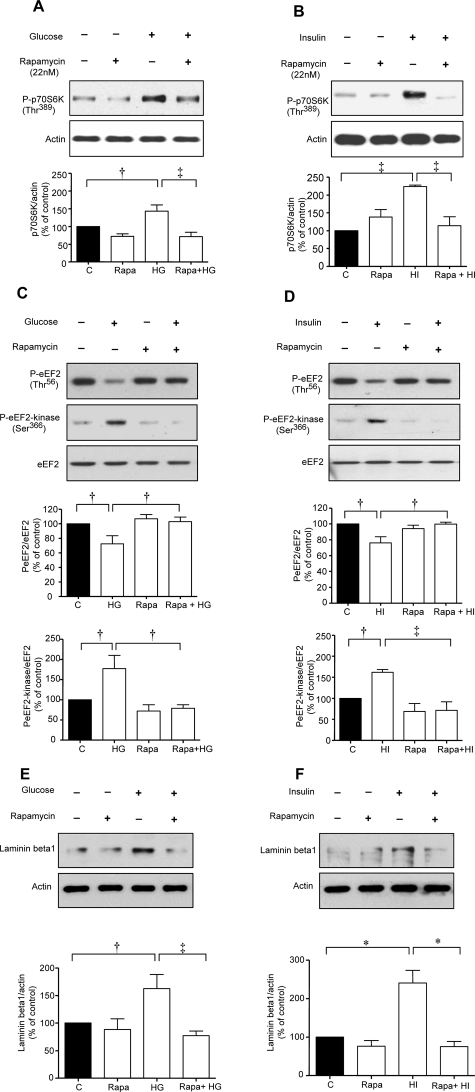
We sought to identify upstream kinases that regulate activation of p70S6 kinase beginning with mTOR. Rapamycin, a specific inhibitor of mTOR, significantly inhibited high glucose- and high insulin-induced increase in Thr389 phosphorylation of p70S6 kinase (Figure 5, A and B) and Ser366 phosphorylation of eEF2 kinase and reduction in Thr56 phosphorylation of eEF2 (Figure 5, C and D). Lack of inhibition of baseline eEF2 Thr56 and eEF2 kinase Ser366 phosphorylation by rapamycin, suggests that a kinase other than mTOR may be involved in these reactions. In addition, rapamycin abolished high glucose- and high insulin-induced laminin-β1 synthesis (Figure 5, E and F).
Figure 5.
High glucose- or high insulin-induced changes in phosphorylation of p70S6 kinase, eEF2 and eEF2 kinase, and laminin-β1 synthesis are mTOR-dependent. Equal amounts of lysate protein from cells incubated with high glucose or high insulin with or without preincubation with 22 nmol/L rapamycin were immunoblotted with antibody against Thr389-phosphorylated p70S6 kinase, Thr56-phosphorylated eEF2, Ser366-phosphorylated eEF2 kinase, or laminin-β1. Bottom panels show immunoblotting done with antibody against actin, eEF2 to assess loading. A–F: Representative blots from three experiments are shown. Composite data from three individual experiments are shown in histograms (‡P < 0.01, †P < 0.05, *P < 0.001 by analysis of variance).
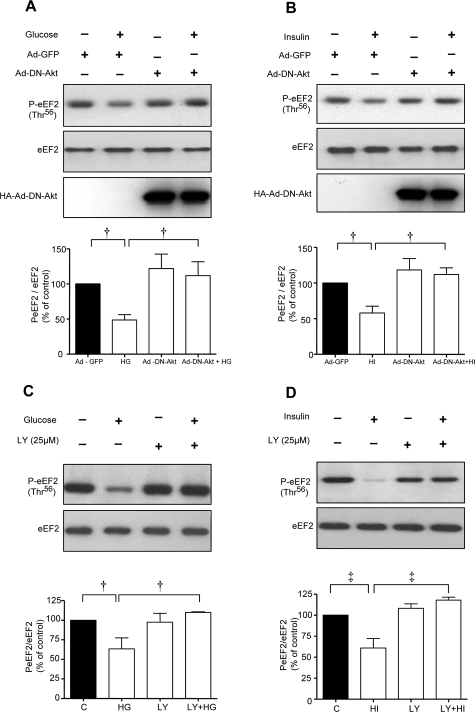
Because Akt is upstream of mTOR in receptor tyrosine kinase signaling pathways,19 we tested its role in control of eEF2. High glucose and high insulin promoted eEF2 dephosphorylation in MCT cells expressing the control Ad-GFP but not in cells infected with Ad-DN Akt (Figure 6, A and B). mTOR is under the control of PI3 kinase in MCT cells incubated with high glucose and high insulin.5 However, in that study we had not explored if PI3 kinase-mTOR axis-controlled phosphorylation of eEF2. LY294002, a selective PI3 kinase inhibitor, inhibited eEF2 dephosphorylation in cells incubated with either high glucose or high insulin (Figure 6, C and D) suggesting that PI3 kinase was an upstream regulator of eEF2 phosphorylation. Taken together, these data demonstrate that high glucose- and high insulin-induced laminin-β1 synthesis in MCT cells involves elongation phase of translation that is under the control of PI3 kinase-Akt-mTOR-p70S6 kinase axis.
Figure 6.
Activation of PI-3 kinase and Akt is required for high glucose- and high insulin-induced dephosphorylation of eEF2. A and B: MCT cells were infected with Ad-GFP or Ad-DN-Akt (100 MOI) for 24 hours before the addition of high glucose or high insulin. C and D: In separate experiments, cells were preincubated with or without LY294002, a PI3 kinase inhibitor, before incubation with or without high glucose or high insulin. Equal amounts of lysate protein from cells were immunoblotted with antibody against Thr56-phosphorylated eEF2. Middle panels in A and B, and bottom panels in C and D show immunoblotting with eEF2 to assess loading. Bottom panels (A and B) show immunoblotting with HA to demonstrate successful infection of Ad-DN-Akt. Representative blots from three experiments are shown. Composite data from three individual experiments are shown in histograms (‡P < 0.01, †P < 0.05 by analysis of variance).
Rapamycin Treatment of Mice with Type 2 Diabetes
We proceeded to verify high glucose and high insulin regulation of eEF2 and eEF2 kinase in renal cortex of diabetic mice during hypertrophy and onset of laminin-β1 synthesis when protein synthesis and elongation phase of translation would be predicted to be stimulated. We used db/db mice with type 2 diabetes and administered rapamycin in early stages when hyperglycemia and hyperinsulinemia are evident. Blood glucose level in the untreated db/db mice was significantly elevated compared to db/m controls (380 ± 46 versus 134 ± 9 mg/dl, mean ± SE, *P < 0.001). Rapamycin given from day 14 of hyperglycemia for 14 days did not significantly affect the blood glucose concentration in either the control mice (147 ± 6 versus 134 ± 9 mg/dl) or the diabetic mice (418 ± 25 versus 380 ± 46 mg/dl).
Rapamycin Ameliorates Renal Hypertrophy in db/db Mice
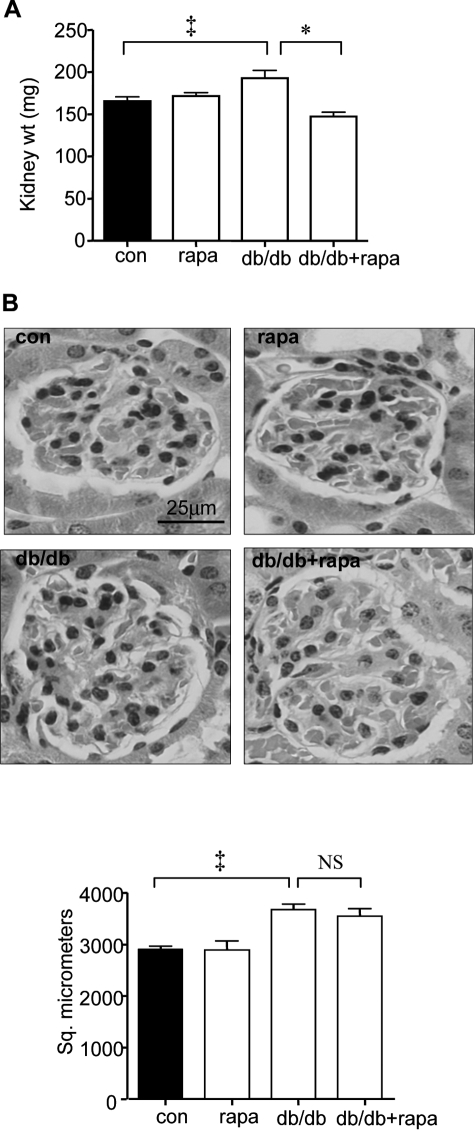
After 4 weeks of hyperglycemia, the kidney weight in db/db mice was significantly increased by 16% (193 ± 9 mg versus 166 ± 5 mg) (P < 0.01 by analysis of variance) (Figure 7A). Rapamycin abolished the renal growth induced by diabetes (148 ± 5 versus 193 ± 9 mg) (Figure, 7A, P < 0.001); however, rapamycin did not affect kidney weight in control mice (172 ± 4 mg versus 166 ± 5 mg).
Figure 7.
Rapamycin inhibits renal hypertrophy in diabetic mice. A: Groups of db/m control and db/db type 2 diabetic mice received either vehicle or rapamycin for 14 days after the onset of hyperglycemia and kidney weights were measured at sacrifice. Composite mean ± SE data from 12 mice in each group are shown in a histogram (‡P < 0.01, db/db versus control (con), *P < 0.001, db/db versus db/db + rapa). B: Kidney sections were fixed and glomerular area was measured. Representative micrographs from six mice in each of the four groups are shown. Composite mean ± SE data from six mice in each group are shown in a histogram (‡P < 0.01, db/db versus control, NS, not significant, db/db versus db/db + rapa). Scale bar = 25 μm.
Because glomeruli form a small part of the kidney and changes in kidney weight may mask glomerular changes, we directly assessed rapamycin’s effect on glomerular hypertrophy. Glomerular area by morphometry was significantly increased by 27% in the db/db mice compared to control db/m mice (2908 ± 63 μm2 versus 3679 ± 108 μm2, P < 0.01 by analysis of variance), suggesting hypertrophy induced by diabetes (Figure 7B). Rapamycin did not affect glomerular area in db/db mice (3679 ± 108 μm2 versus 3551 ± 145 μm2) or in control mice (2908 ± 63 μm2 versus 2894 ± 182 μm2). These data suggest that under conditions of our experiment, the effect of rapamycin in reversing hypertrophy was not uniformly seen in all segments of the nephron but was selective for the tubular compartment.
Rapamycin Inhibits Laminin-β1 Accumulation in db/db Mice
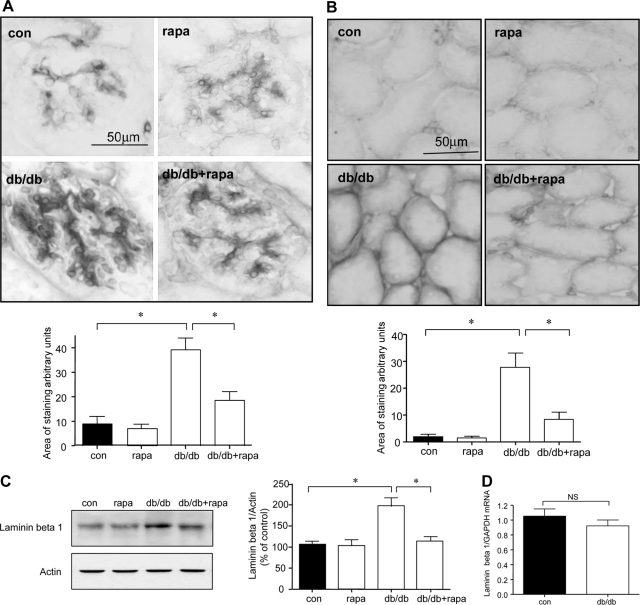
We studied regulation of the laminin-β1 chain because it is a major component of mesangial and tubulointerstitial matrix20 and its content is increased in renal parenchyma in db/db mice with type 2 diabetes.4 A fourfold increment in laminin-β1 expression in glomerular mesangium (P < 0.001) was seen that was almost completely restored to control values in rapamycin-administered db/db mice (P < 0.001, db/db versus db/db + rapa) (Figure 8A). Immunostaining of laminin-β1 was augmented in the tubular basement membranes by nearly 12-fold in diabetic mice compared to control mice (Figure 8B, P < 0.001); this was also significantly ameliorated by administration of rapamycin (P < 0.001). Immunostaining data were validated by immunoblotting for laminin-β1 in renal cortical lysates. Laminin-β1 chain content was significantly elevated in the renal cortex of mice with type 2 diabetes (P < 0.001), which was abolished by rapamycin (P < 0.001, db/db versus db/db + rapa) (Figure 8C). Rapamycin did not affect laminin-β1 content in control mice. Laminin-β1 chain mRNA content was unchanged in renal cortex of db/db mice compared to control db/m mice as measured by quantitative RT-PCR (Figure 8D). These data showed that increment in laminin-β1 chain protein was attributable to nontranscriptional mechanisms, suggesting mRNA translation could be involved.
Figure 8.
Rapamycin inhibits laminin-β1 accumulation in diabetic mice. A and B: Expression of laminin-β1 in glomeruli (A) and tubules (B) was assessed by immunoperoxidase histochemistry in all of the four groups. Representative micrographs from six mice in each of the four groups are shown. Composite mean ± SE data from six mice in each group are shown in a histogram (*P < 0.001 db/db versus control, db/db versus db/db + rapa). C: Equal amounts of renal cortical lysates were immunoblotted with an antibody against laminin-β1; loading was assessed by immunoblotting for actin as shown in the bottom panel. Each lane represents data from a single animal. Composite values from six mice in each group are shown in a histogram (*P < 0.001, db/db versus control; *P < 0.001, db/db versus db/db + rapa). D: Real-time RT-PCR was performed on renal cortical preparations to explore changes in laminin-β1 mRNA; GAPDH was used as a control. Composite mean ± SE data from six mice in each control (con) and diabetic (db/db) groups are shown in a histogram (NS, not significant, control versus db/db by Student’s t-test). Scale bars = 50 μm.
Rapamycin Inhibits Elongation Phase of mRNA Translation
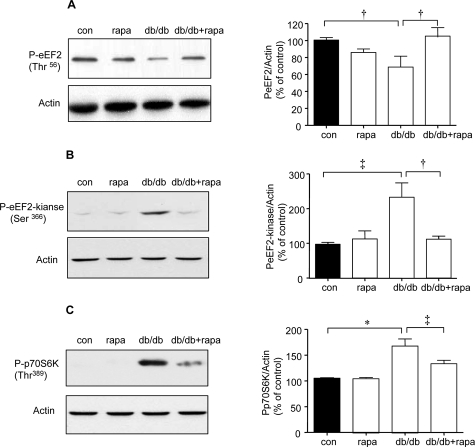
Thr56 phosphorylation of eEF2 was significantly reduced by nearly 35% and phosphorylation of Ser366 on eEF2 kinase was increased by twofold in the renal cortex of db/db mice (P < 0.05 and P < 0.01, respectively, by analysis of variance) (Figure 9, A and B); these changes were prevented by rapamycin (P < 0.05, db/db versus db/db + rapa). Thus, rapamycin normalized important steps in regulation of elongation phase of mRNA translation in the renal cortex of mice with type 2 diabetes. PI3 kinase, Akt, and Erk, important kinases involved in regulation of mRNA translation,2 are activated in the renal cortex of db/db mice with type 2 diabetes21; however, activation of mTOR has not been studied. Because Thr389 on p70S6 kinase is phosphorylated by mTOR,22 increase in its phosphorylation is used as an index of mTOR activation.19,23 Thr389 phosphorylation of p70S6 kinase was significantly increased by 50% in renal cortex of db/db mice (P < 0.001) (Figure 9C) that was inhibited by rapamycin (P < 0.01 db/db versus db/db + rapa). Rapamycin-induced reduction of p70S6 kinase phosphorylation showed that its ameliorative effect on renal hypertrophy and laminin-β1 chain accumulation in diabetic mice is attributable to mTOR inhibition.
Figure 9.
Effect of rapamycin on elongation phase of mRNA translation in db/db mice. Equal amounts of renal cortical lysates were immunoblotted with antibody against Thr56-phosphorylated eEF2 (A) or Ser366-phosphorylated eEF2 kinase (B) or Thr389-phosphorylated p70S6 kinase (C); loading was assessed by immunoblotting for actin as shown in the bottom panels. Each lane represents data from an individual animal. Composite mean ± SE data from four to six mice in each group are shown in histograms (†P < 0.05, ‡P < 0.01, *P < 0.001, control versus db/db; †P < 0.05, ‡P < 0.01, db/db versus db/db + rapa).
Discussion
Our data show that elongation phase is activated in both in vitro and in vivo models of diabetic kidney disease, consistent with augmented protein synthesis required for both hypertrophy and matrix accumulation. Reduced amounts of Thr56-phosphorylated eEF2 in MCT cells incubated with high glucose or high insulin and in the renal cortex of diabetic mice suggest a reduction in activity of eEF2 kinase. Phosphorylation of eEF2 kinase on Ser366 by p70S6 kinase inhibits its activity18; our data support such a mechanism. In addition, dephosphorylation of eEF2 may also occur because of activity of a phosphatase, eg, PP2A.24
Signaling pathways figure prominently in regulation of eEF2 and eEF2 kinase activity. Observations with kinase dead construct confirmed the requirement of activation of p70S6 kinase in regulation of eEF2 kinase and eEF2. p70S6 kinase is a direct substrate of mTOR.25,26 Rapamycin, a specific inhibitor of mTOR, abolished respective changes in phosphorylation of eEF2, eEF2 kinase, and p70S6 kinase, demonstrating that mTOR was upstream of p70S6 kinase. Furthermore, abolition of eEF2 dephosphorylation by inhibition of Akt and PI3 kinase showed that the canonical PI3 kinase-Akt-mTOR-p70S6 kinase pathway was in control of the elongation phase of translation in in vivo and in vitro models of type 2 diabetes (Figure 10). Observations with PI3 kinase inhibitor are in congruence with previously reported renal cortical PI3 kinase activation in early stages of type 2 diabetes.21 Regulation of mTOR by Akt appears to be indirect involving tuberous sclerosis protein-2 (TSC-2)-Rheb pathway.27,28 Sensitivity of events in elongation phase to rapamycin also suggests that TORC1 complex, made of mTOR, GbetaL, and raptor,29 is involved in pathological process related to hypertrophy and laminin-synthesis in the diabetic kidney. In addition to elongation phase, mTOR may control several steps in the initiation phase of translation such as phosphorylation of eukaryotic initiation factor 4E (eIF4E) binding protein (4E-BP1) and formation of 43S ribosomal complex by interacting with eIF3.23
Figure 10.
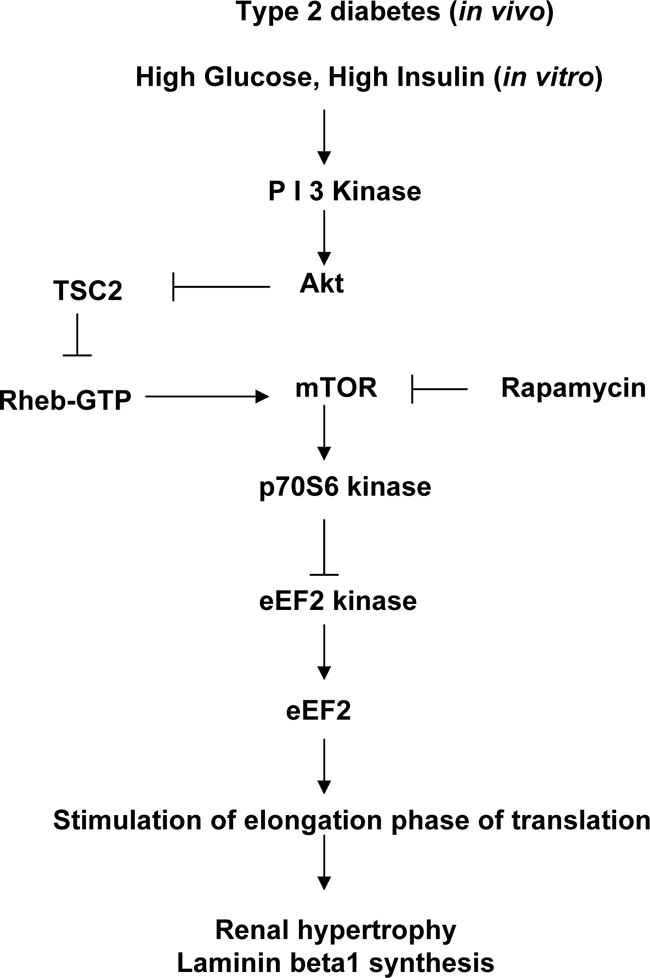
A schematic of signaling pathways that control elongation phase of mRNA translation in the kidney in type 2 diabetes.
This study shows that augmented mRNA translation is an important mechanism contributing to renal hypertrophy and laminin-β1 matrix protein accumulation, in addition to transcription30 and retardation of degradation of proteins.31 Our data suggest potential targets for intervention exist in signaling pathways that regulate translation, eg, mTOR. Previous studies in rats with type 1 diabetes have identified AMP-activated protein kinase as another target for reversing translation-mediated renal hypertrophy.32 Renal hypertrophy occurs early in type 1 and type 2 diabetes.12 Matrix accumulation has been thought to occur after several weeks to months of diabetes. The current study shows that laminin-β1 accumulation may be seen as early as 4 weeks of diabetes. The early phase of laminin-β1 accumulation in diabetic kidney involves a translational mechanism because its mRNA level was unchanged at this time point. Data from the present study and a previous report5 point to distinct roles played by initiation and elongation phases of translation in high glucose- and high insulin-induced rapid phase synthesis of laminin-β1. Inhibition of either phase results in abrogation of high glucose and high insulin stimulation of laminin synthesis suggesting a balanced role for both phases of translation. mTOR constitutes a common regulatory factor for both phases of translation. It regulates phosphorylation of 4E-BP1 and p70S6 kinase, which are critical for initiation phase of translation.2 mTOR-p70S6 kinase axis is also important for dephosphorylation of eEF2, which is required for elongation of nascent polypeptide chain. We cannot exclude possible contribution of decreased degradation to laminin-β1 accumulation at this early stage. In later stages of diabetes, transcriptional mechanisms may be recruited to promote increased synthesis of matrix proteins such as type IV collagen and fibronectin.30 Thus, matrix accumulation in the kidney in type 2 diabetes may be regulated by distinct translational, transcriptional, and degradational mechanisms.
Rapamycin has been reported to partially ameliorate kidney disease in rodents with type 1 diabetes, although this report is the first one to describe effect of rapamycin on the course of diabetic renal disease in mice with type 2 diabetes. Type 1 diabetes-induced renal hypertrophy was partly inhibited by rapamycin in one study using mice33 but not in the other study that used rats34; this could be attributable to differences in dosage of rapamycin and species of rodents examined. Similar to the study in rats,34 we were also unable to show inhibition of glomerular hypertrophy by rapamycin. It is possible that prolonged administration beyond 2 weeks or a larger dose of rapamycin may ameliorate glomerular hypertrophy. Persistence of glomerular hypertrophy despite rapamycin-induced inhibition of laminin accumulation in the mesangium suggests that laminin does not contribute to glomerular hypertrophy at least in early stages of diabetes; its role in late stage glomerular hypertrophy in the diabetic kidney needs to be examined. Rapamycin administered to rats with established diabetic nephropathy resulted in amelioration of albuminuria.34 In the present study, because mice were studied at an early stage of diabetes, consistent changes in albuminuria were not found. Rapamycin was reported to inhibit Akt phosphorylation and reduce the amount of mTOR that was increased in the diabetic kidney34; however, the status of direct targets of mTOR activation such as p70S6 kinase and events in translation were not studied. In addition to diabetes, studies with rapamycin have shown that mTOR is required for compensatory hypertrophy,35 growth of kidney cysts in polycystic kidney disease,36 and kidney pathology associated with ureteral obstruction.37 In addition to its effect on translation, mTOR regulates other cellular processes such as transcription29 that were not investigated in the present study. These effects are also likely to be involved in rapamycin-induced amelioration of diabetic nephropathy. Previous reports and data from the present study suggest that mTOR inhibition may be explored further in the treatment of diabetic renal disease.
Footnotes
Address reprint requests to B. S. Kasinath, M.D., Department of Medicine, MC 7882, University of Texas Health Science Center, 7703 Floyd Curl Dr., San Antonio, TX 78229-3900. E-mail: kasinath@uthscsa.edu.
Supported by the National Institutes of Health (grants DK061597 to B.S.K. and J.L.B., DK077295 to B.S.K., and DK050190 to G.G.C.), the American Diabetes Association (grant 7-05-RA-60 to B.S.K.), the Veterans Administration Research Service (to B.S.K., G.G.C., and J.L.B.), the Juvenile Diabetes Research Foundation (grant 3-2007-245 to M.M.M. and B.S.K.), and the American Heart Association (grant SDG 0630283N to D.F.).
G.G.C. is a recipient of the Veterans Administration Research Career Scientist Award.
References
- Wolf G, Schanze A, Stahl RA, Shankland SJ, Amann K. p27(Kip1) knockout mice are protected from diabetic nephropathy: evidence for p27(Kip1) haplotype insufficiency. Kidney Int. 2005;68:1583–1589. doi: 10.1111/j.1523-1755.2005.00570.x. [DOI] [PubMed] [Google Scholar]
- Kasinath BS, Mariappan MM, Sataranatarajan K, Lee MJ, Feliers D. mRNA translation: unexplored territory in renal science. J Am Soc Nephrol. 2006;17:3281–3292. doi: 10.1681/ASN.2006050488. [DOI] [PubMed] [Google Scholar]
- Proud CG. Signalling to translation: how signal transduction pathways control the protein synthetic machinery. Biochem J. 2007;403:217–234. doi: 10.1042/BJ20070024. [DOI] [PubMed] [Google Scholar]
- Ha TS, Barnes JL, Stewart JL, Ko CW, Miner JH, Abrahamson DR, Sanes JR, Kasinath BS. Regulation of renal laminin in mice with type II diabetes. J Am Soc Nephrol. 1999;10:1931–1939. doi: 10.1681/ASN.V1091931. [DOI] [PubMed] [Google Scholar]
- Mariappan MM, Feliers D, Mummidi S, Choudhury GG, Kasinath BS. High glucose, high insulin, and their combination rapidly induce laminin-beta1 synthesis by regulation of mRNA translation in renal epithelial cells. Diabetes. 2007;56:476–485. doi: 10.2337/db05-1334. [DOI] [PubMed] [Google Scholar]
- Haverty TP, Kelly CJ, Hines WH, Amenta PS, Watanabe M, Harper RA, Kefalides NA, Neilson EG. Characterization of a renal tubular epithelial cell line which secretes the autologous target antigen of autoimmune experimental interstitial nephritis. J Cell Biol. 1988;107:1359–1368. doi: 10.1083/jcb.107.4.1359. [DOI] [PMC free article] [PubMed] [Google Scholar]
- Sharma K, McCue P, Dunn SR. Diabetic kidney disease in the db/db mouse. Am J Physiol. 2003;284:F1138–F1144. doi: 10.1152/ajprenal.00315.2002. [DOI] [PubMed] [Google Scholar]
- Shioi T, McMullen JR, Tarnavski O, Converso K, Sherwood MC, Manning WJ, Izumo S. Rapamycin attenuates load-induced cardiac hypertrophy in mice. Circulation. 2003;107:1664–1670. doi: 10.1161/01.CIR.0000057979.36322.88. [DOI] [PubMed] [Google Scholar]
- Danda RS, Habiba NM, Rincon-Choles H, Bhandari BK, Barnes JL, Abboud HE, Pergola PE. Kidney involvement in a nongenetic rat model of type 2 diabetes. Kidney Int. 2005;68:2562–2571. doi: 10.1111/j.1523-1755.2005.00727.x. [DOI] [PubMed] [Google Scholar]
- Faulkner JL, Szcykalski LM, Springer F, Barnes JL. Origin of interstitial fibroblasts in an accelerated model of angiotensin II (Ang II)-induced renal fibrosis. Am J Pathol. 2005;167:1193–1205. doi: 10.1016/S0002-9440(10)61208-4. [DOI] [PMC free article] [PubMed] [Google Scholar]
- Wang X, Seed B. A PCR primer bank for quantitative gene expression analysis. Nucleic Acids Res. 2003;31:e154. doi: 10.1093/nar/gng154. [DOI] [PMC free article] [PubMed] [Google Scholar]
- Senthil D, Choudhury GG, McLaurin C, Kasinath BS. Vascular endothelial growth factor induces protein synthesis in renal epithelial cells: a potential role in diabetic nephropathy. Kidney Int. 2003;64:468–479. doi: 10.1046/j.1523-1755.2003.00135.x. [DOI] [PubMed] [Google Scholar]
- Senthil D, Faulkner JL, Choudhury GG, Abboud HE, Kasinath BS. Angiotensin II inhibits insulin-stimulated phosphorylation of eukaryotic initiation factor 4E-binding protein-1 in proximal tubular epithelial cells. Biochem J. 2001;360:87–95. doi: 10.1042/0264-6021:3600087. [DOI] [PMC free article] [PubMed] [Google Scholar]
- Choudhury GG. Akt serine threonine kinase regulates platelet-derived growth factor-induced DNA synthesis in glomerular mesangial cells: regulation of c-fos and p27(kip1) gene expression. J Biol Chem. 2001;276:35636–35643. doi: 10.1074/jbc.M100946200. [DOI] [PubMed] [Google Scholar]
- Redpath NT, Price NT, Severinov KV, Proud CG. Regulation of elongation factor-2 by multisite phosphorylation. Eur J Biochem. 1993;213:689–699. doi: 10.1111/j.1432-1033.1993.tb17809.x. [DOI] [PubMed] [Google Scholar]
- Thornton S, Anand N, Purcell D, Lee J. Not just for housekeeping: protein initiation and elongation factors in cell growth and tumorigenesis. J Mol Med. 2003;81:536–548. doi: 10.1007/s00109-003-0461-8. [DOI] [PubMed] [Google Scholar]
- Nairn AC, Palfrey HC. Identification of the major Mr 100,000 substrate for calmodulin-dependent protein kinase III in mammalian cells as elongation factor-2. J Biol Chem. 1987;262:17299–17303. [PubMed] [Google Scholar]
- Wang X, Li W, Williams M, Terada N, Alessi DR, Proud CG. Regulation of elongation factor 2 kinase by p90(RSK1) and p70 S6 kinase. EMBO J. 2001;20:4370–4379. doi: 10.1093/emboj/20.16.4370. [DOI] [PMC free article] [PubMed] [Google Scholar]
- Hay N, Sonenberg N. Upstream and downstream of mTOR. Genes Dev. 2004;18:1926–1945. doi: 10.1101/gad.1212704. [DOI] [PubMed] [Google Scholar]
- Miner JH, Patton BL, Lentz SI, Gilbert DJ, Snider WD, Jenkins NA, Copeland NG, Sanes JR. The laminin alpha chains: expression, developmental transitions, and chromosomal locations 8–11, and cloning of a novel alpha3 iso-form. J Cell Biol. 1997;137:685–701. doi: 10.1083/jcb.137.3.685. [DOI] [PMC free article] [PubMed] [Google Scholar]
- Feliers D, Duraisamy S, Faulkner JL, Duch J, Lee AV, Abboud HE, Choudhury GG, Kasinath BS. Activation of renal signaling pathways in db/db mice with type 2 diabetes. Kidney Int. 2001;60:495–504. doi: 10.1046/j.1523-1755.2001.060002495.x. [DOI] [PubMed] [Google Scholar]
- Kim DH, Sarbassov DD, Ali SM, Latek RR, Guntur KV, Erdjument-Bromage H, Tempst P, Sabatini DM. GbetaL, a positive regulator of the rapamycin-sensitive pathway required for the nutrient-sensitive interaction between raptor and mTOR. Mol Cell. 2003;11:895–904. doi: 10.1016/s1097-2765(03)00114-x. [DOI] [PubMed] [Google Scholar]
- Holz MK, Ballif BA, Gygi SP, Blenis J. mTOR and S6K1 mediate assembly of the translation preinitiation complex through dynamic protein interchange and ordered phosphorylation events. Cell. 2005;123:569–580. doi: 10.1016/j.cell.2005.10.024. [DOI] [PubMed] [Google Scholar]
- Chung H, Nairn AC, Murata K, Brautigan DL. Mutation of Tyr307 and Leu309 in the protein phosphatase 2A catalytic subunit favors association with the alpha 4 subunit which promotes dephosphorylation of elongation factor-2. Biochemistry. 1999;38:10371–10376. doi: 10.1021/bi990902g. [DOI] [PubMed] [Google Scholar]
- Hara K, Maruki Y, Long X, Yoshino K, Oshiro N, Hidayat S, Tokunaga C, Avruch J, Yonezawa K. Raptor, a binding partner of target of rapamycin (TOR), mediates TOR action. Cell. 2002;110:177–189. doi: 10.1016/s0092-8674(02)00833-4. [DOI] [PubMed] [Google Scholar]
- Nojima H, Tokunaga C, Eguchi S, Oshiro N, Hidayat S, Yoshino K, Hara K, Tanaka N, Avruch J, Yonezawa K. The mammalian target of rapamycin (mTOR) partner, raptor, binds the mTOR substrates p70 S6 kinase and 4E-BP1 through their TOR signaling (TOS) motif. J Biol Chem. 2003;278:15461–15464. doi: 10.1074/jbc.C200665200. [DOI] [PubMed] [Google Scholar]
- Manning BD, Tee AR, Logsdon MN, Blenis J, Cantley LC. Identification of the tuberous sclerosis complex-2 tumor suppressor gene product tuberin as a target of the phosphoinositide 3-kinase/akt pathway. Mol Cell. 2002;10:151–162. doi: 10.1016/s1097-2765(02)00568-3. [DOI] [PubMed] [Google Scholar]
- Inoki K, Li Y, Zhu T, Wu J, Guan KL. TSC2 is phosphorylated and inhibited by Akt and suppresses mTOR signalling. Nat Cell Biol. 2002;4:648–657. doi: 10.1038/ncb839. [DOI] [PubMed] [Google Scholar]
- Wullschleger S, Loewith R, Hall MN. TOR signaling in growth and metabolism. Cell. 2006;124:471–484. doi: 10.1016/j.cell.2006.01.016. [DOI] [PubMed] [Google Scholar]
- Cohen MP, Sharma K, Jin Y, Hud E, Wu VY, Tomaszewski J, Ziyadeh FN. Prevention of diabetic nephropathy in db/db mice with glycated albumin antagonists. A novel treatment strategy. J Clin Invest. 1995;95:2338–2345. doi: 10.1172/JCI117926. [DOI] [PMC free article] [PubMed] [Google Scholar]
- Mason RM, Wahab NA. Extracellular matrix metabolism in diabetic nephropathy. Am Soc Nephrol. 2003;14:1358–1373. doi: 10.1097/01.asn.0000065640.77499.d7. [DOI] [PubMed] [Google Scholar]
- Lee MJ, Feliers D, Mariappan MM, Sataranatarajan K, Mahimainathan L, Musi N, Foretz M, Viollet B, Weinberg JM, Choudhury GG, Kasinath BS. A role for AMP-activated protein kinase in diabetes—induced renal hypertrophy. Am J Physiol. 2007;292:F617–F627. doi: 10.1152/ajprenal.00278.2006. [DOI] [PubMed] [Google Scholar]
- Sakaguchi M, Isono M, Isshiki K, Sugimoto T, Koya D, Kashiwagi A. Inhibition of mTOR signaling with rapamycin attenuates renal hypertrophy in the early diabetic mice. Biochem Biophys Res Commun. 2006;340:296–301. doi: 10.1016/j.bbrc.2005.12.012. [DOI] [PubMed] [Google Scholar]
- Lloberas N, Cruzado JM, Franquesa M, Herrero-Fresneda I, Torras J, Alperovich G, Rama I, Vidal A, Grinyo JM. Mammalian target of rapamycin pathway blockade slows progression of diabetic kidney disease in rats. J Am Soc Nephrol. 2006;17:1395–1404. doi: 10.1681/ASN.2005050549. [DOI] [PubMed] [Google Scholar]
- Chen JK, Chen J, Neilson EG, Harris RC. Role of mammalian target of rapamycin signaling in compensatory renal hypertrophy. J Am Soc Nephrol. 2005;16:1384–1391. doi: 10.1681/ASN.2004100894. [DOI] [PubMed] [Google Scholar]
- Tao Y, Kim J, Schrier RW, Edelstein CL. Rapamycin markedly slows disease progression in a rat model of polycystic kidney disease. J Am Soc Nephrol. 2005;16:46–51. doi: 10.1681/ASN.2004080660. [DOI] [PubMed] [Google Scholar]
- Wu MJ, Wen MC, Chiu YT, Chiou YY, Shu KH, Tang MJ. Rapamycin attenuates unilateral ureteral obstruction-induced renal fibrosis. Kidney Int. 2006;69:2029–2036. doi: 10.1038/sj.ki.5000161. [DOI] [PubMed] [Google Scholar]


