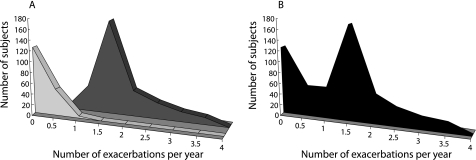
Figure 2 Effect of combining two separate groups within a study population (A) to generate a composite distribution curve for the whole population (B). Within a certain population we may not recognise that one phenotype has few exacerbations while another phenotype is a more frequent exacerbator. This non‐normal distribution can present problems in interpreting data and pooling data from different studies in a meta‐analysis.

An official website of the United States government
Here's how you know
Official websites use .gov
A
.gov website belongs to an official
government organization in the United States.
Secure .gov websites use HTTPS
A lock (
) or https:// means you've safely
connected to the .gov website. Share sensitive
information only on official, secure websites.
