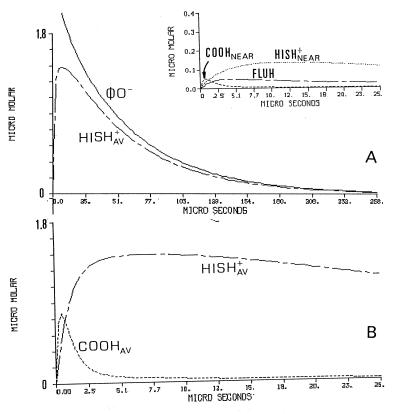
Figure 3.
Detailed scenario of the protonation dynamics of the reacting constituents corresponding with the protonation of cytochrome oxidase. The curves correspond with the experiment presented in Fig. 2 and depict the dynamics of each of the reacting elements incorporated in the simulation. The dynamics of the φO− and the averaged histidine population (HISHav+) are shown in A. The Inset to A depicts the protonation of the Flu moiety (FLUH) and the nearby histidine and carboxylate. (B) The most initial events of the protonation of the averaged populations of the histidine moieties and the carboxylates The parameters used for the reconstruction are those generating the fitted lines in Fig. 2.

