

Abstract
Here we characterized the relationship between duration of sensorineural hearing loss and the response of the auditory nerve to electrical stimulus rate. Electrophysiological recordings were made from undeafened guinea pigs and those ototoxically-deafened for either five weeks or six months. Auditory neuron survival decreased significantly with the duration of deafness. Extracellular recordings were made from auditory nerve fibrefibrefibrefibres responding to biphasic, charge balanced current pulses delivered at rates of 20 and 200 pulses/s via a monopolar scala tympani stimulating electrode. The response to 20 pulses/s electrical stimulation of the deafened cochlea exhibited a decrease in spike latency, unaltered temporal jitter, and unaltered dynamic range (of nerve firing rate against stimulus current), and a reduction in threshold after six months of deafness. The response to a 200 pulses/s stimulus was similar except that the dynamic range was greater compared to 20 pulses/s and was also greater in deafened animals compared to undeafened animals. Deafness and pulse rate are related; in deaf animals spike recovery appears to be complete between successive stimulus pulses at a low rate (20 pulse/s), but incomplete between pulses at a moderate pulse rate (200 pulses/s). These results suggest that changes in the function of individual auditory nerve fibres after deafness may affect clinical responses during high rate stimulation such as that used in contemporary speech processing strategies, but not during lower rate stimulation such as that used to record evoked potentials.
Keywords: Hearing loss, electrical stimulation, spiral ganglion, neurodegeneration, guinea pig
Introduction
The clinical success of a cochlear implant is adversely affected by the duration of sensorineural hearing loss (SNHL) prior to treatment (Blamey et al., 1996; Gomaa et al., 2003). Following SNHL, auditory neurons become demyelinated, their peripheral processes degenerate and many undergo apoptosis (Shepherd & Hardie, 2001). These morphological changes are thought to be responsible for some of the functional changes observed from the auditory nerve after SNHL. Reduced electrically-evoked compound action potential (Hall, 1990) and electrically-evoked auditory brainstem response (EABR; Shepherd & Javel, 1997) amplitudes have been attributed to the reduced neuronal survival, and shorter latencies in single nerve fibres have been attributed to a proximal shift of the site of spike initiation on the auditory neuron as the peripheral process degenerates (Shepherd & Javel, 1997). Other responses of auditory neurons appear to depend upon the duration of deafness. For example, responses from acutely deafened (Miller et al., 2006) and 2-3 month deafened cats (Shepherd & Javel, 1997) show a reduced threshold and dynamic range. However, an increase in threshold and dynamic range has been reported in one 45 month-deafened cat (Shepherd & Javel, 1997) and an increase in threshold was found in rats deafened for nine and 61 weeks (Shepherd et al., 2004).
The effect of SNHL upon the response of auditory neurons across pulse rate is not well characterized but is important to understand because stimulus rate varies between different speech processing strategies (200-1000 pulses/electrode/s), and with diagnostic evoked potential recording (typically <80 pulses per second (pps)). Shepherd and Javel (1997) found that a cat deafened for 45 months had an increase in the dynamic range of nerve discharge rate against stimulus current compared to undeafened animals, following a train of electrical pulses presented at 200 pps. This they attributed to an increase in refraction. In later experiments in the rat, more direct evidence for increased refraction after SNHL was found using a two-pulse stimulus paradigm (Shepherd et al., 2004). From these data it may be postulated that neurons recover from spike activity more slowly following SNHL. The findings also predict that dynamic range will be prolonged following SNHL at higher stimulation rates (where spike recovery is incomplete between stimulus pulses) but not at lower pulse-rates. Here these predictions are tested in a guinea pig model of the electrically stimulated cochlea, where recordings were made from the central axon of single auditory nerve fibres (ANFs). ANF recordings and EABRs were compared across three cohorts: undeafened, five-week and six-month deafened animals. Single-pulse stimuli (20pps) were used to examine the effects of SNHL on spike initiation properties including membrane noise, as at this pulse rate, interactions between responses to successive pulses will be minimal and stochasticity in neural responsiveness arises primarily from neural membrane noise (Verveen & Derksen, 1968). Pulse-train stimuli (200pps) elicit relatively higher spike rates and therefore these were used to examine ANF responses likely to be affected by the timing of sub-and/or supra-threshold spike recovery properties, including accommodation and refraction.
Methods
Experimental subjects and procedure
Forty adult Dunkin-Hartley pigmented guinea pigs (22 males, 18 females; body weight range 512g-1151g) were randomly allocated into one of three experimental groups. The animals in two groups were then systemically deafened providing three cohorts: undeafened (n=17); five week deafened (34.4±0.8 mean±SEM days; n=11) and six month deafened (184+2.2 days; n=12). Click-evoked auditory brainstem responses (ABRs) were used to confirm animals had normal hearing prior to study and that ototoxic deafenings were successful. Deafening was achieved via a single dose of kanamycin (400 mg/kg; administered subcutaneously) and frusemide (100 mg/kg; administered intravenously) (Hellier et al., 2002). On completion of the deafening period, each animal was implanted with a cochlear stimulating electrode. Immediately following this, acute electrophysiological recordings of EABRs and individual ANFs were made in response to acute electrical stimulation via the cochlear electrode.
Animal care
All experimental procedures described were conducted under general anesthesia, via an intramuscular injection of ketamine (60 mg/kg) and xylazine (4 mg/kg) and the animal was maintained areflexic. Atropine sulphate (0.1 mg/kg) and dexamethasone (0.1 mg/kg) were administered intramuscularly. Respiration rate and expired CO2 were monitored (Normocap 200, Datex Instrumentarium, Helsinki, Finland), and maintained within their normal range (30-50 breaths/min; 3.0-5.0%). Subcutaneous injections of the local anesthetic lignocaine (20 mg/ml) were used for skin incisions and ocular ointment was liberally applied to the eyes. Core temperature was maintained within 37-39°C via a direct-current heating pad and fluid replacement was given via subcutaneous injections of Hartmann’s solution (10 ml/kg). All procedures reported in this study were approved by the Animal Research and Ethics Committee of The Royal Victorian Eye and Ear Hospital (Project # 99/053A) and were conducted in accordance with the NHMRC’s ‘Australian code of practice for the care and use of animals for scientific purposes’.
Cochlear electrode insertion
The cochlear stimulating electrode was a custom-built electrode array consisting of three circumferential platinum bands, each 0.3 mm wide with an inter-electrode distance of 0.75mm center-to-center, mounted on a silastic carrier (Xu et al., 1997). After the head was mounted in a stereotaxic frame, the left bulla was exposed via a dorsal approach and the stimulating electrode was inserted into the basal turn of the scala tympani of the cochlea via an incision in the round window. All electrode bands were inserted into the cochlea with the most apical band positioned approximately 5 mm inside the round window. The round window incision was then sealed with muscle to prevent perilymph leakage.
Electrical stimuli
The electrical stimuli used for all single-fibre and evoked recordings were charge-balanced, biphasic (50 μs/phase, 10 μs interphase-gap, cathodic phase first) current pulses delivered to the apical electrode. The stimulus was optically isolated and the electrodes were shorted between pulses in order to minimize direct current production (Huang et al., 1999). The electrical stimuli for single-fibre recordings were delivered at two different rates, either: 1) Single-pulses, consisting of one pulse presented every 50 ms (20 pulses/s), or 2) pulse-trains, consisting of 20 pulses delivered over 100 ms (200pps) with 100 ms intervals between each train. Monopolar stimulation was used for single-fibre recordings, with the current delivered between the most apical electrode on the implant array and a stainless steel needle inserted through the ipsilateral pinna.
Evoked potentials
Prior to deafening, the hearing status of each animal was assessed by measuring the ABR threshold to 100 μs negative rarefaction stimuli (Shepherd & Clark, 1985). Only animals with normal hearing in both ears, defined as an ABR wave III response threshold of less than 48 dB SPL (re 20μPa) peak equivalent, were used in these studies. For deafened animals, only those with an ABR threshold exceeding 93 dB SPL peak equivalent, measured at least one week following the deafening procedure were included (Hellier et al., 2002).
An EABR was also recorded for each animal immediately following cochlear electrode implantation, but prior to aspiration of the cerebellum. The electrical stimuli for EABRs were essentially single-pulse stimuli with an inter-pulse interval of 33 ms. EABR responses were collected by decreasing the stimulus intensity from 2 mA to below threshold in 200 μA steps. A bipolar stimulus configuration was used for the EABR recording, as a monopolar configuration produced an excessive electrical artifact that overloaded the amplifier and obscured the biological signal. The bipolar stimulus was delivered via the two apical-most electrodes on the implant array.
For both ABR and EABR recordings, the signal was differentially pre-amplified ×103 from electrodes at the vertex and nape of the neck (DAM-5A, World Precision Instruments, Sarasota, USA). The electrical stimulus artifact was suppressed with a sample-and-hold circuit, typically for duration of 1 ms. The signals were band-pass filtered (150Hz high pass; 24dB/Octave, 3000Hz low pass; 6 dB/Octave using a 3750R filter, Krohn-Hite Corporation, Brockton, USA) and further amplified ×102 via a custom-made amplifier. The filter output was digitized with 10-bit ADC sampling at 20 kHz for 12.5 ms following the stimulus onset. Each recording was averaged over 500 stimulus trials.
Evoked potential analyses
Separate EABR growth functions of the peak amplitude of wave III against stimulus current were constructed using Igor Pro (Wavemetrics Inc., Lake Oswego, USA; custom routines written by James Fallon). Growth functions were constructed for all animals, except one undeafened and one five-week deafened animal, both of which had poor recordings. Wave III was used as it was the earliest wave that was uncontaminated by stimulus artifact and it was discriminated visually within a 1.5-2.5 ms window following stimulus onset.
Single-fibre recordings
An occipito-parietal craniotomy was used to expose the left auditory nerve. The lateral aspects of the cerebellum were aspirated to reveal the cochlear nucleus and the location of underlying auditory nerve was identified by briefly retracting the cochlear nucleus.
Quartz glass recording electrodes (1.0mm outer diameter) were pulled to an ~1 μm tip (#P-2000, Sutter Instrument Co., Novato, U.S.A.) and filled with 3M KCl and a Ag-AgCl wire to give impedances (at 250 Hz) of 30-80 M̂. A Ag-AgCl return electrode was inserted subcutaneously at the nape of the neck. The recording microelectrode was advanced through the cochlear nucleus in 1-2 μm steps using a motorized micromanipulator (Narashigi Scientific Instrument Lab, Tokyo, Japan) toward the underlying auditory nerve. During experiments, neurons with minimum response latencies of >1ms, were presumed to be from the cochlear nucleus (O’Leary et al., 1994) and were not recorded. After placement of the recording electrode into the cochlear nucleus, the craniotomy was filled with warm 4% agar to provide mechanical stability. Single-fibre extracellular recordings were made in an electrically and acoustically shielded room. Electrode potentials were acquired (Headstage-2A, Axoclamp-2b, gainx1, Axon Instruments Inc., Union City, USA), band-pass filtered (150Hz high pass; 24dB/Octave, 3000Hz low pass; 6dB/Octave) (3750R, Khron-Hite Corporation, Brockton, USA) and amplified ×102 with a custom-made amplifier. The stimulus artifact was suppressed with a sample-and-hold circuit that was set manually, typically for a duration of 0.2 ms. The stimulus generation and spike acquisition systems (Tucker-Davis System 2 hardware, Tucker-Davis Technology, Alachua, USA; and a custom made stimulator) were controlled by a custom software (Neurophysiology Laboratory System, R.E. Millard, Department of Otolaryngology, The University of Melbourne, Australia). This system recorded the latency of each spike, with the latency determined as the time between the onset of the stimulus pulse and the time at which the subsequent spike reached two-thirds of its peak amplitude. The latter time was set by the experimenter via level triggering on an oscilloscope (Tektronix 465; Beaverton, OR, USA).
For single-fibre recordings, the search stimulus was a biphasic pulse presented at 5 pps and set at approximately 800 μA, which was an intensity likely to be suprathreshold for most ANFs. When an ANF was encountered, the stimulus intensity was increased in equal linear steps from below threshold to saturation; this was repeated over 50 trials at each intensity, generating an input-output (IO) function of firing rate against stimulus intensity. As stable recordings from ANFs were often only viable for short periods of time, the order of stimulus presentation was constant for all experiments; responses to single-pulse stimuli were first recorded followed by responses to pulse-train stimuli. This order was chosen as pulse-train monopolar stimulation was much more likely to induce tetanic contraction of the face or neck musculature and disturb the position of the recording electrode.
Single-fibre analyses
Single-fibre analyses were made using custom software. The first stage of the analysis was to isolate spikes likely to be ANFs resulting from direct-electrical stimulation. To isolate direct-electrical responses, spikes at each stimulus intensity were plotted on separate period histograms and a latency window encompassing only spikes distributed around the first mode was automatically calculated and manually adjusted if necessary. When spontaneous activity was present in an ANF, it was not subtracted from within the window of direct-electrical responses.
Analyses of direct-electrical responses focused on determining how the fundamental extracellular properties of ANF spike timing, threshold and discharge rate were changed by SNHL and how these changes were modulated by stimulus amplitude and pulse rate. Direct-electrical responses were examined by converting spike rates into firing efficiencies, whereby the number of spikes elicited were divided by the number of pulses delivered at each stimulus intensity. Only fibres with response latencies less than 0.8 ms, calculated at a firing efficiency of 0.5, were categorized as direct-electrical ANF responses and fibres outside this criterion were excluded from further analyses. Mean latency was calculated at each stimulus intensity by averaging the latency of spikes across all 50 trials. For pulse-train stimuli, these latencies were also averaged across all 20 pulses within the train. The temporal jitter was calculated as the standard deviation of the latency. Mean latency and mean jitter were averaged across all fibres in each treatment group and stimulus rate and reported at low (0-0.2), mid (0.4-0.6) and high (0.8-1.0) firing efficiencies. IO curves were constructed by plotting firing efficiency against stimulus current for single-pulse and pulse-train data. For the 200pps pulse-train data, IO curves were also constructed from responses that followed only the first pulse of the pulse-train. This provided another measure where interactions between spikes were likely to be greatly reduced or absent, that could also be compared against the whole pulse-train response. An integrated Gaussian curve was fitted to IO functions from single-pulse and first-pulse responses using the Levenberg-Marquardt method (Press et al., 1992). From each fitted Gaussian curve, the threshold was calculated as the current required to reach 0.5 firing efficiency and the dynamic range is expressed in decibels, where the decibel value represents the ratio (on a log-scale) of the stimulus current that evokes a firing efficiency of 0.9 divided by the stimulus current that evokes a firing efficiency of 0.1.. For 200pps data, the dynamic range was calculated from the responses to the entire train between firing efficiencies of 0.1 and 0.9, using data points with the closest firing efficiencies available in the data. Spontaneous activity was calculated from the firing rate of spikes during the 40 ms prior to each stimulus presentation at the lowest stimulus intensity used in each IO. Fibres exhibiting highly regular spontaneous activity as indicated by inter-spike interval histograms, were considered vestibular in origin (Rupert et al., 1962) and were excluded from the main data set (a total of 16 fibres). Electrophonic responses have been previously observed in electrophysiological recordings of ANFs from animals with residual hearing and result from synaptic stimulation of inner hair cells via mechanical or direct electrical stimulation (Moxon, 1971; Javel & Shepherd, 2000). Electrophonic responses were identified by the presence of long latency responses (1-5 ms), in addition to a direct-electrical response with a latency of less than 0.8 ms at high stimulus current.
ANFs also show bursting responses during sustained electrical stimulation where firing periodically alternates between responsiveness and unresponsiveness (Shepherd & Javel, 1997). Bursting responses alternate across trials between periods of bursting activity followed by suppressed firing and were detected off-line in histograms by plotting histograms of the total number of spikes occurring per stimulus trial. ANFs showing bursting responses were included in the analyses of all direct-electrical responses, in addition, ANFs showing bursting were also analyzed separately.
Statistical analyses of single-fibre recordings
Data from the single-unit experiments were collated in a database (Microsoft Access 2003) and exported to SPSS (14.0 SPSS Inc., Chicago, USA) for statistical analysis and plotting. Prior to further inferential statistical testing, the distributions of all data sets were examined for normality through visual observation of histograms and via two-tailed Kolmogorov-Smirnov normality testing. As none of the dependent variables were normally distributed and could not be corrected by simple data transformations, nonparametric tests were used for statistical comparisons. The main effects of hearing status were tested using a two-tailed Kruskal-Wallis test and if significant effects were observed at the 0.05 level or better, post hoc comparisons were made with a two-tailed Mann-Whitney U test (U). Comparisons examining for the effects of firing efficiency were made using only ANFs where data points were available at low, mid and high firing efficiencies. Similarly, comparisons examining the effects of pulse rate alone were made using only ANFs where both single-pulse and 200pps pulse-train stimuli were delivered. Comparisons of the latter two effects were made using nonparametric repeated measures analyses, with the main effects examined with a two-tailed Friedman test (F) and post hoc comparisons between groups made with a two-tailed Wilcoxon signed ranks test (W).
Spiral ganglion neuron densities
On completion of the experiment, each animal was euthanized with an overdose of pentobarbitone (1000 mg/kg) administered intraperitoneally and perfused transcardially with 10% (v/v) neutral buffered formalin. The cochleae were removed and placed in 10% (v/v) neutral buffered formalin for a further 24 hours, then decalcified over 7–14 days in 10% (w/v) EDTA in 0.1M phosphate buffer. The cochleae were embedded in gelatin (Hurley et al., 2003), cryosectioned at 12 μm through the modiolar plane and mounted onto slides. Cochlear mid-modiolar sections were collected from the left cochlea of up to six animals in each group from which the greatest number of single-fibre recordings were made. Cochlear sections were dehydrated in ethanol, stained with dilute acidified thionin and coverslipped with DPX (ProSciTech, Queensland, Australia). Five sections from each cochlea were used to assess spiral ganglion neuron (SGN) densities at each of the four cochlear turns. All SGN soma with a visible nucleus were counted within Rosenthal’s canal at all cochlear turns using bright field microscopy at a magnification of 400. The area of Rosenthal’s canal was measured, at a magnification of 100, in order to express SGN number as a density (SGN/mm2; NIH Scion Image analysis software). All measurements were conducted with the assessor ‘blind’ to the treatment group. Statistical comparisons between undeafened and deafened groups were made with ANOVA using Bonferroni correction. Photomicrographs were taken with an AxioCam MRm digital camera fitted to a Zeiss Axioplan 2 microscope. In Adobe Photoshop CS images were converted to grayscale, adjusted for brightness and contrast and an unsharp mask filter applied at 100% with a threshold setting of 100% and a diameter of 2.0 pixels.
Results
Spiral ganglion neuron densities
Representative photomicrographs of the spiral ganglion within Rosenthal’s canal, obtained from the second turn of the cochlea, are presented in Fig. 1a. This illustrates the reduction in the packing density of SGNs seen after five weeks and six months of SNHL compared to an undeafened animal. Quantitative assessments revealed that the reductions in SGN density with SNHL were significant in all cochlear turns (Fig. 1b). The greatest loss occurred in the middle turns (2-3) where the greatest densities of SGNs were observed in the undeafened group. To estimate the rate of loss, the difference in SGN density between the deafened and undeafened groups at each turn was divided by the number of weeks the animals were deaf. Consistent with previous reports (Dodson & Mohuiddin, 2000), the rate of loss of SGNs was found to be greatest during the first five weeks, being approximately two to four times faster at five weeks compared to six months.
Fig 1.
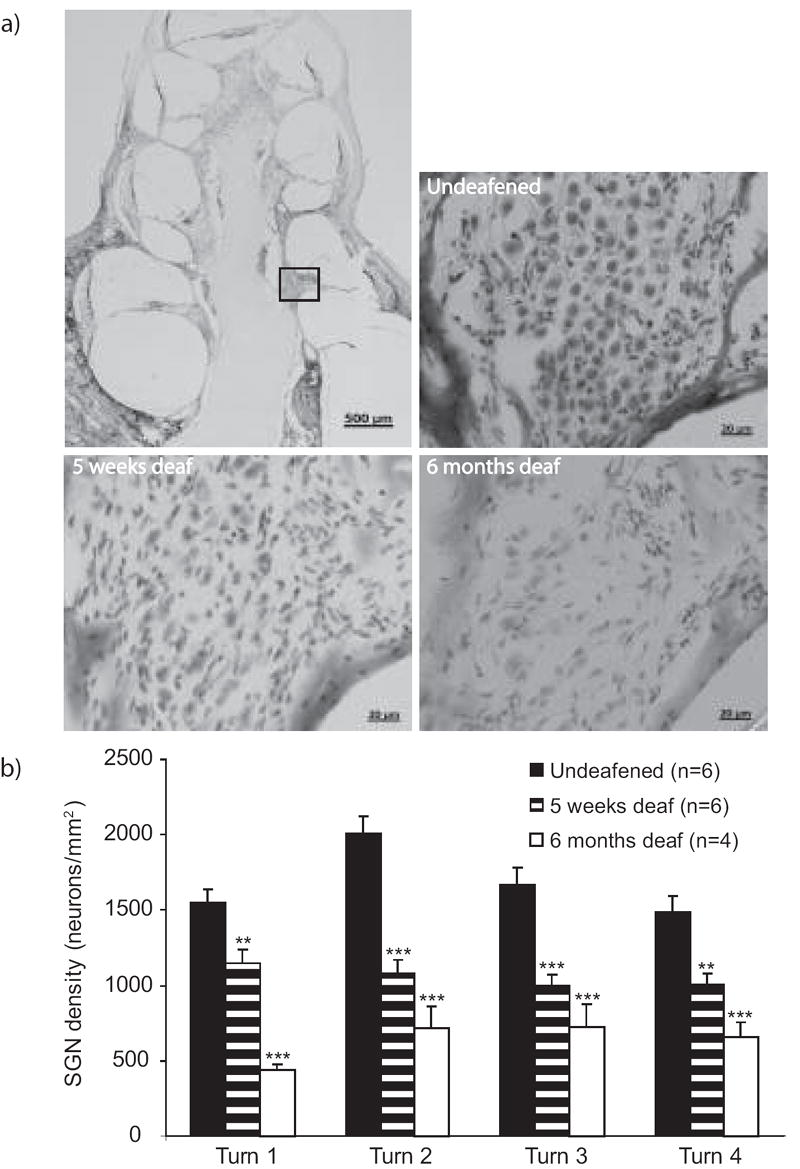
a) Photomicrographs showing the loss of spiral ganglion neurons within Rosenthal’s canal that occurs after chronic sensorineural hearing loss. The rectangle on the upper left image indicates the region of turn 2 of the cochlea from which all other images are taken. b) Spiral ganglion neuron densities calculated at each cochlear turn. Turn 1 is the most basal and turn 4 is the most apical. Each bar represents the mean±SEM density averaged across the number of animals indicated in the figure and across five sections per animal. Asterisks represent ANOVA comparisons between undeafened and deafened groups, **p<.01, ***p<0.001.
Evoked potentials
The growth-level functions of Wave III of the EABR are presented in Fig. 2, with representative data from undeafened, five-week and six-month deafened animals in Fig. 2a. The growth rate of Wave III of the EABR decreased with the duration of deafness (Fig. 2b), consistent with previous findings in the cat (Shepherd & Javel, 1997). This is particularly evident at the low to mid stimulus current levels, while at higher current levels the growth rate of the function was similar across groups. The reduction in wave III EABR amplitude is greatest during the first five weeks after SNHL, correlating with the greater rate of loss of SGNs observed over that period.
Fig 2.
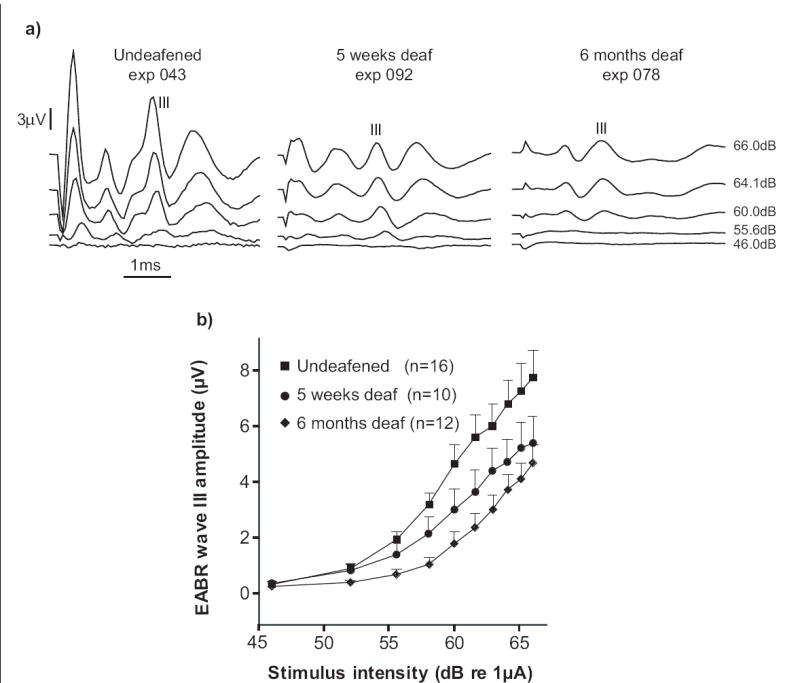
a) Example traces of electrically-evoked auditory brainstem responses (EABRs) from one animal in each of the treatment groups. The stimulus current was delivered via a bipolar cochlear electrode configuration at 33 pps using a 50μs biphasic pulse. The amplitude of wave III increased with stimulus amplitude and was lower in the deafened animals. b) EABR growth functions of peak wave III amplitude plotted against stimulus current. Each data point shows the mean±SEM of the peak amplitude of wave III at each current level, across the number of animals indicated in the figure. EABR growth functions were reduced in amplitude after five weeks and six months of deafness. Statistical comparisons at the maximum stimulus current (66dB re 1 μA) revealed the median wave III amplitudes from the six month deafened group were significantly lower than those of the undeafened group, U, z=-2.284, p=0.022). Although not significant, the mean wave III amplitudes from the five week deafened group were also lower than those of the undeafened group.
Single-fibre data pool
Across the 40 animals studied, a total of 518 ANFs yielding at least one complete IO were recorded. All ANFs investigated were able to fire at the stimulus rate delivered (i.e. achieve firing efficiencies of 1). The total number of ANFs and IOs obtained is shown in Table 1. Due to the presentation order of our stimuli, the number of ANFs that received pulse-train stimuli was approximately three times lower than the number receiving single-pulse stimuli.
Table 1.
Number of ANFs studied and incidence of electrophonic activity in each group
| Hearing status | No. of
animals |
No. of
ANFs |
No. of ANFs with
electrophonic activity |
No. of IOs studied* | |
|---|---|---|---|---|---|
| Single-pulse | 200pps | ||||
| Undeafened | 17 | 136 | 25 (18.38%) | 151 (11) | 57 (6) |
| 5 weeks deaf | 11 | 157 | 14 (8.92%) | 150 (20) | 63 (11) |
| 6 months deaf | 12 | 225 | 8 (3.56%) | 221 (19) | 68 (11) |
numbers of ANFs that demonstrated bursting are in parentheses
To examine the stability of the preparation, plots of several ANF response properties including threshold, latency and dynamic range were inspected post hoc for each animal across the course of each experiment. No systematic changes across the recording period were apparent in any of these responses.
Representative single-fibre responses
Representative responses from single ANFs are shown in Fig. 3, one each from an undeafened, a five week and a six month deafened animal. These figures illustrate some fundamental response properties, including latency, temporal jitter, dynamic range and threshold that form the bases for population-based analyses in the following sections. Fig. 3a presents post-stimulus time histograms in response to 200pps stimuli. These spikes form a single mode on the histogram, from which latency is calculated. Note that spontaneous events may occur and that these were not locked to the stimulus pulse (Fig. 3a). For these responses, the latency calculation included only those spikes within a time window that encompassed the earliest mode on the histogram, as represented by the dashed vertical lines in the middle figure. Below the latency histograms, the latencies are plotted against current for stimuli delivered at both 20 and 200 pps, with the standard deviation (temporal jitter) presented as the error bars (Fig. 3b). The latency and the temporal jitter decrease with stimulus current. Fig. 3c illustrates IO functions of firing efficiency against stimulus current in response to the single pulse (20 pps), the first pulse of the pulse-train (200 pps) and the complete pulse-train. The threshold is the current evoking a firing efficiency of 0.5, as indicated by the broken line in the middle panel. For these neurons the threshold for the single pulse was lower than that for the first pulse, with the highest threshold being derived from the pulse-train stimulus. The dynamic range is indicated by the dotted lines in the middle figure. Note that the dynamic range for single-pulse stimulation was similar to that for the first pulse, and both were smaller than that of the pulse-train.
Fig 3.
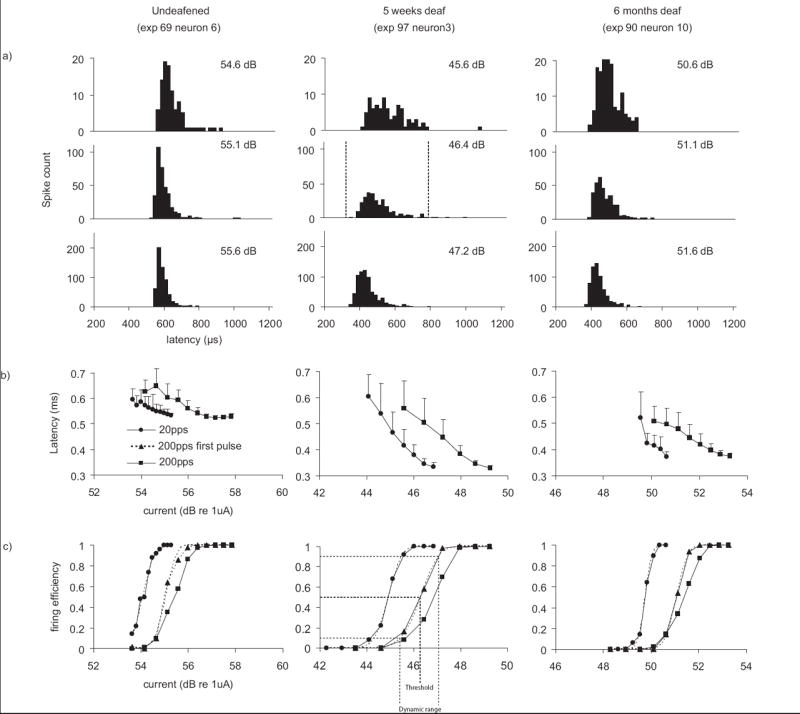
Example ANF data from undeafened, 5-week-deafened and 6-month-deafened guinea pigs is shown in the three panels. a) Post-stimulus time histograms at 0.5 firing efficiency (200-pps). Spontaneous activity is present as scattered events through the time-course of the recording. The dashed vertical lines mark the time interval over which these responses were windowed (see main text). b) Average latency±standard deviation (jitter) across trials plotted against stimulus current. c) Input-output (IO) functions of firing efficiency against stimulus current calculated from the same neuron for stimuli at both 20 and 200 pulses per second.
Electrophonic activity
Electrophonic responses were obtained from 18.4% of ANFs in the undeafened group and less frequently (3.6-8.9%) in the deafened animals (Table 1). Electrophonic responses were excluded from subsequent analyses by windowing only spikes with latencies arising from direct-electrical stimulation of ANFs (<0.8ms at 0.5 firing efficiency).
Spontaneous activity
ANFs were categorized into one of four groups on the basis of their spontaneous spike rate (absent, <14, 15-44, and 45-95 spikes/sec). For the majority of ANFs (~90%), spontaneous activity was absent or occurred at low rates (<14 spikes/sec). The incidence of spontaneous activity was similar across all treatment groups (~40%) however, there was a lower incidence of the highest-rate fibres (45-95 spikes/sec) in the deafened animals.
Latency and jitter
As stimulus intensity was increased there was a reduction in latency of the direct-electrical response. This reduction was typically linear and with the monopolar electrode configuration used in these studies; a discrete jump from a longer to a shorter latency was rarely seen in any ANF. This monotonic reduction in latency is evident in the representative data (Figs. 3a and b) and in a plot of latencies pooled across all ANFs, at firing efficiencies of 0.1+/- 0.1 (Fig 4a), 0.5+/-0.1 (Fig 4b) and 0.9+/-0.1 (Fig 4c). SNHL had a major effect on the latency of ANF responses, with the greatest reduction seen after five weeks and with a further reduction after six months of deafness, resulting in an approximate 70 μs reduction in the median latency from the normal to the six month deafened animals (Fig. 4). The effect of hearing status on the change in latency across the dynamic range was also examined. For each neuron the latency at 0.1 firing efficiency was subtracted from the latency at 0.9 firing efficiency. During single-pulse stimulation, there was no significant difference in the median latency shift of both five week (95.4μs) and six month (102.6μs) groups compared with the undeafened (74.3μs) animals. During pulse-train stimulation, the median latency shift was significantly greater in both five week (173.5μs, U, z=-2.950, p=0.003) and six month (183.3μs, U, z=-3.203, p=0.001) groups compared with the undeafened (78.7μs) animals. There was a systematic decrease in temporal jitter with increasing firing efficiency (Figs. 3a and b). Statistical comparisons at 0.1, 0.5 and 0.9 firing efficiencies revealed no variation in temporal jitter with deafness during either single-pulse or pulse-train stimuli . Temporal jitter from single-pulse and pulse-train stimuli was compared in paired analyses using only ANFs that received both stimuli. Temporal jitter associated with pulse-train stimulation was significantly greater than single-pulse jitter at low firing efficiencies (W, z=-3.334, p<0.001). Whereas jitter associated with pulse-train stimulation was significantly less than single-pulse jitter at mid (W, z=-3.389, p<0.001) and high firing efficiencies (W, z=-5.139, p<0.001).
Fig 4.
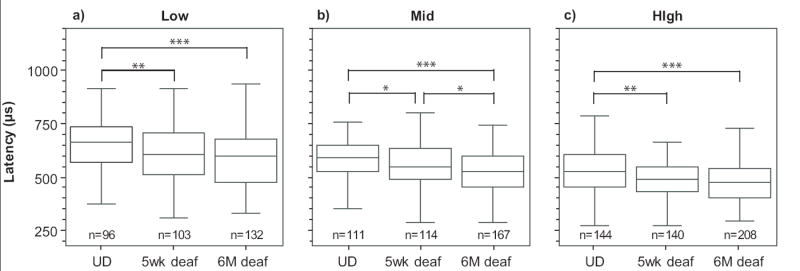
Latency decreased with sensorineural hearing loss and firing efficiency. Auditory nerve fibre (ANF) latencies are shown calculated at a) low (0-0.2) b) mid (0.4-0.6) and c) high firing (0.8-1.0) efficiencies during single-pulse stimulation. Each box plot represents pooled data from the number of ANFs indicated. The upper and lower limits of each box indicate the 25th-75th percentiles respectively, with the median indicated inside each box. The lower and upper range bars outside each box indicate the 5th-95th percentiles respectively. The effect of hearing status is compared within each panel. UD=undeafened. U, *p<0.05, **p<0.01, ***p<0.001.
Threshold and dynamic range
The effect of SNHL upon the threshold of responses evoked at different pulse rates was examined in several ways. Threshold responses from all neurons receiving 20 pps stimuli were compared across hearing status (Fig. 5a). These comparisons showed that median threshold was significantly lower in animals deafened for six months compared with undeafened animals. To determine if the effect of SNHL on threshold was influenced by stimulus rate, threshold responses were also examined in neurons where both 20 pps and 200 pps stimuli were delivered (Figs. 5b-d). The thresholds of the response to the first pulse of the pulse-train were also included in these comparisons. Paired comparisons using Wilcoxon’s Signed Ranks test showed that the median threshold was lowest during 20 pps stimulation (Fig. 5b), higher for the response to first pulse of the pulse-train (Fig. 5c) and greatest for the response of the entire train (Fig. 5d). All of these comparisons were significant at p<0.01 and the trends are also apparent in the representative data presented in Fig. 3. It is also worth noting that in these paired data, there were no differences in the latency between the stimulus conditions of single pulse, first pulse and pulse-train. The effect of SNHL on threshold was similar regardless of the stimulus rate with an approximate 2 dB drop in threshold after five weeks and a 3 dB reduction in threshold after six months of SNHL. In summary, there was a significant reduction in threshold after SNHL yet this effect was not influenced by the stimulus rate.
Fig 5.
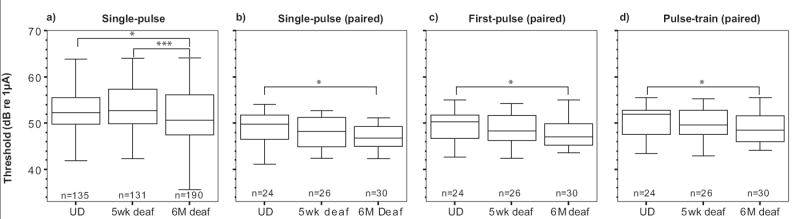
Threshold decreased with increasing duration of sensorineural hearing loss. The threshold was defined as the stimulus intensity required to evoke 0.5 firing efficiency response. Responses were calculated from an integrated Gaussian curve fitted to input-output functions resulting from a) 20pps and paired data showing only neurons where responses to both 20pps and 200pps stimuli were recorded for b) 20pps response c) the response to the first pulse of the pulse-train stimuli and d) 200pps response. The effect of hearing status is compared within each panel. UD=undeafened. U, *p<0.05, ***p<0.001.
The dynamic range responses to single-pulse stimulation and to the first pulse of the pulse-train did not differ between deafened and undeafened guinea-pigs (Figs. 6a and 6b respectively). However, pulse-train stimulation resulted in a larger dynamic range, which was approximately 1-2.5 dB greater across groups when compared to single-pulse stimulation. This increase in dynamic range with pulse-train stimulation was significantly greater in both deafened groups compared to undeafened controls (Fig. 6c), but was the same at five weeks and six months of deafness.
Fig 6.
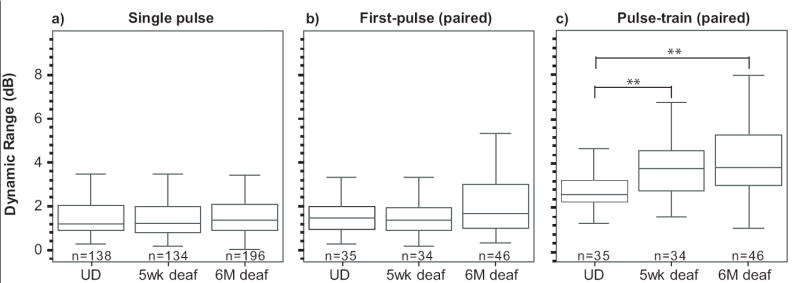
Dynamic range of auditory nerve fibres to electrical stimulation is unaltered by sensorineural hearing loss during a) stimulation at 20 pulses per second and in response to b) the first pulse of 200pps pulse-train stimulation but c) increases with sensorineural hearing loss during 200 pulses per second stimulation. UD=undeafened. U, **p<0.01.
Changes in ANF firing efficiency across the stimulus
One aim of these studies was to investigate whether the increase in dynamic range with SNHL during pulse-train stimulation was due to changes in spike recovery properties. The increase in dynamic range during pulse train stimulation, but not single pulse stimulation, suggested this was likely. Changes in spike recovery with a longer time-course should be apparent in changes to the firing efficiency from one 200 pps pulse-train to the next (i.e. across trials). This was examined by dividing the total number of spikes that occurred during the first 25 trials of the pulse-train by the number that occurred during the last 25 pulse-train trials. This ratio was greatest at low firing efficiencies, being 1.54 (+/- 0.45) at a firing efficiency of 0.1, 1.27+/- 0.26 at a firing efficiency of 0.5 and near unity (1.04 +/- 0.06) at a firing efficiency of 0.9. However, comparisons using Mann-Whitney U Test revealed the ratio was not dependent upon the treatment group at any firing efficiency (0.1, 0.5 and 0.9).
Changes in spike recovery with a shorter time-course are likely to be evident as a reduction in firing efficiency across successive pulses within each pulse-train (see below). Evidence for shorter time-course membrane recovery effects, without a significant long time-course recovery component, would be that the response to the first pulse of the pulse-train resembled that of the single pulse.
Electrical stimulation might also influence the response of the neural membrane even in the absence of action potential generation, for example, through the action of a voltage-dependent ion channel. Therefore, we examined pulse-train responses at very low firing efficiencies, where the majority, if not all, stimulus pulses have a low probability of generating an action potential. For example, at firing efficiencies δ 0.05, less than one spike on average was generated per pulse-train presentation. However, at low firing efficiencies the paucity of spikes increases the error of measurement. To overcome this, we pooled data across ANFs, by averaging responses within defined ranges of firing efficiency. This approach has an additional advantage of identifying correlated activity across ANFs and is, therefore, a useful analysis at any firing efficiency. Post-stimulus time histograms were constructed by averaging the responses of ANFs within firing efficiency bins with 0.1 intervals from 0-1.0. If more than one data point fell within a single bin, these points were first averaged to ensure that each ANF contributed only one datum to each firing efficiency bin. Discharge rate accommodated after the onset of the pulse–train, and the magnitude and time-course of this effect was independent of hearing status. The magnitude of the accommodation1 was influenced by the firing efficiency, being greater at lower probabilities of discharge. This is seen most clearly on post-stimulus time histograms collated by pooling responses at similar firing efficiencies (+/- 0.1) across neurons (Fig. 7a). At firing efficiencies of less than 0.4, the probability of firing was approximately three to four times greater on the first than subsequent pulses. This was also the case at very low firing efficiencies (0.05) where refractory effects were less likely to be present.
Fig 7.

a) Post-stimulus time histograms in response to the 200pps pulse-train stimulation and b) the mean latencies in response to each stimulus pulse of the 200pps pulse-train. These plots were obtained by pooling data across all neurons in each group (UD= undeafened, five week and six month deaf) within specific ranges of firing efficiency (see methods). The plot reveals accommodation of the response, and a saw-tooth-like pattern of response. b) The latency plots also possess a saw-tooth pattern, with the shorter latencies corresponding to the pulses with the higher firing efficiencies.
Between firing efficiencies of 0.2-0.7, a “saw-tooth” pattern was apparent (Fig. 7a) with a periodicity of every second pulse (i.e. every 10 ms). This pattern of response was similar across treatment groups, although there was a diminution in the amplitude of this “saw-tooth” response at 0.5 firing efficiency in the six month deafened group. Similar plots of latency against post-stimulus time (Fig. 7b), revealed that latency was inversely related to the firing efficiency (compare Figs. 7a and 7b), being lower at post-stimulus times corresponding to firing efficiency maxima, and visa versa.
Bursting
Some ANFs demonstrated a regular bursting of spike activity. The frequency of the bursting was dependent upon the fibre and the driven rate. The frequency of bursting was approximately 2-5Hz and was usually eliminated at higher stimulus intensities (Fig. 8). Bursting responses were recorded from approximately 7-14% of ANFs during single-pulse and 10-18% during pulse-train stimulation (Table 1). The bursting was not correlated with respiration. These responses did not appear to be caused or altered by deafness, as the proportions of ANFs demonstrating this characteristic firing were similar in each group. The latency of bursting ANFs was significantly shorter than those observed in non-bursting ANFs, for the single-pulse data but not the pulse-train data. The thresholds were slightly higher, but not significantly so. The dynamic range was greater in ANFs demonstrating bursting response characteristics. However, the presence of bursting responses did not account for the increase in dynamic range reported against deafness or pulse-train stimulation, as dynamic range remained significantly increased with both of these factors even when the bursting units were excluded from the analysis.
Fig 8.
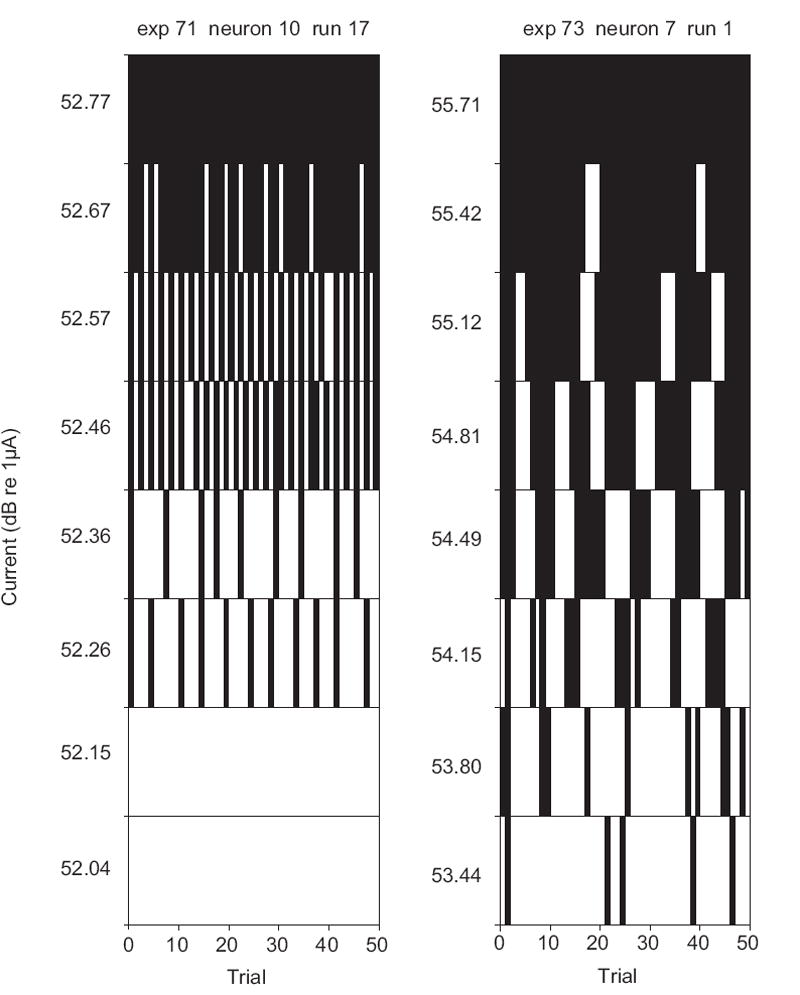
Two examples of bursting exhibited during single-pulse stimulation. Each bin represents one stimulus pulse (or “trial”). Pulses eliciting a spike were allocated a count of one, otherwise zero was recorded. The inter-pulse interval was 50 ms.
Discussion
Deafness and pulse-rate: an overview
A primary aim of these studies was to test whether SNHL affected pulse-rate dependent response properties of the auditory nerve. Here we found an increase in the dynamic range following pulse-train stimulation in deafened animals. Shepherd and Javel (1997) hypothesized that in the deafened cochlea, ANFs were slower to recover after generating a spike, possibly as a result of demyelination of the auditory nerve. However, without the experimentation presented in this paper it was not possible to exclude the alternative hypothesis that the extended dynamic range in chronically deafened animals was due to changes in spike initiation. The latter was thought possible because demyelination of mammalian nerve is known to have effects upon the neural membrane that might influence both spike initiation and membrane recovery (Waxman & Ritchie, 1993). Single pulses were used to explore spike initiation, on the assumption that the 50 ms inter-pulse interval was sufficient to allow a substantial recovery of the ANF between successive stimuli. Since the dynamic range of single-pulse responses was not dependent upon the presence or duration of SNHL, we deduce that the spike-rate-dependent aspects of spike initiation are not affected by deafness. Therefore, the increase in the dynamic range following pulse-train stimulation in deafened animals is likely due to an increase in membrane recovery time.
Deafness and pulse rate: single-pulse responses
The insensitivity of temporal jitter and dynamic range to deafness during single-pulse stimulation may suggest that the neural membrane properties associated with spike initiation do not change following SNHL, even if latencies decreased and thus the site of spike initiation moved more centrally on the ANF after SNHL. Membrane noise in a node of Ranvier of myelinated nerve results largely from sodium channel kinetics and its magnitude is inversely proportional to the square root of the number of available sodium channels (Rubinstein, 1995). Direct measurements of membrane noise at the site of spike initiation were not technically feasible in these studies as this would require making intracellular recordings from the modiolar portion of the auditory nerve, which is both myelinated and surrounded by bone. However, an indirect measurement of membrane noise is given by dynamic range during single-pulse stimulation, which is a reflection of the variability in spike firing around electrical threshold. At low stimulus rates, ANF firing can be viewed as a point renewal process, where the variability in spike firing rate is due to membrane noise with a Gaussian distribution (Verveen & Derksen, 1968; Bruce et al., 1999). As there was no change in the dynamic range of ANFs with deafness during single-pulse stimulation, the resting levels of membrane noise appear to remain unaltered, suggesting that the density of sodium channels within the nodes of Ranvier does not vary from normal levels five weeks, or six months, after deafferentation of the auditory nerve.
Deafness and pulse rate: pulse-train responses
Because the dynamic range following single-pulse stimulation was not affected by SNHL, we conclude that the extended dynamic range observed with pulse-train stimulation following SNHL was due to a slower membrane recovery in the deafened animal. This might be caused by a prolongation of refraction and/or accommodation. Prolonged refractory time-constants have been observed in demyelinated neurons (Waxman & Ritchie, 1993), of which the chronically deafened auditory nerve is an example (Leake & Hradek, 1988; Shepherd & Hardie, 2001). Consistent with this, experiments in our laboratories have shown that the absolute refractory period of ANFs is increased after a one-year period of SNHL in the rat (Shepherd et al., 2004). In our data, the reduction in amplitude of the “sawtooth” pattern seen on the pooled data from the six-month deafened animals (Fig 7a) may reflect a greater degree of variability in refractory time constants across the neural population, as would be expected in a degenerated auditory nerve.
The prolonged refraction, or increased accommodation, might be due to a relative increase in membrane potassium currents. In normal myelinated nerve, the nodes of Ranvier have high sodium channel and low potassium channel, densities. The inter-nodal regions (beneath the myelin sheath) have high potassium channel densities and low sodium channel densities (Waxman & Ritchie, 1993). The neuronal degeneration that follows deafness leads to axonal shrinkage, demyelination and a progressive retraction of the peripheral axon (Leake & Hradek, 1988). The demyelination may lead to a reduction in the paranodal resistance, with a leakage of inter-nodal potassium currents into the nodal regions to cause a prolongation of refractory time constants.
Accommodation was evident at the lowest levels of supra-threshold response (Fig. 7), where spikes occurred infrequently and thus refraction contributed little to the response. Here the accommodation might have resulted from a voltage-dependent ionic channel activated by the stimulus rather than prior spike activity. Either phase of the electrical stimulus could potentially activate such a channel. For instance, the anodic phase of the biphasic current pulse could activate a hyperpolarisation-activated cation channel, or the cathodic phase may activate a voltage gated potassium channel.
It may be concluded that SNHL affects the discharge-rate properties of the auditory nerve in a rate-dependent manner; at lower pulse rates (~20 pps) dynamic range is not affected by SNHL but at higher pulse rates (~200 pps) the dynamic range is extended in deafened animals. This would appear to be due to a slower recovery of the neural membrane following spiking and/or electrical stimulation after SNHL.
Spontaneous activity
Firing rate and distributions of spontaneously active ANFs were similar to those observed previously in cats (Shepherd & Javel, 1997) and rats (Shepherd et al., 2004), implanted with intracochlear electrode arrays, including the observation that the highest spontaneous firing rate in both species was approximately 95 spikes/s and that units with very high firing rates were observed infrequently in the deafened groups. In implanted hearing animals from the present study and the previous study in the rat, the numbers of spontaneously active ANFs were lower than that expected in normal hearing animals. This may be attributed to implantation of the electrode as it has been shown previously that implantation of an electrode array into the scala tympani of the rat resulted in a severe–profound hearing loss (Paolini & Clark, 1998), and in the cat implantation of an scala tympani electrodes can reduce both acoustic sensitivity and spontaneous firing rates (van den Honert & Stypulkowski, 1984).
Electrophonic activity
The proportion of electrophonic responses in undeafened animals was similar to that reported previously from cats with intracochlear electrodes that had normal hearing prior to the implant surgery (19.2%) (van den Honert & Stypulkowski, 1984). As expected, the proportion of units exhibiting electrophonic activity in the present study was greatly reduced following deafening (Javel & Shepherd, 2000).
Bursting
Observations of bursting activity in ANFs responding to electrical stimulation have previously been reported in both normal hearing (van den Honert & Stypulkowski, 1984; Miller et al., 2006; Litvak et al., 2003) and deafened cats (Shepherd & Javel, 1997). The incidence of bursting seen in the present studies was strikingly similar to that in a previous study where 18 out of 237 fibres, showed this characteristic (Shepherd & Javel, 1997). As in previous studies, we saw no evidence that such responses were correlated with respiration or heart rate. Furthermore, the bursting activity has been observed under several different anesthetic agents including pentobarbitone (Shepherd & Javel, 1997), urethane (van den Honert & Stypulkowski, 1984; Litvak et al., 2003) and ketamine/xylazine (Miller et al., 2006). The bursting previously reported in ototoxically deafened cats was attributed to conduction block (Shepherd & Javel, 1997). Conduction block occurs in demyelinated neurons and is due to failure of an action potential to cross a node of Ranvier (Smith & McDonald, 1999). The presence of bursting in both hearing and deafened groups in the present study and hearing groups in another recent study (Miller et al., 2006) argues against an etiology of conduction block, since demyelination would not be anticipated in hearing animals. Furthermore, if the bursting were due to conduction block, these units should have had longer latencies since conduction would be slowed through a demyelinated segment of nerve (Waxman & Ritchie, 1993). Rather, we found these units have significantly shorter latencies. The characteristic increase in the rate of bursting with stimulus current would be more consistent with a stimulus-driven oscillation in the membrane potential, due to the effects of an ion channel with kinetics exceeding the period between successive pulse-train stimuli, such as a calcium-dependent potassium ion channel, or a channel with slow sodium inactivation (Waxman & Ritchie, 1993).
The bursting reported by Miller and colleagues (2006) may have been caused by a different mechanism than that reported here. In their study they reported a bursting rate of approximately 14 Hz in hearing animals only, while the rate of bursting reported here was 2-5 Hz in both hearing and deafened animals.
Site of spike initiation
Two different patterns of ANF responses to pulse-train stimulation have been reported following SNHL (Table 2). The first is observed within the first few months of SNHL in the cat (Shepherd & Javel, 1997; Miller et al., 2006) and is characterized by a reduction in threshold, jitter and dynamic range, with latency unchanged (Pattern A). The second response has been observed in a 45-month-deafened cat, the rat after prolonged deafness, and after five weeks and six months of SNHL in the guinea pig (the present study, Pattern B). This response is characterized by a reduction in latency and an increase in dynamic range (not studied in the rat) with the temporal jitter unchanged. Pattern A might be due to either changes in the electrical resistive properties of the cochlea that may occur when hair cells and peripheral dendrites are lost (Black et al., 1983; Shepherd & Javel, 1997) or because ANF are in a refractory state less of the time when spontaneous activity decreases after inner hair cells are lost (Miller et al., 2006). Pattern B may arise from spike initiation at, or proximal to, the cell body. In the 45-deafened cat studied most of the peripheral dendrites were absent, which required the postulation of a “central” site of activation. A central site of spike initiation was likely in the present studies because monopolar electrical stimulation of the guinea pig is known to elicit a broad spread of stimulus current (Snyder et al., 2004), and this is likely caused by a spread of current into the modiolus. In the guinea pig (the present study) we postulate that the site of spike initiation was central in both normal hearing and deafened animals. This would account for the absence of quantal jumps in latency in the data collected. Following SNHL, there may have been a reduction in the resistive pathways through the modiolus leading to a proximal migration of the site of spike initiation down the central axon, reducing latency but not jitter. The lower resistance could also account for the reduction in thresholds observed after six months of SNHL. If spikes are initiated centrally, the reduction in both latency and jitter with increasing stimulus current may be due to a more rapid depolarization of the neural membrane and activation of voltage-dependent ion channels, rather than a migration of the site of spike initiation.
Table 2.
Comparisons between studies
| Study | Animal | Group | SNHL duration | Stimulation | Threshold | Latency | Jitter | Dynamic Range | Bursting |
|---|---|---|---|---|---|---|---|---|---|
| Shepherd & Javel, 1997 | Cat | STD | 2-3 m | BIP | ↓ | n.s. | ↓ | ↓ | Yes |
| Miller et al., 2006 | Cat | STD | acute | MP | ↓ | n/a | ↓ | ↓* | Yes** |
| Shepherd et al., 2004 | Rat | STD | 2 m | BIP | ↑ | n.s. | n.s. | n/a | n/a |
| Sly et al., (present study) | GP | STD | 1 m | MP | n.s. | ↓ | n.s. | ↑ | Yes |
| Sly et al., (present study) | GP | LTD | 6 m | MP | ↓ | ↓ | n.s. | ↑ | Yes |
| Shepherd et al., 2004 | Rat | LTD | 14 m | BIP | ↑ | ↓ | n.s. | n/a | n/a |
| Shepherd & Javel, 1997 | Cat | LTD | 45 m | BIP | ↑ | ↓ | n.s. | ↑ | Yes |
Legend: GP – guinea pig, STD – short-term deaf, LTD – long-term deaf, m – months, BIP – bipolar, MP – monopolar, n.s. – no significant difference
Significance was achieved after removal of outliers
Bursting had a shorter time course compared to the other studies
Potential clinical implications of these data
These results provide an interesting perspective on some aspects of cochlear implant perception during pulse-train stimulation, and although the present data relate to a “low” pulse-rate for speech processing, 200 pps, the conclusions should also apply to higher rates of stimulation. The accommodation observed at low levels of neural response may explain existing psychophysical data as it relates to the effect on inter-pulse interval on loudness and perceptual threshold (White, 1984; White et al., 1984). The psychophysical data showed that as long as the number of stimulus pulses was held constant, as the time interval between pulses is decreased, behavioral threshold current decreased and perceived loudness increased. Paradoxically, auditory nerve refractory effects would predict just the opposite: As inter-pulse interval is decreased, the likelihood of neural firing would decrease due to refraction - and as a consequence, we would expect behavioral threshold to increase and loudness to decrease. In contrast, we suggest that an accommodative mechanism is quite consistent with the behavioral data. Our data indicates that accommodative behavior dominates temporal responses at lower discharge probabilities. Specifically, a sub-threshold pulse causes the nerve to become less excitable. Some of our more recent data indicate that excitability starts dropping at about 1 ms after the presentation of a subthreshold pulse (Sly et al., 2005). Thereafter, excitability continues to drop rapidly over approximately 5 ms. An accommodative mechanism may in part explain why ANF dynamic ranges for pulse-train stimuli are significantly larger than those for single pulses. The same accommodative mechanism may also account for inter-channel “temporal interactions” which are believed to be an important, limiting factor in cochlear prostheses. Consistent with this hypothesis: The time-constant for ANF accommodation is similar to “time constant” of threshold reduction vs. inter-pulse intervals during non-simultaneous stimulation of electrode-channels in implanted patients (White et al., 1984).
Evoked auditory potentials, such as the electrically-evoked brainstem response or cochlear compound action potentials, are an objective measure of auditory function following cochlear implantation. These responses are recorded at very low rates of simulation, similar to the “single-pulse” stimulus presented in these studies. Hall (1990) demonstrated that the amplitude of the cochlear compound action potential and Wave I of the EABR correlates with the degree of spiral ganglion cell survival. This interpretation assumes that the function of ANFs does not change significantly with the number of surviving SGNs. We have found single-fibre evidence to support this assumption, given that auditory neurons from deafened animals appear to have normal dynamic ranges following single-pulse stimulation.
Given the extended dynamic range of ANFs in deafened animals responding to pulse-train stimulation, we predict that at higher rates of stimulation (e.g. 200pps) SNHL-related alterations in evoked potentials and cochlear implant perception are likely to reflect both changes in the function of individual ANFs and the number that survive. It must however be remembered that deafness-induced changes within the central auditory system will also influence the evoked potential recordings and human perception.
Methodological considerations
There are several methodological factors that must be considered when interpreting the present study. First, we assume here that all ANFs were type I SGNs. Type II neurons, which form only 5–10% of SGNs, are much smaller, and are very difficult to isolate using the recording techniques used here; there is only one confirmed recording in the scientific literature (Robertson, 1984). Second, while vestibular neurons with highly regular, high-rate spontaneous activity (Rupert et al., 1962; Goldberg & Fernandez, 1971; Hartmann et al., 1984) were easily identified and removed from the analyses, the possibility cannot be excluded that a smaller population of vestibular fibres with irregular spontaneous activity (Rupert et al., 1962; Goldberg & Fernandez, 1971) may have been included in these analyses. Positive identification of auditory nerves by response to acoustic stimulation was obviously not possible in the deafened animals. We reduced the likelihood of recording from the vestibular nerve by careful placement of the recording electrode, avoiding the superior vestibular and facial nerves that emerge from foramina, dorsal and rostral to the auditory nerve (Wysocki, 2005). The vestibular neurons that might have been encountered in this experiment would have arisen from the inferior vestibular nerve, which wraps around the auditory nerve trunk. Third, differences in ANF responses between normal and deafened animals may be thought to be due to the presence or absence of hair cells. However we minimized the contribution of hair cells by excluding electrophonic activity from the direct electrical response analyses. Furthermore, the observation that in animals deafened for five weeks, direct-electrical thresholds were not different from undeafened animals, whereas animals deafened for six-months had significantly reduced thresholds, suggests that the absence of hair cells alone did not alter stimulus current resistance through the organ of Corti.
Fourth, while we have shown that a number of response properties of ANFs are affected by SNHL induced via ototoxic deafening, the etiology of SNHL in patients is varied and can affect the rate and extent of the auditory nerve degeneration (Nadol et al., 1989). It should also be considered that the poorer perceptual performance of cochlear implant recipients with longer duration SNHL prior to implant, may be due to central as well as peripheral changes within the auditory system (Blamey et al., 1996). Nevertheless, the changes observed here and in previous studies suggest that the response properties of peripheral auditory nerves are altered by SNHL, and this may contribute to the poorer speech perception of patients treated following months or years of SNHL (Blamey et al., 1996; Friedman, 2002).
Conclusions
The success of the cochlear implant is dependent in part upon the state of the auditory nerves following SNHL including the number of surviving neurons. We have established the electrically stimulated guinea pig cochlea as a model for electrical stimulation of the auditory nerve and demonstrated that SNHL affects response properties in a pulse-rate dependent manner. The response of the guinea pig to monopolar electrical stimulation of the cochlea resembles that of the long-term deafened cat. At lower stimulus rates of electrical stimulation (20 pps), only the latency of the single-fibre direct-electrical response appears to be affected by SNHL. Otherwise, surviving auditory neurons appear to have near normal function following low-rate stimulation and the SNHL-related reduction in the amplitude of electrically-evoked brainstem potentials might reflect a reduction in SGN numbers, rather than changes in ANF function. At higher rates of stimulation (200pps), SNHL-related alterations in evoked potentials and cochlear implant perception are likely to reflect changes in both the function of individual ANFs and the number that survive. Auditory neurons that survive SNHL are less responsive to stimulus current during higher rates of electrical stimulation (200 pps), as evidenced by an increase in dynamic range. This appears to be due to slower recovery of the neural membrane mediated by refraction and accommodation, rather than any rate-dependent effect upon spike initiation.
Although it is currently not clear how changes in ANF latency, threshold and dynamic range will precisely affect implant perception, these are fundamental properties of the surviving neurons and it is likely they will impact upon intensity and possibly temporally, encoded information. Data from these experiments will: 1) inform cochlear implant neural models 2) help to refine current speech processing strategies; and 3) help to determine the likely benefit of future intervention strategies, such as neural preservation with neurotrophins.
Acknowledgments
The authors thank Mr Rodney Millard for engineering assistance and for proofing technical aspects of this manuscript, Mr Frank Nielsen for additional engineering assistance, Dr James Fallon for the use of custom software routines used in the EABR analyses, Dr Jin Xu and Ms Helen Feng for electrode manufacture, Dr Sue Pierce and Ms Elisa Borg for veterinary advice and animal husbandry assistance and Ms Maria Clarke and Ms Prue Nielsen for histological assistance. This work was supported by the Garnett Passe and Rodney Williams Memorial Foundation, National Institute on Deafness and Other Communication Disorders; Contracts NO1-DC-0-2109 and NO1-DC-3-1005, The Bionic Ear Institute and The University of Melbourne.
Abbreviations
- ABRs
auditory brainstem responses
- ANFs
auditory nerve fibres
- EABR
electrically-evoked auditory brainstem response
- IO
input-output
- SGN
spiral ganglion neuron
- SNHL
sensorineural hearing loss
Footnotes
It has been argued that adaptation implies the presence of sensory cells (hair cells), which are largely destroyed in deafened animals, so we limit the use of this term. We adopt the term “accommodation” while some groups have referred to this phenomenon as “short-term adaptation”.
References
- Black RC, Clark GM, O’Leary SJ, Walters C. Intracochlear electrical stimulation of normal and deaf cats investigated using brainstem response audiometry. Acta Otolaryngol Suppl. 1983;399:5–17. doi: 10.3109/00016488309105588. [DOI] [PubMed] [Google Scholar]
- Blamey PJ, Ardnt P, Bergeron G, Brimacombe J, Facer G, Larky J, Lindstrom B, Nedzelski J, Peterson J, Peterson A, Shipp D, Staller S, Whitford L. Factors Affecting Auditory Performance of Postlinguistically Deaf Adults Using Cochlear Implants. Audiol Neurootol. 1996;1:293–306. doi: 10.1159/000259212. [DOI] [PubMed] [Google Scholar]
- Bruce IC, Irlicht LS, White MW, O’Leary SJ, Javel E, Clark GM. A stochastic model of the electrically stimulated auditory nerve: single-pulse response. IEEE Trans Biomed Eng. 1999;46:617–629. doi: 10.1109/10.764938. [DOI] [PubMed] [Google Scholar]
- Dodson HC, Mohuiddin A. Response of spiral ganglion neurones to cochlear hair cell destruction in the guinea pig. J Neurocytol. 2000;29:525–537. doi: 10.1023/a:1007201913730. [DOI] [PubMed] [Google Scholar]
- Friedman L. Ph.D. Dissertation. University Of Melbourne; Australia: 2002. A retrospective study on the outcomes of cochlear implants in patients with otosclerosis. [Google Scholar]
- Goldberg JM, Fernandez C. Physiology of peripheral neurons innervating semicircular canals of the squirrel monkey. 3. Variations among units in their discharge properties. J Neurophysiol. 1971;34:676–684. doi: 10.1152/jn.1971.34.4.676. [DOI] [PubMed] [Google Scholar]
- Gomaa NA, Rubinstein JT, Lowder MW, Tyler RS, Gantz BJ. Residual speech perception and cochlear implant performance in postlingually deafened adults. Ear Hear. 2003;24:539–544. doi: 10.1097/01.AUD.0000100208.26628.2D. [DOI] [PubMed] [Google Scholar]
- Hall RD. Estimation of surviving spiral ganglion cells in the deaf rat using the electrically evoked auditory brainstem response. Hear Res. 1990;49:155–168. doi: 10.1016/0378-5955(90)90102-u. [DOI] [PubMed] [Google Scholar]
- Hartmann R, Topp G, Klinke R. Discharge patterns of cat primary auditory fibres with electrical stimulation of the cochlea. Hear Res. 1984;13:47–62. doi: 10.1016/0378-5955(84)90094-7. [DOI] [PubMed] [Google Scholar]
- Hellier WP, Wagstaff SA, O’Leary SJ, Shepherd RK. Functional and morphological response of the stria vascularis following a sensorineural hearing loss. Hear Res. 2002;172:127–136. doi: 10.1016/s0378-5955(02)00553-1. [DOI] [PubMed] [Google Scholar]
- Huang CQ, Shepherd RK, Carter PM, Seligman PM, Tabor B. Electrical stimulation of the auditory nerve: direct current measurement in vivo. IEEE Trans Biomed Eng. 1999;46:461–470. doi: 10.1109/10.752943. [DOI] [PubMed] [Google Scholar]
- Hurley PA, Clarke M, Crook JM, Wise AK, Shepherd RK. Cochlear immunochemistry--a new technique based on gelatin embedding. J Neurosci Methods. 2003;129:81–86. doi: 10.1016/s0165-0270(03)00211-5. [DOI] [PubMed] [Google Scholar]
- Javel E, Shepherd RK. Electrical stimulation of the auditory nerve. III. Response initiation sites and temporal fine structure. Hear Res. 2000;140:45–76. doi: 10.1016/s0378-5955(99)00186-0. [DOI] [PubMed] [Google Scholar]
- Leake PA, Hradek GT. Cochlear pathology of long term neomycin induced deafness in cats. Hear Res. 1988;33:11–33. doi: 10.1016/0378-5955(88)90018-4. [DOI] [PubMed] [Google Scholar]
- Litvak LM, Smith ZM, Delgutte B, Eddington DK. Desynchronization of electrically evoked auditory-nerve activity by high-frequency pulse trains of long duration. J Acoust Soc Am. 2003;114:2066–2078. doi: 10.1121/1.1612492. [DOI] [PMC free article] [PubMed] [Google Scholar]
- Miller CA, Abbas PJ, Robinson BK, Nourski KV, Zhang F, Jeng FC. Electrical excitation of the acoustically sensitive auditory nerve: single-fibre responses to electric pulse trains. J Assoc Res Otolaryngol. 2006;7:195–210. doi: 10.1007/s10162-006-0036-9. [DOI] [PMC free article] [PubMed] [Google Scholar]
- Moxon EC. Ph.D. Dissertation. MIT Press; Cambridge, MA: 1971. Neural and Mechanical Responses to Electrical Stimulation of the Cat’s Inner Ear. [Google Scholar]
- Nadol JB, Jr, Young YS, Glynn RJ. Survival of spiral ganglion cells in profound sensorineural hearing loss: implications for cochlear implantation. Ann Otol Rhinol Laryngol. 1989;98:411–416. doi: 10.1177/000348948909800602. [DOI] [PubMed] [Google Scholar]
- O’Leary SJ, Tong YC, Clark GM. Neural processes in the dorsal cochlear nucleus of the anaesthetised cat investigated from unit responses to electrical stimulation of the auditory nerve. Hear Res. 1994;74:181–196. doi: 10.1016/0378-5955(94)90186-4. [DOI] [PubMed] [Google Scholar]
- Paolini AG, Clark GM. Intracellular responses of the rat anteroventral cochlear nucleus to intracochlear electrical stimulation. Brain Res Bull. 1998;46:317–327. doi: 10.1016/s0361-9230(98)00017-3. [DOI] [PubMed] [Google Scholar]
- Press WH, Teukolsky SA, Vetterling WT, Flannery BP. Numerical recipes in FORTRAN. Cambridge University Press; Cambridge, U.K.: 1992. [Google Scholar]
- Robertson D. Horseradish peroxidase injection of physiologically characterized afferent and efferent neurones in the guinea pig spiral ganglion. Hear Res. 1984;15:113–121. doi: 10.1016/0378-5955(84)90042-x. [DOI] [PubMed] [Google Scholar]
- Rubinstein JT. Threshold fluctuations in an N sodium channel model of the node of Ranvier. Biophys J. 1995;68:779–785. doi: 10.1016/S0006-3495(95)80252-3. [DOI] [PMC free article] [PubMed] [Google Scholar]
- Rupert A, Moushegian G, Galambos R. Microelectrode studies of primary vestibular neurons in cat. Exp Neurol. 1962;5:100–109. doi: 10.1016/0014-4886(62)90026-2. [DOI] [PubMed] [Google Scholar]
- Shepherd RK, Clark GM. Progressive ototoxicity of neomycin monitored using derived brainstem response audiometry. Hear Res. 1985;18:105–110. doi: 10.1016/0378-5955(85)90001-2. [DOI] [PubMed] [Google Scholar]
- Shepherd RK, Javel E. Electrical stimulation of the auditory nerve. I. Correlation of physiological responses with cochlear status. Hear Res. 1997;108:112–144. doi: 10.1016/s0378-5955(97)00046-4. [DOI] [PubMed] [Google Scholar]
- Shepherd RK, Hardie NA. Deafness-induced changes in the auditory pathway: implications for cochlear implants. Audiol Neurootol. 2001;6:305–318. doi: 10.1159/000046843. [DOI] [PubMed] [Google Scholar]
- Shepherd RK, Roberts LA, Paolini AG. Long-term sensorineural hearing loss induces functional changes in the rat auditory nerve. Eur J Neurosci. 2004;20:3131–3140. doi: 10.1111/j.1460-9568.2004.03809.x. [DOI] [PubMed] [Google Scholar]
- Sly DJ, Heffer LH, White MW, Shepherd RK, O’Leary SJ. The response of the auditory nerve to electrical stimulation following deafness. Conference on Implantable Auditory Prostheses; Asilomar, CA, U.S.A.. 2005. [Google Scholar]
- Smith KJ, McDonald WI. The pathophysiology of multiple sclerosis: the mechanisms underlying the production of symptoms and the natural history of the disease. Philos Trans R Soc Lond B Biol Sci. 1999;354:1649–1673. doi: 10.1098/rstb.1999.0510. [DOI] [PMC free article] [PubMed] [Google Scholar]
- Snyder RL, Bierer JA, Middlebrooks JC. Topographic spread of inferior colliculus activation in response to acoustic and intracochlear electric stimulation. J Assoc Res Otolaryngol. 2004;5:305–322. doi: 10.1007/s10162-004-4026-5. [DOI] [PMC free article] [PubMed] [Google Scholar]
- van den Honert C, Stypulkowski PH. Physiological properties of the electrically stimulated auditory nerve. II. Single fibre recordings. Hear Res. 1984;14:225–243. doi: 10.1016/0378-5955(84)90052-2. [DOI] [PubMed] [Google Scholar]
- Verveen AA, Derksen HE. Fluctuation phenomena in nerve membrane. Proceedings of the IEEE. 1968;56:906–916. [Google Scholar]
- Waxman SG, Ritchie JM. Molecular dissection of the myelinated axon. Ann Neurol. 1993;33:121–136. doi: 10.1002/ana.410330202. [DOI] [PubMed] [Google Scholar]
- White MW. Psychophysical and neurophysiological considerations in the design of a cochlear prosthesis. Audiologia Italiana. 1984;1:77–117. [Google Scholar]
- White MW, Merzenich MM, Gardi JN. Multichannel cochlear implants. Channel interactions and processor design. Arch Otolaryngol. 1984;110:493–501. doi: 10.1001/archotol.1984.00800340005002. [DOI] [PubMed] [Google Scholar]
- Wysocki J. Topographical anatomy of the guinea pig temporal bone. Hear Res. 2005;199:103–110. doi: 10.1016/j.heares.2004.08.008. [DOI] [PubMed] [Google Scholar]
- Xu J, Shepherd RK, Millard RE, Clark GM. Chronic electrical stimulation of the auditory nerve at high stimulus rates: a physiological and histopathological study. Hear Res. 1997;105:1–29. doi: 10.1016/s0378-5955(96)00193-1. [DOI] [PubMed] [Google Scholar]