Abstract
Induction of differentiation and apoptosis in cancer cells through ligands of nuclear hormone receptors (NHRs) is a novel and promising approach to cancer therapy. All-trans-retinoic acid (ATRA), an RA receptor-specific NHR ligand, is now used for selective cancers. The NHR, peroxisome proliferator-activated receptor γ (PPARγ) is expressed in breast cancer cells. Activation of PPARγ through a synthetic ligand, troglitazone (TGZ), and other PPARγ-activators cause inhibition of proliferation and lipid accumulation in cultured breast cancer cells. TGZ (10−5 M, 4 days) reversibly inhibits clonal growth of MCF7 breast cancer cells and the combination of TGZ (10−5 M) and ATRA (10−6 M, 4 days) synergistically and irreversibly inhibits growth and induces apoptosis of MCF7 cells, associated with a dramatic decrease of their bcl-2 protein levels. Similar effects are noted with in vitro cultured breast cancer tissues from patients, but not with normal breast epithelial cells. The observed apoptosis mediated by TGZ and ATRA may be related to the striking down-regulation of bcl-2, because forced over-expression of bcl-2 in MCF7 cells cultured with TGZ and ATRA blocks their cell death. TGZ significantly inhibits MCF7 tumor growth in triple immunodeficient mice. Combined administration of TGZ and ATRA causes prominent apoptosis and fibrosis of these tumors without toxic effects on the mice. Taken together, this combination may provide a novel, nontoxic and selective therapy for human breast cancers.
The high prevalence of breast cancer and the limited therapeutic possibilities provide a strong stimulus for identification of new, selective molecular targets for anticancer therapy. Cancers are associated with dysregulation of differentiation and apoptosis. Induction of these processes through ligands of nuclear hormone receptors (NHRs) is a recent approach to cancer therapy, particularly, in the use of RAs for treatment of acute promyelocytic leukemia (1), early lesions of head and neck cancer (2), squamous cell carcinoma of the cervix (3), and skin cancer (4). The actions of retinoids are mediated by RA receptors (RARs) and retinoic X receptors (RXR) both of which are expressed in breast cancer cells. The RARs and RXRs bind to specific RA-responsive elements and regulate transcription of target genes in a ligand-dependent manner (5–6). Retinoids are highly effective in preventing mammary carcinogenesis in rodents (7). The RAR-specific ligand, all-trans-RA (ATRA) selectively inhibits growth of human estrogen receptor (ER)-positive breast cancer cells (8–10), and these cells express higher levels of RARα mRNA than ER-negative lines (10–11). Furthermore, activation of gene transcription by RARα appears to be required for inhibition of growth in human ER-positive breast cancer cells by retinoids (12). However, inhibition of growth of breast cancer cells through retinoids is usually reversible with removal of the ligand (13).
The peroxisome proliferator-activated receptor γ (PPARγ), which also belongs to the NHR superfamily, has an important role in differentiation of adipocytes and in fat metabolism (14- 15). Epidemiological data suggest that the incidence of breast cancer is related to consumption of a diet high in fat (16–17). Breast cancer cells have significant lipogenic capacity, and inhibition of fat metabolism in these cells is associated with inhibition of growth and apoptosis (18). Recent data showed that human breast cancer cell lines as well as primary and metastatic breast adenocarcinomas expressed PPARγ and ligand activation of PPARγ caused inhibition of proliferation and extensive lipid accumulation in cultured breast cancer cell lines (19–20).
Various NHRs can interact with each other by suppression or activation of their target genes. For example, RXRs activated (21) and RARs suppressed the induction of PPARγ (22) in normal fat cells. Our previously data showed crosstalk between the NHRs; for example, ligand-activation of receptors for RAR/RXR and vitamin D3 resulted in a synergistic decreased proliferation and induction of apoptosis of leukemia cell lines (23–24). In this investigation, we analyzed the ability of a synthetic-specific ligand of PPARγ, the antidiabetic drug troglitazone (TGZ; ref. 25) as well as several other PPARγ ligands either alone or in combination with ATRA to affect the growth, differentiation and apoptosis of breast cancer cells in vitro and in vivo.
MATERIALS AND METHODS
Cell Lines and Samples.
All cell lines were obtained from American Type Culture Collection (Rockville, MD) and maintained according to their recommendations. Fresh breast cancer and adjacent normal breast tissue from three individuals were surgically obtained after their informed consent.
Ligands.
TGZ {5[4(3, 4-Dihydro-6-hydroxy-2, 5, 7, 8-tetramethyl-2H-1-benzopyran-2-yl)methoxy]phenyl[methyl]-2,4-thiazolidinedione} (generous gift of W. Johnson and A. Salteil, Park-Davis/Warner-Lambert, Ann Arbor, MI), and ATRA (Sigma) were dissolved in 100% ethanol. The 15-deoxy-Δ12, 14-prostaglandin J2 (15d-PGJ2, Calbiochem, La Jolla, CA) and indomethacin (Sigma) were dissolved in dimethyl sulfoxide. Each of the diluants either alone or in combination at concentrations of 10−5 M or less had no significant effect on breast cancer cell lines.
Clonogenic Assay in Soft Agar.
Effect of NHR ligands on clonogenic growth of breast cancer cells was determined by dose-response studies in soft agar as described (26).
Measurement of Cellular Content of Proteins and Lipid Accumulation.
Expression of specific proteins was detected by Western blot, flow cytometry (24), or by immunohistochemistry of either cytospined MCF7 cells grown in vitro or freshly fixed in formalin and embedded in paraffin (24, 26). Western blotting, immunodetection, and stripping of membranes were performed by using standard methods (60 μg of protein per lane), as recommended by the supplier of the Enhanced Chemiluminescence Detection System (Amersham). Densitometric measurements were done by using “UVP gel analysis suite,” Anti-PPARγ polyclonal antibody (516555, 1:2000, Calbiochem), anti-bcl-2 murine mAb, (clone 124, 1:50, Dako), anti-bax polyclonal antibody (N20, 1:50, Santa Cruz, CA); anti CD36 mAb (1:100, Immunotech, Luminy, France), anti-E-cadherin mAb (1:1500, Transduction Laboratories, Lexington, KY), and anti-β-casein mAb (MAS 447 1:100, Harlan Sera-Lab, Sussex, England) were used. Expression of proteins in MCF7 cells stained by immunohistochemistry were measured by the total intensity score (0–300), which was calculated as the sum of the products of each intensity score (0–3) and their corresponding percentages from 300 cells. Normal IgG was substituted for specific antibody for each experiment as a negative control. Measurement of lipid accumulation was performed by staining of cells with Oil Red O (26). Human breast adipocytes were used as positive control.
Measurement of Apoptosis.
DNA strand breaks were identified by terminal deoxynucleotidyltransferase-mediated UTP end labeling (TUNEL) technique using in situ Cell Death Detection Kit, used either fluorescein or alkaline phosphatase (AP) as recommended by the supplier (Boehringer Mannheim).
Transfection of MCF7 Cells with bcl-2 Vector.
MCF7 cells were transfected with a cytomegalovirus-bcl-2 expression plasmid (generous gift from J. Reed, The Burnham Institute, La Jolla, CA) or empty vector (pcDNA3) using Superfect (Qiagen). As a marker for transfection, a plasmid coding for green fluorescent protein (EGFP, CLONTECH) driven by the cyclin A1 promoter (C. Müller and H. P. Koeffler, unpublished data) was cotransfected at a ratio of 1:4. The green fluorescent protein-expressing cells were selected using a FACStar (Becton Dickinson) flow cytometric sorter.
Northern Blot Analysis.
Total RNA was extracted by using Trizol (GIBCO/BRL). Blots (30 μg of total RNA) were hybridized with 32P-labeled CCAT-Enhancer Binding Protein (5.0-kb BamHI genomic fragment), as well as aP2, lipoprotein lipase, and adipsin (cDNA). Blots were rehybridized with β-actin probe as control.
In Vivo Murine Cancer Model.
Female triple-immunodeficient BNX nude mice (Harlan–Sprague–Dawley) at 8 weeks of age were whole body irradiated (300 rads) and 5 × 10⁶ of MCF7 cells in 0.1 ml of Matrigel (Collaborative Biomedical Products, Bedford, MA) were bilaterally injected s.c. into the trunk of 20 mice, forming two tumors/mouse. Treatment was started on the day after the injection of these human breast cancer cells and finished after 9 weeks. Cohorts (5 mice/group) received diluant only (control group), troglitazone (1,000 mg/kg/day, orally by gavage), ATRA (7.5 mg/kg/day, i.p.), or both ligands. After 9 weeks, bloods were collected for chemistry and hematological analyses. Tumors, livers, lungs, spleens, and kidneys were fixed and stained for histological analyses. All animal experiments were in compliance with National Institutes of Health guidelines.
Statistical Analysis.
All numerical data were expressed as the average of the values obtained ± SD. Statistical significance of differences between tumors in mice was analyzed by nonparametric Mann–Whitney U test using stat view software (Abacus Concept, Berkeley CA). For all other experiments, significance was determined by conducting a paired Student’s t test.
RESULTS
Expression of PPARγ Protein.
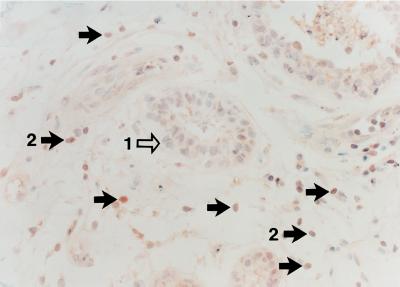
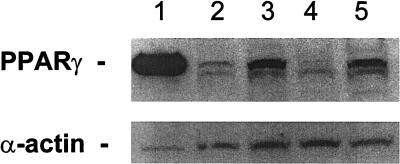
Breast adenocarcinoma cells from patients (Fig. 1) expressed high levels of PPARγ protein as seen by immunohistochemistry. In contrast, normal breast epithelial cells from individuals with breast cancer expressed low levels of PPARγ protein (Fig. 1). The rank order of expression of PPARγ in the breast cancer cell lines was: BT474>MCF7>T47D>MDA-MB-231, as measured by Western blot (Fig. 2).
Figure 1.
Expression of PPARγ protein in infiltrating ductal breast adenocarcinoma. Benign breast ducts show low immunoreactivity (arrow 1), whereas infiltrating carcinoma cells are strongly positive (arrow 2).
Figure 2.
Expression of PPARγ protein in human breast cancer cell lines. Lane 1, human breast adipocytes (positive control); lane 2, T47D cells; lane 3, MCF7 cells; lane 4, MDA-MB-231 cells; lane 5, BT474 cells. The α-actin is control for the amount of loaded protein.
Effect of Ligands on Proliferation of Breast Cancer Cells in Vitro.
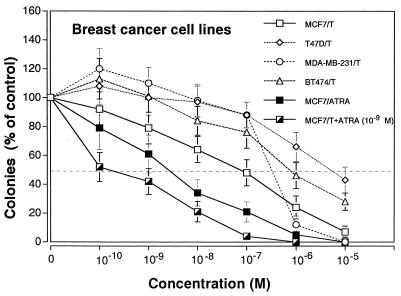
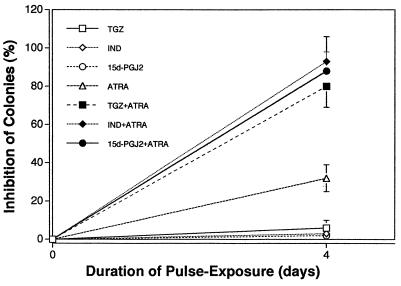
Sensitivity of breast cancer cell lines to inhibition of clonal growth by TGZ is shown on Fig. 3. The MCF7 cells were the most sensitive to the inhibitory effects of TGZ (MCF7>MDA-MB-231>BT474>T47D) with an effective dose (EC50) of 10−7 M, resulting in the inhibition of 50% clonal growth (Fig. 3). Dose-response studies with ATRA showed an EC50 of 4 × 10⁻⁹ M for MCF7 cells, and the combination of various concentrations of TGZ together with 10−9 M ATRA enhanced this inhibition (Fig. 3). Pulse-exposure of MCF7 cells for 4 days to either TGZ (10−5 M) or ATRA (10−6 M), washing extensively and culturing in agar, resulted in 6% and 32% decrease, respectively in clonogenic growth (Fig. 4). Thus, growth inhibition by either TGZ or ATRA was partially reversible. In contrast, a 4-day pulse-exposure to both TGZ (10−5 M) and ATRA (10−6 M) irreversibly inhibited 80% clonogenic growth compared with untreated MCF7 cells (Fig. 4). The 15d-PGJ2, natural ligand for PPARγ, and indomethocin, also a PPARγ ligand (10−10-10−5 M) inhibited clonal growth of MCF7 cells; and the rank order of inhibition was 15d-PGJ2>TGZ>indomethacin (data not shown), and this inhibition was reversible (Fig. 4). However, the combination of ligands for PPARγ and RAR induced irreversible inhibition of clonal proliferation (Fig. 4).
Figure 3.
Dose-response effect of TGZ and/or ATRA on clonal proliferation of breast cancer cell lines Results are expressed as the mean percentage of colonies in control plates containing no ligand. Each point represents mean ± SD of three independent experiments with triplicate dishes.
Figure 4.
Pulse-exposure of MCF7 cells to TGZ (10−5 M), indomethacin (IND) (10−5 M), 15d-PGJ2 (10−5 M), and/or ATRA(10−6 M). Results are expressed as the mean percentage of control plates containing no ligand. Each point represents a mean ± SD of three independent experiments with triplicate dishes.
Analysis of Apoptosis in MCF7 Cells.
ATRA (10−6 M, 4 days) did not induce apoptosis of MCF7 cells (Table 1). TGZ (10−5 M, 4 days) increased only slightly the percentage of apoptotic cells (13 ± 8%) compared with untreated cells (8 ± 3%). In contrast, the combination of both ligands significantly increased the number of MCF7 cells undergoing apoptosis (41 ± 4%, P < 0.05, Table 1). In addition, either 15d-PGJ2 or indomethacin (10−5 M) combined with ATRA (10−6 M) for 4 days induced apoptosis (Table 1).
Table 1.
Apoptosis in nontransfected and bcl-2-transfected MCF7 cells
| Ligands | Apoptotic cells, %
|
||
|---|---|---|---|
| non-transfected | bcl-2 expression vector | empty vector | |
| (−) | 8 ± 3 | 10 ± 3 | 12 ± 4 |
| ATRA | 7 ± 5 | 11 ± 5 | 14 ± 6 |
| TGZ | 13 ± 8 | 11 ± 6 | 20 ± 9 |
| TGZ + ATRA | 41 ± 4 | 10 ± 4 | 58 ± 8 |
| IND | 12 ± 4 | ND | ND |
| IND + ATRA | 44 ± 6 | ND | ND |
| 15dPGJ2 | 18 ± 7 | ND | ND |
| 15dPGJ2 + ATRA | 46 ± 4 | ND | ND |
Apoptosis determined by TUNEL assay. ND, not done; IND, indomethacin. Cells exposed 4 days to ATRA (10−6 M), TGZ (10−5 M), IND (10−5 M), and 15dPGJ2 (10−5 M). Results represent the mean ± SD of three experiments.
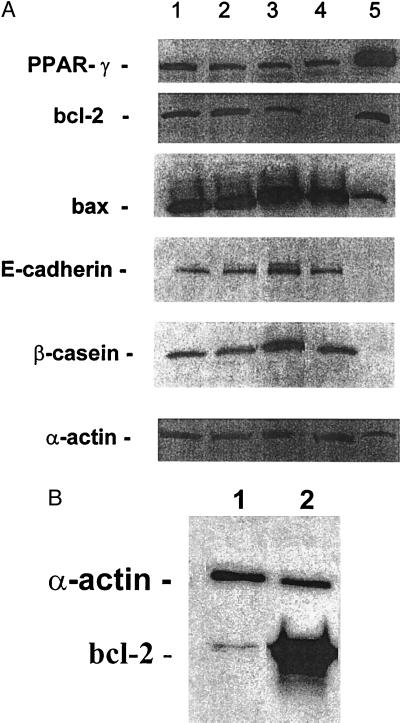
The same MCF7 cell cultures that were examined for apoptosis also were examined for apoptosis-related proteins. The TGZ did not change the level of bcl-2 protein (Fig. 5A) compared with untreated cells. ATRA decreased the level of bcl-2 to 44% of untreated cells (P < 0.01), and the combination of both ligands decreased bcl-2 protein to nearly undetectable levels (<5% of control cells) (Fig. 5A). In contrast, levels of bax after exposure of MCF7 cells to either TGZ alone or TGZ and ATRA changed little, and ATRA alone increased levels by ≈20% compared with untreated MCF7 cells (Fig. 5A). As compared with untreated cells, levels of PPARγ protein in MCF7 cells slightly decreased by culturing with either TGZ (83%), ATRA (48%), or a combination of ATRA and TGZ (66%).
Figure 5.
(A) Expression of PPARγ, bcl-2, bax, E-cadherin, and β-casein in MCF7 cells after their incubation with ligands for 4 days as measured by Western blot. Lane 1, control (vehicle alone); lane 2, TGZ (10−5 M); lane 3, ATRA (10−6 M); lane 4, TGZ (10−5 M) +ATRA (10−6 M); lane 5, human breast adipocytes (positive control). (B) Expression of bcl-2 protein in bcl-2 transfected MCF7 cells as measured by Western blot (20 μg of protein per lane).
Effect of NHR Ligands on bcl-2-Transfected MCF7 Cells.
Because the combination of TGZ and ATRA mediated both a profound decrease in bcl-2 levels and a marked increase in apoptosis, we hypothesized that the two events were linked. Therefore, the experiments were repeated in MCF7 cells transfected with bcl-2 expression vector. More than 70% of the bcl-2 transfected MCF7 cells over-expressed bcl-2 protein as measured by immunochistochemistry (data not shown), and bcl-2 protein expression was >10-fold higher in bcl-2 transfected MCF7 cells compared with MCF7 cells transfected with empty vector as measured by Western blot (Fig. 5B). The bcl-2-transfected MCF7 breast cancer cells no longer underwent apoptosis after exposure to TGZ and ATRA; under the same conditions, those transfected with empty vector did undergo apoptosis (Table 1).
Effect of NHR Ligands on Expression of Lipid and Differentiation Markers in MCF-7 Cells.
Untreated MCF7 cells were almost negative for lipid accumulation, as measured by staining with Oil-red O (Table 2), but these cells expressed the lipid metabolism-associated CD36 protein, as demonstrated by immunohistochemistry (Table 2) and flow cytometry (data not shown). After exposure of MCF7 cells to TGZ (10−5 M, 4 days), ≈87% MCF7 cells stained strongly for lipid (Table 2), and their expression of CD36 protein increased compared with untreated MCF7 cells (Table 2). Exposure to ATRA alone decreased CD36 expression without a change in lipid accumulation compared with untreated cells (Table 2). In contrast, the combination of both ATRA (10−6 M, 4 days) and TGZ (10−5 M, 4 days) dramatically decreased lipid accumulation and CD36 expression in MCF7 cells compared with TGZ-treated MCF7 cells (Table 2). Although TGZ induced lipid accumulation in MCF7 cells, these cells did not change their pattern of differentiation either to adipocytes as measured by expression of adipocyte-associated transcripts for C/EBPα, aP2, lipoprotein lipase, or adispin (data not shown), or to more differentiated breast cancer cells as measured by β-casein and E-cadherin (Fig. 5A).
Table 2.
Expression of lipid-related markers in MCF7 cells cultured with TGZ (10−5 M), ATRA (10−6 M), or combination of both for 4 days
| Ligands cells | Oil-red O positive cells, TIS units | CD36-positive, % |
|---|---|---|
| (−) | 4 ± 3 | 64 ± 12 |
| TGZ | 280 ± 11 | 90 ± 14 |
| ATRA | 2 ± 1 | 36 ± 8 |
| TGZ + ATRA | 42 ± 14 | 18 ± 7 |
TIS units defined in Materials and Methods. Results represent the mean ± SD of three experiments.
In Vitro Effect of NHR Ligands on Breast Adenocarcinoma Cells and Normal Breast Epithelial Cells from Patients.
Both normal and breast adenocarcinoma tissues from three patients cultured for 4 days with either TGZ (10−5 M) or ATRA (10−6 M) showed no changes either in morphology or apoptosis. However, the combination of both caused massive apoptosis (>80% of cells as measured by TUNEL) in each cancer sample but not in the accompanied normal breast epithelial cells (<10% apoptotic cells) (data not shown).
Antitumor Effect in Vivo.
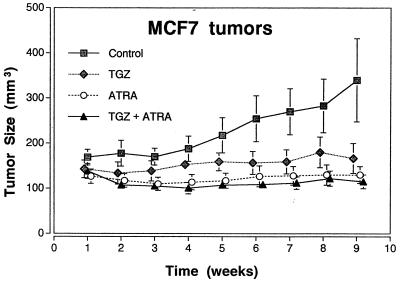
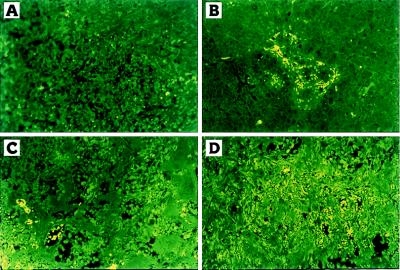
The TGZ visibly inhibited the tumor growth of MCF7 cells in triple-immunodeficient mice as measured by tumor size (P < 0.003) (Figs. 6) as well as tumor weights resected at autopsy (P < 0.006) (data not shown) compared with those of diluant-treated control animals. Combination of ATRA and TGZ or ATRA alone also significantly inhibited the size (P < 0.001) (Fig. 6) and weights (P < 0.001) (data not shown) of the tumors. Histological analysis of MCF7 tumors from untreated mice revealed poorly differentiated infiltrating adenocarcinomas (data not shown) almost without apoptotic changes (Fig. 7A). Mice treated with either troglitazone or ATRA showed some apoptosis as measured by morphology (data not shown) and TUNEL assay (Fig. 7 B and C). However, in mice treated with the combination of both troglitazone and ATRA, almost all of the MCF7 tumor cells were either apoptotic or necrotic as measured by morphology (data not shown) or by TUNEL assay (Fig. 7D), and extensive fibrosis of the tumors was observed (data not shown).
Figure 6.
Effect of TGZ and ATRA, either alone or in combination on the size of MCF7 tumors in BNX triple immunodeficient mice. Results represent the mean ± SD of 10 tumors.
Figure 7.
Apoptotic cells in MCF7 tumors in BNX triple immunodeficient mice as measured by TUNEL assay. control mice (A); treated with TGZ (B); ATRA (C); combination of both ligands (D).
No significant difference in either the mean weights, histology of internal organs, mean blood chemistries including liver parameters as well as hematopoietic parameters was found between diluant treated mice and those that received 9 weeks of treatment (data not shown), except for a decrease of the cholesterol level in the experimental groups that received both troglitazone and ATRA compared with the untreated mice (71 ± 21 mg/dl and 87 ± 13 mg/dl, respectively).
DISCUSSION
The PPARγ functions as an important regulator of lipid metabolism, and it is a key mediator of lipid storage (27–28). Our data show that human breast cancer cell lines and fresh breast adenocarcinomas express PPARγ protein, which is consistent with data from other groups (19–20). Furthermore, our histologic data indicated that, in contrast to breast cancer cells, the normal human breast epithelial cells lining the mammary ducts expressed a low level of PPARγ protein as seen in three individuals with breast cancer. Therefore, we hypothesized that prominent expression of PPARγ protein might be a marker for breast cancer cells; however, this hypothesis requires analysis of more normal and malignant breast tissues. In contrast to our data, another group (20) found strong positivity for PPARγ protein in the normal epithelial cells lining the mammary ducts from one patient. The explanation for these differences in results are unclear but may reflected distinct stages of normal mammary ducts (lactigenic or nonlactigenic period). The normal breast tissues of our patients were nonlactigenic.
Clonal growth of each of the breast cancer cell lines were inhibited by TGZ, a synthetic ligand of PPARγ. However, the rank order of their sensitivity to TGZ was not the same as their level of PPARγ protein expression. The BT474 cells, which expressed the highest level of PPARγ protein, were relatively insensitive to the inhibitory effect of TGZ. Our data are in agreement with those from another group which showed that a breast cancer cell line with a high level of PPARγ protein expression had a minor response to TGZ (20).
The ER-positive MCF7 cells were the most sensitive of the breast cancer cell lines to the reversible growth inhibitory action of TGZ; and these cells, after culture with TGZ, also had an increased accumulation of fat and an up-regulation of expression of CD36 protein, which is associated with active lipid metabolism and storage (20–30). However, these epithelial cancer cells did not cross-differentiate to adipocytes because TGZ did not induce either increased CCAAT-enhancer binding protein α expression (key transcriptional regulator of terminal adipocyte differentiation) or markers of terminal adipocyte differentiation (aP2, lipoprotein lipase, and adipsin). These data are in agreement with those from Mueller et al. 1998 (20). In addition, our data showed that TGZ alone had no significant effect on either the levels of either PPARγ protein, the level of apoptosis, or the induction of differentiation as measured by expression of β-casein and E-cadherin.
The RAR-specific ligand, ATRA reversibly inhibited clonal growth of MCF7 cells and decreased the expression of PPARγ and CD36 proteins. Our data are congruent with observations from another group that showed that a RAR-specific ligand inhibited fat metabolism by suppressing induction of PPARγ (22). Moreover, our studies showed that ATRA slightly increased expression of the apoptosis-related bax protein and decreased the bcl-2 protein level; however, it did not induce apoptosis of the MCF7 cells. In mark contrast, the combination of ATRA and TGZ in vitro irreversibly inhibited growth and induced prominent apoptosis of both MCF7 and fresh breast cancer cells but not normal breast epithelial cells. Also, additional ligands for PPARγ were examined: 15d-PGJ2 and indomethacin (31). Both reversibly suppressed proliferation of MCF7, and each in combination with ATRA caused an irreversible growth inhibition and mark apoptosis of MCF7 cells (Table 2). This effect was associated with a prominent decrease in the expression of bcl-2 and CD36 proteins, as well as a decrease of fat accumulation as compared with TGZ alone. Also, 9-cis-RA in combination with TGZ had the same effect as ATRA (data not shown). Interestingly, the combination of a RXR-specific ligand, LG10068 with TGZ did not caused either down-regulation of bcl-2 or apoptosis of MCF7 cells (data not shown), suggesting that activation of RAR may be essential for decreased level of bcl-2 protein and induction of apoptosis.
Forced over-expression of bcl-2 in MCF7 cells completely abolished cell death induced by the combination of a PPARγ ligand and ATRA, suggesting that their induction of apoptosis was linked to a decreased bcl-2 expression. Over-expression of bcl-2 inhibited cell death at confluence or in conditions of serum deprivation in breast cancer cells cultured with very low concentrations of fetal bovine serum (32). Also, alterations in activation of the ER regulate bcl-2 expression in MCF7 cells (33–34) and consequently apoptosis (35). Our data showed that the ER-negative (MDA-MB-231) (data not shown) as well as ER-positive (MCF7) breast cancer cell lines were growth inhibited by the combination of TGZ and ATRA. Therefore, their effects may be independent of estrogen and its receptor. On the other hand, recent data suggest that the PPARγ ligand antagonizes the activation of the AP-1-, nuclear regulatory factor-kappaβ, and the signal transducers and activators of transcription-pathways (36–37) in monocytic cells. Likewise, the AP-1 transcriptional factor can be inhibited by ATRA in MCF7 cells (38), and the blocking of AP-1 by ATRA may be responsible for the antitumor-promoting activity of ATRA (39). Data have shown that blocking of AP-1 activity can be associated with the induction of apoptosis in some types of cancer cells (40). Further studies are needed to examine the combined effect of TGZ and ATRA on the AP-1-, NFKβ-, and STAT-pathways.
Our in vivo data strongly supported our in vitro data. Histological analyses of MCF7 tumors from control mice showed typical breast adenocarcinoma. In contrast, treatment with TGZ plus ATRA markedly inhibited growth of MCF7 tumors associated with down-regulation of bcl-2 (data not shown), with striking apoptosis and fibrosis of these tumors. In fact, the residual mass was almost entirely fibrotic tissue. Mice receiving this combination did not change their weights and had no side effects as measured by extensive blood cell counts, serum chemistries including liver function tests as well as gross-autopsy and histological analyses of the major organs (data not shown). Taken together, the combination of ligands for PPARγ and RAR inhibited growth and induced apoptosis of breast cancer cells in vitro and in vivo; this combination may provide nontoxic and selective therapy for human breast cancers. The finding that over-expression of bcl-2 inhibited NHR ligands induced apoptosis, suggests a causal relationship between down-regulation of bcl-2 by ligands for PPARγ and RAR and subsequent apoptosis.
Acknowledgments
Supported by National Institutes of Health grants, Department of Defense, the Concern Foundation, and the Parker-Hughes Fund. H.P.K. holds the Mark Goodson Endowed Chair of Oncology Research and is a member of the Jonsson Cancer Center.
ABBREVIATIONS
- NHR
nuclear hormone receptor
- ATRA
all-trans-retinoic acid
- PPARγ
peroxisome proliferator-activated receptor γ
- TGZ
troglitazone
- RAR
RA receptor
- ER
estrogen receptor
- RXR
retinoic X receptors
- AP
alkaline phosphatase
- TUNEL
terminal deoxynucleotidyltransferase-mediated UTP end labeling
References
- 1.Warrell R P, Jr, Frankel S R, Miller W H, Jr, Scheinberg D A, Itri L M, Hittelman W N, Vyas R, Andreeff M, Tafuri A, Jakubowski A, et al. N Engl J Med. 1991;324:1385–1393. doi: 10.1056/NEJM199105163242002. [DOI] [PubMed] [Google Scholar]
- 2.Hong W K, Lippman S M, Itri L M, Karp D D, Lee J S, Byers R M, Schantz S P, Kramer A M, Lotan R, Peters L J, et al. N Engl J Med. 1990;323:795–801. doi: 10.1056/NEJM199009203231205. [DOI] [PubMed] [Google Scholar]
- 3.Lippman S M, Kavanagh J J, Paredes-Espinoza M, Delgadillo-Madrueno F, Paredes-Casillas P, Hong W K, Holdener E, Krakoff I. J Natl Cancer Inst. 1992;84:241–245. doi: 10.1093/jnci/84.4.241. [DOI] [PubMed] [Google Scholar]
- 4.Lippman S M, Parkinson D R, Itri L M, Weber R S, Schantz S P, Ota D M, Schusterman M A, Krakoff I H, Gutterman J U, Hong W K J. J Natl Cancer Inst. 1992;84:235–240. doi: 10.1093/jnci/84.4.235. [DOI] [PubMed] [Google Scholar]
- 5.Heyman R A, Mangelsdorf D J, Dyck J A, Stein R B, Eichele G, Evans R M, Thaller C. Cell. 1992;68:397–406. doi: 10.1016/0092-8674(92)90479-v. [DOI] [PubMed] [Google Scholar]
- 6.Levin A A, Sturzenbecker U, Kazmer S, Bosakowski T, Huselton C, Allenby G, Speck J, Kratzeisen C I, Rosenberger M, Lovey A, et al. Nature (London) 1992;35:359–361. doi: 10.1038/355359a0. [DOI] [PubMed] [Google Scholar]
- 7.Moon R C, Mehta R G, Rao K V N. In: The Retinoids: Biology, Chemistry, and Medicine. Sporn M B, Roberts A B, Goodman D S, editors. New York: Raven; 1994. pp. 573–595. [Google Scholar]
- 8.Marth C, Mayer I, Daxenbichler G. Biochem Pharmacol. 1984;33:2217–2221. doi: 10.1016/0006-2952(84)90657-9. [DOI] [PubMed] [Google Scholar]
- 9.Fontana J A, Miranda D, Mezu A B. Cancer Res. 1990;50:1977–1982. [PubMed] [Google Scholar]
- 10.van der Burg B, van der Leede B M, Kwakkenbos-Isbrücker L, Salverda S, de Laat S W, van der Saag P T. Mol Cell Endocrinol. 1993;91:149–157. doi: 10.1016/0303-7207(93)90267-n. [DOI] [PubMed] [Google Scholar]
- 11.Rubin M, Fenig E, Rosenauer A, Menendez-Botet C, Achkar C, Bentel J M, Yahalom J, Mendelsohn J, Miller W H., Jr Cancer Res. 1994;54:6549–6556. [PubMed] [Google Scholar]
- 12.Dawson M I, Chao W, Pine P, Jong L, Hobbs P D, Rudd C K, Quick T C, Niles R M, Zhang X, Lombardo A, et al. Cancer Res. 1995;55:4446–4451. [PubMed] [Google Scholar]
- 13.Fontana J A. Exp Cell Biol. 1987;55:136–144. doi: 10.1159/000163409. [DOI] [PubMed] [Google Scholar]
- 14.Chawla A, Schwarz E J, Dimaculangan D D, Lazar M A. Endocrinology. 1994;135:798–800. doi: 10.1210/endo.135.2.8033830. [DOI] [PubMed] [Google Scholar]
- 15.Tontonoz P, Singer S, Forman B, Sarraf P, Fletcher J, Fletcher C D M, Brun R P, Mueller E, Altiok S, Oppenheim H, et al. Proc Natl Acad Sci USA. 1997;94:237–241. doi: 10.1073/pnas.94.1.237. [DOI] [PMC free article] [PubMed] [Google Scholar]
- 16.Willett W C, Hunter D J, Stampfer M J, Colditz G, Manson J E, Spiegelman D, Rosner B, Hennekens C H, Speizer F E. J Am Med Assoc. 1992;268:2037–2044. [PubMed] [Google Scholar]
- 17.Lu J, Jiang C, Fontane S, Thompson H J. Nutr Cancer. 1995;23:283–290. doi: 10.1080/01635589509514382. [DOI] [PubMed] [Google Scholar]
- 18.Pizer E S, Jackisch C, Wood F D, Pasternack G R, Davidson N E, Kuhajda F P. Cancer Res. 1996;56:2745–2747. [PubMed] [Google Scholar]
- 19.Kilgore M W, Tate P L, Pai S, Sengoku E, Price T M. Mol Cell Endocrinol. 1997;129:229–235. doi: 10.1016/s0303-7207(97)04057-4. [DOI] [PubMed] [Google Scholar]
- 20.Mueller E, Sarraf P, Tontonoz, Evans R M, Martin K J, Zhang M, Fletcher C, Spiegelman B M. Mol Cell. 1998;1:465–470. doi: 10.1016/s1097-2765(00)80047-7. [DOI] [PubMed] [Google Scholar]
- 21.Tontonoz P, Graves R A, Budavari A L, Erdjument-Bromage H, Lui M, Hu E, Tempst P, Spiegelman B M. Nucleic Acids Res. 1994;22:5628–5634. doi: 10.1093/nar/22.25.5628. [DOI] [PMC free article] [PubMed] [Google Scholar]
- 22.Adachi H, Dawson M I, Jetten A M. Mol Cell Differ. 1996;4:365–381. [Google Scholar]
- 23.Elstner E, Linker-Israeli M, Le J, Grillier I, Said J, Shintaku P, Krajewski S, Reed J C, Binderup L, Koeffler H P. Cancer Res. 1996;55:2822–2830. [Google Scholar]
- 24.Elstner E, Linker-Israeli M, Umiel T, Le J, Said J W, Binderup L, Krajewski S, Reed J C, Koeffler H P. J Clin Invest. 1997;99:349–360. doi: 10.1172/JCI119164. [DOI] [PMC free article] [PubMed] [Google Scholar]
- 25.Lehmann J M, Moore L B, Smith-Oliver T A, Wilkison W O, Willson T M, Kliwer S A. J Biol Chem. 1995;270:12953–12956. doi: 10.1074/jbc.270.22.12953. [DOI] [PubMed] [Google Scholar]
- 26.Elstner E, Linker-Israeli M, Said J, Umiel T, de Vos S, Shintaku I P, Heber D, Binderup L, Uskokovic M, Koeffler H P. Cancer Res. 1995;55:2822–2830. [PubMed] [Google Scholar]
- 27.Spiegelman B M, Hu E, Kim J B, Brun R. Biochimie (Paris) 1997;79:111–112. doi: 10.1016/s0300-9084(97)81500-3. [DOI] [PubMed] [Google Scholar]
- 28.Schoonjans K, Martin G, Staels B, Auwerx J. Curr Opin Lipidol. 1997;8:159–166. doi: 10.1097/00041433-199706000-00006. [DOI] [PubMed] [Google Scholar]
- 29.Ibrahimi A, Sfeir Z, Magharaie H, Amri E Z, Grimaldi P, Abumrad N A. Proc Nat Acad Sci USA. 1996;93:2646–2651. doi: 10.1073/pnas.93.7.2646. [DOI] [PMC free article] [PubMed] [Google Scholar]
- 30.Greenwalt D E, Scheeck S H, Rhinehart-Jones T, Heart T. J Clin Invest. 1995;96:1382–1388. doi: 10.1172/JCI118173. [DOI] [PMC free article] [PubMed] [Google Scholar]
- 31.Lehman J M, Lenhard J M, Oliver B N, Ringold G M, Kliewer S A. J Biol Chem. 1997;272:3406–3410. doi: 10.1074/jbc.272.6.3406. [DOI] [PubMed] [Google Scholar]
- 32.Lu P J, Lu Q L, Rughetti A, Taylor-Papadimitriou J T. J Cell Biol. 1995;129:1363–1378. doi: 10.1083/jcb.129.5.1363. [DOI] [PMC free article] [PubMed] [Google Scholar]
- 33.Haldar S, Negrini M, Monne M, Sarbioni S, Croce C M. Cancer Res. 1994;54:2095–2097. [PubMed] [Google Scholar]
- 34.Wang T T Y, Phang J M. Cancer Res. 1995;55:2487–2489. [PubMed] [Google Scholar]
- 35.Kyprianou M, English H F, Davidson N E, Issacs J T. Cancer Res. 1991;51:162–166. [PubMed] [Google Scholar]
- 36.Ricote M, Li A C, Willson T M, Kelly C J, Glass C K. Nature (London) 1998;391:79–82. doi: 10.1038/34178. [DOI] [PubMed] [Google Scholar]
- 37.Jiang C, Ting A T, Seed B. Nature (London) 1998;391:82–86. doi: 10.1038/34184. [DOI] [PubMed] [Google Scholar]
- 38.van der Burg B, Slager-Davidov S, van der Leede B M, de Laat S W, van der Daag P T. Mol Cell Endocrinol. 1995;112:143–152. doi: 10.1016/0303-7207(95)03600-c. [DOI] [PubMed] [Google Scholar]
- 39.Li J J, Dong Z, Dawson M I, Colburn N H. Cancer Res. 1996;56:483–489. [PubMed] [Google Scholar]
- 40.Campbell, M. J., Park, S., Uskokovic, M. R., Dawson M. I., Jong, L. & Koeffler H. P. (1998) Br. J. Cancer, in press. [DOI] [PMC free article] [PubMed]


