Abstract
We previously reported the identification of mZac, a novel mouse zinc finger protein that shared with p53 the ability to regulate concomitantly apoptosis and cell cycle progression. We describe here the isolation, chromosomal localization, and functional in vitro characterization of its human homolog. hZAC is a widely expressed zinc finger protein that reveals transactivation and DNA-binding activity. hZAC inhibits tumor cell growth through induction of apoptotic cell death and G1 arrest. Thus hZAC, like its mouse counterpart, displays antiproliferative properties through pathways known to be central to the activity of p53. We mapped hZAC on chromosome 6q24-q25, a region frequently deleted in many solid tumors. Indeed, allelic loss at 6q24-q25 has been shown in breast and ovary cancers, melanomas, astrocytomas, and renal cell carcinomas. Furthermore, Abdollahi et al. [Abdollahi, A., Godwin, A. K., Miller, P. D., Getts, L. A., Schultz, D. C., Tagushi, T., Testa, J. R. & Hamilton, T. C. (1997) Cancer Res. 57, 2029–2034] recently isolated ZAC through its loss of expression in a surface epithelial ovary tumor model and accordingly named it Lot for “lost on transformation.” In view of these observations, the functional properties we report here provide further arguments to consider hZAC as a tumor suppressor gene candidate.
Cell proliferation is regulated through connected molecular pathways controlling cell division, differentiation, growth arrest, and apoptosis. A tight control of these events is necessary to the maintenance of homeostasis from development to senescence and involves multiple genes. Dysregulation of some of these genes can lead to pathological situations such as neurodegenerative disorders, immunodeficiency syndromes, and cancer (1). Early studies on tumor development focused on oncogenes, the genes whose gain of function leads to enhanced cell growth. The inactivation of a tumor suppressor gene (TSG), in contrast, can contribute to the growth deregulation of a tumor cell. This TSG inactivation can occur through a loss of function mutation accompanied by a loss of heterozygosity (2, 3), homozygous deletion (4, 5), or epigenetic mechanisms (6, 7). Many TSG have been identified, including genes such as RB, NF1, VHL, BRCA1, APC, p53, p16, the zinc finger (ZF) protein WT1, and many candidates (8). Several lines of evidence suggest a TSG function to a candidate gene: involvement in familial predisposition to cancer, inactivation in human tumors, tumor formation in null-mutant mice, and functional properties compatible with a role in cell proliferation or development. So far, only a few of the candidates fulfilled all of these criteria, e.g., p53, RB, p16, and VHL, and have been entitled to a role as TSG.
We previously have reported the isolation of mZac, a novel mouse gene (9). mZac encodes a protein with seven ZF of the C2H2 type that is only distantly related to previously isolated ZF proteins and that inhibits tumor cell proliferation in vitro and in vivo in nude mice. We showed that these antiproliferative properties ensued from the regulation of two pathways critical to the activity of p53, i.e., cell cycle progression and apoptosis (9, 10). mZac was thus the first gene unrelated to p53 that regulates these two fundamental genetic programs. We hypothesized that mZac also could share with p53 its tumor suppressor activity and isolated the human homolog of mZac to investigate its putative TSG function.
We demonstrate here that hZAC is a widely expressed ZF protein that shows transactivation and DNA-binding activity. Furthermore, like its mouse counterpart and p53, hZAC inhibits tumor cell proliferation through the induction of both apoptosis and cell cycle arrest. Interestingly, hZAC is localized on the long arm of chromosome 6, a region that frequently is deleted in cancer and that is thus thought to harbor at least one TSG.
MATERIALS AND METHODS
Isolation of hZAC cDNA.
Clones (1 × 10⁶) from a human pituitary gland cDNA library (CLONTECH) were screened with a random-primed probe corresponding to mZac full-length cDNA by using standard procedures. Forty positive clones were subcloned into pBlueScript and sorted by sequencing. One 2.3-kb clone contained the full coding sequence of hZAC (1,389 bp). A partial hZAC clone also was isolated from a human brain cDNA library.
Sequence alignments and phylogenetic trees were performed by using lasergene software (DNAstar, Madison, WI).
Fluorescence in Situ Hybridization (FISH) Analysis.
The 2.3-kb cDNA of hZAC, the 4.7-kb cDNA of mZac, and the 6-kb BglII fragment of mZac gene (unpublished observation) were used as probes, labeled by nick-translation with biotin-11-dUTP and hybridized to human and mouse chromosomes as previously described (11). Detection of hybridization was performed by using goat antibiotin antibodies (Vector Laboratories) and rabbit fluorescein isothiocyanate-conjugated anti-goat antibodies (Biosys, Compiègne, France). Direct banding of 5-bromodeoxyuridine-substituted chromosomes (12) stained with propidium iodide for human chromosomes and 4′,6-diamidino-2-phenylindole for mouse chromosomes was obtained. Metaphases were observed under a fluorescent microscope (DMRB, Leica, Germany). Images were captured by using a cooled photometrics charged-coupled device camera and Quips-smart capture software (Vysis).
DNA and RNA Analysis.
Human genomic DNA from peripheral blood lymphocytes (obtained from the Montpellier blood bank) and mouse genomic DNA from liver were prepared according to standard protocols. Southern blots of digested genomic DNAs first were hybridized with a mZac probe corresponding to mZac ZF and linker regions. After autoradiography, blots were stripped and reprobed with a hZAC probe corresponding to hZAC ZF and linker regions. hZAC mRNA distribution was determined by using a Human RNA Master Blot (CLONTECH) hybridized with a hZAC probe according to the manufacturer’s instructions. Because poly(A)+ RNA samples (80–400 ng) have been normalized to the mRNA expression levels of eight different housekeeping genes, the relative expression levels of hZAC mRNA could be assessed.
DNA-Binding Site.
The hZAC ZF region was amplified by PCR, and hemagglutinin (HA) epitope was tagged at the COOH terminus and cloned into pGEX-5X-3. Growth of transformed Escherichia coli cells and purification of glutathione S-transferase (GST)-hZAC-ZF were carried out as described (9).
For random oligonucleotide selection, a 78-base DNA oligonucleotide containing a central region of 18 random bases was used (13). Affinity selection of DNA sequences from this double-stranded oligonucleotide library was performed in the first round with the GST-fusion protein bound to glutathion beads followed by five sequential cycles of gel shift purification as described elsewhere (E.C. and A.H., unpublished work). After the final PCR, amplification products were cloned into pBluescript and sequenced. The sequence of the oligonucleotides studied in gel shifts was GTACTAAC-X-TTTAATCATC, where X is the decamer site to be tested.
Cell Culture and Transfection.
The human osteosarcoma cell line SaOs-2 was grown and electroporated as previously described (9).
Except for the GAL4 fusion proteins, all cDNAs were subcloned into the pRK5 vector (9), 5′ untranslated regions were excised, and a HA epitope tag was added at the N terminus. Every construct was sequenced.
Western blots were performed on total cell lysates (20 μg protein) by using anti-HA antibody (clone 12CA5, Boehringer Mannheim) and peroxydase-linked anti-mouse Ig (Amersham).
For immunocytochemistry, transfected cells were grown on glass coverslips, fixed, permeabilized, and incubated with the anti-HA antibody and then with an anti-mouse fluorescein isothiocyanate (Sigma).
For colony formation assay, we cotranfected pRK5-PUR containing the puromycin-resistance gene under the control of a cytomegalovirus promoter (0.2 μg) with either mZac (1 μg), hZAC (3.8 μg), or p53 (1 μg) in sense and antisense orientations into 2 million SaOs-2 cells. The cells from three transfections were pooled and split on different plates. After 9 days of puromycin treatment, the clones were MTT-stained and counted.
For transactivation experiments, the hZAC full-length coding sequence was fused to the GAL4 DNA-binding domain into pSG424 (14). Different amounts of this expression vector were transfected together with the reporter plasmid pE1BTATALUC (0.5 μg) (15). The cotransfected plasmid pCH110 encoding the β-galactosidase gene driven by the simian virus 40 promoter served to standardize luciferase values on transfection efficiency.
DNA Laddering.
Soluble DNA was prepared as previously described (16) and fractionated on a 1.2% agarose gel.
Flow Cytometry.
SaOs-2 cells were transiently transfected with different amounts of plasmid encoding mZac, hZAC, or p53, together with pRK5-CD20 encoding the CD20 antigen that was used as a marker for selection of the transfected cells. Twenty-four hours later, propidium-iodide staining was performed as previously described (17). Cell cycle distribution was determined with a FACScan flow cytometer (Beckton-Dickinson). Five-thousand events corresponding to the 5% CD20 most positive cells were analyzed by using modfit software (Verity Software House, Topsham, ME).
RESULTS
Isolation of hZAC.
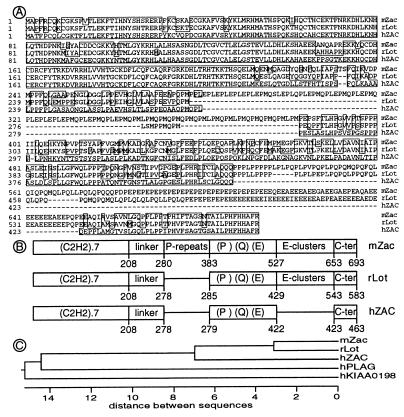
We isolated hZAC from human brain and pituitary cDNA libraries. The overall identity between hZAC and mZac coding sequences was 74.6% at the nucleotide level and 68.5% at the amino acid level. Several domains could be identified in hZAC, each having its counterpart in mZac (Fig. 1A and B). The seven (C2H2)-type ZF domain at the N terminus was the most conserved (84.2% similarity at the amino acid level). The linker region, the Pro, Gln, and Glu-rich region and the C terminus (Fig. 1B) were rather conserved (54%, 58%, and 63% identity, respectively). The last 11 C terminal residues were identical (Fig. 1A). There were two major differences between the mouse and human sequences. Indeed, two regions of mZac were missing in hZAC: a 34 Pro-repeats (PLE, PMQ, or PML) domain and a Glu-clusters domain (Fig. 1 A and B).
Figure 1.
Sequences of the ZAC/LOT family. (A) Sequence alignments of the ZAC/LOT proteins. Human ZAC (hZAC, identical to hLOT1), mouse Zac (mZac), and rat Lot1 (rLot) were aligned according to a Clustal method. Residues that matched hZAC with one distance unit are boxed. (B) Schematic representation of the ZAC/LOT proteins structures. Each domain is indicated as a box: the seven ZF of C2H2 type, the linker region, the Pro repeats present in mZac only, the Pro, Gln and Glu rich region, the Glu clusters absent in hZAC, and the C terminus. The numbering of the amino acid residues is indicated below the boxes. (C) Phylogenetic tree for ZAC/LOT family. Only the ZF domains were taken into account for the analysis.
A fasta analysis for homology search in the UniGene database (05/11/98, ref. 18) indicated that hZAC sequence matched 62 human expressed sequence tags derived from various adult sources, including placenta, aorta, ovary, prostate, heart, as well as fetal tissues including heart, brain, cochlea, liver, and spleen. During the course of this study, a rat and a human sequences designated LOT1 (GenBank accession nos. U72620 and U72621) were reported (19, 20) and displayed significant homology to hZAC. Indeed, hZAC and hLOT1 were identical except one residue (Leu81 in hZAC and rLot1 is a Phe in hLOT1). Surprisingly, the 5′-untranslated regions of hLOT1 and hZAC were completely different 189 nucleotides upstream of the ATG (not shown). One explanation for this discrepancy is that hZAC or hLOT1 5′ ends could correspond to two different splice variants or either one could contain an unspliced intron. The second hypothesis was favored as a putative 3′ splicing site (CACAG) was present 190 nucleotides 5′ of the ATG in hLOT1. Furthermore, an intron is also present at that position in the mouse gene (unpublished data).
Because large domains of mZac were missing in hZAC, we evaluated the existence of additional genes closely related to mZac, which could contain these domains. We performed extensive PCR analysis of human genomic DNA with degenerate primers, corresponding to residues conserved between hZAC and mZac in the ZF domain and the Pro- and Gln-rich region (not shown). We isolated only two classes of PCR fragments different from ZAC but suggestive of closely related genes. During the course of this study, sequences of the corresponding cDNAs became available in the UniGene database. One class of PCR fragments corresponded to hPLAG1, an embryonic gene that could be involved in the pathogenesis of pleiomorphic adenomas (21, 22). The second class of PCR fragments corresponded to KIAA0198, a cDNA cloned from the human cell line KG-1, whose function is still unknown (23). Multiple sequence alignment revealed that these cDNAs are members of the same family of ZF proteins (Fig. 1C).
Chromosomal Localizations and Southern Blots of Genomic DNAs.
As mZac and hZAC primary structures were for some part divergent, we attempted to show that these cDNAs were nonetheless derived from orthologous genes.
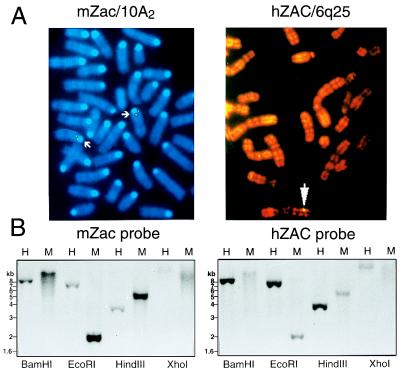
We first performed chromosomal localization of both genes by FISH. The hZAC cDNA probe revealed recurrent single and double spots on human chromosome 6 (band 6q25); of 30 metaphases, 70% exhibited at least one spot in this position (Fig. 2A). cDNA and genomic mZac probes exhibited recurrent spots on mouse chromosome 10 (band 10A2); of 25 metaphases, 50% showed recurrent simple and double spots in this position with the cDNA probe and 60% with the genomic probe, with low background (Fig. 2A). The mouse genomic probe revealed recurrent single spots on human chromosome 6 band 6q25 with the rate of 20% with low background (not shown). Because mouse 10A2 and human 6q25 loci are syntenic (24) and the mouse probe displayed the same spots as the human probe on human 6q25, mZac and hZAC were either orthologs or related genes clustered in syntenic regions.
Figure 2.
Localizations of hZAC and mZac genes. (A) Chromosomal localizations. FISH with hZAC probe revealed spots on human chromosome 6 band 6q25; FISH with mZac probe revealed spots on mouse chromosome 10 band 10A2. (B) Southern blots of human and mouse genomic DNA. Human (H) and mouse (M) genomic DNAs were digested with the indicated restriction enzymes, fractionated on a 1% agarose gel, and blotted. The blot was first probed with a radioactive mZac fragment and autoradiographed. Then, the membrane was stripped, and the blot was rehybridized with a hZAC probe and autoradiographed. The same data were obtained with another set of enzymes including NcoI, SacII, SacI, and PstI (not shown).
To further confirm mZac and hZAC were orthologs, we carried out Southern blots of digested human and mouse genomic DNAs. Probes derived from the ZF domains of mZac and hZAC hybridized to bands of exactly the same size in both human and mouse DNA (Fig. 2B), indicating that both mZac and hZAC probes recognized only one gene in both species.
hZAC Expression in Human Tissues.
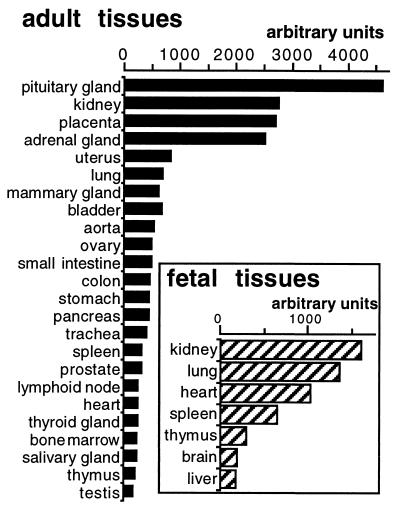
hZAC mRNA distribution was determined by using a human RNA blot. hZAC was widely expressed in both adult and fetal tissues (Fig. 3). The strongest levels of expression were observed in the pituitary gland, kidney, placenta, and adrenal gland. Uterus, mammary gland, ovary, lung, gastrointestinal tract, and lymphoid tissues also revealed strong hybridization signals. Skeletal muscle, peripheral leucocytes, liver, whole brain, and spinal cord weakly expressed hZAC. In adult brain, the strongest signals were observed in the occipital lobe, cerebral cortex, and thalamus (see legend of Fig. 3).
Figure 3.
Human tissue distribution of hZAC. A human RNA blot was hybridized with a hZAC probe and the signal intensity for each dot was measured by using a storage phosphor imaging system (Bio-Rad). In addition, hZAC was weakly expressed in adult peripheric leucocytes, spinal cord, liver, skeletal muscle, and whole brain (less than 150 units). hZAC was expressed in different brain areas: mainly in the occipital lobe, thalamus, and cerebral cortex (100–150 units), in other areas (amygdala, caudate, cerebellum, frontal lobe, hippocampus, medulla oblongata, putamen, substantia nigra, temporal lobe, and subthalamic nuclei) the signals were very weak (<100 units).
hZAC Intracellular Localization, Transactivation, and DNA Binding.
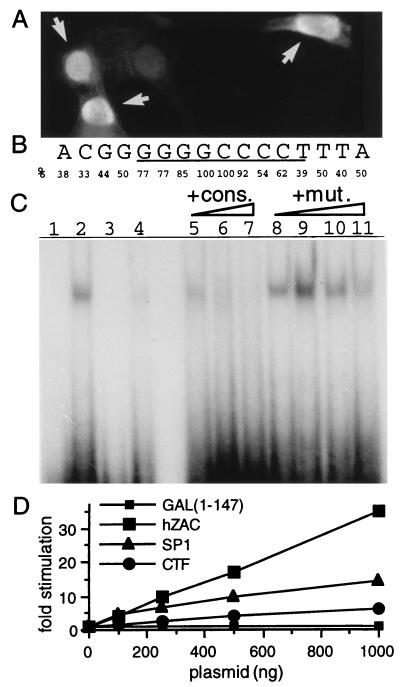
We determined the intracellular localization of hZAC by immunocytochemistry. The nuclei of SaOs-2 cells expressing hZAC were strongly labeled (Fig. 4A). We did not detect any signal in mock-transfected or nonpermeabilized cells (not shown).
Figure 4.
hZAC intracellular localization, DNA binding, and transactivation. (A) Nuclear localization of hZAC. Immunocytochemistry of SaOs-2 cells transfected with HA-tagged-hZAC (1 μg plasmid) was performed by using an anti-HA antibody and a fluorescein isothiocyanate-conjugated secondary antibody. As cells were transiently transfected, positive transfected cells (indicated with an arrow) as well as negative nontransfected cells were present on the same sample. (B) Consensus nucleotide sequence for hZAC DNA-binding site. This consensus is derived from the alignment of 13 oligonucleotides selected after screening of a random oligonucleotide library. The frequency of the specific base(s) at each position is indicated. (C) Sequence-specific DNA-binding of GST-hZAC-ZF. An electrophoretic mobility-shift assay was performed. GST-hZAC-ZF (100 ng) was allowed to bind to 40,000 cpm of 32P-labeled double-stranded oligonucleotide containing the consensus binding sequence (GGGGGGCCCC; lane 2) or a mutated sequence where the two most conserved bases at the center of the consensus have been mutated (indicated in bold: GGGGGCGCCC; lane 4). Lanes 1 and 3 represent the control electromobilities of both oligonucleotides in the absence of GST-hZAC-ZF. For competition experiments, GST-hZAC-ZF was preincubated with the indicated competitors: consensus (cons.) or mutated consensus (mut.) oligonucleotide and then allowed to bind to the radio-labeled consensus site. Each competitor was added in molar excess of 1-, 10-,100-, and 1,000-fold in lanes 5 and 8, 6 and 9, 7 and 10, and 11, respectively. (D) Transactivation by hZAC. SaOs-2 cells were transfected with plasmids encoding a fusion protein between the GAL4 DNA-binding domain and either hZAC or the transactivation domains of SP1 or CAAT-box binding transcription factor, together with a luciferase reporter gene under the control of a GAL4 sensitive minimal promoter. Luciferase activity for each condition is indicated as a fold stimulation over basal.
We attempted to demonstrate that hZAC is a DNA-binding protein by using a random oligonucleotide selection assay. After screening a random oligonucleotide library, 24 clones were sequenced, of which 13 could be aligned with the consensus motif depicted in Fig. 4B. An oligonucleotide with the consensus sequence then was synthetized and tested in an electrophoretic mobility shift assay. As shown in Fig. 4C, the hZAC ZF domain (GST-hZAC-ZF) was able to shift the oligonucleotide corresponding to the consensus. Conversely, a mutant oligonucleotide harboring a double mutation at the center of the consensus was only very weakly shifted. In competition experiments, preincubation of GST-hZAC-ZF with increasing concentrations of the nonlabeled consensus oligonucleotide greatly inhibited the shift of the consensus oligonucleotide. In contrast, preincubation with the mutant oligonucleotide did not (Fig. 4C).
We then asked whether hZAC was capable of transactivation activity like many ZF proteins and p53. To this purpose, we measured the transcriptional activation of the luciferase reporter gene, driven by a minimal promoter sensitive to the yeast transcription factor GAL4, after transfection of plasmids encoding hZAC fused to the GAL4 DNA-binding domain. Transfection of increasing amounts of the fusion constructs containing hZAC induced a stepwise increase of the luciferase activity (Fig. 4D). The GAL4 DNA-binding domain (GAL1–147) alone was devoid of any transactivation activity (Fig. 4D). Fusions of the GAL4 DNA-binding domain with the well characterized transactivation domains of the transcription factors SP1 and CTF (15) served as positive controls (Fig. 4D).
In conclusion, hZAC is a nuclear protein displaying transcriptional activity and DNA binding, indicative of a likely role as a transcription factor.
Expression of hZAC Inhibited the Growth of Tumor Cells.
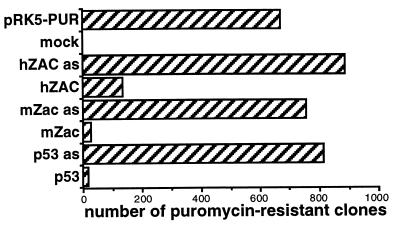
Twenty-four hours after transfection of hZAC, we observed a reduced number of cells, compared with mock transfected cells (data not shown). Furthermore, after hZAC transfection, a substantial number of cells displayed signs of lost viability such as cellular shrinkage, blebbing, and condensed chromatin (not shown), as it was previously noted for p53 and mZac (9, 25). We then tested whether hZAC had the same antiproliferative properties as its mouse counterpart. To evaluate the effect of long-term expression of hZAC on tumor cell proliferation, we carried out a colony formation assay. mZac or p53 strongly decreased the number of puromycin-resistant colonies (Fig. 5), whereas the antisense constructs had no effect. hZAC also inhibited cell growth although less strongly (Fig. 5). When either hZAC, mZac, or p53 was expressed, the puromycin-resistant clones were smaller than in the control experiments (not shown).
Figure 5.
hZAC inhibits colony formation. SaOs-2 cells were transfected with the plasmid encoding the puromycin resistance alone (pRK5-PUR), or together with plasmids encoding hZAC, mZac, and p53 in their sense and antisense (as) orientations. After puromycin selection, the resistant colonies were counted. This experiment is representative of three independent experiments.
hZAC Expression Induced a G1 Arrest.
mZac, like p53, inhibits tumor cell growth through induction of apoptosis and cell cycle arrest (9). We asked whether hZAC retrieved the same mechanisms for the control of cell proliferation. Accordingly, we first investigated the cell cycle progression of SaOs-2 cells on transient expression of hZAC.
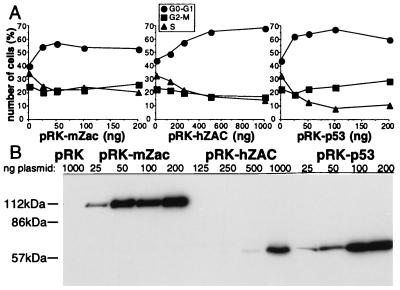
hZAC induced a G1 arrest with an increased proportion of cells in G0-G1 and a decreased proportion of cells in S and G2-M (Fig. 6A). mZac induced a G1 block (Fig. 6A). p53-transiently transfected SaOs-2 cells were strongly arrested in G1 (Fig. 6A) as previously reported at this time point (26).
Figure 6.
hZAC induces a G1 arrest. (A) Cell cycle distribution. SaOs-2 cells were cotransfected with pRK5 encoding CD20 and different amounts of pRK5 encoding either mZac, hZAC, or p53. CD20 positive and propidium iodide-stained cells were analyzed by flow cytometry to measure DNA content. This experiment is representative of three independent experiments. (B) Western blots. SaOs-2 cells were transfected with different amounts of pRK5 encoding mZac, hZAC, or p53, as indicated. Western blot of total cell lysates was performed with anti-HA antibody.
mZac, hZAC, and p53 expression levels were evaluated by Western blots performed with the same anti-HA antibody. p53 and mZac reached comparable high levels of expression (Fig. 6B). Transfection of higher amounts of plasmid was required to detect hZAC (Fig. 6B). However, even nondetectable levels of hZAC could induce a G1 arrest (see pRK-hZAC 125 and 250 ng, Fig. 6 A and B).
hZAC Expression Induced Apoptosis.
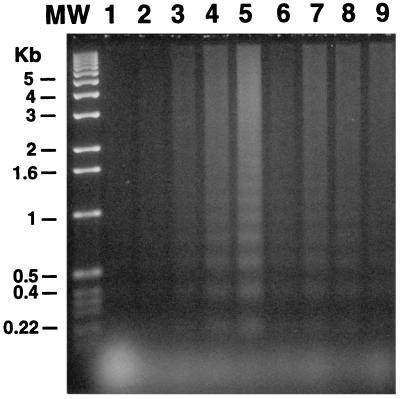
We investigated apoptosis by measuring genomic DNA laddering. Mock (Fig. 7, lane 1) or control (pRK5-CAT) transfected cells (Fig. 7, lane 2) did not show any sign of apoptosis. mZac (Fig. 7, lanes 3–5) and p53 (Fig. 7, lane 9) induced apoptosis as previously described (9, 25). hZAC expression also induced apoptosis of SaOs-2 transfected cells (Fig. 7, lanes 6–8).
Figure 7.
hZAC induces apoptotic cell death. DNA laddering. SaOs-2 cells were transfected with different quantities of vector pRK5 plasmid (1,500 ng, lane 1) or encoding chloramphenicol acetyltransferase (1,500 ng, lane 2), mZac (50, 150, and 500 ng, for lanes 3–5, respectively), hZAC (500, 1,000, and 1,500 ng, for lanes 6–8, respectively), or p53 (100 ng, lane 9). This experiment is representative of three independent experiments.
DISCUSSION
We previously reported the isolation of mZac, a novel mouse gene with antiproliferative properties, which is the only gene so far unrelated to p53 able to control both apoptosis and cell cycle progression (9). In view of these properties, we hypothetized that mZac fullfiled the role of a TSG. To further address this issue, we isolated its human homolog and determined its functional properties.
We cloned hZAC from a pituitary and a brain library. Despite clear differences in mZac and hZAC primary structures (see below), we showed that both genes were indeed orthologs as indicated by Southern blot experiments and their mapping on syntenic regions, i.e., human 6q25 and mouse 10A2.
During the course of this study, the cloning of rat Lot1 and of its presumed human ortholog, hLOT1, identical to hZAC, was reported (19, 20) (see below). The products of the mouse and human genes we cloned were more divergent than what could be expected for orthologs. Indeed, two domains of mZac were absent in hZAC: the Pro repeats (also missing in the rat sequence) and the Glu clusters (present in the rat sequence). These differences could not be explained by an alternative splicing because there is no intron in the mouse gene at the expected positions (data not shown). Furthermore, we failed to detect the Pro repeats in human genomic DNA, and the Glu clusters were not detected (20). Hence we can conclude that evolutionary selection either eliminated these sequences in the human or added these sequences in the mouse genome.
Looking for other genes related to ZAC, we identified two partial cDNAs, whose full length or uncomplete sequences have been recently published: hPLAG1 and hKIAA0198. Together with ZAC, they now define a family of proteins with ZF of the C2H2 type, possibly involved in tumorigenesis: PLAG1 is a putative oncogene that supposedly contributes to pleimorphic adenomas (21, 22), ZAC is a tumor suppressor candidate (see below), and the function of KIAA0198 is still unknown (23).
We characterized hZAC’s in vitro functional properties. First, we have shown that hZAC is a nuclear ZF protein that reveals transactivation and DNA-binding activity; these data are compatible with a transcription factor function. A GC-rich specific ZAC DNA-binding site was identified. GC-rich DNA-binding sites are common among ZF proteins, especially within the Krüppel family, to which ZAC family is the most related (27, 28).
As mZac and hZAC primary structures were more divergent than usually expected for orthologs, we addressed whether both proteins share related antiproliferative properties. Importantly, like mZac and p53, hZAC was also able to inhibit tumor cell growth through induction of both apoptosis and G1 arrest. Consequently, hZAC regulates both pathways known to be central to the activity of the TSG p53 (10).
We have localized hZAC on chromosome 6 band 6q25 by FISH. These data confirmed the FISH mapping of hLOT1, which was recently published (20). According to the human genome map (29, 30), hLOT1 (hZAC) was located between markers D6S308 and D6S978 at 6q24. Chromosome 6 is the fourth most frequently rearranged chromosome in human tumors (31). Allelic loss at 6q24 has been reported in B-cell non-Hodgkin’s lymphomas (32) and many solid tumors such as gastric carcinomas (33), pancreatic adenocarcinomas (34), renal cell carcinomas (35), astrocytomas (36), melanomas (37), ovarian carciomas (38), and breast cancers (39–41). Moreover, a frequently deleted region at 6q24 defined by D6S292-D6S310-D6S311 around the hZAC locus has been identified in breast carcinomas (40).
Our data have been strengthened by a study recently published by Abdollahi et al. (19) who cloned Zac through its loss of expression in a rat model of epithelial ovary cancer and thus named it Lot1 for “lost on transformation.” They further isolated a human cDNA, identical to hZAC, which they called hLOT1, and showed that hLOT1 (hZAC) expression was also lost in some human ovary cancer cell lines (20).
In conclusion, we have characterized the in vitro antiproliferative activity of hZAC, a widely expressed ZF protein with properties compatible with a transcription factor function. hZAC is the only human gene so far unrelated to p53 able to regulate both apoptosis and cell cycle progression. Because these pathways are known to be central to the activity of the TSG p53 (10) and hZAC maps to 6q24-q25, a chromosomal region frequently lost in human tumors, we propose that hZAC is a TSG candidate.
Acknowledgments
We are thankful to C. Duperray for assistance with the flow cytometry experiments, V. Homburger for help with the fluorescence microscope, L. Charvet for the photographs, J. P. Pin for reading the manuscript, J. La Baer for the gift of the plasmid encoding CD20, D. Bentley for pGAL4SP1 and pGAL4CTF, and Peter J. Flor for the gift of the human brain library. B.B. is a recipient of the Ministère de l’Education Nationale et de la Recherche. D.S. was supported by Grant Sp 386/3-1 from the Deutsche Forschungsgemeinschaft. This work was supported by Grant ACC-SV4/9504087 from the Ministère de l’Education Nationale et de la Recherche, grants from the Centre Nationale de la Recherche Scientifique, La Ligue Nationale contre le Cancer, and L’Association pour la Recherche contre le Cancer.
Footnotes
This paper was submitted directly (Track II) to the Proceedings Office.
Abbreviations: ZF, zinc finger; FISH, fluorescent in situ hybridization; TSG, tumor suppressor gene; GST, glutathione S-transferase; HA, hemagglutinin.
Data deposition: The sequence reported in this paper has been deposited in the GenBank database (accession no. AJ006354).
References
- 1.Hartwell L H, Kastan M B. Science. 1994;266:1821–1828. doi: 10.1126/science.7997877. [DOI] [PubMed] [Google Scholar]
- 2.Hussussian C J, Struewing J P, Goldstein A M, Higgins P A, Ally D S, Sheahan M D, Clark W H J, Tucker M A, Dracopoli N C. Nat Genet. 1994;8:15–21. doi: 10.1038/ng0994-15. [DOI] [PubMed] [Google Scholar]
- 3.Chandrasekharappa S C, Guru S C, Manickam P, Olufemi S E, Collins F S, Emmert-Buck M R, Debelenko L V, Zhuang Z, Lubensky I A, Liotta L A, et al. Science. 1997;276:404–407. doi: 10.1126/science.276.5311.404. [DOI] [PubMed] [Google Scholar]
- 4.Faienza M F, della Ragione F, Basso G, Coppola B, Miraglia del Giudice E, Schettini F, Iolascon A. Br J Haematol. 1996;93:632–636. doi: 10.1046/j.1365-2141.1996.d01-1674.x. [DOI] [PubMed] [Google Scholar]
- 5.Mollenhauer J, Wiemann S, Scheurlen W, Korn B, Hayashi Y, Wilgenbus K K, von Deimling A, Poutska A. Nat Genet. 1997;17:32–39. doi: 10.1038/ng0997-32. [DOI] [PubMed] [Google Scholar]
- 6.Herman J G, Latif F, Weng Y, Lerman M I, Zbar B, Liu S, Samid D, Duan D S R, Gnarra J R, Linehan W M, Baylin S B. Proc Natl Acad Sci USA. 1994;91:9700–9704. doi: 10.1073/pnas.91.21.9700. [DOI] [PMC free article] [PubMed] [Google Scholar]
- 7.Merlo A, Herman J G, Mao L, Lee D J, Gabrielson E, Burger P C, Baylin S B, Sidransky D. Nat Med. 1995;1:686–692. doi: 10.1038/nm0795-686. [DOI] [PubMed] [Google Scholar]
- 8.Brown M A, Solomon E. Trends Genet. 1997;13:202–206. doi: 10.1016/s0168-9525(97)01132-3. [DOI] [PubMed] [Google Scholar]
- 9.Spengler D, Villalba M, Hoffmann A, Pantaloni C, Houssami S, Bockaert J, Journot L. EMBO J. 1997;16:2814–2825. doi: 10.1093/emboj/16.10.2814. [DOI] [PMC free article] [PubMed] [Google Scholar]
- 10.Bates S, Vousden K H. Curr Opin Genet Dev. 1996;6:12–19. doi: 10.1016/s0959-437x(96)90004-0. [DOI] [PubMed] [Google Scholar]
- 11.Eychène A, Vianney Barnier J, Apiou F, Dutrillaux B, Calothy G. Oncogene. 1992;7:1657–1660. [PubMed] [Google Scholar]
- 12.Lemieux N, Dutrillaux B, Viegas-Péquignot E. Cytogenet Cell Genet. 1992;59:311–312. doi: 10.1159/000133277. [DOI] [PubMed] [Google Scholar]
- 13.Zweidler-McKay P A, Grimes H L, Flubacher M M, Tsichlis P N. Mol Cell Biol. 1996;16:4024–4034. doi: 10.1128/mcb.16.8.4024. [DOI] [PMC free article] [PubMed] [Google Scholar]
- 14.Sadowski I, Ptashne M. Nucleic Acids Res. 1989;17:7539. doi: 10.1093/nar/17.18.7539. [DOI] [PMC free article] [PubMed] [Google Scholar]
- 15.Blau J, Xiao H, McCracken S, O’Hare P, Greenblatt J, Bentley D. Mol Cell Biol. 1996;16:2044–2052. doi: 10.1128/mcb.16.5.2044. [DOI] [PMC free article] [PubMed] [Google Scholar]
- 16.Hockenberry D, Nuñez G, Milliman C, Schreiber R D, Korsmeyer S J. Nature (London) 1990;348:334–336. doi: 10.1038/348334a0. [DOI] [PubMed] [Google Scholar]
- 17.Brons P P T, Pennings A H M, Haanen C, Wessels H M C, Boezeman J B M. Cytometry. 1990;11:837–844. doi: 10.1002/cyto.990110710. [DOI] [PubMed] [Google Scholar]
- 18.Pearson W R, Lipman D J. Proc Natl Acad Sci USA. 1988;85:2444–2448. doi: 10.1073/pnas.85.8.2444. [DOI] [PMC free article] [PubMed] [Google Scholar]
- 19.Abdollahi A, Godwin A K, Miller P D, Getts L A, Schultz D C, Tagushi T, Testa J R, Hamilton T C. Cancer Res. 1997;57:2029–2034. [PubMed] [Google Scholar]
- 20.Abdollahi A, Roberts D, Godwin A K, Schultz D C, Sonoda G, Testa J R, Hamilton T C. Oncogene. 1997;14:1973–1979. doi: 10.1038/sj.onc.1201034. [DOI] [PubMed] [Google Scholar]
- 21.Voz M L, Astrom A K, Kas K, Mark J, Stenman G, Van de Ven W J M. Oncogene. 1998;16:1409–1406. doi: 10.1038/sj.onc.1201660. [DOI] [PubMed] [Google Scholar]
- 22.Kas K V, M L, Röijer E, Aström A K, Meyen E, Stenman G, Van de Ven W J M. Nat Genet. 1997;15:170–174. doi: 10.1038/ng0297-170. [DOI] [PubMed] [Google Scholar]
- 23.Nagase T, Seki N, Ishikawa K, Tanaka A, Nomura N. DNA Res. 1996;3:17–24. doi: 10.1093/dnares/3.1.17. [DOI] [PubMed] [Google Scholar]
- 24.Copeland N G, Jenkins N, Gilbert D J, Eppig J T, Maltais L J, Miller J C, Dietrich W F, Weaver A, Lincoln S E, Steen R G, et al. Science. 1993;262:57–66. doi: 10.1126/science.8211130. [DOI] [PubMed] [Google Scholar]
- 25.Yonish-Rouach E, Resnitzky D, Lotem J, Sachs L, Kimchi A, Oren M. Nature (London) 1991;352:345–347. doi: 10.1038/352345a0. [DOI] [PubMed] [Google Scholar]
- 26.Chen X, Ko L J, Prives C. Genes Dev. 1996;10:2438–2451. doi: 10.1101/gad.10.19.2438. [DOI] [PubMed] [Google Scholar]
- 27.Christy B, Nathans D. Proc Natl Acad Sci USA. 1989;86:8737–8741. doi: 10.1073/pnas.86.22.8737. [DOI] [PMC free article] [PubMed] [Google Scholar]
- 28.Swirnoff A H, Milbrandt J. Mol Cell Biol. 1995;15:2275–2287. doi: 10.1128/mcb.15.4.2275. [DOI] [PMC free article] [PubMed] [Google Scholar]
- 29.Dib C, Faure S, Fizames C, Samsom D, Drouot N, Vignal A, Millasseau P, Marc S, Hazan J, Seboun E, et al. Nature (London) 1996;380:152–154. doi: 10.1038/380152a0. [DOI] [PubMed] [Google Scholar]
- 30.Schuler G D, Boguski M S, Stewart E A, Stein C D, Gyapay G, Rice K, White R E, Rodriguez-Tomé P, Aggarwal A, Bajorek E, et al. Science. 1996;274:540–546. [PubMed] [Google Scholar]
- 31.Teyssier J R, Ferre D. Anticancer Res. 1992;12:997–1004. [PubMed] [Google Scholar]
- 32.Zhang Y, Weber-Matthiesen K, Siebert R, Matthiesen P, Sclegelberger B. Genes Chromosomes Cancer. 1997;18:310–313. doi: 10.1002/(sici)1098-2264(199704)18:4<310::aid-gcc10>3.0.co;2-k. [DOI] [PubMed] [Google Scholar]
- 33.Queimado L, Seruca R, Costa-Pereira A, Castedo S. Genes Chromosomes Cancer. 1995;14:28–34. doi: 10.1002/gcc.2870140106. [DOI] [PubMed] [Google Scholar]
- 34.Griffin C A, Hruban R H, Morsberger L A, Ellingham T, Long P P, Jaffee E M, Hauda K M, Bohlander S K, Yeo C J. Cancer Res. 1995;55:2394–2399. [PubMed] [Google Scholar]
- 35.Thrash-Bingham C A, Greenberg R E, Howard S, Bruzel A, Bremer M, Goll A, Salazar H, Freed J J, Tardof K D. Proc Natl Acad Sci USA. 1995;92:2854–2858. doi: 10.1073/pnas.92.7.2854. [DOI] [PMC free article] [PubMed] [Google Scholar]
- 36.Liang B C, Ross D A, Greenberg H S, Meltzer P S, Trent J M. Neurology. 1994;44:533–536. doi: 10.1212/wnl.44.3_part_1.533. [DOI] [PubMed] [Google Scholar]
- 37.Walker G J, Palmer J M, Walters M K, Nancarrow D J, Parsons P G, Haward N K. Int J Cancer. 1994;58:203–206. doi: 10.1002/ijc.2910580210. [DOI] [PubMed] [Google Scholar]
- 38.Foulkes W D, Ragoussis J, Stamp G W H, Allan G J, Trowsdale A J. Br J Cancer. 1993;67:551–559. doi: 10.1038/bjc.1993.101. [DOI] [PMC free article] [PubMed] [Google Scholar]
- 39.Fujii H, Zhou W, Gabrielson E. Genes, Chromosomes Cancer. 1996;16:35–39. doi: 10.1002/(SICI)1098-2264(199605)16:1<35::AID-GCC5>3.0.CO;2-4. [DOI] [PubMed] [Google Scholar]
- 40.Noviello C, Courjal F, Theillet C. Clin Cancer Res. 1996;2:1601–1606. [PubMed] [Google Scholar]
- 41.Theile M, Seitz S, Arnold W, Jandrig B, Frege R, Schlag P M, Haensch W, Guski H, Winzer K J, Barrett J C, Scherneck S. Oncogene. 1996;13:677–685. [PubMed] [Google Scholar]


