

Abstract
Background
Skeletal muscle dysfunction is a common feature in chronic obstructive pulmonary disease (COPD) which is associated with intrinsic muscular abnormalities. One of the most consistently reported alterations is a shift from fibre type I to II in the vastus lateralis of these patients. Surprisingly, the relationship between this shift and the severity and phenotype of COPD remains unclear. A study was conducted to determine whether vastus lateralis muscle fibre type proportions are associated with COPD disease severity and to provide reference values for the proportions of fibre types in the vastus lateralis in COPD.
Methods
A systematic review and a meta‐analysis were conducted in which muscle fibre type data and markers of disease severity were collected from the literature.
Results
The forced expiratory volume in 1 s (FEV1), the ratio of FEV1 to forced vital capacity (FVC) and body mass index were positively associated with the proportion of type I fibres in COPD. A proportion of 51% for vastus lateralis fibre type I and 13% for fibre type IIX were calculated from the combined data as normal values for patients with typical GOLD stage 3–4 COPD aged 60–70 years. Based on these reference values, a proportion of fibre type I <27% and of fibre type IIX >29% were defined as pathologically abnormal.
Conclusions
This review sheds new light on the relationship between skeletal muscle abnormalities and important hallmarks of the disease in severe COPD, and identifies absence of data in GOLD stages 1–2. This review also provides reference values on fibre type composition for diagnostic purposes in COPD.
Peripheral skeletal muscle dysfunction is a well recognised disabling feature of chronic obstructive pulmonary disease (COPD) which manifests itself in reduced muscle strength and reduced endurance.1 Loss of muscle strength can largely be attributed to the loss of muscle bulk which, in turn, is caused by muscle fibre atrophy.2 However, loss of muscle mass does not account for the attenuated endurance, suggesting that intrinsic muscular alterations are involved as well.3 A disturbed oxidative phenotype, which is reflected by a fibre type shift from type I to II (or slow twitch to fast twitch) accompanied by reduced activities of enzymes involved in oxidative energy metabolism,1 is one of the most obvious alterations in peripheral skeletal muscles of patients with COPD.
In almost all studies examining peripheral muscle biopsies of patients with COPD, the target muscle of investigation has been the vastus lateralis (part of the quadriceps femoris). These studies, in which fibre type distribution itself was the main focus, consistently showed a reduced proportion of fibre type I in patients with COPD compared with healthy age‐matched subjects. Subsequently, several biopsy studies were conducted in which muscle fibre type distribution was measured in the vastus lateralis to phenotype patients with COPD for other research questions. Surprisingly, although most of these reports present fibre type data in combination with relevant patient characteristics, very little information is available regarding the relation between fibre type proportions and hallmarks of COPD such as forced expiratory volume in 1 s (FEV1), ratio of FEV1 to forced vital capacity (FVC), carbon monoxide transfer factor (Tlco), arterial oxygen tension (Pao2) and body mass index (BMI). This may be related to the fact that group sizes in most of these studies were too small and most studies comprised highly selected patient groups. The main objective of the current report is therefore to investigate a potential relation between fibre type proportions and markers of disease severity of COPD in a larger study population. A literature search was conducted for relevant reports from which the required data were subsequently collected and combined.
Pulmonary rehabilitation in COPD has proved to be very successful in terms of improving skeletal muscle dysfunction, exercise capacity and quality of life (evidence level A).4 Regarding the physiological properties of type I fibres (fatigue resistant but slow contraction speed) and type II fibres (low fatigue resistance but strong and fast contractions), fibre typing could be a valuable diagnostic tool for the choice and components of rehabilitation programmes such as strength or endurance training. It is therefore crucial to be able to assess when the proportion of a certain fibre type can be considered within the normal range or pathologically abnormal. However, there are few data on quadriceps fibre type distribution in the literature for healthy subjects in the age range 60–70 years, which is the average age of patients with COPD included in most studies. Furthermore, control group sizes of the individual studies published so far are too small to make an accurate prediction. A secondary aim of the current study is therefore to define reference values for vastus lateralis fibre type proportions for the patients with COPD studied so far, using the combined data collected from the literature.
Methods
Search strategy
Relevant electronic databases were screened to find studies in which muscle fibre type proportions have been determined in the quadriceps femoris of patients with COPD. Reviews and non‐human studies were excluded using available filter options and no language limitation was used. First PubMed (1966 to January 2007) was searched using the following search algorithm: (fiber‐type OR fiber‐types OR fibre‐type OR fibre‐types OR fibre OR fibres OR fiber OR fibers OR “myosin heavy chain” OR “myosin heavy chains”) AND (vastus OR quadriceps OR knee‐extensor OR knee‐extensors OR “skeletal muscle” OR “skeletal muscles”) AND (COPD OR “chronic obstructive pulmonary disease” OR emphysema OR bronchitis OR “chronic obstructive lung disease”)
A similar search algorithm was also used to screen EMBASE (1989 to January 2007) and the Cochrane Library. The electronic searches were supplemented by scanning the reference lists from retrieved articles and relevant reviews to identify additional studies that may have been missed during the initial search. Online abstracts of relevant conferences were also screened (American Thoracic Society 2001–2006 and European Respiratory Society 2001–2005). From the selected reports, fibre type composition, predicted values of FEV1, FVC and Tlco, as well as the FEV1/FVC, BMI and Pao2 were collected (units were converted to those presented in table 1 when required). The primary authors of articles/abstracts published in 2000 or later were contacted for missing data whenever required and/or possible († in table 1). For control values of quadriceps femoris fibre type proportions we used age‐matched healthy control groups of the COPD‐related papers described above.
Table 1 Collected data from studies dealing with vastus lateralis fibre typing in COPD.
| Reference | N (M/F) | Age (y) | BMI (kg/m2) | FEV1 (%pred) | FVC (%pred) | FEV1/FVC (%) | Tlco (%pred) | Pao2 (kPa) | Type I (%) | Type IIA (%) | Type IIX (%) | Fibre typing |
|---|---|---|---|---|---|---|---|---|---|---|---|---|
| 13 | 14 (14/0) | 66 (6)* | 28 (4)* | 31 (9)† | 64 (12)* | 43 (10)* | 60 (26)* | 9.1 (0.8)* | 30 (11)* | – | – | IHC |
| 14 | 6 (?/?) | 64 (9) | 26 (4) | 32 (11) | 71 (11) | 34 (8) | – | 11.7 (1.0) | 21 (12)¶ | 42 (7)¶ | 39 (3)¶ | HC |
| 15 | 19 (16/3) | 65 (8)* | 26 (4)* | 42 (13)* | 79 (8)* | 43 (16)* | 49 (10)* | 8.9 (0.7)* | 38 (15)* | 48 (19)* | 13 (8)* | HC |
| 16 | 22 (22/0) | 65 (9) | – | 51 (12) | 79 (17)‡ | 50 (?)‡§ | 77 (27) | 10.8 (1.1) | 36 (17) | 40 (13) | 23 (22) | SDS PAGE |
| 10 | 15 (12/3) | 67 (9) | 24 (4) | 42 (14) | 83 (15)† | 40 (12)† | 63 (24) | 9.9 (1.2) | 19 (14) | 35 (12) | 46 (19) | HC |
| 17 | 13 (6/7) | 61 (12) | 23 (1) | 37 (12) | 75 (11) | 36 (10)† | 47 (24) | 9.0 (1.2) | 25 (7) | 47 (11) | 28 (10) | SDS PAGE |
| 18 | 18 (18/0) | 70 (6)* | 26 (3)* | 35 (12)* | 58 (12)* | 41 (9)* | – | – | 32 (17)* | 39 (12) | 30 (11) | HC |
| 19 | 8 (8/0) | 61 (5) | 24 (?)§ | 42 (6) | 71 (14)‡ | – | 70 (14) | – | 44 (15) | – | – | HC |
| 20 | 17 (17/0) | 69 (5) | 25 (3) | 34 (12) | 58 (14)† | 38 (7)† | – | – | 30 (14) | 56 (15) | 15 (14) | SDS PAGE |
| 21 | 17 (15/2) | 66 (8) | 26 (4) | 38 (12) | 59 (16) | – | 66 (29) | 10.4 (1.6) | 31 (16) | 26 (15)†† | 27 (29) | HC‡‡ |
| 22 | 16 (?/?) | 67 (4) | 24 (4) | 39 (16) | 63 (14) | 39 (9) | – | 10.4 (1.2) | 26 (12)¶ | – | 20 (16)¶ | HC |
| 23 | 29 (20/9) | 65 (5) | 25 (5) | 37 (16) | 59 (16) | 43 (11) | 56 (32) | 10.4 (1.6) | 27 (12)¶ | 32 (16)¶ | 22 (16)¶ | HC‡‡ |
| 24 | 15 (15/0) | 67 (8) | 25 (4) | 46 (16) | 64 (16) | 48 (12) | 71 (20) | 10.9 (1.7) | 40 (8) | 35 (4) | 25 (3) | IHC |
| 25 | 32 (32/0) | 64 (8)* | 28 (5)* | 42 (14)* | – | 46 (9)* | 78 (21)* | 11.3 (1.8)* | 35 (12)* | 42 (13)* | 22 (11)* | HC |
| 26 | 9 (?/?) | 66 (10) | 26 (?)§ | – | – | – | – | 8.5 (2.0) | 29 (12) | 35 (12) | 31 (15) | HC‡‡ |
| 27 | 12 (12/0) | 65 (5) | 25 (3) | 31 (9) | 59 (16) | 35 (?)§ | 72 (22) | 10.8 (1.1) | 27 (17) | 51 (15) | 22 (16) | SDS PAGE |
| 28 | 18 (13/5) | 63 (7)* | 23 (?)*§ | 29 (?)*§ | 67 (?)*‡§ | 34 (?)*‡§ | – | 9.2 (0.9)* | 20 (11)* | – | – | HC |
| 29 | 20 (17/3) | 65 (8) | 26 (?)§ | 37 (11) | 61 (16) | 40 (?)§ | 63 (18) | 10.7 (1.7) | 34 (14) | 51 (15)†† | 15 (12) | HC |
| 8 | 29 (17/12)† | 63 (10) | 22 (5) | 39 (12) | 69 (15) | 45 (10) | – | 8.8 (1.2)† | 36 (11) | 40 (9) | 24 (10) | HC |
| Abstracts | ||||||||||||
| 30 | 14 (10/4)† | 61 (9)† | 24 (4)† | 38 (11)† | – | 46 (13)† | 45 (26)† | – | 38 (14)† | 18 (8) | 45 (11) | IHC |
| 31/32** | 47 (47/0) | 67 (8)* ** | 24 (?)*§** | 40 (12)* ** | – | 41 (11)*‡** | 48 (22)*§** | 9.2 (1.8)* ** | 42 (8)*†¶†† | 27 (5)*†¶†† | 29 (7)*†¶†† | HC |
| 33/34** | 29 (29/0) | 66 (6)** | 24 (3)** | 42 (13)** | 66 (17)** | 62 (18)†** | – | 9.1 (1.0)** | 39 (22)†¶ | 36 (17)†¶ | 29 (16)†¶ | HC |
N, study group size; BMI, body mass index; FEV1, forced expiratory volume in 1 s; FVC, forced vital capacity; Tlco, carbon monoxide transfer factor; HC, histochemistry; IHC, immunohistochemistry; SDS PAGE, gel electrophoresis analysis of myosin heavy chain isoforms; ? indicates that the data were not given or could not be calculated.
*Calculated from combined subgroups.
†Additional data obtained from authors through personal communication, used with permission.
‡Vital capacity instead of forced vital capacity.
§Calculated from average data as presented in the paper.
¶Not all subjects had a muscle biopsy.
**Data obtained from a related publication.
††Determined in a figure.
‡‡Sum of fibre type proportions is not 100% because (small) proportions of hybrid fibres were excluded from analysis.
Statistics
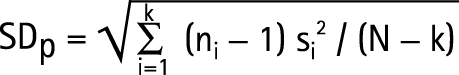
Data are represented as mean (SD) values. In some papers the COPD groups were divided into subgroups; these were pooled to form a single group (* in table 1) and the SD for these combined subgroups was calculated according to equation 1, where SDp is pooled standard deviation, N is the total sample size, ni is the sample size of the ith group, S2i is the variance of the ith group and k is the number of groups:
 |
Inter‐study analysis
Associations (for COPD populations only) between the study average fibre type proportions and study average FEV1, FEV1/FVC, Tlco, BMI, Pao2 and age were estimated using linear regression analyses with group size (N) as weight factor. For patients with COPD and healthy controls, weighed averages (with corresponding SD according to equation 1) were calculated for fibre type proportions I, IIA and IIX and the unpaired Student t test was used to test whether there were differences in these fibre type proportions. A two‐tailed probability value of <0.05 was considered statistically significant.
Intra‐study analysis
Heterogeneity was tested using the Q test of homogeneity and subsequently heterogeneity was quantified using the I2 index as described by Higgens et al.5 Study‐specific mean differences (MD) of fibre type proportions between control and patient groups were calculated from those papers that contained these data. The corresponding standard errors (SE) were calculated as √(SE2controls + SE2patients). A pooled MD was calculated by means of random effects meta‐analysis using the STATA statistical software package.
Results
The PubMed search for fibre types in the quadriceps femoris of patients with COPD yielded 38 citations. One additional publication, of which we were aware, incorrectly did not appear in the search results because fibre typing was not mentioned in the abstract.6 Of these 39 papers, 20 were excluded for the following reasons: 15 were false positive hits (eg, fibre type proportions were not studied or they were studied in skeletal muscles other than the quadriceps femoris), 2 had overlapping data (Montes de Oca et al7,8 and Gosker et al9,10) and 3 because of co‐morbidity.6,11,12 The remaining 19 articles were included in the current study (table 1), all biopsies being obtained from the vastus lateralis. Data from relevant conference abstracts was most often already published in the full articles that were found. However, 3 abstracts contained data not (yet) published elsewhere and these were therefore also included (table 1). The search in EMBASE and the Cochrane Library did not yield any citations in addition to those found in PubMed or the online conference abstracts. The inclusion process is shown in fig 1. The collected data are presented in table 1.

Figure 1 Flow diagram of study inclusion for the inter‐study and intra‐study analyses.
Inter‐study analysis
In patients with COPD there was a strong positive association between the percentage predicted FEV1 and the proportion of fibre type I (r = 0.56; p<0.001; fig 2A) and between the FEV1/FVC and the proportion of fibre type I (r = 0.57; p<0.001; fig 2B). BMI was moderately associated with the proportion of fibre type I (r = 0.34; p<0.001; fig 2F) and Tlco was weakly but significantly associated with the proportion of fibre type I (r = −0.15; p = 0.013; fig 2C). There were no significant relations between Pao2 or age and the proportion of fibre type I (fig 2D and E). Because fibre types are always expressed proportionally to each other, opposite relations are per definition true for the total fibre type II proportion. However, most of the 22 studies also distinguished between type IIA and IIX fibres and some weak to moderate relations were found. The proportion of fibre type IIA was negatively associated with percentage predicted FEV1 (r = −0.21; p<0.001), FEV1/FVC (r = −0.32; p<0.001) and BMI (r = −0.14; p = 0.010) and was positively associated with Tlco (r = 0.37; p<0.001) and Pao2 (r = 0.18; p = 0.002). The proportion of fibre type IIX was positively associated with FEV1/FVC (r = 0.25; p<0.001) and Tlco (r = 0.31; p<0.001).

Figure 2 Relationships between vastus lateralis fibre type I proportion and (A) forced expiratory volume in 1 s (FEV1); (B) ratio of FEV1 to forced vital capacity (FVC); (C) carbon monoxide transfer factor (Tlco); (D) arterial oxygen tension (Pao2); (E) age; and (F) body mass index (BMI). Circle sizes represent group sizes. Solid lines represent the weighted linear regression lines (if statistically significant only). Bold circles appear in cases of two overlaying identical data sets.
Compared with the healthy age‐matched controls (table 2), the overall fibre type I proportion was reduced in patients with COPD (51 (12)% vs 33 (14)%; p = 0.004) and the fibre type IIX proportion was increased (13 (8)% vs 26 (14)%; p = 0.006). The proportion of fibre type IIA tended to be higher (7%) in COPD, but this did not reach statistical significance.
Table 2 Vastus lateralis fibre typing in healthy age‐matched controls.
| Reference | N (M/F) | Age (years) | Type I (%) | Type IIA (%) | Type IIX (%) | Fibre typing |
|---|---|---|---|---|---|---|
| 29 | 9 (9/0) | 65 (5) | 58 (16) | 32 (13)† | 5 (5) | HC‡ |
| 27 | 10 (10/0) | 61 (6) | 41 (9) | 39 (9) | 20 (9) | SDS PAGE |
| 10 | 15 (13/2) | 64 (3) | 43 (13) | 29 (12) | 27 (12) | HC |
| 24 | 7 (7/0) | 63 (9) | 62 (2) | 28 (5) | 10 (8) | IHC |
| 23 | 18 (15/3) | 65 (4) | 58 (12)* | 29 (12)* | 8 (8)* | HC‡ |
| 21 | 10 (10/0) | 61 (6) | 54 (13) | 28 (16)† | 8 (6) | HC‡ |
| 22 | 9 (9/0) | 63 (5) | 39 (11)* | – | 8 (4)* | HC |
| 14 | 6 (?/?) | 65 (11) | 50 (14)* | 36 (21)* | 16 (10)* | HC |
N, study group size; HC, histochemistry; IHC, immunohistochemistry; SDS PAGE, gel electrophoresis analysis of myosin heavy chain isoforms; ? indicates that the data were not given.
*Not all subjects had a muscle biopsy.
†Determined in a figure.
‡Sum of fibre type proportions is not 100% because (small) proportions of hybrid fibres were excluded from the analysis.
Intra‐study analysis
From the 22 selected studies, 11 included fibre type data of a healthy control group. In 3 of these studies the control group was not age‐matched,16,19,20 and these studies were therefore excluded from this analysis (see flow diagram in fig 1). The Q test of homogeneity indicated that there was no heterogeneity (fibre type I: Q = 10.261, p = 0.17; fibre type IIA: Q = 8.467, p = 0.21; fibre type IIX: Q = 9.98, p = 0.19). However, an I2 index of about 30% (32%, 29% and 30% for fibre types I, IIA and IIX, respectively) was found. Because this indicates that 30% of the variance can still be explained by heterogeneity, it was decided to use a random effects model. The results of the meta‐analysis based on the 8 remaining studies (table 2) for fibre type proportions are shown in fig 3. The pooled mean differences between patients and control groups in type I, IIA and IIX fibre proportions were 22 (5)%, −7 (4)% and −13 (4)%, respectively.

Figure 3 Forest plot showing the results of the random effects meta‐analysis for the mean differences in (A) muscle fibre type I proportion; (B) muscle fibre type IIA proportion; and (C) muscle fibre type IIX proportion between control and patient groups. Box sizes represent quality of the study as 1/√SE. Note that IIA data were not provided in one of the eight studies.22
Discussion
To date it is unclear whether changes in lower limb muscle fibre type distribution in COPD are related to disease severity. The most prominent marker of disease severity is the FEV135 but, surprisingly, most of the currently reviewed papers did not mention a relation between FEV1 and fibre type proportion. In the current review all the group data of these individual studies were pooled, and when the FEV1 was plotted against fibre type I proportion it became clear that the fibre type I proportion in the vastus lateralis of patients with COPD decreases with increasing disease severity. This relation also exists for the FEV1 corrected for the FVC. The currently observed positive relation between BMI and fibre type I proportion further underlines the fact that the proportion of fibre type I declines with increasing disease severity, considering low BMI as an important marker of systemic disease severity.36 For fibre type II these relations are inverse, by the definition of fibre type proportions. Inverse associations between the proportion of fibre type IIA and markers of disease severity were indeed found, but not for the proportion of fibre type IIX.
There are, however, some unexplored areas. From this review it became clear that most studies focused on GOLD stages 3 and 4 (patients with more severe COPD). To study the natural course of muscle impairment in COPD it would be interesting to investigate muscle fibre type distribution in patients with mild to moderate COPD (stages 1 and 2). The current review also suggests that there is no relationship between fibre type proportion and the Pao2. However, hardly any patients with severe hypoxaemia (Pao2<7.3 kPa) were studied. It is thus possible that severe hypoxaemia contributes to altered fibre type proportion in the limb musculature of patients with COPD, and therefore fibre type data from this specific subgroup of patients are required. Moreover, patients with moderate hypoxaemia may suffer from frequent desaturations during exercise or sleep and the effect of intermittent hypoxaemia on muscle abnormalities in COPD has never been studied. With respect to cachexia, the only indicator frequently reported in the included studies was the BMI. As mentioned earlier, the currently observed relation between BMI and fibre type I proportion underscores an association between the proportion of fibre type I and disease severity. However, muscle tissue is located in the fat‐free mass compartment. Fat‐free mass has recently been identified as a better predictor of mortality and thus as a marker of systemic disease than BMI in COPD.37 Although BMI was weakly associated with fibre types, it remains unclear to what extent muscle wasting per se contributes to fibre type redistribution in COPD. Another aspect that is unclear to date is whether fibre type redistribution is comparable between the COPD subtypes emphysema and chronic bronchitis. The Tlco generally is lower in the emphysema subtype. Although there was a weak but statistically significant association between Tlco and fibre type proportions in the current review, the association between muscle fibre type composition and emphysema requires further investigation using more sensitive markers such as high resolution CT scanning.
An additional value of the current research is that solid reference values for fibre type proportions in healthy subjects in the typical age range (60–70 years) for COPD GOLD stages 3–4 can now be provided. Individual studies have consistently shown a reduced proportion of fibre type I in vastus lateralis biopsies from patients with COPD which was clearly confirmed in the current study. The inter‐study analysis revealed a mean difference of 22% and the intra‐study analysis resulted in a similar difference of 18%. Likewise, the proportion of fibre type IIX was 13% higher in patients with COPD in both analyses. However, taking into account the large variation in human muscle fibre type composition,38 we questioned what fibre type proportions can really be considered as pathologically abnormal. Based on the pooled mean of the included control groups, a p value of 0.05 and an assumed normal distribution, a fibre type I proportion <27% (51% – 1.96×12%) can be considered as abnormally low. Likewise, a fibre type IIX proportion >29% (13% + 1.96×8%) can be regarded as abnormally high. These results were confirmed when the eight control groups were extended with age‐matched control groups from nine additional non‐COPD related papers (data not shown). These findings may have diagnostic value for identifying muscle pathology as a therapeutic target.
In the included studies, several techniques for the determination of fibre type proportions have been used, but they all have in common that the distinction is based on the content of myosin heavy chain (MyHC) isoforms I, IIA and IIX. The most classic method is based on histochemical staining of the MyHC ATPase activity after selective inhibition of the ATPase domains. Alternatively, immunohistochemistry can be applied using antibodies raised against the different MyHC isoforms. Another approach is to homogenise muscle tissue and separate the MyHC isoforms by gel electrophoresis followed by quantification of the band intensities after, for example, silver staining or western blotting. It is worth mentioning that, when only studies in which fibre types were assessed using histochemistry were included in the analyses, the overall outcomes did not change (data not shown).
It must be acknowledged that, in the present report, interpretations of statistical data were made in which inferences about the nature of individuals were based on aggregate between‐study statistics collected for the group to which those individuals belong. In theory, these interpretations could therefore be incorrect (referred to as the ecological fallacy). The best solution to these issues would be to collect the data of all the individuals in the included studies. However, the associations between fibre type proportions and the FEV1 or FEV1/FVC are quite convincing. Moreover, the fact that the pooled mean differences in fibre type proportions calculated from the meta‐analysis (the intra‐study analysis) are similar to the differences calculated from the pooled control values and pooled COPD values (inter‐study analysis) suggests that ecological fallacy does not play a significant role.
This systematic review shows that the reduction in the proportion of fibre type I that occurs in the lower limb muscle of patients with COPD is strongly associated with disease severity. In addition, we provide a reliable indication of what can be considered as a reference (physiological) fibre type composition in the typical COPD age range of 60–70 years, beyond which this can be considered as muscle pathology.
Abbreviations
BMI - body mass index
COPD - chronic obstructive pulmonary disease
FEV1 - forced expiratory volume in 1 s
FVC - forced vital capacity
MyHC - myosin heavy chain
Pao2 - arterial oxygen tension
Tlco - carbon monoxide transfer factor
Footnotes
The research of HRG was supported by an award from the Netherlands Asthma Foundation (project number 3.2.05.038).
Competing interests: None.
References
- 1.ATS/ERS Skeletal muscle dysfunction in chronic obstructive pulmonary disease. A statement of the American Thoracic Society and European Respiratory Society. Am J Respir Crit Care Med 1999159S1–40. [DOI] [PubMed] [Google Scholar]
- 2.Gosker H R, Engelen M P K J, van Mameren H.et al Muscle fiber type IIX atrophy is involved in the loss of fat‐free mass in chronic obstructive pulmonary disease. Am J Clin Nutr 200276113–119. [DOI] [PubMed] [Google Scholar]
- 3.Gosker H R, Lencer N H M K, Franssen F M E.et al Striking similarities in systemic factors contributing to decreased exercise capacity in patients with severe chronic heart failure or COPD. Chest 20031231416–1424. [DOI] [PubMed] [Google Scholar]
- 4.Berry M J, Rejeski W J, Adair N E.et al Exercise rehabilitation and chronic obstructive pulmonary disease stage. Am J Respir Crit Care Med 19991601248–1253. [DOI] [PubMed] [Google Scholar]
- 5.Higgins J P, Thompson S G. Quantifying heterogeneity in a meta‐analysis. Stat Med 2002211539–1558. [DOI] [PubMed] [Google Scholar]
- 6.Barreiro E, Gea J, Corominas J M.et al Nitric oxide synthases and protein oxidation in the quadriceps femoris of patients with chronic obstructive pulmonary disease. Am J Respir Cell Mol Biol 200329771–778. [DOI] [PubMed] [Google Scholar]
- 7.Montes de Oca M, Torres S H, Gonzalez Y.et al Changes in exercise tolerance, health related quality of life, and peripheral muscle characteristics of chronic obstructive pulmonary disease patients after 6 weeks' training. Arch Bronconeumol 200541413–418. [DOI] [PubMed] [Google Scholar]
- 8.Montes de Oca M, Torres S H, Gonzalez Y.et al Peripheral muscle composition and health status in patients with COPD. Respir Med 20061001800–1806. [DOI] [PubMed] [Google Scholar]
- 9.Gosker H R, Schrauwen P, Hesselink M K C.et al Uncoupling protein‐3 content is decreased in peripheral skeletal muscle of patients with COPD. Eur Respir J 20032288–93. [DOI] [PubMed] [Google Scholar]
- 10.Gosker H R, van Mameren H, van Dijk P J.et al Skeletal muscle fibre type shifting and metabolic profile in patients with COPD. Eur Respir J 200219617–626. [DOI] [PubMed] [Google Scholar]
- 11.Doucet M, Debigare R, Joanisse D R.et al Adaptation of the diaphragm and the vastus lateralis in mild‐to‐moderate COPD. Eur Respir J 200424971–979. [DOI] [PubMed] [Google Scholar]
- 12.Engelen M P, Orozco‐Levi M, Deutz N E.et al Glutathione and glutamate levels in the diaphragm of patients with chronic obstructive pulmonary disease. Eur Respir J 200423545–551. [DOI] [PubMed] [Google Scholar]
- 13.Ramirez‐Sarmiento A, Orozco‐Levi M, Guell R.et al Inspiratory muscle training in patients with chronic obstructive pulmonary disease: structural adaptation and physiologic outcomes. Am J Respir Crit Care Med 20021661491–1497. [DOI] [PubMed] [Google Scholar]
- 14.Richardson R S, Leek B T, Gavin T P.et al Reduced mechanical efficiency in chronic obstructive pulmonary disease but normal peak VO2 with small muscle mass exercise. Am J Respir Crit Care Med 200416989–96. [DOI] [PubMed] [Google Scholar]
- 15.Vogiatzis I, Terzis G, Nanas S.et al Skeletal muscle adaptations to interval training in patients with advanced COPD. Chest 20051283838–3845. [DOI] [PubMed] [Google Scholar]
- 16.Satta A, Migliori G B, Spanevello A.et al Fibre types in skeletal muscles of chronic obstructive pulmonary disease patients related to respiratory function and exercise tolerance. Eur Respir J 1997102853–2860. [DOI] [PubMed] [Google Scholar]
- 17.Gosker H R, Schrauwen P, Broekhuizen R.et al Exercise training restores uncoupling protein‐3 content in limb muscles of patients with chronic obstructive pulmonary disease. Am J Physiol Endocrinol Metab 2006290E976–E981. [DOI] [PubMed] [Google Scholar]
- 18.Koechlin C, Maltais F, Saey D.et al Hypoxaemia enhances peripheral muscle oxidative stress in chronic obstructive pulmonary disease. Thorax 200560834–841. [DOI] [PMC free article] [PubMed] [Google Scholar]
- 19.Jobin J, Maltais F, Doyon J F.et al Chronic obstructive pulmonary disease: capillarity and fiber‐type characteristics of skeletal muscle. J Cardiopulm Rehabil 199818432–437. [DOI] [PubMed] [Google Scholar]
- 20.Hayot M, Michaud A, Koechlin C.et al Skeletal muscle microbiopsy: a validation study of a minimally invasive technique. Eur Respir J 200525431–440. [DOI] [PubMed] [Google Scholar]
- 21.Allaire J, Maltais F, LeBlanc P.et al Lipofuscin accumulation in the vastus lateralis muscle in patients with chronic obstructive pulmonary disease. Muscle Nerve 200225383–389. [DOI] [PubMed] [Google Scholar]
- 22.Debigare R, Cote C H, Hould F S.et al In vitro and in vivo contractile properties of the vastus lateralis muscle in males with COPD. Eur Respir J 200321273–278. [DOI] [PubMed] [Google Scholar]
- 23.Allaire J, Maltais F, Doyon J F.et al Peripheral muscle endurance and the oxidative profile of the quadriceps in patients with COPD. Thorax 200459673–678. [DOI] [PMC free article] [PubMed] [Google Scholar]
- 24.Russell A P, Somm E, Debigare R.et al COPD results in a reduction in UCP3 long mRNA and UCP3 protein content in types I and IIa skeletal muscle fibers. J Cardiopulm Rehabil 200424332–339. [DOI] [PubMed] [Google Scholar]
- 25.Saey D, Michaud A, Couillard A.et al Contractile fatigue, muscle morphometry, and blood lactate in chronic obstructive pulmonary disease. Am J Respir Crit Care Med 20051711109–1115. [DOI] [PubMed] [Google Scholar]
- 26.Hildebrand I L, Sylvén C, Esbjörnsson M.et al Does chronic hypoxaemia induce transformations of fibre types? Acta Physiol Scand 1991141435–439. [DOI] [PubMed] [Google Scholar]
- 27.Maltais F, Sullivan M J, LeBlanc P.et al Altered expression of myosin heavy chain in the vastus lateralis muscle in patients with COPD. Eur Respir J 199913850–854. [DOI] [PubMed] [Google Scholar]
- 28.Jakobsson P, Jorfeldt L, Brundin A. Skeletal muscle metabolites and fibre types in patients with advanced chronic obstructive pulmonary disease (COPD), with and without chronic respiratory failure. Eur Respir J 19903192–196. [PubMed] [Google Scholar]
- 29.Whittom F, Jobin J, Simard P M.et al Histochemical and morphological characteristics of the vastus lateralis muscle in patients with chronic obstructive pulmonary disease. Med Sci Sports Exerc 1998301467–1474. [DOI] [PubMed] [Google Scholar]
- 30.Fuld J P, Awede A, Neder J A.et al Skeletal muscle histology and functional capacity in COPD patients (abstract). Eur Respir J 200220289s [Google Scholar]
- 31.Fournier M, Casaburi R, Storer T.et al Cellular and molecular adaptations in skeletal muscle to testosterone and/or resistence training in men with COPD (abstract). Am Respir J Crit Care Med 2004169A904 [Google Scholar]
- 32.Casaburi R, Bhasin S, Cosentino L.et al Effects of testosterone and resistance training in men with chronic obstructive pulmonary disease. Am J Respir Crit Care Med 2004170870–878. [DOI] [PubMed] [Google Scholar]
- 33.Svartberg J, Aasebo U, Toft I.et al Testosterone supplementation in men with COPD and muscle morphology (abstract). Eur Respir J 200526659s [Google Scholar]
- 34.Svartberg J, Aasebo U, Hjalmarsen A.et al Testosterone treatment improves body composition and sexual function in men with COPD, in a 6‐month randomized controlled trial. Respir Med 200498906–913. [DOI] [PubMed] [Google Scholar]
- 35.Fabbri L M, Pauwels R A, Hurd S S.et al Global strategy for the diagnosis, management, and prevention of chronic obstructive pulmonary disease: GOLD Executive Summary updated 2003. COPD 20032004105–141. [DOI] [PubMed] [Google Scholar]
- 36.Celli B R, Cote C G, Marin J M.et al The body‐mass index, airflow obstruction, dyspnea, and exercise capacity index in chronic obstructive pulmonary disease. N Engl J Med 20043501005–1012. [DOI] [PubMed] [Google Scholar]
- 37.Schols A M, Broekhuizen R, Weling‐Scheepers C A.et al Body composition and mortality in chronic obstructive pulmonary disease. Am J Clin Nutr 20058253–59. [DOI] [PubMed] [Google Scholar]
- 38.Toft I, Lindal S, Bonaa K H.et al Quantitative measurement of muscle fiber composition in a normal population. Muscle Nerve 200328101–108. [DOI] [PubMed] [Google Scholar]