

Abstract
Objective
To determine the accuracy of the bedside head impulse test (bHIT) by direct comparison with results from the quantitative head impulse test (qHIT) in the same subjects, and to investigate whether bHIT sensitivity and specificity changes with neuro‐otological training.
Methods
Video clips of horizontal bHIT to both sides were produced in patients with unilateral and bilateral peripheral vestibular deficits (n = 15) and in healthy subjects (n = 9). For qHIT, eye and head movements were recorded with scleral search coils on the right eye and the forehead. Clinicians (neurologists or otolaryngologists) with at least 6 months of neuro‐otological training (“experts”: n = 12) or without this training (“non‐experts”: n = 45) assessed video clips for ocular motor signs of vestibular deficits on either side or of normal vestibular function.
Results
On average, bHIT sensitivity was significantly (t test: p<0.05) lower for experts than for non‐experts (63% vs 72%), while bHIT specificity was significantly higher for experts than non‐experts (78% vs 64%). This outcome was a consequence of the experts' tendency to accept bHIT with corresponding borderline qHIT values as still being normal. Fitted curves revealed that at the lower normal limit of qHIT, 20% of bHIT were rated as deficient by the experts and 37% by the non‐experts.
Conclusions
When qHIT is used as a reference, bHIT sensitivity is adequate and therefore clinically useful in the hands of both neuro‐otological experts and non‐experts. We advise performing quantitative head impulse testing with search coils or high speed video methods when bHIT is not conclusive.
The Halmagyi–Curthoys head impulse test is, at present, the only bedside examination that allows identification of the side of a unilateral hypofunction of the peripheral vestibular system.1 Head impulses are rapid, passive, unpredictable rotations of the head relative to the trunk. The patient is asked to fix upon a target straight ahead, usually the nose of the examiner, while the examiner turns the patient's head in the plane of a pair of semicircular canals. The rotations are of low amplitude (10–20°) but of high acceleration (10000°/s2). If the peripheral vestibular system is intact and the vestibulo‐ocular reflex (VOR) operates normally, the patient's eyes keep their fixations approximately on target (ie, gaze is held relatively stable in space). If not (ie, in the case of a reduced gain of the VOR towards the side of the head impulse), a reflexive saccade back to the examiner's nose is performed after the end of the head thrust. This corrective saccade indicates a peripheral vestibular hypofunction on the side towards which the preceding head rotation occurred, provided ocular motor function is intact.
Head impulses mainly drive the short latency, oligosynaptic VOR pathways from the semicircular canals to the extraocular muscles. Polysynaptic pathways via the cerebellum are less efficient in transmitting such high acceleration vestibular stimuli. The oligosynaptic pathways show distinct non‐linear properties in that the contribution of the signals from the excited semicircular canals to the ocular motor response is greater than the contribution of the signals from the inhibited semicircular canals. This principle, known as Ewald's second law,2 is probably the result of a non‐linear pathway, which during high accelerations is driven into inhibitory cut‐off on the side of inhibited semicircular canals.3,4 In the case of unilateral peripheral vestibular hypofunction, Ewald's second law results in an asymmetric gain of the VOR (ie, the gain during high acceleration head rotations towards the lesioned side is lower than towards the healthy side).5
Halmagyi and Curthoys1 as well as Foster and colleagues6 have shown surpassing accuracy of the bedside head impulse test (bHIT) in patients with complete unilateral vestibular loss. In these patients, both sensitivity and specificity reached 100% with reference to a control group of healthy subjects. In patients with partial vestibular deficits, however, the sensitivity of bHIT is considerably lower, because residual peripheral function results in a smaller gain asymmetry of the VOR. In a general clinical population of patients without and patients with significant asymmetries in caloric testing (canal paresis factor >25%), bHIT sensitivity was approximately 35% and bHIT specificity 95%.7,8,9 Direct comparison of bHIT with caloric testing, however, is problematic, as head impulses and caloric irrigation probe different frequencies of the VOR. Moreover, central compensation mechanisms in response to a peripheral vestibular deficit are frequency dependent and more often incomplete for higher (head impulses) than for lower frequencies (caloric irrigation).10,11,12,13
Considering these problems of correctly appraising the clinical usefulness of bHIT by caloric testing, we set out to better determine the accuracy of bHIT by comparing it directly with head impulse testing that is assessed quantitatively from simultaneous recordings of eye and head movements with search coils. The result of this quantitative head impulse test (qHIT) was compared with the clinicians' evaluations of bHIT (presented on video clips) in the same patients. We further asked whether the sensitivities and specificities of bHIT differed depending on the clinicians' neuro‐otological training.
Material and methods
Definition
In this study, the term “head impulses” is used for horizontal head impulses, ie, rapid head rotations about the vertical axis with the subject sitting upright. As the horizontal semicircular canals (SCC) are not exactly orthogonal and the vertical SCC not exactly parallel to this axis, horizontal head impulses usually influence the activity in all SCC. The effect of horizontal head impulses, however, is largest on the horizontal SCC.
Subjects
Fifteen patients with bilateral (n = 10) and unilateral (right‐sided n = 1; left‐sided n = 4) peripheral vestibular hypofunction (average age 54 years) and nine healthy subjects (average age 33 years) were included in the study. Table 1 shows the subjects' characteristics. Patients were selected on the basis of results from the quantitative head impulse test (qHIT); attention was paid to assemble a population with a wide spectrum of different degrees of vestibular hypofunction (see supplemental data table E1; table E1 can be viewed on the J Neurol Neurosurg Psychiatry website at http://www.jnnp.com/supplemental). Informed consent of patients and healthy subjects was obtained after full explanation of the experimental procedure. The protocol was approved by a local ethics committee and was in accordance with the ethical standards laid down in the 1964 Declaration of Helsinki for research involving human subjects.
Table 1 Subjects whose video clips of bedside head impulses were presented to clinicians.
| Subject No | Age (y) | Aetiology | Gain right | Gain left | qHIT | Time (months) |
|---|---|---|---|---|---|---|
| 1 | 27 | 0.94 | 0.80 | N | ||
| 2 | 55 | OT | 0.29 | 0.48 | B | 60 |
| 3 | 56 | VN | 0.43 | 0.57 | B | 3 |
| 4 | 29 | 0.87 | 0.79 | N | ||
| 5 | 26 | 0.91 | 0.88 | N | ||
| 6 | 62 | VN | 0.76 | 0.56 | L | 6 |
| 7 | 46 | VN | 0.35 | 0.60 | B | 0 |
| 8 | 56 | MD | 0.73 | 0.58 | L | 120 |
| 9 | 26 | VN | 0.77 | 0.55 | L | 2 |
| 10 | 60 | MD | 0.62 | 0.47 | B | 8 |
| 11 | 49 | VN | 0.69 | 0.60 | B | 72 |
| 12 | 34 | VN | 0.46 | 0.50 | B | 0 |
| 13 | 42 | VN | 0.70 | 0.66 | R | 5 |
| 14 | 50 | 0.76 | 0.68 | N | ||
| 15 | 81 | OT | 0.55 | 0.63 | B | 84 |
| 16 | 35 | 0.84 | 0.79 | N | ||
| 17 | 44 | 0.93 | 0.82 | N | ||
| 18 | 72 | OT | 0.60 | 0.62 | B | 120 |
| 19 | 24 | 0.85 | 0.89 | N | ||
| 20 | 30 | 0.90 | 0.74 | N | ||
| 21 | 71 | VN | 0.76 | 0.60 | L | 0 |
| 22 | 45 | OT | 0.64 | 0.58 | B | 96 |
| 23 | 35 | 0.79 | 0.66 | N | ||
| 24 | 55 | OT | 0.37 | 0.41 | B | 48 |
Gain right, gain of the vestibulo‐ocular reflex (VOR) during rightward head impulses.
Gain left, gain of the VOR during leftward head impulses.
Aetiologies of vestibular deficits were: vestibular neuritis (VN), Meniere's disease (MD) or ototoxicity (OT).
VOR gains of the quantitative head impulse test (qHIT) were normal (N), bilaterally decreased (B), decreased during rightward head impulses (R) or decreased during leftward head impulses (L).
Normal values were defined by values higher than the average gain minus 2 SDs in a population of healthy subjects (n = 37, average age 47 (SD 16) years).
The lower limits gains were 0.71 for rightward and 0.66 for leftward head impulses with the search coil mounted on the right eye.
Time, intervals between onset of the acute vestibular deficit to date of examination (months). Note that in healthy subjects the cells for Aetiology and Time are blank.
Head impulse testing
A video clip of the bHIT was recorded from each subject. For qHIT, eye and head movements were measured with scleral search coils. Both bHIT and qHIT where consecutively performed in each subject on the same day by the same experimenter, either one of two neurologists specialised in neuro‐otology (DS, AP) or an experienced orthoptist (ES). Head impulses (amplitude 20–40°; duration 150–200 ms; peak velocity ∼300°/s; peak acceleration ∼10000°/s2) were applied approximately along the planes of the horizontal SCC (see Definition). The directions of the head thrusts were pseudorandomly intermingled and <5–10 impulses were performed on each side. Subjects were instructed to always fix their eyes straight ahead on a light dot, located on a tangent screen 1.5 m ahead for qHIT or a dot just below the lens of the video camera during video recording.
Clinical head impulse testing (bHIT)
Video clips of bHIT in patients and healthy subjects were recorded with a Sony digital video camera recorder type DCR‐PC100E, positioned ∼1.5 m in front of the subject. Using Pinnacle Studio 9, Windows Media Video files (Microsoft) were produced (data rate 1308 kbps; video sample rate 24 bit). A DVD containing the 24 video clips was compiled and distributed to local and international clinicians (video clips can be seen online at http://web.unispital.ch/neurologie/hit). Before assessing the bHIT, participants were asked to view an introductory video clip giving instructions about the identification of vestibular hypofunction by head impulses (see introductory video clip.mpg; introductory video clip.mpg can be viewed on the J Neurol Neurosurg Psychiatry website at http://www.jnnp.com/supplemental). The participants were then invited to view each video clip and indicate on an answer sheet whether they detected a unilateral deficit (right or left), a bilateral deficit or normal function. The video clips could be viewed as many times as necessary.
Evaluating clinicians were neurologists (n = 37; including one neuro‐ophthalmologist and one advanced student in neurology), neurologists with at least 6 months of specialisation in neuro‐otology (n = 7), otolaryngologists (n = 8) and otolaryngologists with at least 6 months of specialisation in neuro‐otology (n = 5). The authors of this study did not serve as evaluators. To determine whether sensitivity and specificity of bHIT depended on the examiners' neuro‐otological experience, clinicians were partitioned into an “expert” group (n = 12), which included neurologists and otolaryngologists trained in neuro‐otology, and a “non‐expert” group (n = 45), which included all other evaluators.
Quantitative head impulse testing (qHIT)
Eye and head movements were recorded in a magnetic frame (Remmel type system, modified by A Lasker, Baltimore, USA) using search coils (Skalar Instruments, Delft, the Netherlands), which were calibrated before each session (for details see Straumann and colleagues14). One search coil was placed on the right eye around the cornea (after anaesthetising the conjunctiva with oxybuprocaine 0.4%); the other was tightly fixed on the forehead with adhesive tape. Voltages were sampled with 16 bits at 1000 Hz and stored on the hard disk of a computer. Digitised signals were processed using interactive programs written in Matlab version 7.2. The gain of the vestibulo‐ocular reflex g was computed by:
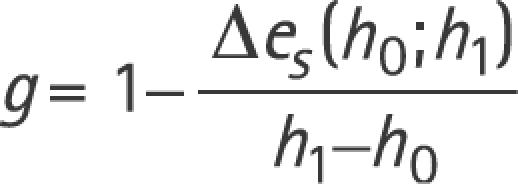 |
whereby h0 and h1 are head‐in‐space positions, and Δes is the difference between eye‐in‐space positions at h0 = 3o and h1 = 7o.5 Of the 5–10 head impulses to each side, the median gain was chosen as the representative value (see supplemental data table E1 for median gain values of the 24 subjects; table E1 can be viewed on the J Neurol Neurosurg Psychiatry website at http://www.jnnp.com/supplemental). Head impulse tests were considered to be pathological if the median gain was below the lower normal limit of a population of healthy subjects, which serves as the reference database for routine clinical search coil head impulse testing in our laboratory (n = 37; average age 47 (SD 16) years). This lower normal limit is defined as 2 SDs below the average of the direction specific VOR gain measured in the reference population. With the coil on the right eye (as was the case in all 24 subjects tested in our study and in our reference population), lower normal limits are different for rightward and leftward head impulses; the lower normal limit for rightward head impulses is 0.71 and for leftward impulses 0.66. To date, we can only speculate on the factors leading to this normal gain difference. They may include differences between VOR pathways to the muscles of abducting and adducting eyes, artefacts resulting from dynamically asymmetric slippage of the search coil annulus on the conjunctiva or even the handedness of the operator causing systematic differences in the peak accelerations to the left and right. Placing the annulus on the left eye results in mirrored normal values (ie, the gain asymmetry cannot be due to a coil frame or amplifier artefact).
Effect of viewing distance on VOR gain
At the bedside, the typical distance between the subject's eyes and the visual target (ie, the tip of the clinician's nose) is ∼0.5 m. In this study, however, the distance of the target (ie, the lens of the video camera and the laser dot on the tangent screen for search coil testing) was ∼1.5 m. To keep a near target on the retina during head rotation, the gain of the VOR must increase compared with when the target is more distant because the reflex must also compensate for the translational movements of the eyes as they are placed anterior of the rotation axis of the head.15,16,17 Therefore, a VOR deficit during near viewing will lead to a larger retinal error and hence to larger correcting saccades. These larger rapid eye movements, in turn, may be better detectable by the clinician and increase bHIT accuracy. In view of the purpose of our study to compare bHIT and qHIT tested under the same stimulus conditions, we opted for similar viewing distances during both bHIT and qHIT. Note, however, that if one assumes that the yaw rotation axis of the head is 80 mm behind the centre of the eyes,18 the difference between ideal VOR gains for complete retinal stabilisation at 0.5 m (fixation of the clinician's nose) and at 1.5 m (fixation of the camera lens) target distances is only ∼10% (ie, the impact of this factor on bHIT sensitivity is expected to be small).
Statistical analysis
To describe the frequency of assessing the bHITs as deficient as a function of their corresponding VOR gains measured quantitatively by search coils (qHIT), we fitted the following sigmoidal through the data cloud:
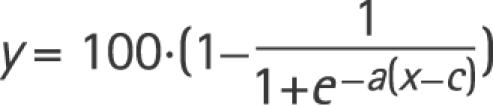 |
where y is the percentage of evaluators rating bHIT as deficient at a specific VOR gain x of qHIT. The variables a and c were optimised by iteratively finding the best curve using non‐linear least square fitting (Matlab function: lsqcurvefit.m). Bootstrapping (Matlab function: bootstrap.m) was used to compute the variability of the curve: 1000 random samples with replacement from the original data set were fitted in the same way as described above. The computed population of curves was used to obtain the distribution of bHIT evaluation percentages (y axis) at a specific qHIT gain value (x axis).
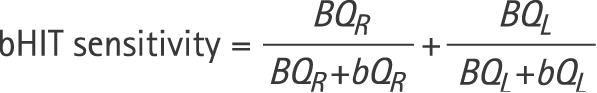
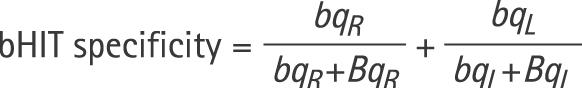
To analyse the accuracy of bHIT relative to qHIT, we computed the sensitivity and specificity of bHIT for each evaluator using the following formulas:
 |
 |
where
BQR is the number of subjects whose bHITs were rated pathological to the right side (including bilaterally deficient) and whose qHIT was pathological to the right side (including bilaterally deficient);
bQR is the number of subjects whose bHITs were rated normal to the right side (including bilaterally normal) and whose qHIT was pathological to the right side (including bilateral deficient);
bqR is the number of subjects whose bHITs were rated normal to the right side (including bilaterally normal) and whose qHIT was normal to the right side (including bilaterally normal);
BqR is the number of subjects whose bHITs were rated pathological to the right side (including bilaterally deficient) and whose qHIT was normal to the right side (including bilaterally normal).
Definitions for leftward head impulses (BQL, bQL, bqL, BqL) are analogous.
Results
Figure 1 depicts typical examples of head and eye position traces during horizontal head impulses to both sides in three subjects (subject Nos 5, 6 and 24), as measured with search coils. Eye position in space (“eye‐in‐space”) is plotted as a function of head position in space (“head‐in‐space”). In subject No 5 (fig 1A), a healthy control subject, gain values of the VOR were symmetric, but not completely compensatory, which to a certain degree is normal (see normal values). In subject No 6 (fig 1B), VOR gains were asymmetric with reduced gains for head impulses to the left. Thus, in this patient, peripheral vestibular function was reduced on the left side. In subject No 24 (fig 1C), VOR gains were bilaterally diminished (ie, peripheral vestibular hypofunction was bilateral).

Figure 1 Examples of quantitative horizontal head impulses (qHIT) in subject No 5 (A), subject No 6 (B) and subject No 24 (C). If the vestibulo‐ocular reflex (VOR) were perfectly compensatory, traces would be parallel to the abscissa (head‐in‐space axis); if the VOR were absent, traces would move on a 45° slope. GR, median gain value for head impulses to the right; GL, median gain value for head impulses to the left. Traces are clipped beyond 10° eccentricity of head‐in‐space. Broken vertical lines indicate intervals used to determine the gains (see Material and methods).
For each of the 24 subjects participating in the study, fig 2 plots the results of bHIT as a function of qHIT. Head impulses to the right (fig 2A) and to the left (fig 2B) are shown separately, as normal values were found to be different between the qHIT to both sides (see Materials and methods). The median gain of unilateral head impulse tests for each subject gave the value on the x axis, and its corresponding value on the y axis was the percentage of evaluators rating the bHIT as deficient. Evaluators were divided into an “expert” and a “non‐expert” group (criteria described in Material and methods). A sigmoidal function (see Material and methods) was fitted though the data cloud of experts and non‐experts.

Figure 2 Results of bedside head impulse testing (bHIT) plotted as a function of quantitative head impulse testing (qHIT). Abscissa: gain of the vestibulo‐ocular reflex during qHIT. Ordinate: percentage of evaluators who rated bHIT as deficient. (A) Head impulses to the right. (B) Head impulses to the left. Triangles: clinicians specialised in neuro‐otology (“experts”; n = 12). Circles: all other clinicians (“non‐experts”; n = 45). Dashed curve: sigmoidal function fitted though data cloud of experts; solid curve: sigmoidal function fitted though data of non‐experts. Broken vertical lines: lower normal gain limit from a reference population of healthy subjects (average − 2 SD). Note that normal lower limits for qHIT were found to be different between head impulses to the right (0.71) and to the left (0.66) (see Material and methods).
The fitted curves for the experts were shifted towards lower gains relative to the curves for the non‐experts. In other words, experts tended to be more conservative in rating bHIT as pathological than non‐experts. To quantify the difference between experts and non‐experts, we determined the percentage of evaluators who rated the head impulses as pathological at exactly the lower normal limit of qHIT. For rightward bHIT, fitted sigmoidal curves crossed the lower normal gain limit (g = 0.71) at 3.4% for experts and at 20.4% for non‐experts; for leftward bHIT, curves crossed the lower normal limit (g = 0.66) at 19.6% for experts and 36.7% for non‐experts. To statistically test whether these numbers were different between both groups, we computed the percentages at which sigmoidal curves fitted through bootstrapped samples crossed the lower normal limits (see Material and methods). Unpaired t tests revealed highly significant (p<0.001) differences between experts and non‐experts for both rightward and leftward head impulse tests.
Figure 3 compares bHIT sensitivity and specificity between experts and non‐experts. Sensitivity (fig 3A) was lower for experts (average 63.3 (SD 8.8)%) than for non‐experts (average 71.7 (SD 13.3)% (ie, the latter correctly identified more vestibular deficits than experts). This difference was significant (unpaired t test: p = 0.044). In contrast, specificity (fig 3B) was higher for experts (average 77.8 (SD 14.2)%) than for non‐experts (average 64.2 (SD 16.2)%) (ie, the former misdiagnosed fewer vestibular deficits at the bedside when search coil head impulse tests were normal); 16% of the “experts” reached perfect specificity. The difference between both groups was again significant (unpaired t test: p = 0.011). The same statistical comparison was repeated between neurologists, including neurologists with at least 6 months of specialisation in neuro‐otology, and otolaryngologists, including otolaryngologists with at least 6 months of specialisation in neuro‐otology (data not shown). Sensitivity and specificity did not differ significantly (unpaired t tests: p>0.3) between both groups (neurologists: sensitivity 69.1 (SD 12.8)%, specificity 75.8 (SD 15.8)%; otolaryngologists: sensitivity 66.2 (SD 12.9)%, specificity 72.9 (SD 16.5)%). Likewise, no significant (unpaired t tests: p>0.4) difference in sensitivity or specificity was observed between neurologists and otolaryngologists, when clinicians with at least 6 months of specialisation in neuro‐otology were excluded from both groups (neurologists: sensitivity 72.3 (SD 12.3)%, specificity 65.4 (SD 11.2)%; otolaryngologists: sensitivity 69.2 (SD 11.1)%, specificity 63.1 (SD 15.4)%). For all evaluators (experts and non‐experts), average bHIT sensitivity was 69.9 (SD 12.9)% and average bHIT specificity 67.05 (SD 16.7)%.

Figure 3 Comparison of bedside head impulse test (bHIT) sensitivity (A) and specificity (B) between experts and non‐experts. Bin width: 10%.
Discussion
We investigated the accuracy of the bHIT, a clinical manoeuvre that is widely used to assess peripheral vestibular function. To our knowledge, this is the first study that has validated the bHIT (presented on video clips) relative to qHIT, which we performed by simultaneous search coil recordings of eye and head movements. On average, bHIT sensitivity was 69.9% and bHIT specificity 67.05%. We found significant differences between “experts” (clinicians which had at least 6 months of training in neuro‐otology) and “non‐experts”.
Previous studies showed sensitivities and specificities of bHIT which differed considerably from the values found in our study. For example, Harvey and colleagues7 reported bHIT sensitivity of 35% and specificity of 95%. These authors concluded that the low sensitivity made bHIT inadequate as a screening tool for peripheral vestibular disease. Note, however, that Harvey et al compared the outcome of bHIT with results from binaural caloric irrigation (CI) and not with qHIT.
Beynon and colleagues9 also compared bHIT with CI. Sensitivity (34%) and specificity (100%) were similar as in the previous study. In addition, Beynon et al analysed bHIT sensitivity in subgroups of patients, who were partitioned according to the CI canal paresis factor. Only for severe canal paresis (>75%) was bHIT clinically useful with a sensitivity of 76.6%. For moderate canal paresis (50–75%), bHIT sensitivity reached only 9.5%. The authors predicted that bHIT would not replace caloric testing in the future.
Finally, Perez and Rama‐Lopez19 plotted the receiver operating curve (bHIT sensitivity vs 1 minus bHIT specificity) with CI canal paresis as the independent variable and found the best cut‐off point at a canal paresis factor of 42.5%. Applying this value as the normal CI limit, bHIT sensitivity was 78% and bHIT specificity 87%. Thus even after raising the normal limit of the canal paresis factor, a discrepancy between CI and bHIT remained. Accordingly, Perez and Rama‐Lopez concluded that CI and bHIT are not redundant methods.
Based on these studies, CI does not appear to be the “gold standard” to assess the accuracy of bHIT. With CI as reference, bHIT sensitivity is vastly underestimated and its clinical use incorrectly undervaluated. Apart from the cited literature, several other arguments support the notion that HIT (bHIT, qHIT) and CI probe different aspects of peripheral vestibular function and therefore complement each other. (1) HIT stimulates the VOR at high frequencies (up to 5 Hz), while CI stimulates the VOR at very low frequencies (∼0.003 Hz).12 (2) In the chronic state after vestibular neuritis, HIT remains deficient, while CI becomes frequently normal again (ie, central compensation mechanisms seem more effective at low VOR frequencies).5,10,20,21,22 (3) In roughly symmetrical bilateral peripheral vestibular hypofunction, the CI canal paresis factor gives a normal result while HIT correctly identifies the bilateral deficit.
We emphasise that it was not our intention to question the role of CI in the evaluation of patients with vertigo and balance disorders. CI and HIT should be regarded as complementary examinations. The purpose of this paper, however, was to compare bHIT with qHIT.
We found that bHIT sensitivity and specificity depend on the training of the examining clinician. Neuro‐otological training of at least 6 months significantly decreased bHIT sensitivity but increased bHIT specificity. “Experts” are more inclined to rate bHIT as normal if its corresponding qHIT is slightly below the normal lower limit (see fig 2). To interpret this finding, one has to bear in mind that the clinician cannot visually track the reflexive ocular movement during the head impulse, since it lasts only about 150 ms. Rather, the clinician estimates the amplitude of the correcting saccade after the head impulse. Because the VOR gain is not perfect even in healthy subjects, small correcting saccades can often be observed despite intact labyrinths on both sides. Moreover, as clinicians tend to compare correcting saccades after head impulses to one side with correcting saccades after head impulses to the other side, physiological asymmetries of VOR gains might lead to the false assessment of a unilateral deficit. “Experts” seem to be more tolerant in accepting small correcting saccades as still normal. If a clinician views every correcting saccade as indicating a pathological HIT, bHIT sensitivity increases but specificity decreases. This association is exactly what we found in our “non‐experts”.
An important caveat for the interpretation of deficient HIT concerns the complex relation between peripheral vestibular hypofunction and HIT towards the ipsilateral and contralateral sides. The physiology of linear and non‐linear VOR pathways predicts a considerable gain reduction for contralesional HIT if compensation mechanisms are not engaged.23 Generally, these central mechanisms are operational after a unilateral lesion, but not always effective enough to bring the gain for contralesional HIT above the lower normal limit, especially in large unilateral hypofunction.5 Thus in unilateral peripheral vestibular hypofunction, HIT can be bilaterally impaired, although gains in these cases are generally asymmetrical with a lower gain for ipsilesional HIT. In other words, a bilaterally deficient HIT is not necessarily due to bilateral peripheral hypofunction. These considerations, however, concern both bHIT and qHIT; therefore, they do not constitute a factor that influences the sensitivity or specificity of bHIT compared with qHIT.
In conclusion, when qHIT is used as the “gold standard”, bHIT has an adequate sensitivity (average 69.9%) and therefore is clinically useful, provided the clinician receives at least minimal instruction (introductory video clip) on how to assess bHIT. We hypothesise that bHIT sensitivity could be even higher because of the shorter target distance at the bedside (ie, ∼0.5 m between the subject's eyes and the tip of the nose of the experimenter) compared with our study (ie, ∼1.5 m between the subject's eyes and fixation of the camera lens), which leads to an increase in VOR gain and consequently in amplitude of the correcting saccade (detailed explanation in the Material and methods section). Clinicians with neuro‐otological experience have lower bHIT sensitivity (ie, are more conservative in rating bHIT as deficient) and higher specificity (ie, are better in identifying normal bHIT) than clinicians without this experience. This disagreement between experts and non‐experts, however, was mainly restricted to those bHIT with corresponding qHIT gains slightly below the normal lower limit. Therefore, we advise ordering search coil head impulse testing or high speed video methods when bHIT is not conclusive.
Supplementary Material
Acknowledgements
The authors thank Dr CJ Bockisch for valuable comments; E Schafflützel (ES) for performing some of the head impulses; and T Schmückle Meier and A Züger for technical assistance. Special thanks to all clinicians participating in the study.
Abbreviations
bHIT - bedside head impulse test
CI - caloric irrigation
qHIT - quantitative head impulse test
SCC - semicircular canals
VOR - vestibulo‐ocular reflex
Footnotes
Grant/financial support: Swiss National Science Foundation (#3200B0‐105434); Betty and David Koetser Foundation for Brain Research, Zurich, Switzerland
Competing interests: None.
References
- 1.Halmagyi G M, Curthoys I S. A clinical sign of canal paresis. Arch Neurol 198845737–739. [DOI] [PubMed] [Google Scholar]
- 2.Ewald E J.Physiologische Untersuchungen über das Endorgan des Nervus Octavus. Wiesbaden: Bergmann, 1892
- 3.Goldberg J M, Fernandez C. Physiology of peripheral neurons innervating semicircular canals of the squirrel monkey. I. Resting discharge and response to constant angular accelerations. J Neurophysiol 197134635–660. [DOI] [PubMed] [Google Scholar]
- 4.Minor L B, Lasker D M, Backous D D.et al Horizontal vestibuloocular reflex evoked by high‐acceleration rotations in the squirrel monkey. I. Normal responses. J Neurophysiol 1999821254–1270. [DOI] [PubMed] [Google Scholar]
- 5.Palla A, Straumann D. Recovery of the high‐acceleration vestibulo‐ocular reflex after vestibular neuritis. J Assoc Res Otolaryngol 20045427–435. [DOI] [PMC free article] [PubMed] [Google Scholar]
- 6.Foster C A, Foster B D, Spindler J.et al Functional loss of the horizontal doll's eye reflex following unilateral vestibular lesions. Laryngoscope 1994104473–478. [DOI] [PubMed] [Google Scholar]
- 7.Harvey S A, Wood D J, Feroah T R. Relationship of the head impulse test and head‐shake nystagmus in reference to caloric testing. Am J Otol 199718207–213. [PubMed] [Google Scholar]
- 8.Harvey S A, Wood D J. The oculocephalic response in the evaluation of the dizzy patient. Laryngoscope 19961066–9. [DOI] [PubMed] [Google Scholar]
- 9.Beynon G J, Jani P, Baguley D M. A clinical evaluation of head impulse testing. Clin Otolaryngol 199823117–122. [DOI] [PubMed] [Google Scholar]
- 10.Schmid‐Priscoveanu A, Bohmer A, Obzina H.et al Caloric and search‐coil head‐impulse testing in patients after vestibular neuritis. J Assoc Res Otolaryngol 2001272–78. [DOI] [PMC free article] [PubMed] [Google Scholar]
- 11.Brantberg K, Magnusson M. The dynamics of the vestibulo‐ocular reflex in patients with vestibular neuritis. Am J Otolaryngol 199011345–351. [DOI] [PubMed] [Google Scholar]
- 12.Halmagyi G M, Curthoys I S, Cremer P D.et al The human horizontal vestibulo‐ocular reflex in response to high‐acceleration stimulation before and after unilateral vestibular neurectomy. Exp Brain Res 199081479–490. [DOI] [PubMed] [Google Scholar]
- 13.Aw S T, Fetter M, Cremer P D.et al Individual semicircular canal function in superior and inferior vestibular neuritis. Neurology 200157768–774. [DOI] [PubMed] [Google Scholar]
- 14.Straumann D, Zee D S, Solomon D.et al Transient torsion during and after saccades. Vision Res 1995353321–3334. [DOI] [PubMed] [Google Scholar]
- 15.Lasker D M, Ramat S, Carey J P.et al Vergence‐mediated modulation of the human horizontal angular VOR provides evidence of pathway‐specific changes in VOR dynamics. Ann N Y Acad Sci 2002956324–337. [DOI] [PubMed] [Google Scholar]
- 16.Snyder L H, King W M. Effect of viewing distance and location of the axis of head rotation on the monkey's vestibuloocular reflex. I. Eye movement responses. J Neurophysiol 199267861–874. [DOI] [PubMed] [Google Scholar]
- 17.Viirre E, Tweed D, Milner K.et al A reexamination of the gain of the vestibuloocular reflex. J Neurophysiol 198656439–450. [DOI] [PubMed] [Google Scholar]
- 18.Medendorp W P, Melis B J, Gielen C C.et al Off‐centric rotation axes in natural head movements: implications for vestibular reafference and kinematic redundancy. J Neurophysiol 1998792025–2039. [DOI] [PubMed] [Google Scholar]
- 19.Perez N, Rama‐Lopez J. Head‐impulse and caloric tests in patients with dizziness. Otol Neurotol 200324913–917. [DOI] [PubMed] [Google Scholar]
- 20.Imate Y, Sekitani T. Vestibular compensation in vestibular neuronitis. Long‐term follow‐up evaluation. Acta Otolaryngol 1993113463–465. [DOI] [PubMed] [Google Scholar]
- 21.Okinaka Y, Sekitani T, Okazaki H.et al Progress of caloric response of vestibular neuronitis. Acta Otolaryngol Suppl 199350318–22. [DOI] [PubMed] [Google Scholar]
- 22.Allum J H, Ledin T. Recovery of vestibulo‐ocular reflex‐function in subjects with an acute unilateral peripheral vestibular deficit. J Vestib Res 19999135–144. [PubMed] [Google Scholar]
- 23.Lasker D M, Hullar T E, Minor L B. Horizontal vestibuloocular reflex evoked by high‐acceleration rotations in the squirrel monkey. III. Responses after labyrinthectomy. J Neurophysiol 2000832482–2496. [DOI] [PubMed] [Google Scholar]
Associated Data
This section collects any data citations, data availability statements, or supplementary materials included in this article.