Abstract
Acoustic radiation force impulse (ARFI) imaging has been demonstrated to be capable of visualizing variations in local stiffness within soft tissue. Recent advances in ARFI beam sequencing and parallel imaging have shortened acquisition times and lessened transducer heating to a point where ARFI acquisitions can be executed at high frame rates on commercially available diagnostic scanners. In vivo ARFI images were acquired with a linear array placed on an exposed canine heart. The electrocardiogram (ECG) was also recorded. When co-registered with the ECG, ARFI displacement images of the heart reflect the expected myocardial stiffness changes during the cardiac cycle. A radiofrequency ablation was performed on the epicardial surface of the left ventricular free wall, creating a small lesion that did not vary in stiffness during a heartbeat, though continued to move with the rest of the heart. ARFI images showed a hemispherical, stiffer region at the ablation site whose displacement magnitude and temporal variation through the cardiac cycle were less than the surrounding untreated myocardium. Sequences with radiation force pulse amplitudes set to zero were acquired to measure potential cardiac motion artifacts within the ARFI images. The results show promise for real-time cardiac ARFI imaging.
Keywords: Ultrasound, Ultrasonic Imaging, Acoustic Radiation Force, Echocardiography, Myocardial Stiffness
Introduction
In addition to displaying cardiac anatomy, various medical imaging modalities provide information related to myocardial function. Positron emission tomography (PET), computed tomography (CT), magnetic resonance imaging (MRI) and echocardiography have all demonstrated capabilities in assessing myocardial function by measuring perfusion of contrast agents into and out of the intercellular space of cardiac tissue(Gerber et al., 2002; Klein et al., 2002; Koyama et al., 2004; Lardo et al., 2000; Yu et al., 2004). However, the potential complications with the use of contrast agents as well as the cost of these imaging modalities are limiting factors for their widespread clinical application.
Echocardiography displays real-time images of the heart that provide insight into anatomy and function. Through Doppler and other methods, the velocity of blood and cardiac tissue can also be measured. Advanced signal and image processing methods, such as acoustic integrated backscatter, tissue Doppler, and automated calculation of cardiac chamber volumes, have been used to evaluate the performance of the heart and determine cardiac irregularities(O'Brien et al., 1995; Wickline et al., 1985). However, correlating changes in these parameters to myocardial function becomes difficult as they could be biased by several additional factors, including myocardial fiber orientation, plane of imaging, and tissue depth, that also have been observed to vary during a heartbeat(Baldwin et al., 2006; Herbots et al., 2004; Micari et al., 2006).
An important parameter that reflects cardiac function is myocardial stiffness. Several studies have associated increased myocardial stiffness with diastolic heart failure(Borbély et al., 2005; Kawaguchi et al., 2003; Zile et al., 2004). Stiffness has also been shown to vary with infarcted, ischemic, and ablated tissue. Stiffness is measured by determining the elastic relationship between stress and strain within tissue. The calculation of stress within the heart is difficult as there currently is not a direct, non-invasive method to measure the force applied to myocardium. Conversely, strain is easier to quantify as it can be calculated through image-based algorithms that track tissue motion. One method to measure strain is through a temporal integration of strain rate, which can be measured from the difference in tissue velocities at two points within the myocardium(Heimdal et al., 1998; Pislaru et al., 2004). Another method to measure strain is from the spatial gradient of tissue displacements. Several imaging modalities utilize motion tracking to calculate tissue displacements. Tagged MRI has been used to measure three-dimensional cardiac motion, though the prolonged acquisition times leave this method susceptible to artifact due to patient and respiratory motion(McVeigh, 1996). Echocardiography has been used extensively to track myocardial deformation(Amundsen et al., 2006; D'hooge et al., 2002), though the relative inaccessibility and depth of the heart limit the accuracy of these measurements.
Images of strain and strain rate have been used to correlate reduced myocardial deformation with weaker heart contraction and reduced cardiac output(Amundsen et al., 2006; D'hooge et al., 2002; Konofagou et al., 2002; Langeland et al., 2004). These methods have shown promise in the detection of ischemic or infarcted myocardium(Garot et al., 1999; Lyseggen et al., 2005; Pislaru et al., 2004). However, without measuring stress, these images are vulnerable to misinterpretation as observed variations could be due to the intrinsic non-uniform deformation of the heart.
A measurement of myocardial stiffness can be obtained from the pressure-volume (P-V) relation. This value is most commonly measured by recording P-V loops across multiple heartbeats while gradually increasing blood pressure(Cingolani et al., 2003; Kheradvar et al., 2006; Mirsky et al., 1987). However, as a single value of stiffness is derived through multiple heartbeats, this method cannot provide measurements in specific regions of the heart, nor can it provide instantaneous measurements of stiffness. Further, direct P-V measurements require invasive procedures with the use of intracardiac probes(Nakano et al., 1990). Non-invasive P-V loops can be derived through indirect measurements of blood velocities, blood pressure, and tissue displacements(Kawaguchi et al., 2003; Wen et al., 2005); however, these procedures make several assumptions and simplifications concerning the distribution of force as well as the geometry of the heart.
Another method of imaging stiffness is through acoustic radiation force impulse (ARFI) imaging. ARFI imaging uses high intensity acoustic pulses to apply local forces to tissue and impart small displacements within selected regions of interest(Nightingale et al., 2001, 2002c). The tissue responses to the radiation force are then tracked and can be correlated with the local stiffness of soft tissue(Fahey et al., 2005b, 2004). The radiation force (N/cm3) generated by a propagating acoustic wave is given by(Nyborg, 1965; Torr, 1984):
| (1) |
where Iav is the local time-averaged acoustic intensity (W/cm2), α is the attenuation coefficient (Np/cm), and c is the speed of sound (m/s). Within regions of interest where these values are relatively similar, radiation force, and therefore stress, can be considered uniform. With uniform stress, the displacement images can be interpreted as a direct reflection of stiffness because the material's elastic modulus and deflection under a given load are inversely related. As a result, ARFI imaging has been shown to be capable of identifying stiffer regions within the image that displace less than more compliant tissue(Fahey et al., 2005b, 2004; Nightingale et al., 2002a, 2001; Sharma et al., 2004). As ARFI imaging produces its own tissue deformation, it is less affected by the non-uniform stress distribution within the heart.
Current methods of ARFI imaging do not measure radiation force. As a result, stress cannot be calculated, and current methods of ARFI imaging cannot provide a quantitative measurement of elastic modulus. Alternative methods of radiation force imaging have measured shear wave propagation velocities to determine a material's shear modulus, which can be converted to an elastic modulus depending on tissue geometry and underlying assumptions(Bercoff et al., 2002; Oliphant et al., 2000; Sandrin et al., 2002).
Investigations in cardiac ARFI imaging have demonstrated it to be an effective modality for use in monitoring of radiofrequency ablations(Fahey et al., 2005b; Hsu et al., 2007). These studies used ECG-gated acquisitions, where a single ARFI image per heartbeat is acquired. We hypothesize that a sequence of ARFI images will provide further insight into the changing mechanical stiffness of the myocardium. ARFI imaging has been shown to be capable of visualizing changes in the stiffness of muscle fibers under various contractile loads(Nightingale et al., 2002b). Recent advances in ARFI beam sequencing and parallel-receive imaging have shortened acquisition times and lessened transducer heating to a point where continuous ARFI acquisitions can be executed at high frame rates(Dahl et al., 2006). Additionally, studies into rapid motion tracking of ARFI-induced displacements have demonstrated the viability of real-time processing and display of ARFI images(Pinton et al., 2006). In this paper, we present preliminary in vivo investigations of real-time ARFI imaging of the heart through the cardiac cycle.
Methods
Imaging Methods
The Siemens (Siemens Medical Solutions, USA, Ultrasound Division, Issaquah, WA) SONOLINE Antares™ ultrasound scanner and VF10-5 handheld transducer were used. The 192 element, linear array formed B-mode and ARFI images at a center frequency of 6.67 MHz. Traditional B-mode images were formed across a 38 mm lateral field of view and with a line density of 6.7 lines per millimeter. In-phase (I) and quadrature (Q) signals from the received echoes were recorded via the Ultrasonic Research Interface™ (Siemens Medical Solutions, Issaquah, WA, USA). During acquisition, the corresponding electrocardiogram (ECG) was also recorded.
Along each lateral location, the ARFI pulse sequence consisted of one reference line, one radiation force pulse line, and several consecutive tracking lines. Reference and tracking lines are conventional B-mode imaging lines utilizing short transmit pulses (0.1-0.2 µs). The radiation force pulse line produces a high intensity pushing beam by transmitting an extended excitation pulse (45 µs pulse length). The reference line was used to establish the initial tissue position and served as a reference for measuring subsequent displacements. The pushing beam was then transmitted along the same line to induce small displacements within the tissue. These displacements were estimated by recording echoes from thirteen consecutive tracking lines at a pulse repetition frequency (PRF) of 3 kHz and correlating them with the echoes from the initial reference line with a phase shift estimation algorithm(Kasai and Namekawa, 1985). The reference and tracking lines used conventional B-mode pulses, 1-2 cycles long. Previous studies have shown the axial and lateral resolution of ARFI images to be comparable to B-mode images obtained under similar imaging conditions. A more detailed description of the ARFI acquisition process is described by Nightingale et al. (2001).
Three-line M-mode ARFI imaging
To examine specific regions of tissue at a high sampling frequency, three-line M-mode ARFI images were acquired. These sequences consisted of consecutively transmitted radiation force pulses at three lateral positions spaced 9.5 mm apart. Repeated tracking lines were then recorded by a novel method of multiplexing the tracking location through each of the three transmit beams. The acquisition time for the entire sequence was 5.9 ms. In order to limit tissue and transducer heating, three-line M-mode ARFI sequences in these experiments were executed for three seconds (across 4-5 heartbeats) at a sampling rate of 40 Hz.
Two-dimensional ARFI Imaging
Two-dimensional ARFI images were formed across a 14 mm lateral field of view at a line density of 3.6 lines per millimeter. Much like the three-line M-mode sequences, these two-dimensional ARFI sequences consisted of consecutive radiation force pulses transmitted at three lateral locations spaced one third of the lateral field of view apart. Parallel-receive ARFI imaging, as previously described by Dahl et al. (2006), was also utilized in this study to shorten acquisition times and reduce tissue and transducer heating. Multiplexed tracking lines, consisting of four parallel-receive lines centered around each of the three transmit locations, were recorded for 4.28 ms with a PRF per single location of 3.0 kHz. The entire sequence was then electronically translated across the field of view to form a complete two-dimensional image. Single frame ARFI images were formed by displaying the measured tissue displacements 1.3 ms after cessation of the radiation force pulse. These displacement images were spatially median filtered with a 0.3 mm (axial) × 0.7 mm (lateral) kernel.
The sequence interrogated the entire 14 mm field of view using twelve radiation force pulses for a total acquisition time of 24 ms. Conventional ARFI sequences without parallel-receive and multiplexing methods would have required 288 ms and 48 radiation force pulses for the same field of view. Again, to limit long-term tissue and transducer heating, 2-D ARFI images in these experiments were acquired for three seconds with a frame rate of 10 Hz.
Displacement Estimation
Axial displacements were calculated by using a phase shift estimation algorithm(Kasai and Namekawa, 1985). As the displacements are measured by determining the phase shift of the signal, the lags estimated are limited to within ±180° (a half wavelength in either direction). Tissue displacements surpassing these limits alias as the estimates wrap about the origin. To correct for this error, large displacement discontinuities through time greater than half a wavelength within the data were found and shifted a complete wavelength in the opposite direction.
Quadratic Motion Filter
Motion filters were designed to reduce artifacts due to motion external to the radiation force-induced displacements. Within the heart, these artifacts arise primarily from physiological cardiac motion. The quadratic motion filter assumes that tissue acceleration arising from physiological motion is constant within the time intervals of the ARFI-induced displacements. Therefore, at any point within the tissue (x, y, z), a second-order polynomial can be used to approximate the physiological displacements (d(t)) measured within the ARFI images:
| (2) |
The initial reference line is defined as the origin, and all displacements are estimated with respect to windowed echoes from that line. Evaluating the polynomial at that point yields:
| (3) |
c1 and c2 are found with a least squares regression to the displacement data. This regression is calculated by using displacements measured after a thresholded time (tthresh) when the tissue is assumed to have fully recovered from the radiation force excitation. This time must be short enough so that the assumption of constant physiological tissue acceleration remains valid. Thus, later displacements reflect physiological motion. By applying the regression to a limited subset of times (ts) and measured displacements (ds), where ts> tthresh, the coefficients (c1 and c2) are found to be:
| (4) |
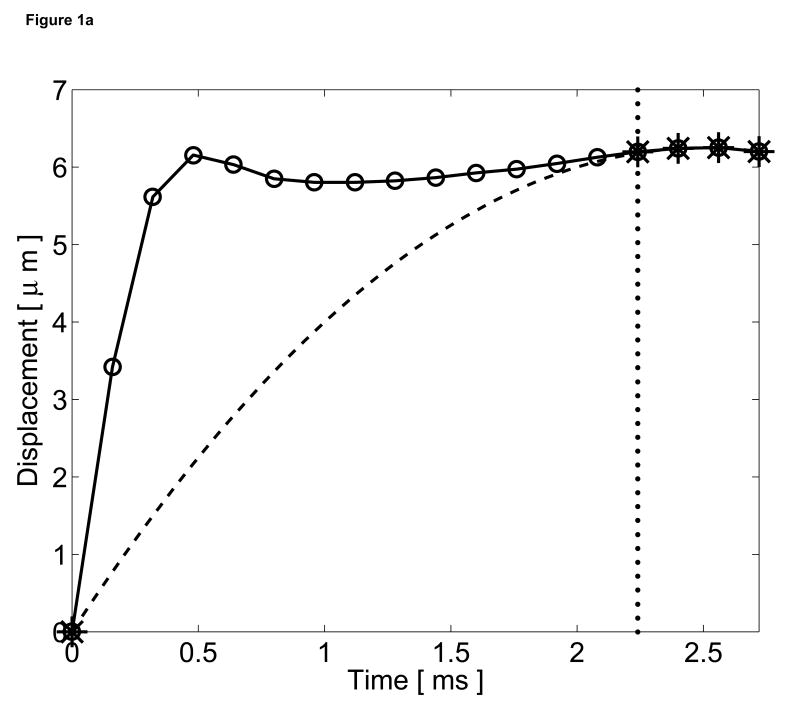
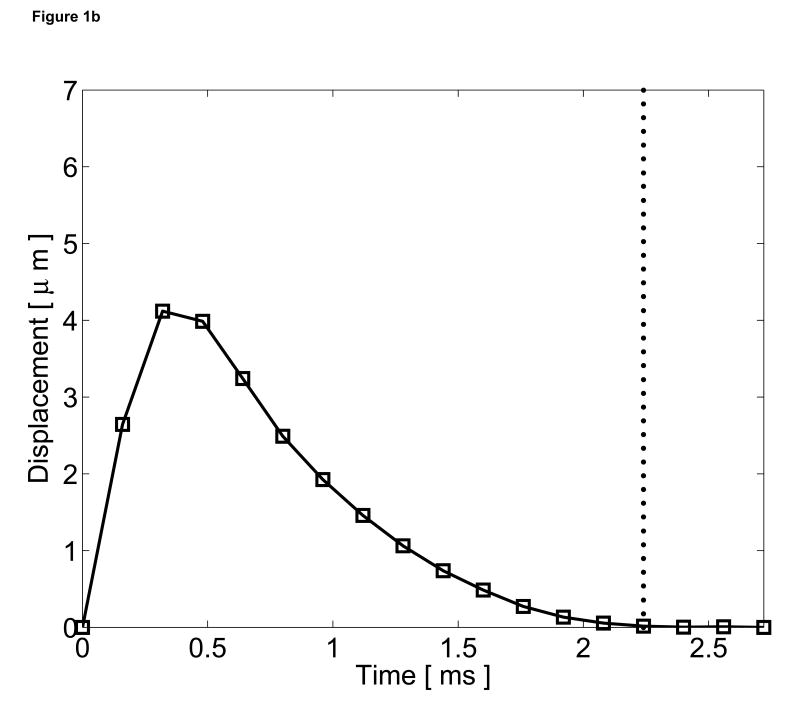
Excluding the origin, these coefficients can be determined with only two data points beyond the threshold time. The curve (Equation 2) is then subtracted from the entire displacement profile and the residual displacements are considered the tissue responses to the radiation force excitation. The quadratic motion filter operates on a pixel-by-pixel basis and calculates these coefficients at every spatial location based on displacements measured at each point. A graphical representation of this quadratic motion filter is shown in Figure 1.
Figure 1.
Graphical representation of the quadratic motion filter. (a) The original displacements (circle plot), measured using phase shift methods, include both cardiac motion artifacts and radiation force induced tissue displacements. A threshold time (vertical dotted line) is selected to reflect the time that the tissue is assumed to have recovered fully from the excitation pulse. A second-order polynomial (dashed line) is then fit from the origin to the displacements measured after the threshold time (starred points). (b) This curve is then subtracted from the original displacements, and the residual displacements (square plot) are considered the tissue response to the radiation force pulse.
As the heartbeat is a vigorous and complex process, it is likely that our quadratic approximation cannot accurately model this cardiac motion throughout the entire heartbeat. As a result, it is necessary to evaluate the performance of this motion filter at all points of the cardiac cycle and determine the expected filter performance for cardiac ARFI imaging.
Experimental Procedure
We imaged the beating hearts of two canine subjects in this study approved by the Institutional Animal Care and Use Committee at Duke University conforming to the Research Animal Use Guidelines of the American Heart Association. Both animals weighed approximately 20 kg. The chest was opened for reasons unrelated to this study. An Aquaflex ultrasonically transparent 5 mm standoff pad (Parker Laboratories, Fairfield, NJ, USA) was placed between the heart and the transducer. The imaging probe was held in contact with the heart while attempting to maintain a fixed imaging plane for each acquisition. With canine heart rates above 100 beats per minute, it was questionable if subtle ARFI-induced displacements could be measured in the presence of vigorous cardiac motion. Therefore, the effectiveness of the quadratic motion filter in estimating and removing cardiac motion was first examined.
To assess potential physiological cardiac motion artifacts, three-line M-mode ARFI images of the left ventricular free wall were acquired at a 1.5 cm focus. Passive ARFI sequences, where the radiation force pulse transmit voltage was zero, were acquired. As these sequences provided no external excitation to the tissue, displacements within the images represent cardiac motion artifacts. The quadratic motion filter with a time threshold of 2.97 ms was used to approximate the cardiac motion. Previous studies of cardiac ARFI imaging have shown that myocardial tissue recovery occurs within 2-3 ms after cessation of the radiation force pulse(Fahey et al., 2005b). With the ARFI pulse sequences described in the previous section, five points (one reference and four post-threshold lines) were available to be used in determining the motion filter coefficients in Equation 4. The displacement profile was subtracted from the initial displacement estimates to produce a residual displacement plot. Along each of the three M-mode lines, the average residual displacements, measured 0.66 ms after cessation of the radiation force pulse, were calculated. The delay was set to the expected time for maximum tissue displacement response of myocardial tissue due to a radiation force pulse. Average residual displacements within a 3.9 mm axial window at a constant depth of 1.1 cm were plotted through time and matched with the corresponding ECG. This placed the regions of interest near the center of the ventricular wall. The plots were used to evaluate the expected levels of motion artifact within ARFI images at various points of the cardiac cycle.
Active three-line M-mode ARFI sequences, now including a 45 µs radiation force excitation pulse, were then acquired. The same quadratic motion filter was applied to the measured displacements. The resulting filtered displacements, which were measured 0.66 ms after cessation of the radiation force pulse within a 3.9 cm axial window at constant depth of 1.1 cm, were plotted with the corresponding ECG.
The transducer was placed on the right side of the heart and parallel to its long axis. From this viewing angle, the field of view contained both the right atrium and right ventricle. Two-dimensional B-mode and ARFI images, focused on the septum at a depth of 2.0 cm, were acquired for 3 seconds at a sampling rate of 10 Hz. The transducer was held in direct contact with the heart while maintaining a single imaging plane through the cardiac cycle. By holding the transducer in this manner, the transducer restricted the full expansion. Displacements within the septum in both chambers were examined and tracked through the entire cardiac cycle.
A radiofrequency ablation device (Cardiac Pathways, Sunnyvale, CA, USA) with a SteeroCath catheter (Boston Scientific, Natick, MA, USA) was used to perform a 20 Watt, 120 second ablation on the epicardial surface of the free wall of the left ventricle. The ablation site was manually irrigated with 0.9% saline. Following the ablation, a visibly discolored lesion was present that moved with the heart but would not be expected to contract nor change in mechanical stiffness through the cardiac cycle. The 5 mm standoff pad was placed on the heart and the transducer was centered directly over the ablation lesion. Two-dimensional B-mode and ARFI images were acquired with the transducer focused at 1.5 cm.
With the heart at normal sinus rhythm, multibeat synthesis was used to create tissue displacement plots through the cardiac cycle by sorting the 30 ARFI images with their relative times of acquisition between QRS complexes. Tissue displacements were plotted at two points within the myocardium (one in the center of the lesion; another in healthy tissue). The two plots were compared to track myocardial stiffness through the cardiac cycle.
To quantify physiological motion artifacts within the ARFI images of the lesion, 3-line M-mode ARFI sequences were acquired with the center M-mode line positioned directly over the lesion. The two outer M-mode lines were positioned over healthy, non-ablated tissue. Three-line M-mode ARFI images were acquired with and without radiation force pulse excitations and matched with the corresponding ECG trace. The sequences were focused at a depth of 1.5 cm while the points of interest were shifted towards the epicardial surface such that the center point would be inside the lesion. As the points of interest were shallow to the transmit focus, the maximum displacement and tissue recovery times associated with these points would occur later in time than at points around the focus(Palmeri et al., in press). As a result, displacements plots were made 1.3 ms after cessation of the radiation force pulse while the threshold time was set at 3.30 ms. With this time threshold, the four points were used to determine the motion filter coefficients in Equation 4. Displacements measured within the center beam were then compared to displacements measured from the two outer beams.
Results
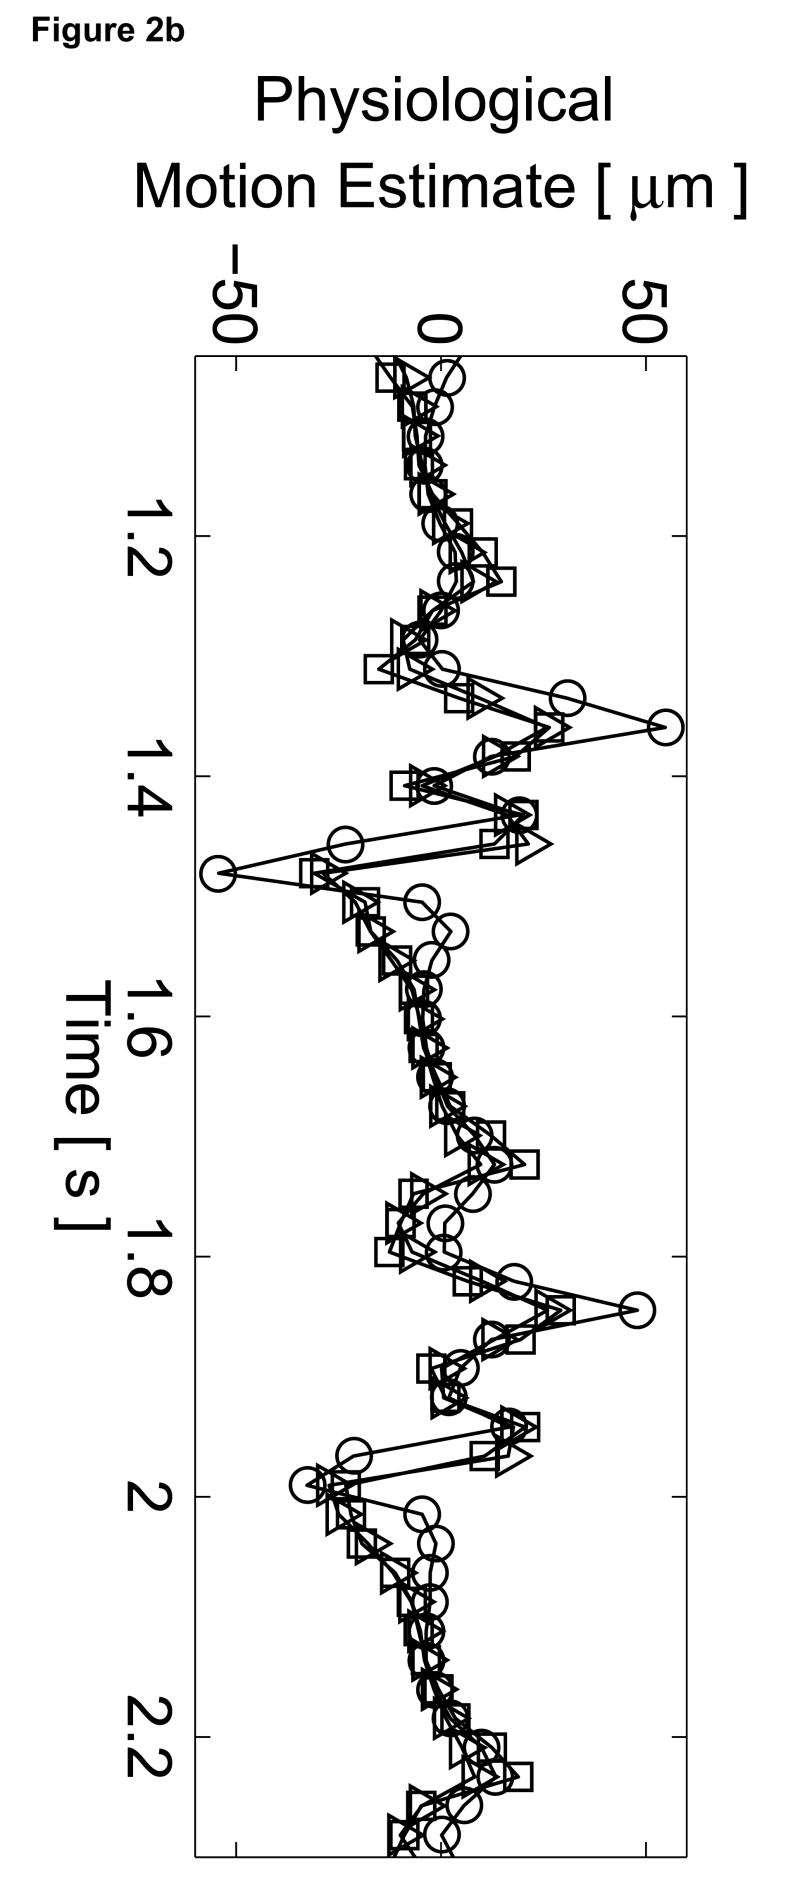
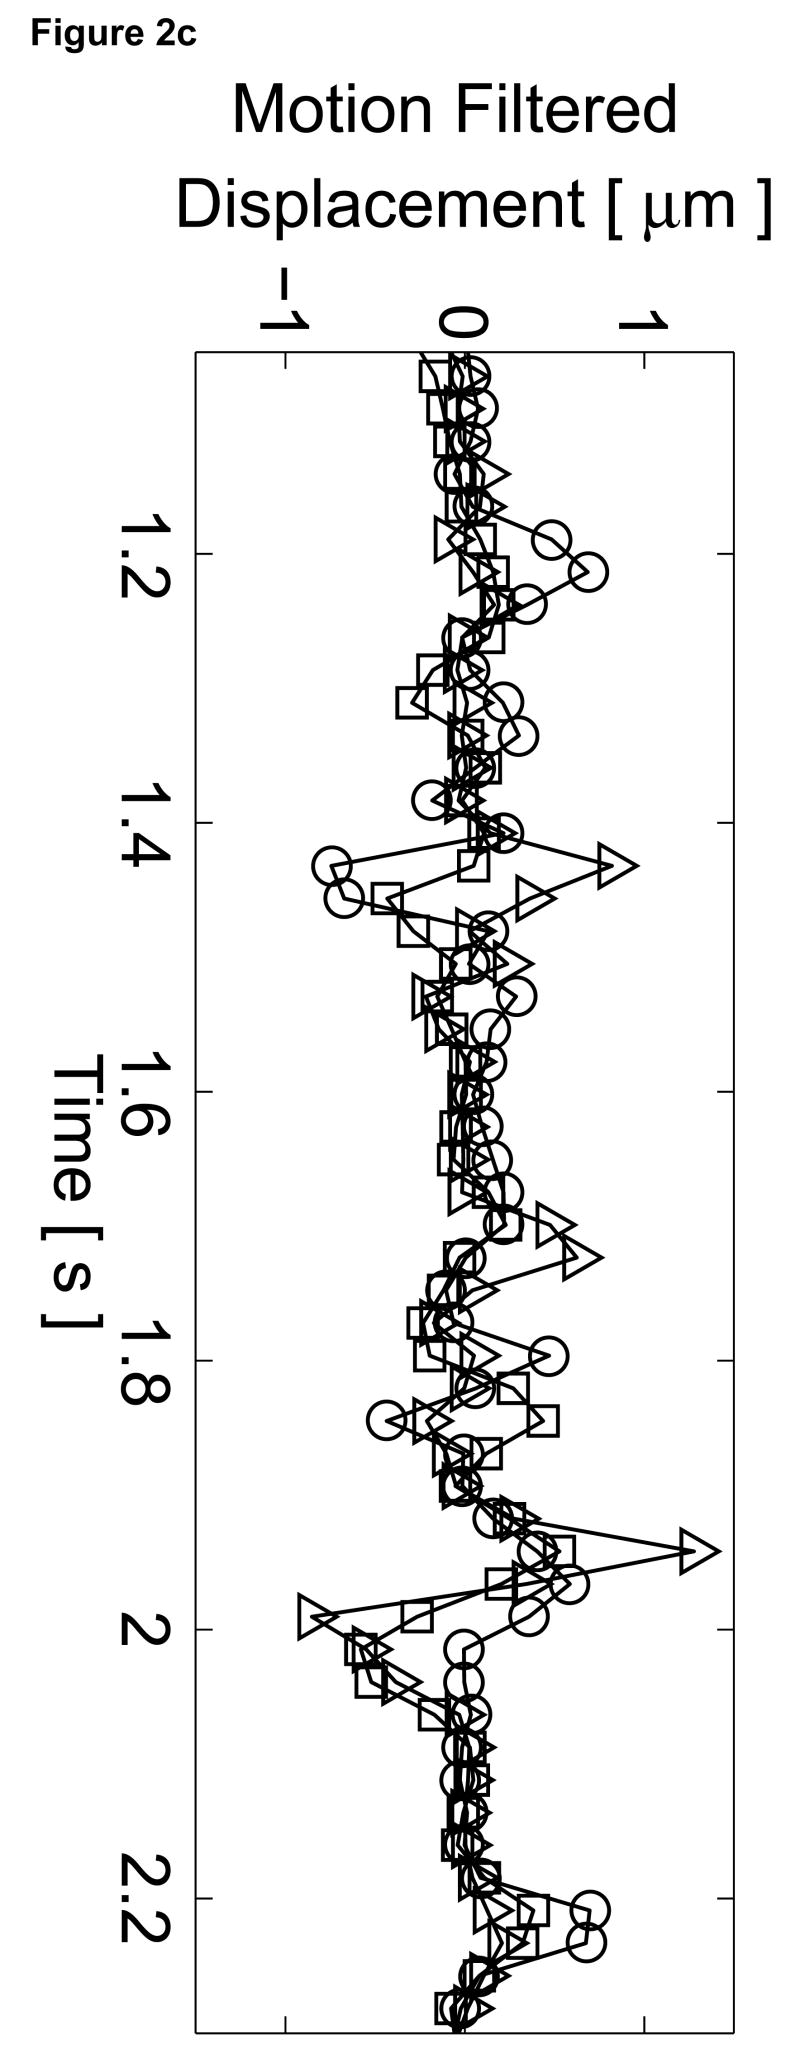
The B-mode image of the left ventricle with marked locations of the three M-mode ARFI lines is shown in Figure 2a. The locations of the three M-mode lines and points of interest are marked on the B-mode image. The residual motion filtered displacement plots from a zero excitation pulse amplitude sequence are shown in Figure 2c. The physiological tissue motion measured at the same time (0.66 ms) after cessation of the radiation force pulse is shown in Figure 2b. Ideally, the filtered displacements would be zero, indicating complete filtering of cardiac motion. However, as the cardiac motion increases and becomes more complex, the quadratic approximation of cardiac motion becomes less accurate and the tracking of local tissue motion– on which the filter is based– becomes noisier. As a result, displacement artifacts arise.
Figure 2.
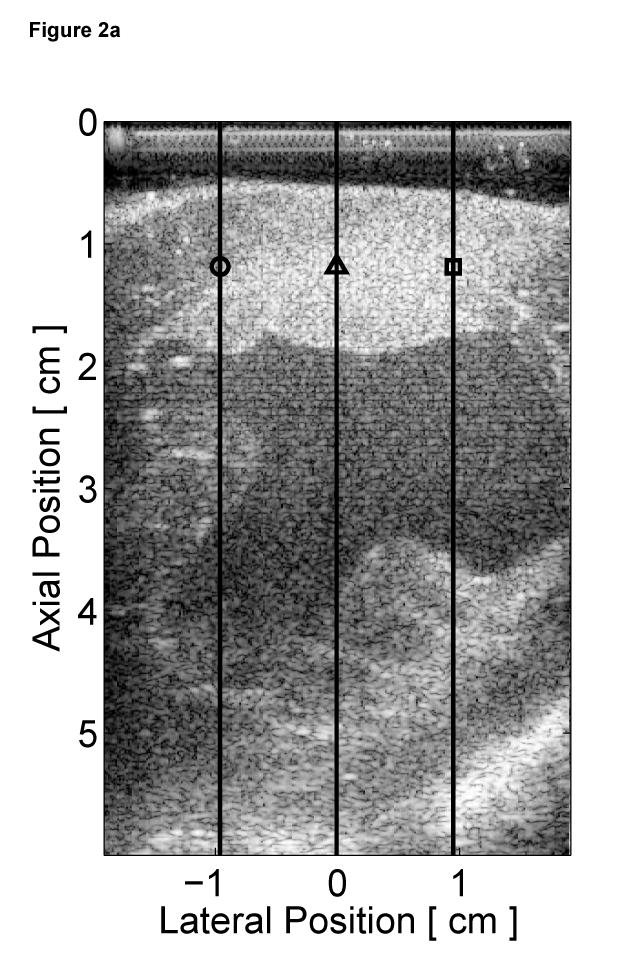
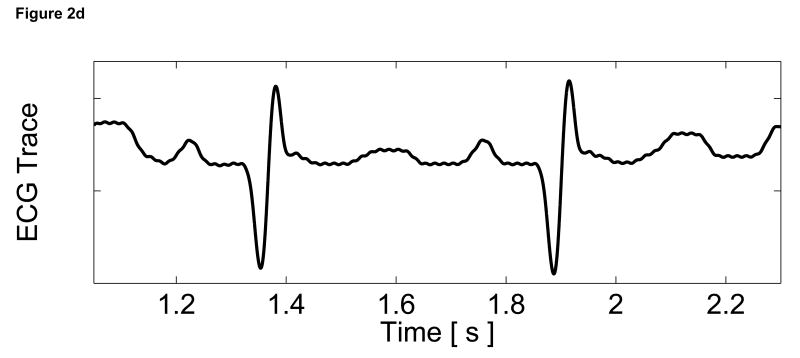
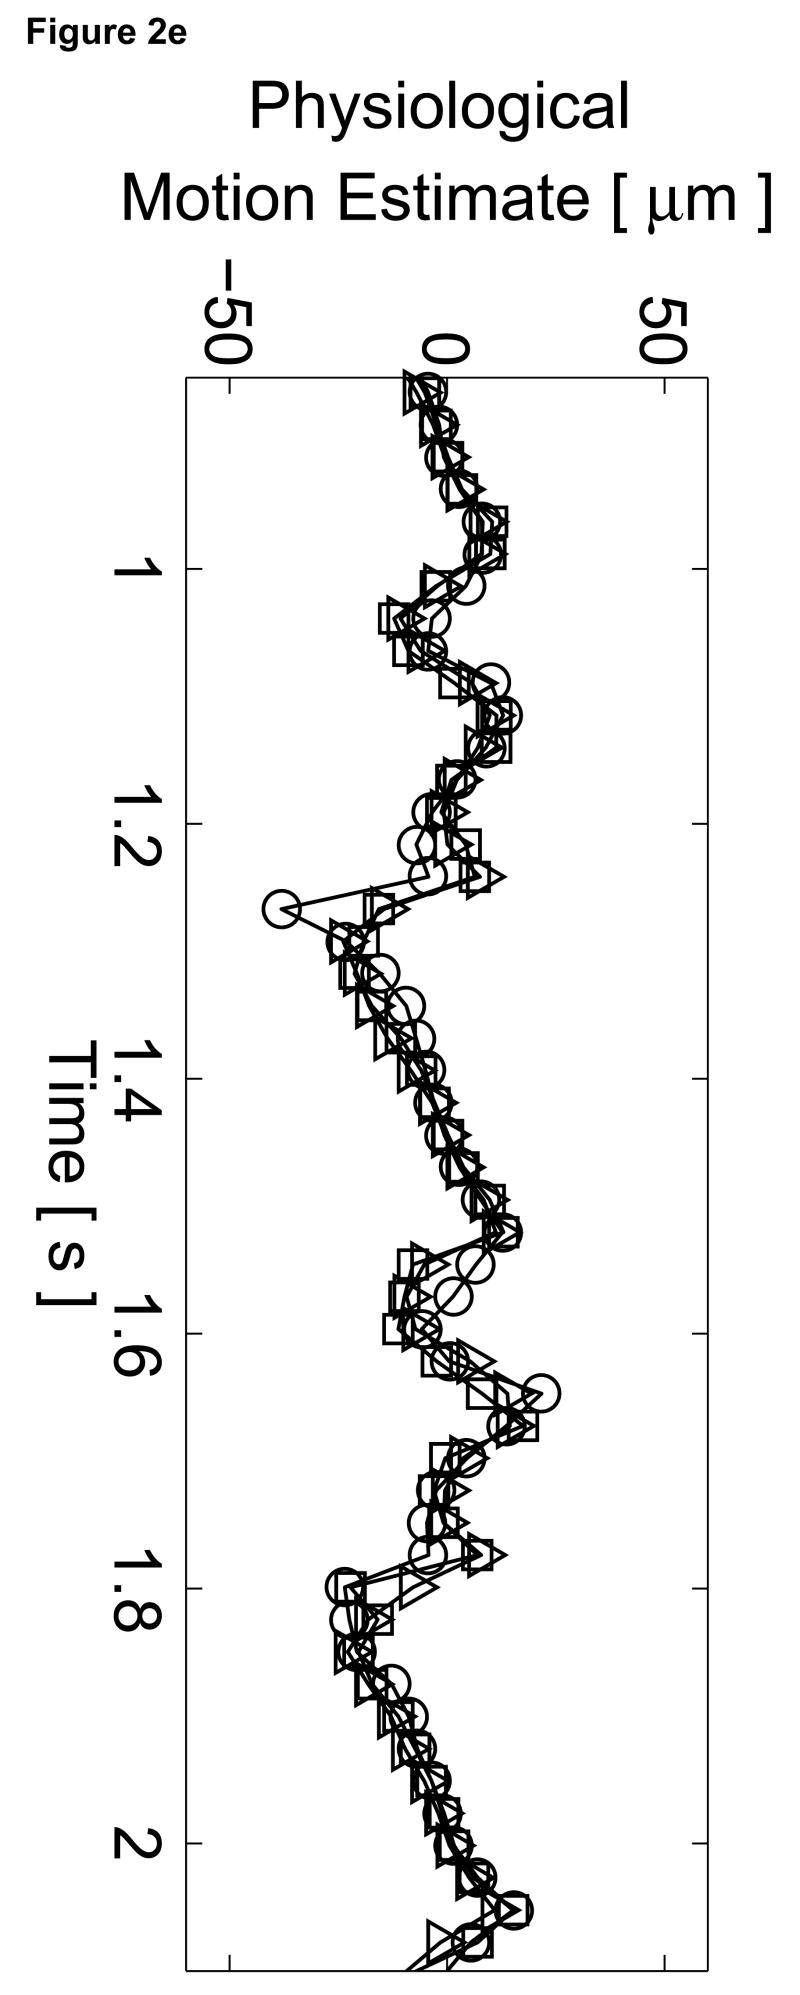
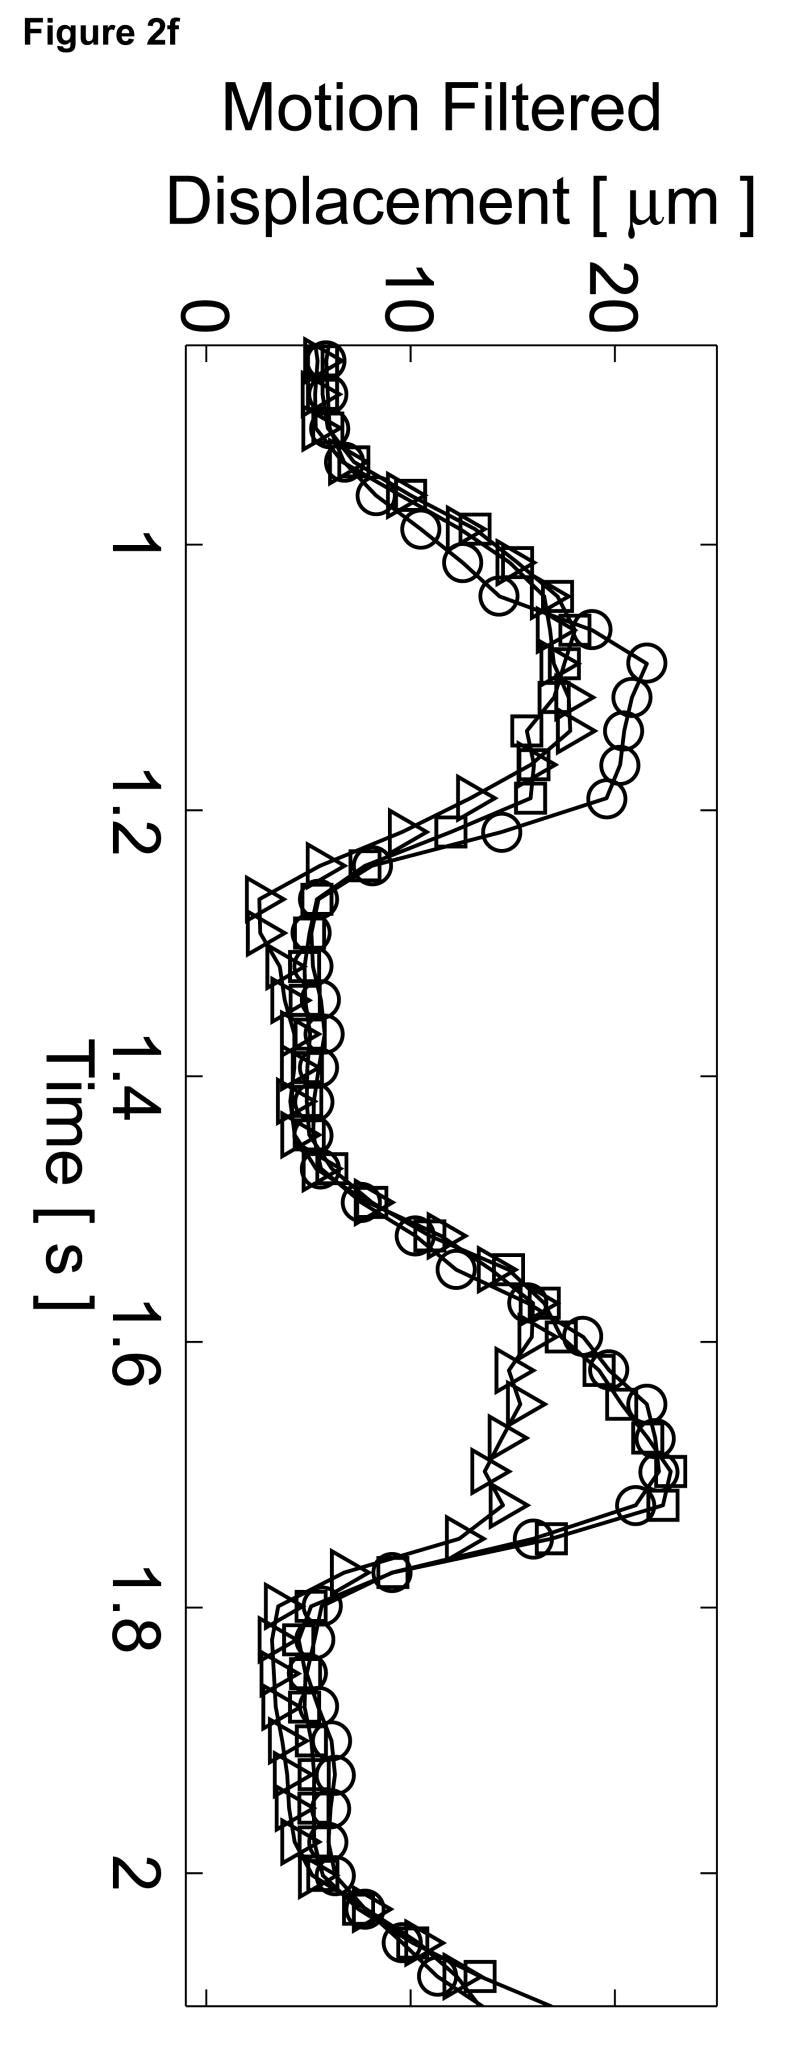
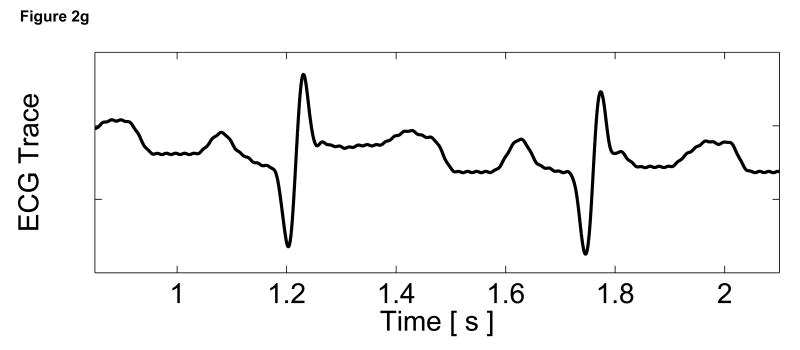
Matched B-mode image and plots from the three-line M-mode ARFI acquisitions of a healthy left ventricular free wall. The B-mode image (a) shows the left ventricle, with vertical lines indicating the lateral locations of the three M-mode lines. The points of interest for the subsequent plots are also marked by their respective shapes within the B-mode image. With zero pulse amplitude excitation, motion filtered displacements (c), measured 0.66 ms after cessation of the radiation force pulse, show residual artifacts with an average absolute displacement of 0.19 ± 0.26 µm. The estimated physiological motion (b), measured at the same time, show the greatest residual displacements occur with large tissue motion. The ECG (d) shows that these points coincide with ventricular systole. When the sequences were acquired with a 45 µs excitation pulse and matched with its corresponding ECG (g), ARFI-induced tissue displacements (f) show cyclic patterns with the minimum and maximum displacements measured during systole and late diastole, respectively. Physiological motion estimates (e) are comparable to those previously measured, suggesting that the levels of artifact within the displacements plots should also be similar.
The three residual displacement curves have similar magnitudes and profiles, with a 0.19 ± 0.26 µm average absolute residual displacement. When matched with the ECG in Figure 2d, the maximum absolute residual displacements of approximately 1.5 µm can be observed to occur around the QRS complexes. Physiologically, these points correspond to ventricular systole and myocardial contraction. Large physiological motion estimates measured at these points of the cardiac cycle suggests that greater tissue motion increases the uncertainty and error in the motion filter. The motion artifacts measured in passive ARFI sequences can be used to predict the levels of bias and error in subsequent ARFI acquisitions of the left ventricle. Tissue displacements measured for active ARFI acquisitions that include excitation pulses must be greater than these residual displacements in order to assure that they are due to variations in myocardial stiffness and not an artifact of cardiac motion.
The motion filtered displacement plots from the active three-line M-mode ARFI sequence that included high intensity excitation pulses are shown in Figure 2f. The three displacement plots have similar profiles and magnitudes, suggesting that ventricular myocardial stiffness and its variations through the cardiac cycle are relatively uniform. The plots show cyclic displacements with the differences between maximum and minimum displacements from each of the three lines greater than 12 µm. Tissue displacements at all three positions fall below 5 µm during systole, reflecting the fact that the ventricular myocardium has stiffened as it contracts. The average minimum systolic displacement is 3.96 ± 1.16 µm. After the T-wave, the heart is in ventricular diastole as the ventricles relax and become more compliant. Accordingly, tissue displacements for all three lines rise to their maximum values, above 15 µm. The average maximum diastolic displacement is 19.75 ± 2.97 µm. The average ratio between maximum diastolic to minimum systolic displacements is 5.3:1. Physiological motion estimates, shown in Figure 2e, have similar magnitudes though fewer spikes than measured in the previous passive ARFI acquisition. Thus, the levels of physiological motion artifact are likely to be comparable to those measured in the preceding null excitation acquisition.
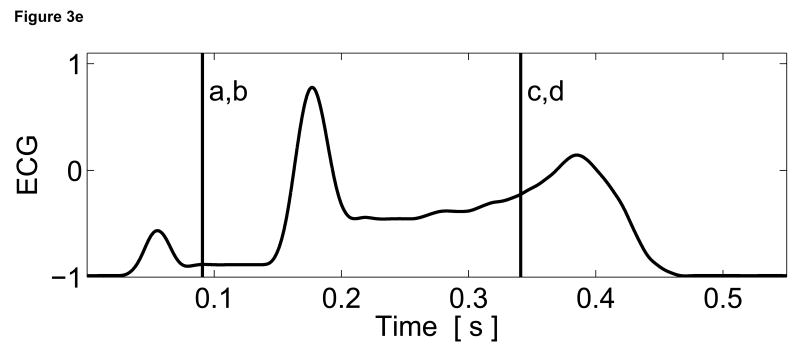
Two-dimensional ARFI images of the septum, formed across a 14 mm lateral field of view and a line density of 3.6 lines per millimeter, were acquired for three seconds at a frame rate of 10 Hz. Each image utilized twelve 45 µs radiation force pulses to interrogate the entire field of view. Two frames of matched B-mode and ARFI images at atrial and ventricular systole are shown in Figure 3. The right atrium (RA), right ventricle (RV) and tricuspid valve (TV) are labeled in the B-mode images (Figure 3a and c). The relative times of acquisition of the images are marked by the two vertical lines on the ECG in Figure 3e. The B-mode image acquired during atrial systole (Figure 3a) shows that the tricuspid valve has opened as the atria are contracting and blood is flowing into the ventricles. The corresponding ARFI image (Figure 3b) suggests that the atrial septum is stiffer than the ventricular septum as the tissue displacements in the atrial septum (∼2 µm) are lower than those measured within the ventricular septum (∼8 µm). Again, the difference in displacements between the two chambers is greater than the residual displacements measured in sequences without excitation pulses.
Figure 3.
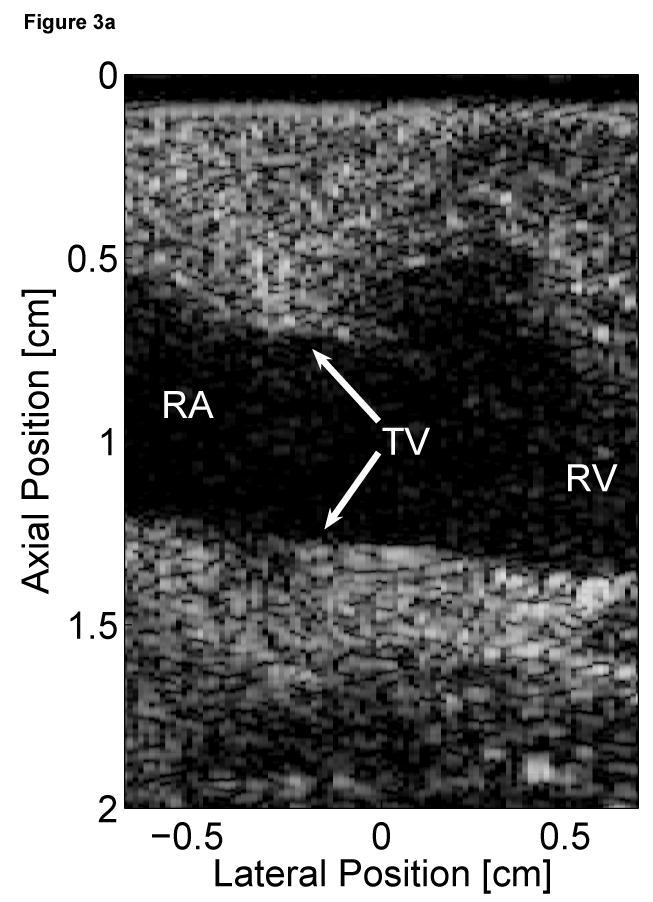
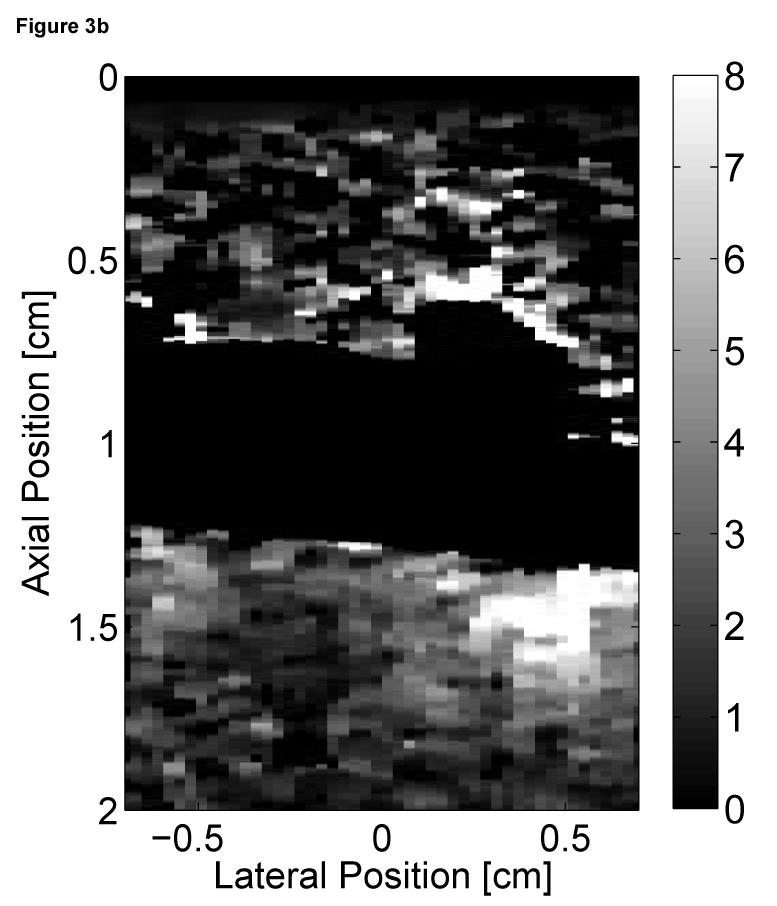
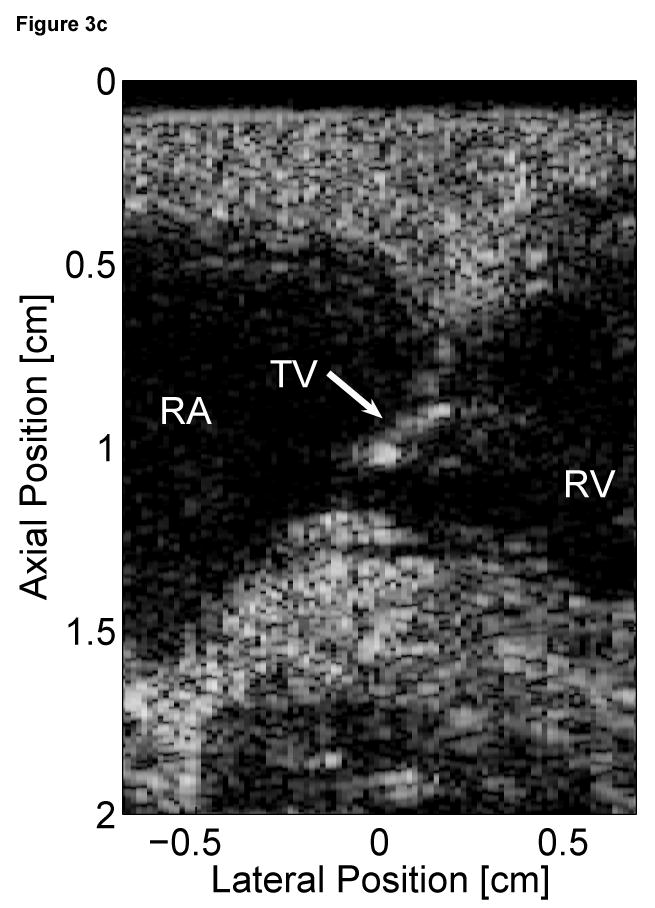
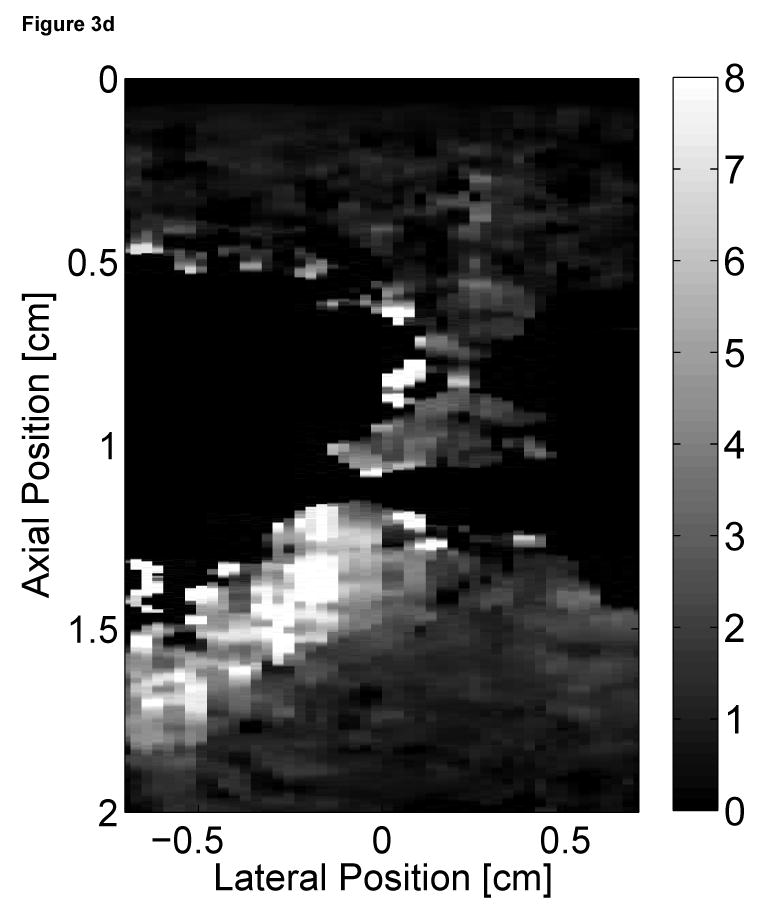
Matched B-mode and ARFI images along the long axis of the right side of the heart and its corresponding ECG (e). The images were focused at 2.0 cm on the septum. The right atrium (RA) is located on the left; the right ventricle (RV) is on the right; the tricuspid valve (TV) is between the two. The B-mode image of the heart during atrial contraction (a) shows that the TV has opened, allowing blood to flow into the RV as the atria contract and the ventricles relax. The corresponding ARFI image (b) reflects this trend as the stiffer atrial septum displaces (µm away from the transducer) less than the more compliant ventricular septum. The B-mode image of the heart during ventricular contraction (c) is shown with a closed TV. The ARFI image at this point (d) suggests the ventricular myocardium has stiffened as the displacements within the ventricular septum are small. Meanwhile, tissue displacements are larger within the atrial septum, suggesting that it is more compliant.
After the QRS complex, ventricular contraction is apparent within the B-mode image (Figure 3c) as the tricuspid valve has closed. The ventricular septum has stiffened as the ventricles eject blood out of the heart. Meanwhile, the atrial septum has become more complaint as the heart is also experiencing atrial diastole. The corresponding ARFI image (Figure 3d) reflects this trend as the displacements within the ventricular septum are small while tissue displacements within the atrial septum have increased. The difference in myocardial stiffness is comparable to what is observed during atrial systole.
Matched B-mode and ARFI images of the left ventricular free wall with a stiffer lesion on the epicardial surface at four points of the cardiac cycle are shown in Figure 4. The four B-mode images show a section of the myocardium changing thickness as the heart beats. However they provide little indication into the presence of a stiffer lesion. Conversely, the ARFI images show a hemispherical region of decreased displacement on the proximal surface of the tissue. Lesions boundaries were visually assessed from the ARFI images and are marked by the dashed lines within the B-mode images.
Figure 4.
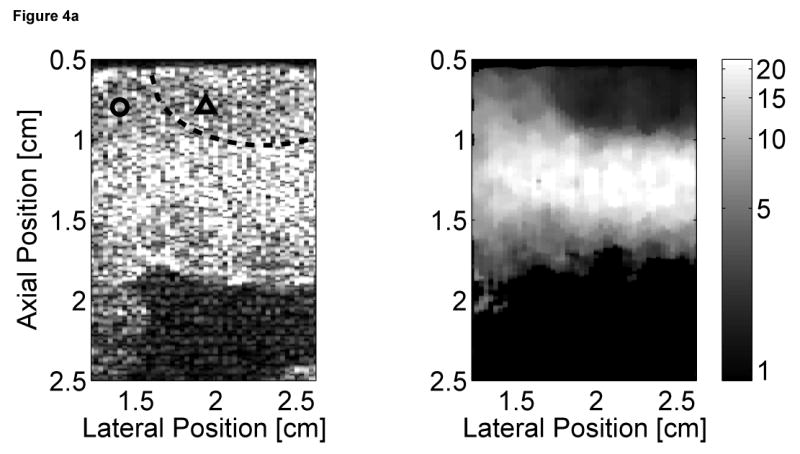
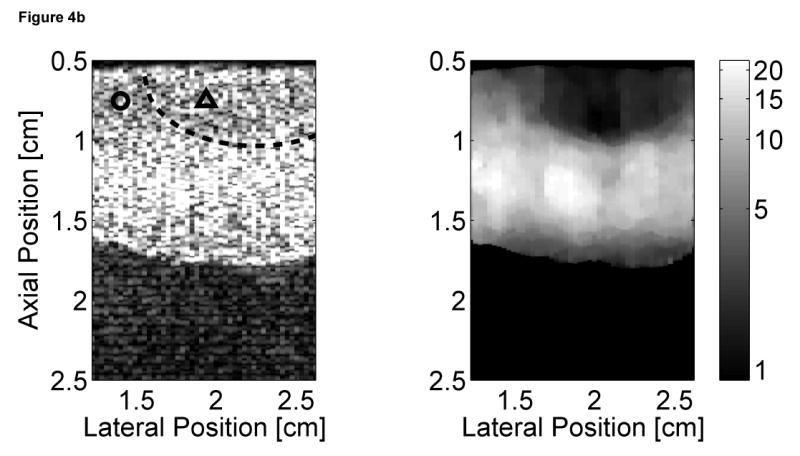
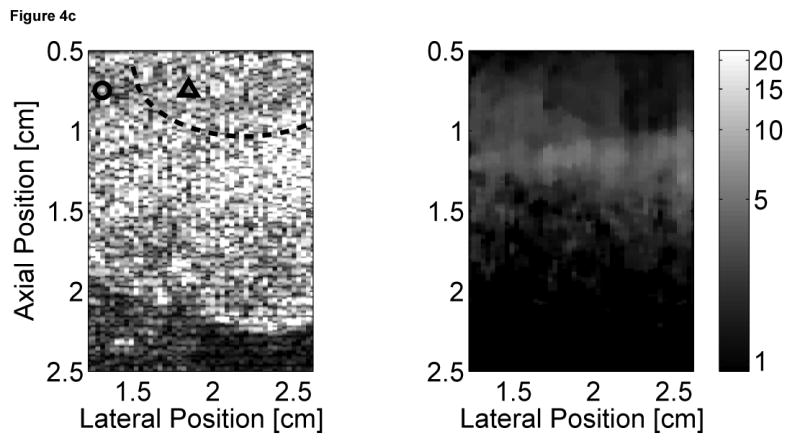
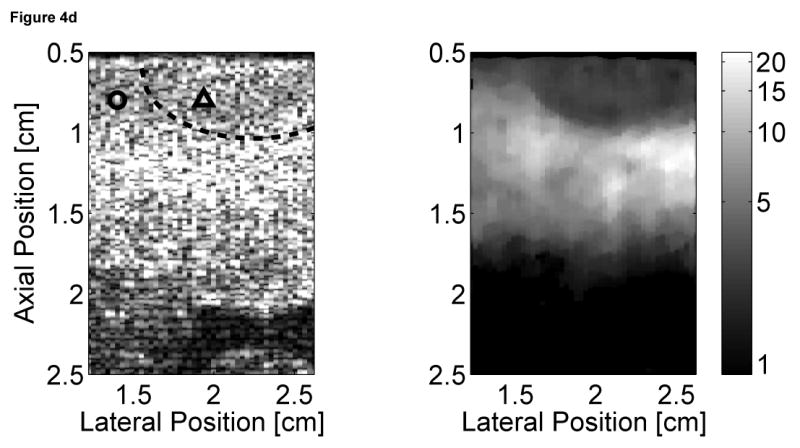
B-mode and ARFI images of the left ventricular free wall at various points of the cardiac cycle with a lesion on its epicardial surface. The approximated boundaries for the lesion are marked by the dashed lines within the B-mode images. When matched to the ECG (e), the images correspond to: (a) atrial systole, (b) atrial diastole, (c) ventricular systole, and (d) cardiac diastole. All four ARFI images show that displacements (µm away from the transducer) within the lesion are small and remain small during the entire heartbeat. In the surrounding healthy myocardium, tissue displacements change throughout the cardiac cycle. During ventricular systole, the displacements are small, indicating the myocardium has stiffened as it contracts. Using multibeat synthesis, displacement plots of a point inside and a point outside the lesion (f) reflect this trend as there is little variation in tissue displacements inside the lesion. Outside the lesion, the displacements are greater than 8 µm during diastole and are less than 4 µm during systole.
In all four ARFI images, displacements within the lesion are small and remain small throughout the cardiac cycle. This suggests that the lesion is functionally inactive and does not change in stiffness as the ventricles contract/relax. In contrast, tissue displacements of healthy myocardium surrounding the lesion are larger and vary throughout the cardiac cycle. During ventricular systole (Figure 4c), the myocardium stiffens, and the ARFI-induced displacements within healthy tissue decrease to a level where it is difficult to distinguish the hemispherical lesion from the surrounding non-ablated myocardium. The lesion is best visualized within the ARFI images during ventricular diastole (Figure 4a), when the healthy myocardium is most compliant. ARFI images of the left ventricular free wall in transition between systole and diastole are shown in Figure 4b and d.
Displacement plots at two selected points within the myocardium created via multibeat synthesis are shown in Figure 4f. The two selected regions of interest span a 1.7 mm × 1.7 mm window, and their positions are marked by their respective shapes in the four B-mode images. From these plots, the cyclic variation in tissue stiffness within healthy cardiac tissue becomes more apparent. After the QRS complex, tissue displacements within untreated tissue drop sharply. From contraction through relaxation, the average displacement for the region of healthy left ventricular myocardium was 2.76 ± 0.28 µm. Inside the lesion, the average displacement during this segment of the ECG was 2.23 ± 0.25 µm. Induced displacements within healthy myocardium gradually increase to be greater than 8 µm shortly after the T wave. After ventricular repolarization but before ventricular contraction, the average displacements in healthy and ablated tissue were 8.43 ± 0.79 µm and 3.54 ± 0.48 µm, respectively.
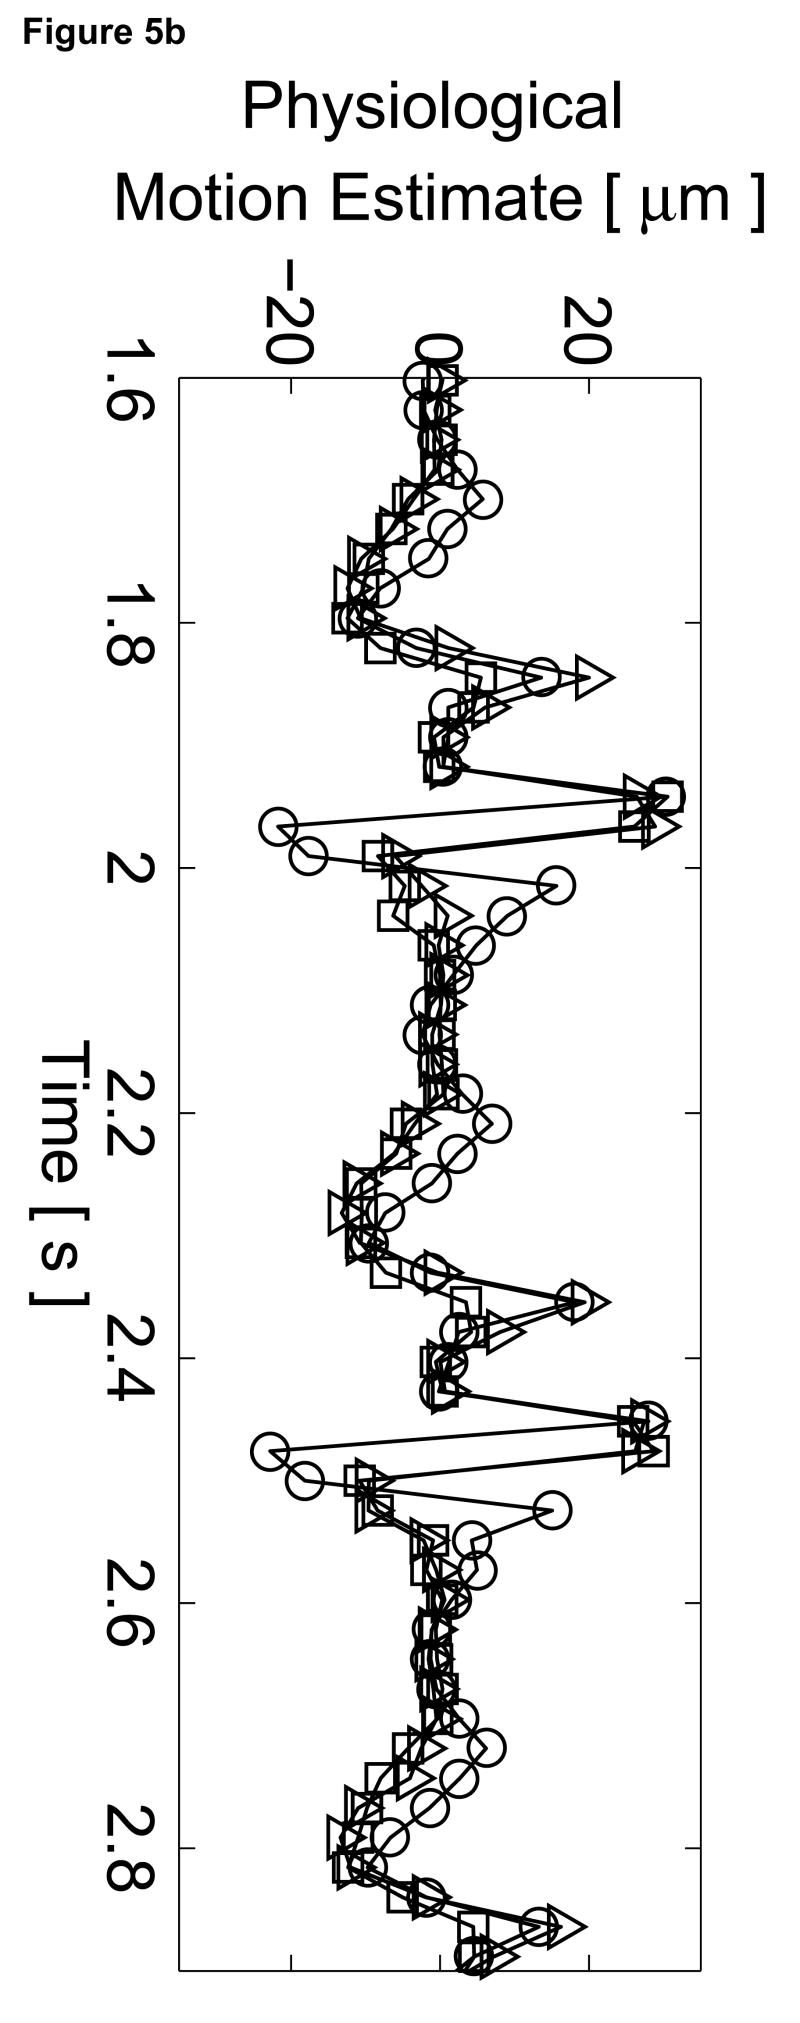
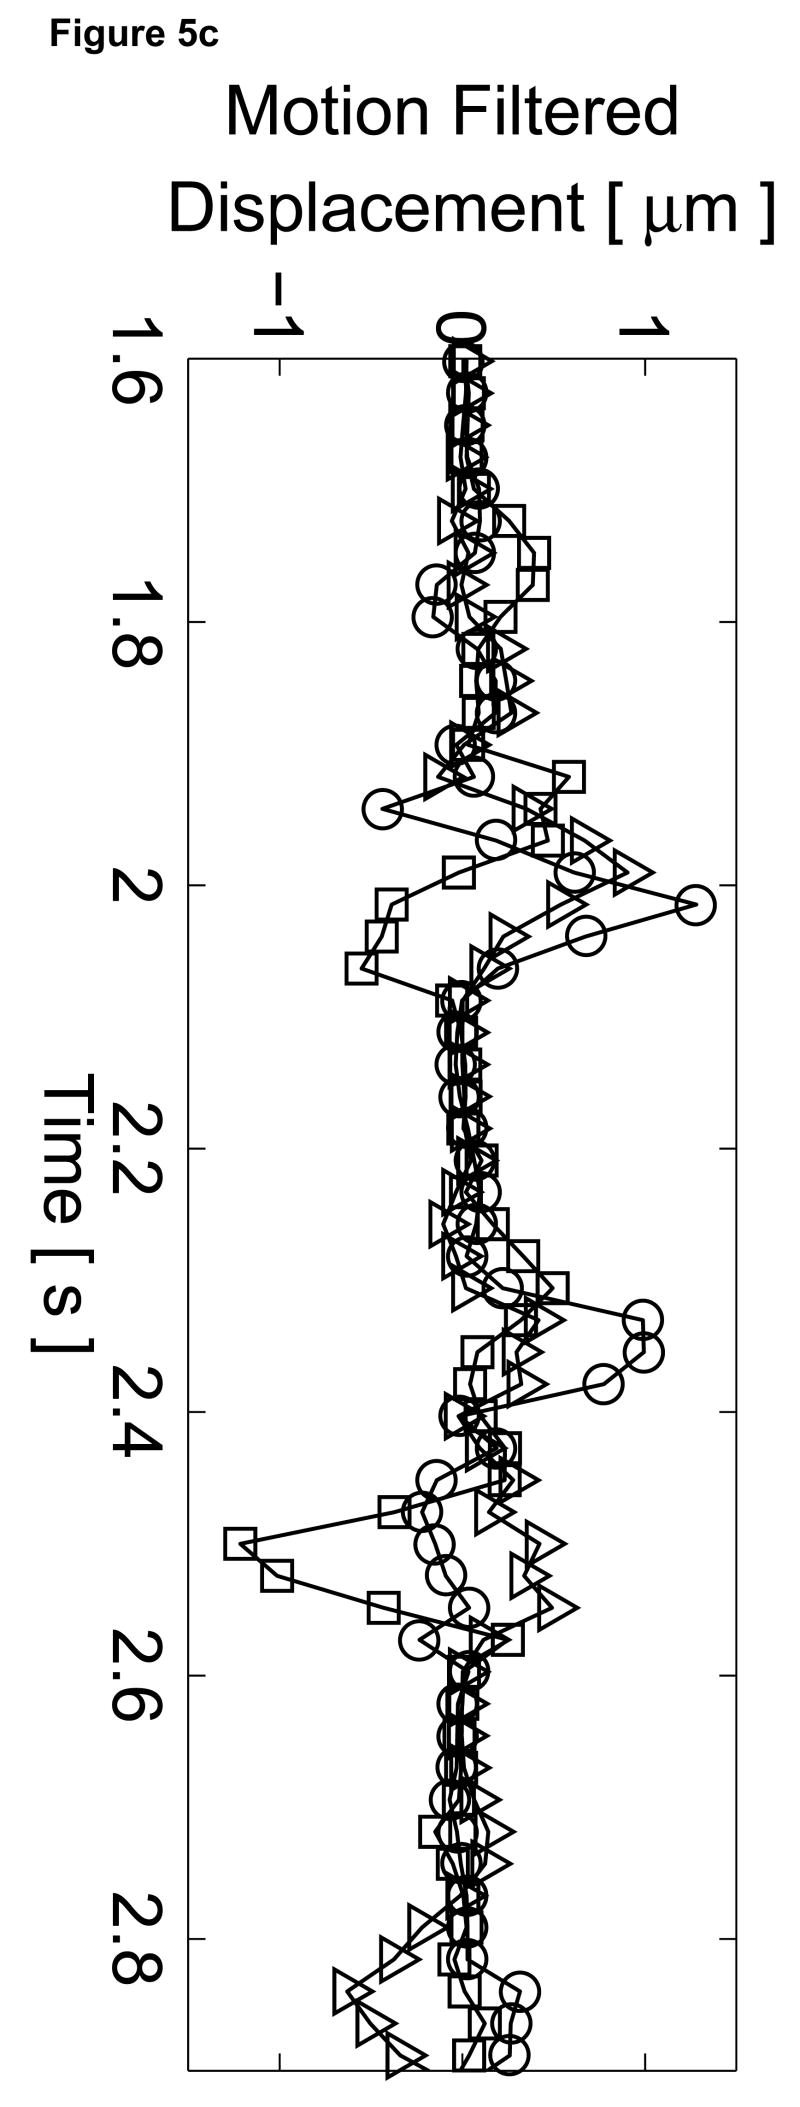
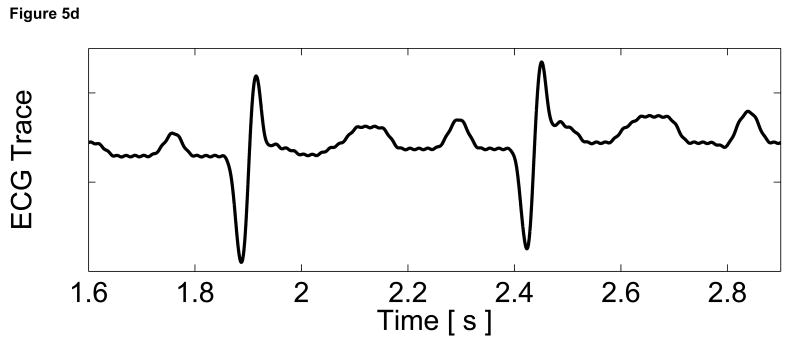
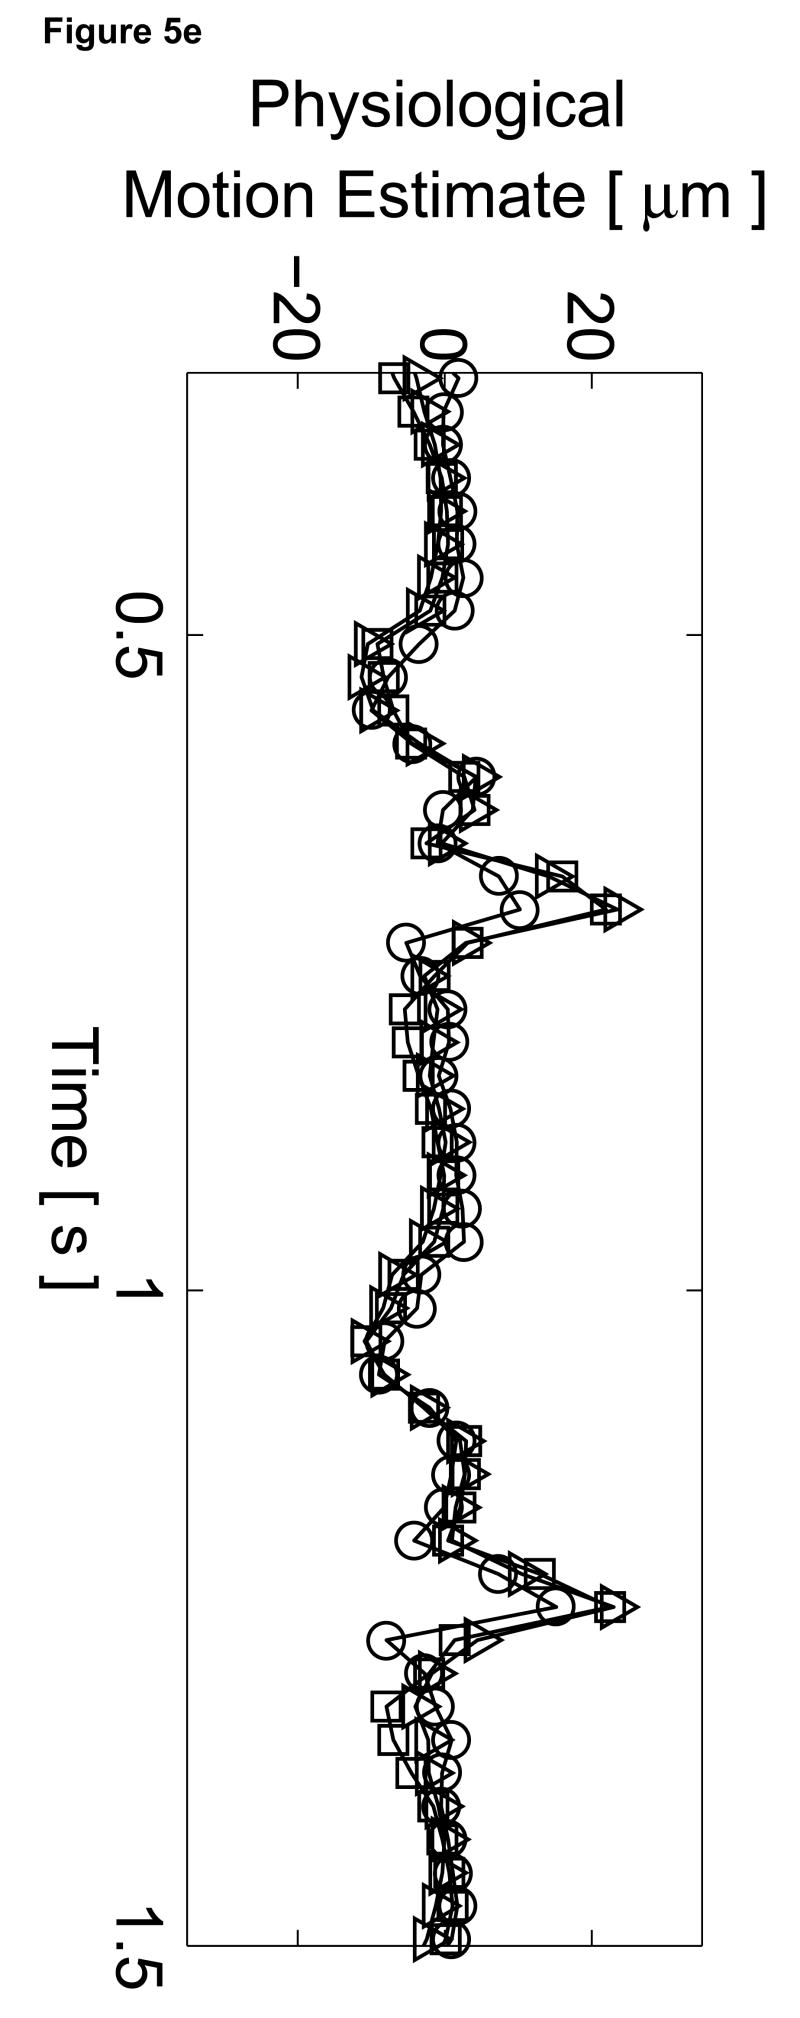
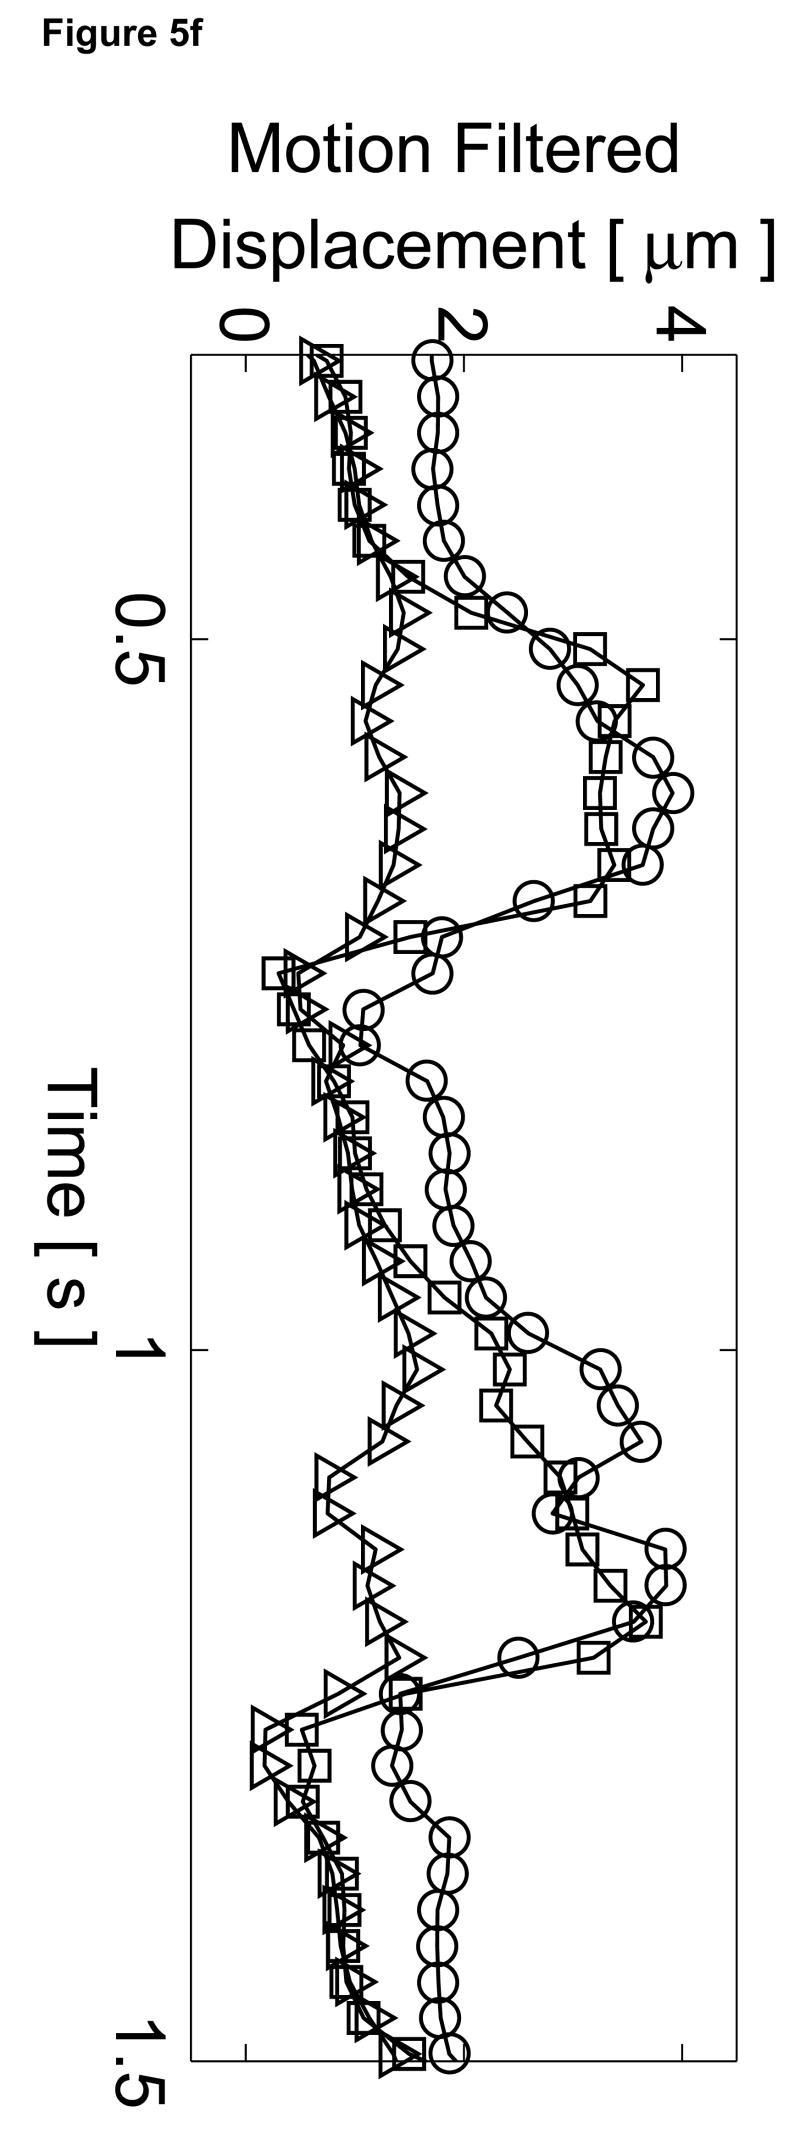
To assess the cardiac motion artifact within these images, three-line M-mode ARFI images were acquired. The B-mode image and three-line M-mode ARFI displacement plots are shown in Figure 5. The positions of the three displacement plots are marked by their respective shapes in the B-mode image in Figure 5a. The motion filtered displacements with the zero radiation force pulse amplitude sequences are shown in Figure 5c. The three plots are similar in shape and magnitude and provide little evidence to differentiate the center line containing the lesion from the other two. The largest residual displacements still occur around systole. The average absolute residual displacement of the three lines is 0.18 ± 0.24 µm and similar to displacements measured in the previous M-mode acquisition (Figure 5c). The physiological motion estimates (Figure 5b) shows a significant reduction in cardiac motion than from the previous acquisition. This is likely due to the fact that the regions of interest are at a shallower depth, which move less than deeper regions of tissue, relative to the in-contact transducer.
Figure 5.
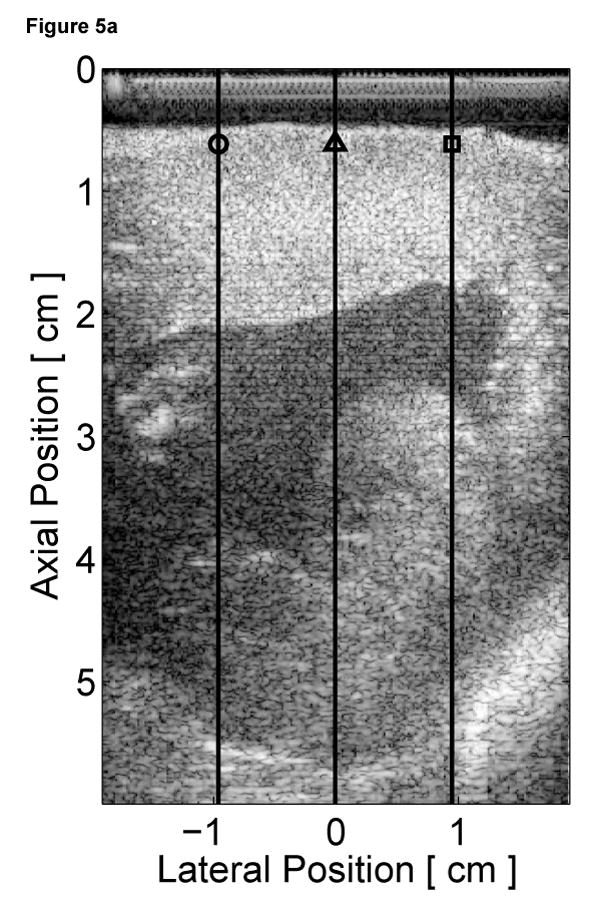
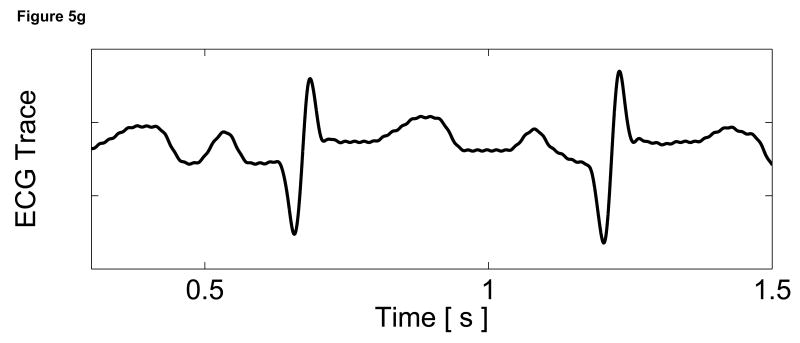
Matched B-mode and three-line M-mode ARFI displacement plots of the left ventricular free wall with a laterally-centered lesion on the proximal surface created via radiofrequency ablation. The motion filtered displacement plots (c), measured 1.3 ms after cessation of the radiation force pulse and produced from a zero pulse amplitude sequence, show small residual displacements with little variances between the center line and the outer two lines that do not contain the lesion. The motion filtered displacement from a sequence containing excitation pulses (f) show cyclic variations in tissue displacements that correspond to the myocardial stiffening during the cardiac cycle. The displacements inside the lesions do not rise above 1.5 µm. During ventricular diastole, displacements on the two outer lines within healthy myocardium are greater as they rise above 4.0 µm. The estimated physiological motion plots (b and e) show reduced tissue motion as the points of interest are now closer to the transducer.
The displacement plots from the three-line M-mode ARFI acquisition that included high intensity excitation pulses focused at 1.5 cm are shown in Figure 5f. The overall differences in maximum and minimum tissue displacements are also less than the previous three-line M-mode acquisition. As the radiation force pulses were focused at a greater depth than the regions of interest, the observed ARFI-induced displacements are also less. From this plot, it also can be observed that the two outer plots have a similar cyclic pattern with a systolic and diastolic displacement difference greater than 3 µm. For the center M-mode line containing the lesion, a cyclic variation of displacements is still present though the displacements are much smaller than measured in the two outer lines. The maximum displacements reaches only 1.5 µm during diastole while the difference between systolic and diastolic displacements is below 1 µm. During systole, the displacements inside the lesion are similar to those measured within the other two lines, indicating that the lesion is of comparable stiffness to the contracted myocardium. However, the reduced diastolic displacements and reduced levels of residual cardiac motion artifact confirm that the measured displacements are the result of the difference in mechanical properties between normal and ablated myocardium.
Discussion
Passive three-line M-mode ARFI acquisitions do not excite the tissue. Ideally, the motion filtered residual displacements are zero, indicating the complete removal of cardiac motion. The residual displacements that are measured within the passive ARFI images are a metric for the performance of the motion filters and reflect the levels of noise and bias expected during active ARFI imaging. More effective motion filters are currently being investigated to further reduce cardiac motion artifacts. As these motion filters are used to approximate the measured cardiac motion, they will not remove displacement artifacts caused by errors in tracking the tissue motion. Several factors, including out of beam motion and tissue shearing/rotation, introduce error into the displacement estimates. More accurate displacement estimators, such as normalized cross-correlation(Pinton et al., 2006), could provide better estimates of the displacements and therefore would be less susceptible to motion artifacts; however, the additional computational expense of these estimators must be considered for real-time applications.
Tissue displacements measured within the active three-line M-mode ARFI sequences (Figure 2e) are less than 5 µm during ventricular systole, reflecting the fact that the ventricular myocardium has stiffened during contraction. After the T-wave, the heart enters cardiac diastole, and the ventricles become more compliant. Accordingly, tissue displacements at this point of the cardiac cycle are above 10 µm and at their maximum values. The difference between systolic and diastolic ARFI displacements exceeds the measured residual displacements from the previous null excitation sequence. Therefore, observed variations in tissue displacements likely reflect changes in myocardial stiffness and not artifacts resulting from cardiac motion.
The three-line M-mode plots show mean measured displacements at a fixed axial depth in order to maintain a specific region of interest where the radiation force magnitude is believed to be constant. However, changes in any of the three variables from Equation 1 that determine radiation force magnitude will bias the measured displacements. Therefore, a degree of uncertainty is present when making stiffness comparisons as some of the differences in displacements could be due to variable radiation force magnitudes. Also, by fixing the imaging plane, the same section of the myocardium is not interrogated. As a result, spatial variations in stiffness with tissue depth will introduce error into the displacement plots.
Large variations among displacement estimates result in a large margin of uncertainty in the stiffness ratio, particularly because the smaller systolic displacement is the denominator term. In this study, the stiffness ratios are calculated only for regions of interest with large tissue displacements and therefore larger signal to noise ratio (SNR). Systolic displacements at the depth of the epicardial lesion were too small to calculate accurate stiffness ratios. In the displacements plots shown in Figure 2e, the regions of interest are close to the transmit focus of the radiation force pulse, and therefore the measured tissue displacements are higher. The 5.3:1 stiffness ratio for this region is comparable to the stiffness ratios measured in other studies. Jalil et al used indirect measurements of left ventricular pressure and weight and assumed spherical geometry to determine stress/strain relations within the heart(Jalil et al., 1989). The measured end-systolic to end-diastolic stiffness ratio from this method was 4.2:1. Jegger et al. (2006) used P-V analysis to derive an end-systolic to end-diastolic ratio of 13.2:1.
The two-dimensional ARFI images of the heart show the changes in local stiffness of the heart through the cardiac cycle. The ARFI images from the right side of the heart show the staggered atrioventricular contraction of the heart at the appropriate times during the ECG. ARFI images taken at four distinct points of the cardiac cycle also reflect the changes in myocardial stiffness as the muscle contracts and relaxes. The ARFI image acquired during diastole indicates that the untreated tissue has become more compliant as the displacements within those regions of myocardium are large. At this point, the lesion becomes most apparent within the ARFI images because the differences in myocardial stiffness between the lesion and surrounding tissue are at their greatest. During systole, tissue displacements within the untreated tissue are small, indicating that the tissue stiffened. In fact, tissue displacements are reduced to a level where it is difficult to distinguish the semicircular lesion from the surrounding untreated tissue.
The displacement versus time plot created from multibeat synthesis of untreated tissue shows myocardial stiffness changes throughout the cardiac cycle. The plot suggests that myocardial stiffening occurs quickly, as tissue displacement falls sharply from its peak value. Myocardial relaxation appears to be a more gradual process, as the slope returning to maximum diastolic displacement is shallower. This pattern reflects the rapid spread of electrical excitation that drives myocardial contraction and the gradual, more diffuse repolarization during relaxation(Haws and Lux, 1990).
During the active three-line M-mode ARFI acquisition of the lesion, a cyclic pattern is observed in all three displacement traces (Figure 2c). One would not expect the displacements within ablated tissue to vary. One explanation for these observed cyclical variations is that the transducer was not placed directly over the ablation site and the cross section of the lesion within this image is not of fully ablated tissue. It is also possible that the ablated tissue was stiffened by the contraction of the surrounding normal tissue. Nevertheless, the fact that the plot from the middle M-mode line has reduced displacements compared to those of the two outer lines suggests that a lesion is present. The B-mode images provide no such indication.
In order to create a real-time clinical system, further development is necessary. To be less invasive, ARFI images must be formed without exposing the heart. Expanding these methods to transducers better suited for cardiac imaging, such as phased array transthoracic, transesophageal (TEE) and intra-cardiac (ICE) echocardiography probes, is a viable option. The reduced output power from the smaller arrays associated with TEE and ICE is a concern. Investigations into abdominal ARFI imaging have suggested that transthoracic ARFI imaging with a handheld array would be capable of producing measurable displacements at the depth of the heart(Fahey et al., 2005a). However, the same factors that limit the applications of standard echocardiography, including restricted viewing angles and increased depth, will limit transthoracic ARFI imaging.
The ARFI images of the heart were formed from only a few viewing angles and are not a comprehensive evaluation of cardiac ARFI imaging. Further investigation and repeated experiments with multiple transducer orientations and viewing angles can assess the general applicability of cardiac ARFI imaging. These experiments can also be used to determine the influence of several myocardial properties, including tissue anisotropy and muscle fiber orientation, that can vary depending with transducer position and orientation.
Thermal safety concerns related to tissue heating due to ARFI imaging also need to be addressed for clinical acceptance. Finite element modeling of tissue heating associated with ARFI imaging has shown that the temperature increase from a single image is moderately low. However, heat accumulation during extended ARFI imaging is a concern(Fahey et al., 2007; Palmeri and Nightingale, 2004). In these experiments, the sampling rate was set to 10 Hz while acquisition times were limited to only three seconds. The maximum temperature rise of the transducer face for these sequences was measured to be approximately 4°C. Extended acquisition and higher sampling rates could possibly cause thermal damage to the tissue. One possible solution is to reduce the radiation force amplitude, which in turn, would reduce tissue and transducer heating. However, a reduction of radiation force pulse amplitude would also result in reduced displacements within the ARFI images. A decrease in the signal (tissue displacements) within the ARFI images is acceptable so long as the noise can also be reduced, thereby preserving the SNR. This can be accomplished by improving the displacement estimators and motion filters as previously discussed.
Conclusion
We present preliminary results demonstrating a method for real-time imaging of myocardial stiffness. The plots and images presented in the paper show cyclic displacement curves that reflect the changing mechanical properties of the heart during the heartbeat. The observed increases in myocardial stiffness within the ARFI images were correlated with myocardial contraction using the ECG. Also, real-time ARFI imaging is capable of visualizing an ablation lesion and demonstrates that the ablated tissue has smaller variations in stiffess through the cardiac cycle than the surrounding untreated myocardium. These results show the potential clinical utility of real-time cardiac ARFI imaging.
Acknowledgments
This research was funded by NIH Grants #: 1R01-HL-075485-01 and 1R01-EB-002132-04. We would like to thank Siemens Medical Solutions USA, Inc. for their hardware and system support. We would also like to thank: Brian Fahey, Joshua Baker-LePain, David Bradway, Brett Byram, Jeremy Dahl, Ellen Dixon-Tulloch, Gianmarco Pinton, Liang Zhai, and Kathryn Nightingale.
Footnotes
Publisher's Disclaimer: This is a PDF file of an unedited manuscript that has been accepted for publication. As a service to our customers we are providing this early version of the manuscript. The manuscript will undergo copyediting, typesetting, and review of the resulting proof before it is published in its final citable form. Please note that during the production process errors may be discovered which could affect the content, and all legal disclaimers that apply to the journal pertain.
References
- Amundsen BH, Helle-Valle T, Edvardsen T, Torp H, Crosby J, Lyseggen E, Stoylen A, Ihlen H, Lima JA, Smiseth OA, Slordahl SA. Noninvasive myocardial strain measurement by speckle tracking echocardiography: validation against sonomicrometry and tagged magnetic resonance imaging. J Am Coll Cardiol. 2006;47(4):789–793. doi: 10.1016/j.jacc.2005.10.040. [DOI] [PubMed] [Google Scholar]
- Baldwin SL, Marutyan KR, Yang M, Wallace KD, Holland MR, Miller JG. Measurements of the anisotropy of ultrasonic attenuation in freshly excised myocardium. J Acoust Soc Am. 2006;119(5 Pt 1):3130–3139. doi: 10.1121/1.2188333. [DOI] [PubMed] [Google Scholar]
- Bercoff J, Chaffai S, Tanter M, Fink M. Ultrafast imaging of beamformed shear waves induced by the acoustic ratiaion foce in soft tissues: Application to transient elastography. Proceedings of the 2002 IEEE Ultrasonics Symposium; 2002. [Google Scholar]
- Borbély A, van der Velden J, Papp Z, Bronzwaer JG, Edes I, Stienen GJ, Paulus WJ. Cardiomyocyte stiffness in diastolic heart failure. Circulation. 2005;111(6):774–781. doi: 10.1161/01.CIR.0000155257.33485.6D. [DOI] [PubMed] [Google Scholar]
- Cingolani OH, Yang XP, Cavasin MA, Carretero OA. Increased systolic performance with diastolic dysfunction in adult spontaneously hypertensive rats. Hypertension. 2003;41(2):249–254. doi: 10.1161/01.hyp.0000052832.96564.0b. [DOI] [PubMed] [Google Scholar]
- Dahl J, Pinton G, Palmeri M, Agrawal V, Nightingale K, Trahey G. A parallel tracking method for acoustic radiation force impulse imaging. IEEE Transactions on Ultrasonics, Ferroelectronics and Frequency Control. 2006 doi: 10.1109/tuffc.2007.244. accepted. [DOI] [PMC free article] [PubMed] [Google Scholar]
- D'hooge J, Konofagou E, Jamal F, Heimdal A, Barrios L, Bijnens B, Thoen J, Van de Werf F, Sutherland G, Suetens P. Two-dimensional ultrasonic strain rate measurement of the human heart in vivo. IEEE Trans Ultrason Ferroelectr Freq Control. 2002;49(2):281–286. doi: 10.1109/58.985712. [DOI] [PubMed] [Google Scholar]
- Fahey B, Nightingale K, Nelson R, Palmeri M, Trahey G. Acoustic radiation force impulse imaging of the abdomen: demonstration of feasibility and utility. Ultrasound Med Biol. 2005a;31(9):1185–1198. doi: 10.1016/j.ultrasmedbio.2005.05.004. [DOI] [PubMed] [Google Scholar]
- Fahey B, Nightingale K, Stutz D, Trahey G. Acoustic radiation force impulse imaging of thermally- and chemically-induced lesions in soft tissues: preliminary ex vivo results. Ultrasound in Medicine and Biology. 2004;30(3):321–328. doi: 10.1016/j.ultrasmedbio.2003.11.012. [DOI] [PubMed] [Google Scholar]
- Fahey B, Nightingale K, Wolf P, Trahey G. Acoustic radiation force impulse imaging of myocardial radiofrequency ablation: Initial in vivo results. IEEE Transactions on Ultrasonics, Ferroelectronics and Frequency Control. 2005b;52(4):631–641. doi: 10.1109/tuffc.2005.1428046. [DOI] [PubMed] [Google Scholar]
- Fahey B, Palmeri M, Trahey G. Frame rate considerations for abdominal acoustic radiation force impulse imaging. Ultrasonic Imaging. 2007 doi: 10.1177/016173460602800401. accepted. [DOI] [PMC free article] [PubMed] [Google Scholar]
- Garot J, Derumeaux GA, Monin JL, Duval-Moulin AM, Simon M, Pascal D, Castaigne A, Dubois-Randé JL, Diebold B, Guéret P. Quantitative systolic and diastolic transmyocardial velocity gradients assessed by m-mode colour doppler tissue imaging as reliable indicators of regional left ventricular function after acute myocardial infarction. Eur Heart J. 1999;20(8):593–603. doi: 10.1053/euhj.1998.1335. [DOI] [PubMed] [Google Scholar]
- Gerber BL, Garot J, Bluemke DA, Wu KC, Lima JA. Accuracy of contrast-enhanced magnetic resonance imaging in predicting improvement of regional myocardial function in patients after acute myocardial infarction. Circulation. 2002;106(9):1083–1089. doi: 10.1161/01.cir.0000027818.15792.1e. [DOI] [PubMed] [Google Scholar]
- Haws C, Lux R. Correlation between in vivo transmembrane action potential durations and activation-recovery intervals from electrograms. effects of interventions that alter repolarization time. Circulation. 1990;81(1):281–288. doi: 10.1161/01.cir.81.1.281. [DOI] [PubMed] [Google Scholar]
- Heimdal A, Stoylen A, Torp H, Skjaerpe T. Real-time strain rate imaging of the left ventricle by ultrasound. J Am Soc Echocardiogr. 1998;11(11):1013–1019. doi: 10.1016/s0894-7317(98)70151-8. [DOI] [PubMed] [Google Scholar]
- Herbots L, Maes F, D'hooge J, Claus P, Dymarkowski S, Mertens P, Mortelmans L, Bijnens B, Bogaert J, Rademakers FE, Sutherland GR. Quantifying myocardial deformation throughout the cardiac cycle: a comparison of ultrasound strain rate, grey-scale m-mode and magnetic resonance imaging. Ultrasound Med Biol. 2004;30(5):591–598. doi: 10.1016/j.ultrasmedbio.2004.02.003. [DOI] [PubMed] [Google Scholar]
- Hsu S, Fahey B, Dumont D, Wolf P, Trahey G. Challenges and implementation of radiation force imaging with an intra-cardiac ultrasound transducer. IEEE Transactions on Ultrasonics, Ferroelectronics and Frequency Control. 2007 doi: 10.1109/tuffc.2007.345. accepted. [DOI] [PMC free article] [PubMed] [Google Scholar]
- Jalil JE, Doering CW, Janicki JS, Pick R, Shroff SG, Weber KT. Fibrillar collagen and myocardial stiffness in the intact hypertrophied rat left ventricle. Circ Res. 1989;64(6):1041–1050. doi: 10.1161/01.res.64.6.1041. [DOI] [PubMed] [Google Scholar]
- Jegger D, Mallik AS, Nasratullah M, Jeanrenaud X, da Silva R, Tevaearai H, von Segesser LK, Stergiopulos N. The effect of a myocardial infarction on the normalized time-varying elastance curve. J Appl Physiol. 2006 doi: 10.1152/japplphysiol.00976.2006. [DOI] [PubMed] [Google Scholar]
- Kasai C, Namekawa K. Real-time two-dimensional blood flow imaging using an autocorrelation technique. IEEE Transactions on Ultrasonics, Ferroelectronics and Frequency Control. 1985;32:458–463. [Google Scholar]
- Kawaguchi M, Hay I, Fetics B, Kass D. Combined ventricular systolic and arterial stiffening in patients with heart failure and preserved ejection fraction: Implications for systolic and diastolic reserve limiations. Circulation. 2003;107:714–720. doi: 10.1161/01.cir.0000048123.22359.a0. [DOI] [PubMed] [Google Scholar]
- Kheradvar A, Milano M, Gorman R, Gorman J, Gharib M. Assessment of left ventricular viscoelastic components based on ventricular harmonic behavior. Cardiovascular Engineering: An International Journal. 2006;6(1):31–39. doi: 10.1007/s10558-006-9001-9. [DOI] [PubMed] [Google Scholar]
- Klein C, Nekolla SG, Bengel FM, Momose M, Sammer A, Haas F, Schnackenburg B, Delius W, Mudra H, Wolfram D, Schwaiger M. Assessment of myocardial viability with contrast-enhanced magnetic resonance imaging: comparison with positron emission tomography. Circulation. 2002;105(2):162–167. doi: 10.1161/hc0202.102123. [DOI] [PubMed] [Google Scholar]
- Konofagou E, D'hooge J, Ophir J. Myocardial elastography–a feasibility study in vivo. Ultrasound Med Biol. 2002;28(4):475–482. doi: 10.1016/s0301-5629(02)00488-x. [DOI] [PubMed] [Google Scholar]
- Koyama Y, Mochizuki T, H J. Computed tomography assessment of myocardial perfusion, viability, and function. Journal of Magnetic Resonance Imaging. 2004;19:800–815. doi: 10.1002/jmri.20067. [DOI] [PubMed] [Google Scholar]
- Langeland S, D'hooge J, Claessens T, Claus P, Verdonck P, Suetens P, Sutherland GR, Bijnens B. Rf-based two-dimensional cardiac strain estimation: a validation study in a tissue-mimicking phantom. IEEE Trans Ultrason Ferroelectr Freq Control. 2004;51(11):1537–1546. doi: 10.1109/tuffc.2004.1367495. [DOI] [PubMed] [Google Scholar]
- Lardo AC, McVeigh ER, Jumrussirikul P, Berger RD, Calkins H, Lima J, Halperin HR. Visualization and temporal/spatial characterization of cardiac radiofrequency ablation lesions using magnetic resonance imaging. Circulation. 2000;102(6):698–705. doi: 10.1161/01.cir.102.6.698. [DOI] [PubMed] [Google Scholar]
- Lyseggen E, Skulstad H, Helle-Valle T, Vartdal T, Urheim S, Rabben SI, Opdahl A, Ihlen H, Smiseth OA. Myocardial strain analysis in acute coronary occlusion: a tool to assess myocardial viability and reperfusion. Circulation. 2005;112(25):3901–3910. doi: 10.1161/CIRCULATIONAHA.105.533372. [DOI] [PubMed] [Google Scholar]
- McVeigh ER. MRI of myocardial function: motion tracking techniques. Magn Reson Imaging. 1996;14(2):137–150. doi: 10.1016/0730-725x(95)02009-i. [DOI] [PubMed] [Google Scholar]
- Micari A, Pascotto M, Jayaweera AR, Sklenar J, Goodman NC, Kaul S. Cyclic variation in ultrasonic myocardial integrated backscatter is due to phasic changes in the number of patent myocardial microvessels. J Ultrasound Med. 2006;25(8):1009–1019. doi: 10.7863/jum.2006.25.8.1009. [DOI] [PubMed] [Google Scholar]
- Mirsky I, Tajimi T, P KL. The development of the entire end systolic pressure-volume and ejection fraction-afterload relations: a new concept of systolic myocardial stiffness. Circ Res. 1987;76:343–356. doi: 10.1161/01.cir.76.2.343. [DOI] [PubMed] [Google Scholar]
- Nakano K, Sugawara M, Ishihara K, Kanazawa S, Corin WJ, Denslow S, Biederman RW, Carabello BA. Myocardial stiffness derived from end-systolic wall stress and logarithm of reciprocal of wall thickness. contractility index independent of ventricular size. Circulation. 1990;82(4):1352–1361. doi: 10.1161/01.cir.82.4.1352. [DOI] [PubMed] [Google Scholar]
- Nightingale K, Bentley R, Trahey G. Observations of tissue response to acoustic radiation force: Opportunities for imaging. Ultrasonic Imaging. 2002a;24:100–108. doi: 10.1177/016173460202400301. [DOI] [PubMed] [Google Scholar]
- Nightingale K, Nightingale R, Stutz D, Trahey G. Acoustic radiation force impulse imaging of in vivo vastus medialis muscle under varying isometric load. Ultrasonic Imaging. 2002b;24:100–108. doi: 10.1177/016173460202400203. [DOI] [PubMed] [Google Scholar]
- Nightingale K, Palmeri M, Nightingale R, Trahey G. On the feasibility of remote palpation using acoustic radiation force. J Acoust Soc Am. 2001;110(1):625–634. doi: 10.1121/1.1378344. [DOI] [PubMed] [Google Scholar]
- Nightingale K, Soo M, Nightingale R, Trahey G. Acoustic radiation force impulse imaging: In vivo demonstration of clinical feasibility. Ultrasound in Medicine and Biology. 2002c;28(2):227–235. doi: 10.1016/s0301-5629(01)00499-9. [DOI] [PubMed] [Google Scholar]
- Nyborg W. Acoustic streaming. In: Mason W, editor. Physical Acoustics. chap 11. IIB. New York: Academic Press Inc; 1965. pp. 265–331. [Google Scholar]
- O'Brien PD, O'Brien WD, Rhyne TL, Warltier DC, Sagar KB. Relation of ultrasonic backscatter and acoustic propagation properties to myofibrillar length and myocardial thickness. Circulation. 1995;91(1):171–175. doi: 10.1161/01.cir.91.1.171. [DOI] [PubMed] [Google Scholar]
- Oliphant T, Manduca R, Ehman A, Greenleaf J. Complex-valued stiffness reconstruction from magnetic resonance elastography by algebraic inversion of the differential equation. Magnetic Resonance in Medicine. 2000 doi: 10.1002/1522-2594(200102)45:2<299::aid-mrm1039>3.0.co;2-o. [DOI] [PubMed] [Google Scholar]
- Palmeri ML, Nightingale KR. On the thermal effects associated with radiation force imaging of soft tissue. IEEE Trans Ultrason, Ferroelec, Freq Contr. 2004;51:551–565. [PubMed] [Google Scholar]
- Palmeri M, M SA, Trahey G, Nightingale K. Ultrasonic tracking of acoustic radiation force-induced displacements in homogeneous media. IEEE-UFFC. doi: 10.1109/tuffc.2006.1665078. in press. [DOI] [PMC free article] [PubMed] [Google Scholar]
- Pinton G, Dahl J, Trahey G. Rapid tracking of small displacments with ultrasound. IEEE Transactions on Ultrasonics, Ferroelectronics and Frequency Control. 2006;53(6):1103–1117. doi: 10.1109/tuffc.2006.1642509. [DOI] [PubMed] [Google Scholar]
- Pislaru C, Bruce CJ, Anagnostopoulos PC, Allen JL, Seward JB, Pellikka PA, Ritman EL, Greenleaf JF. Ultrasound strain imaging of altered myocardial stiffness: stunned versus infarcted reperfused myocardium. Circulation. 2004;109(23):2905–2910. doi: 10.1161/01.CIR.0000129311.73402.EF. [DOI] [PubMed] [Google Scholar]
- Sandrin L, Tanter M, Catheline S, Fink M. Shear modulus imaging with 2-D transient elastography. IEEE Transactions on Ultrasonics, Ferroelectronics and Frequency Control. 2002:426–435. doi: 10.1109/58.996560. [DOI] [PubMed] [Google Scholar]
- Sharma A, Soo M, Trahey G, Nightingale K. Acoustic radiation force impulse imaging of in vivo breast masses. Proceedings of the 2004 IEEE Ultrasonics Symposium. 2004;1:728–731. [Google Scholar]
- Torr G. The acoustic radiation force. American Journal of Physics. 1984;52:402–408. [Google Scholar]
- Wen H, Bennett E, Epstein N, Plehn J. Magnetic resonance imaging assessment of myocardial elastic modulus and viscosity using displacement imaging and phase-contrast velocity mapping. Magnetic Resonance in Medicine. 2005;54:538–548. doi: 10.1002/mrm.20589. [DOI] [PMC free article] [PubMed] [Google Scholar]
- Wickline SA, Thomas LJ, Miller JG, Sobel BE, Perez JE. A relationship between ultrasonic integrated backscatter and myocardial contractile function. J Clin Invest. 1985;76(6):2151–2160. doi: 10.1172/JCI112221. [DOI] [PMC free article] [PubMed] [Google Scholar]
- Yu EH, Skyba DM, Leong-Poi H, Sloggett C, Jamorski M, Garg R, Iwanochko RM, Siu SC. Incremental value of parametric quantitative assessment of myocardial perfusion by triggered low-power myocardial contrast echocardiography. J Am Coll Cardiol. 2004;43(10):1807–1813. doi: 10.1016/j.jacc.2003.09.073. [DOI] [PubMed] [Google Scholar]
- Zile MR, Baicu CF, Gaasch WH. Diastolic heart failure–abnormalities in active relaxation and passive stiffness of the left ventricle. N Engl J Med. 2004;350(19):1953–1959. doi: 10.1056/NEJMoa032566. [DOI] [PubMed] [Google Scholar]


