

Abstract
High Mobility Group (HMG) proteins are nuclear proteins believed to significantly affect DNA interactions by altering nucleic acid flexibility. HMG group B proteins contain HMG box domains known to bind into the DNA minor groove without sequence specificity, slightly intercalating base pairs and inducing a strong bend in the DNA helix axis. A dual beam optical tweezers is used to extend double–stranded DNA (dsDNA) in the absence and presence of a single box derivative of human HMGB2 [HMGB2(box A)] and a double box derivative of rat HMGB1 [HMGB1(box A+B)]. The single box domain is observed to reduce the persistence length of the double helix, generating sharp DNA bends with an average bend angle of 99 ± 9°, and at very high concentrations also stabilizing dsDNA against denaturation. The double box protein contains two consecutive HMG box domains joined by a flexible tether. This protein also reduces the DNA persistence length, induces an average bending angle of 77 ± 7° and stabilizes dsDNA at significantly lower concentrations. These results suggest that the single and double box proteins increase DNA flexibility and stability, but both effects are achieved at much lower protein concentrations for the double box. In addition, at low concentrations the single box protein can alter DNA flexibility without stabilizing dsDNA, while stabilization at higher concentration is likely achieved through a cooperative binding mode.
INTRODUCTION
HMGB protein structure and function
Second in nuclear abundance only to the histones, the High Mobility Group (HMG) family comprises a profuse, diverse group of eukaryotic chromosomal proteins. Originally typified by their rapid migration on native electrophoresis gels, HMG proteins are now classified into two subgroups according to their DNA specificity.1–4 The HMGB subgroup is characterized by non-sequence specific binding to DNA via one or two 80 amino acid domains termed HMG boxes.1–3 These proteins have been shown to bind strongly to DNA, affecting the structure of the double helix, bending the DNA and disrupting the structure of chromatin.1,3,5–9 HMGB proteins are believed to facilitate transcription,10–15 either by binding directly to transcription factors16,17 or by stabilizing DNA looping.18 HMGB proteins have been shown to promote and stabilize DNA loop complexes, roles seen in other proteins, including E. coli HU.8,19,20
HMG binding to DNA
Figure 1a shows an X-ray crystallographic structure of the single box HMGB protein of HMG-D from Drosophila melanogaster (entry 1QRV in the NCBI Protein Data Bank),21 a structure that displays the general features of HMG domain binding to DNA. Not shown is a second HMGB domain that binds to a crossed portion of the DNA and stabilizes this structure. The alpha helices shown are stabilized by hydrophobic interactions between neighboring residues, while the N-terminal tail is highly variable and may interact with DNA depending on the particular protein studied.6,21 Binding of the two short helices is dominated by van der Waals contacts, though direct and water-mediated hydrogen bonding occur as well. Partial intercalation occurs in the minor groove, which opens and flattens upon protein binding, yielding a strong and continuous DNA bend away from the binding protein (111.1° in the depicted case),21,22 along a binding site size of ~ 7 base pairs.23 The absence of DNA sequence specificity hampers high resolution protein – DNA structure determination. The structure shown in Figure 1b and 1c corresponds to an HMGB–DNA complex created with sequence-specific transcription factor SRY engineered to replace HMG box A of mammalian HMGB1 (entry 2GZK in the NCBI Protein Data Bank).24 The resulting two-box HMGB protein provides a model for understanding sequence-nonspecific HMGB proteins such as mammalian HMGB1 and HMGB2. Together, the figures show bending at two distinct binding sites, with some unwinding of the DNA. The total bending of the DNA is the sum of the two induced angles (not in phase with the DNA helical repeat), estimated at 101.5 ± 9.1° for this structure.24 These binding angles may be estimated from the figure, by noting the planes formed by the first and last bases. A flexible, basic sequence, which lies at least partially in the minor groove, joins the two domains.
Figure 1.

Structures of HMGB proteins bound to dsDNA. a) Single HMG box (purple) bound to dsDNA (green and yellow) in this crystal structure for HMGB family member HMG–D protein from Drosophila melanogaster.21 The non-sequence specific binding is characterized by van der Waals contacts, direct and water-mediated hydrogen bonding and partial intercalation, yielding a strong, continuous deformation of the DNA backbone. b) Structure of tandem HMG boxes from an artificial HMGB protein created with transcription factor SRY in place of box A of HMGB1.24 This artificial tandem SRY/B box protein (red/blue) binds to a 16-bp sequence of double-stranded DNA with each HMG box engaging DNA similarly, though the SRY box is sequence specific (allowing determination of this NMR structure). The domains are connected by a basic sequence that is believed to be flexible. c) Rotated view of the structure from (b) revealing that each HMG box domain induces an independent DNA bend, with the bends partially reinforcing. The plane of the first and last base pairs in (a) and (c) are perpendicular to the paper. Dotted green arrows indicate the direction of the helical axis, and the deflection of the outgoing arrows give the protein induced bending angle. Images were generated using coordinates from the NCBI Protein Data Bank (entries 1QRV and 2GZK) with Swiss View/DeepView v3.7 software.
DNA bending and stability
While previous studies have shown that isolated HMGB proteins exhibit a high binding affinity for double stranded DNA and induce a large bending angle into the nucleic acid, the details and function of such deformed structures are unclear. Previously, we examined an isolated HMG domain [human HMGB2(box A)] and its effect upon dsDNA using dual beam optical tweezers25,26 and DNA cyclization assays.8,27,28 While we confirmed strong binding and a pronounced induced DNA bend, we also observed that HMGB2(box A) produced an increase in the local flexibility of dsDNA, implying a range of bending angles. We suggested that bound HMGB domains induce ‘flexible hinges’ in DNA. Additionally, a cooperative binding mode was observed, implying that HMGB proteins may also serve to stabilize dsDNA against denaturation under some conditions. In order to understand the functional role of these proteins and to determine the behavior of a native two–box HMGB protein, here we examine dsDNA flexibility and stability in the presence of single and double box motifs of HMGB2(box A) and HMGB1(box A+B), in varying concentrations and solution conditions.
RESULTS AND DISCUSSION
HMG binding to dsDNA
Force spectroscopy curves for DNA extension (solid) and relaxation (open) appear strongly reproducible for the raw data sets of Figure 2a. Data were collected with DNA in 10 mM Hepes (pH 7.5) and 100 mM Na+. Several extension and relaxation cycles for DNA in the absence of protein are shown in blue and cycles carried out to higher forces are discussed in materials and methods. A solid line shows the average of the extension data, and these averages are reproduced in Figure 2b. Low extension data is linear in force over a region described as an entropic spring, and characterized by an isotropic, continuously elastic rod in the Worm-Like Chain (WLC) model, discussed below. An enthalpic term is usually added to this model to describe the linear region at higher forces, as dsDNA assumes its contour length of 0.34 nm per base pair at 34.0 pN of extension force. Above a critical force of 62 pN, the DNA abruptly lengthens though the force does not significantly increase. This transition is due to disruption of base pairing and base stacking over the transition to single stranded DNA (ssDNA).29–36
Figure 2.

HMGB proteins lower the persistence length of dsDNA. a) Averaged stretching (solid) and relaxation (open) data for dsDNA in the absence (blue circles) or presence (green boxes) of 3 nM HMGB1(box A+B) in 10 mM Hepes (pH 7.5) and 100 nM Na+. Solid and dotted lines are averages for the extension and relaxation data, respectively. Each line is the average of four data sets, collected at 100 nm intervals and each point averaged for 1.0 second. b) Averaged stretching/relaxation data shown separately, revealing minimal hysteresis. Standard uncertainty in each point is 1 pN or less, within the size of each symbol. c) Levenberg – Marquardt fits (solid lines) to the force extension data according to the Worm-Like Chain (WLC) model, as described in the text. The fits yielded bds = 0.339 ± 0.001 nm/bp, Kds = 1200 ± 50 pN and Pds = 46 ± 2 nm for dsDNA, and bds = 0.339 ± 0.003 nm/bp, Kds = 939 ± 100 pN and Pds = 22 ± 2 nm for dsDNA with 3 nM HMGB1(box A+B). Fits are limited to data below 45 pN.
Changes in the extension data are evident as protein is added. Modifications of dsDNA stretching behavior in the presence of HMGB1(box A+B) are shown in green in Figure 2a, while the average to these cycles is shown in Figure 2b, alongside dsDNA in the absence of protein. Both HMGB1(box A+B) and HMGB2(box A) proteins caused changes in the DNA stretching cycles and melting transitions. Here we quantify these changes for given protein concentrations, and then analyze changes in the melting plateau for both the single and double box HMG proteins. We will assume that as phage λ-DNA is a long polymer (48,500 bp), any end effects will average out of the data.
DNA aggregation, requiring additional force to stretch DNA at extensions below its B-form contour length of 0.34 nm, was often observed (data not shown). This effect generally shifts the DNA stretching curve to lower extensions, causing the DNA to appear shorter, and obscuring any determination of the contour length. To avoid aggregation and observe non-cooperative binding, the DNA was held at a stretching force ~ 30 pN as protein was added, then allowed to relax prior to data collection. Furthermore, data collection times were limited to two hours. This approach avoided both DNA loops and protein-DNA filaments observed previously.20,25,37 Four extension/relaxation cycles are averaged in Figure 2b. Very little hysteresis occurs for the protein-free DNA, while a small hysteresis effect is observed in the presence of HMGB1(box A+B) protein. Data characterized by large hysteresis effects were not included in this analysis to avoid irregularities due to DNA aggregation and looping. Averaged data are fit to the WLC model in Figure 2c, as described below.
Quantifying changes in dsDNA structure
Models of polymer elasticity may be fit to the force extension data for DNA. Typical models include a continuum elastic model known as the Worm-Like Chain (WLC) model, used to describe dsDNA, and a model of flexible segments known as the Freely Joined Chain (FJC), used to describe single stranded DNA.33,38–40 The models describe the measured length (b) as a function of the applied force (F). The WLC model characterizes dsDNA using a contour length (bds), a persistence length (Pds) and phenomenological longitudinal bulk stiffness (Kds). Expressed in the high force limit, the measured length is written
| (1) |
where T is the temperature and the Boltzmann constant is kB. Fits to this function utilize the Levenberg-Marquardt algorithm, as implemented in the Numerical Recipes package.41,42 Extension curves were fit to forces below 45 pN, to avoid any effects due to force – induced melting.25 Sample fits for DNA alone and DNA in the presence of 3 nM HMGB1(box A+B) are shown in Figure 2c. All fits are to data averaged over four extension/relaxation cycles as shown in the figure, and data are selected for a minimum of hysteresis and DNA condensation, as described above. Other refinements to the WLC model exist, including a polynomial expansion for intermediate forces,43 though such refinements produced no improvement within the uncertainty of our experiments.
HMGB – induced changes in the structure of dsDNA may be discerned from changes in the fitted parameters for the WLC model. Fits were made to data up to protein concentrations of 10 nM. Above this concentration, changes in the fitted parameters appeared to saturate and a protein – DNA filament began to form, as discussed below. Below this concentration, the values of the contour length and the stiffness gradually increased to saturated values of bds (0.380 ± 0.005 nm per base pair) and Kds (2000 ± 400 pN). These results represent changes from dsDNA values of bds (0.340 ± 0.001 nm/bp) and Kds (1200 ± 100 pN), and are consistent within error between both HMGB1(box A+B) and HMGB2(box A), as well as with previous studies.25,26 Changes in the apparent persistence length induced by both proteins are shown in Figure 3. The persistence length is a length scale over which thermal fluctuations cause a polymer to bend by an average of 1 radian. A decreasing persistence length indicates that phage λ-DNA has more bends per length upon the addition of either HMGB1(box A+B) or HMGB2(box A). Such an effect was observed previously for HMGB2(box A),25–28 and has been observed for other nuclear proteins.20 This was interpreted as an increase in the flexibility of the DNA due to a flexible hinge formed at each site of the bound protein. Though this effect appears for both HMGB proteins studied here, the overall effect appears at lower protein concentration for HMGB1(box A+B).
Figure 3.

Binding isotherms for the change in DNA persistence length (Pds) as a function of HMGB protein concentration (c). Each data point corresponds to the average of 3 to 4 extension curves, as shown in Figure 2, which are fit to the WLC model to obtain Pds. With increasing protein concentration, both the single box HMGB2(box A) (blue circles) and the double box HMGB1(box A+B) (green boxes) proteins substantially reduce the persistence length of dsDNA. The double box HMGB1(box A+B) protein shows a stronger equilibrium association constant per ligand (K). The solid lines are fits to the binding isotherms described in the text, yielding K = 0.11 ± 0.05 × 10⁹ M−1 for HMGB2(box A) and K = 11 ± 3 × 10⁹ M−1 for HMGB1(box A+B).
Persistence length vs. concentration
We may quantify the change in the persistence length due to protein – DNA binding using the site exclusion binding isotherm of McGhee and von Hippel:44
| (2) |
Here an increase in the protein concentration (c) causes a change in the fractional DNA saturation (Θ), according to the binding site size (n) and the equilibrium association binding constant per ligand (K). The fractional saturation ranges from zero to unity, and as it increases, the observed persistence length (Pds) approaches the value due the DNA – protein complex (PPR), according to
| (3) |
where PDNA is the persistence length of dsDNA in the absence of protein, and assuming that bending by individual proteins is independent.45
The solid lines of Figure 3 show the results of fits to the data of persistence versus protein concentration for HMGB1(box A+B) and HMGB2(box A). As the fits are fairly insensitive to the binding site size, starting values were chosen from the literature, n = 7 for HMGB2(box A) and n = 18 for HMGB1(box A+B), as shown above.21,23,24 The fits yield K = 1.1 ± 0.5 × 10⁸ M−1 for HMGB2(box A) and K = 1.1 ± 0.3 × 10¹⁰ M−1 for HMGB1(box A+B). These results are unchanged within uncertainty by variations in n of one base pair for HMGB2(box A) and two base pairs for HMGB1(box A+B). Thus the addition of the second box greatly enhances the binding affinity of the protein. These data are summarized as the first part of Table 1.
Table 1.
Binding parameters for HMGB1(box A+B) and HMGB2(box A) to dsDNA.
| HMG protein | [Na+] (mM) | K (× 109 M−1) | n (3) (bp) | β (°) | Fm (pN) |
|---|---|---|---|---|---|
| HMGB1(box A+B) (1) | 100 | 11 ± 3 | 18 | 77 ± 7 | – |
| HMGB1(box A+B) (2) | 100 | 13 ± 3 | 18 | – | 74 ± 1 |
| HMGB1(box A+B) (2) | 50 | 7 ± 2 | 18 | – | 86 ± 3 |
| HMGB2(box A) (1) | 100 | 0.11 ± 0.05 | 7 | 99 ± 9 | – |
| HMGB2(box A) (2) | 100 | 0.028 ± 0.010 | 7 | – | 74 ± 1 |
| HMGB2(box A) (2) | 50 | 0.014 ± 0.006 | 7 | – | 74 ± 1 |
All parameters determined using;
data of Figure 3 and persistence length change as described by Equations 2, 3 and 4,
data of Figure 5 and melting force change as described by Equations 2 and 5.
Evaluation of induced bending angle
From the measurements of the persistence length, an average protein-induced DNA bending angle may be estimated. If a simple hinge mechanism of polymer bending is assumed, then the average induced angle due to the bound protein (β) may be expressed in terms of the saturated contour length (bds), the binding site size (n), and the persistence length due to the bound protein (PPR);25,45,46
| (4) |
Using the values determined above, the average protein induced bending angle for HMGB2(box A) is β = 99 ± 9° and that for HMGB1(box A+B) is β = 77 ± 7°. Surprisingly, though the double box HMGB1(box A+B) has a higher binding constant, it induces a smaller bending angle per protein. This model assumes that the bending due to the two binding sites is correlated, an assumption that may not be true, though interactions between the boxes have been observed.47 We have also asserted that individual proteins do not interact, so that this binding mode is non-cooperative. While this assumption in generally made when binding angles are estimated (especially from structural data), we should note that it has not been explicitly proven. However, this result is consistent with the single and double box structures (Figure 1) described in the introduction: the double box HMGB protein induces a smaller DNA bending angle than the protein with a single HMGB box domain.
Changes in melting force
In addition to changes in dsDNA elasticity, a change in the overstretching plateau was observed as HMGB protein was added. Figures 4a and b show a rise in the melting force as the concentration of HMGB1(box A+B) protein was increased. Changes in the overstretch plateau appear to saturate and remain constant even at higher HMGB concentrations (> 100 nM). Lower concentrations (nM) of the single box of HMGB2(box A), by contrast, do not appear to change the melting force within the uncertainty of the experiment, as shown in Figure 4c and d. Only at much higher protein concentrations (~ 100 nM), does the single box protein cause a substantial increase in the melting force. At high concentrations, the change in the melting force appears nearly the same for dsDNA bound to either HMGB1(box A) or HMGB2(box A+B).
Figure 4.

HMGB1(boxes A+B) protein stabilizes the DNA melting transition. a) Full stretching (solid) and relaxation (dotted) cycles for HMGB1(boxes A+B) bound to DNA. In addition to the change in the persistence length discussed above, the melting transition is stabilized by the addition of 2 nM (blue), 4 nM (green), 10 nM (gold) and 100 nM (red) of protein. Furthermore, there is an increase in the slope of the melting transition and an increase in the hysteresis evident upon relaxation. b) Enlargement of the melting transition shown in a). c) Stretching and relaxation cycles for the single box HMGB2(box A) show little change from bare DNA (black) through 2 nM (blue) and 4 nM (green) of protein. At and above 10 nm of protein concentration (gold and red), DNA stabilization becomes evident, due to cooperative binding to dsDNA. d) Enlargement of the melting transition shown in c).
Varying ion concentration
Experiments were repeated in the presence of varying counterion concentrations. For proteins whose interactions with DNA drive entropically favorable counterion release, stronger binding is expected at lower cation concentrations, where steeper concentration gradients between condensed and solution counterions are observed. Thus the change in the persistence length should occur over lower added protein concentrations, an effect observed previously.25,26 Changes in the melting force should show a similar effect, once corrected for the decrease in the melting transition due to dsDNA destabilization by reduced counterion concentration.33 The data for the single box domain HMGB2(box A) reveal only a small change in the equilibrium binding constant at lower salt concentrations. The double box protein HMGB1(box A+B), however, shows another stabilization mode, characterized by a dramatic increase in the melting plateau (data not shown). Additionally, two melting plateaus become evident. The upper plateau is at 110 pN, apparently due to a length of dsDNA that is torsionally constrained.
Melting force vs. concentration
As shown in Figure 4, increasing HMGB protein concentration induces an increase in the melting force. By comparing the overstretching plateau for each extension curve, this change may be quantified for a given protein concentration. As the slope of the plateau changes somewhat upon the addition of increasing protein, it is convenient to select the midpoint of the melting force, typically near an extension of 0.45 nm per base pair. This position avoids the ends of the transition, where the elasticity of dsDNA and ssDNA contribute to the stretching curve. This choice also minimizes changes due to an increasing slope in the overstretching transition as protein concentration is raised. Other methods of characterizing the melting force, including averaging over and performing linear fits to the plateau, yield the same results within uncertainty. Figure 5 shows plots of this midpoint for varying concentrations of HMGB1(box A+B) and HMGB2(box A) in both 100 mM and 50 mN Na+. Each data point represents an average determined over at least four extension cycles. Standard uncertainties in this average were typically similar, due to drifts in the instrument over several cycles, though the extension curves were more variable for DNA in lower concentrations of Na+. The melting force in the absence of protein has been previously determined in HEPES buffer with varying concentrations of counterion (Na+), and these data confirm these results within uncertainty.33,48
Figure 5.
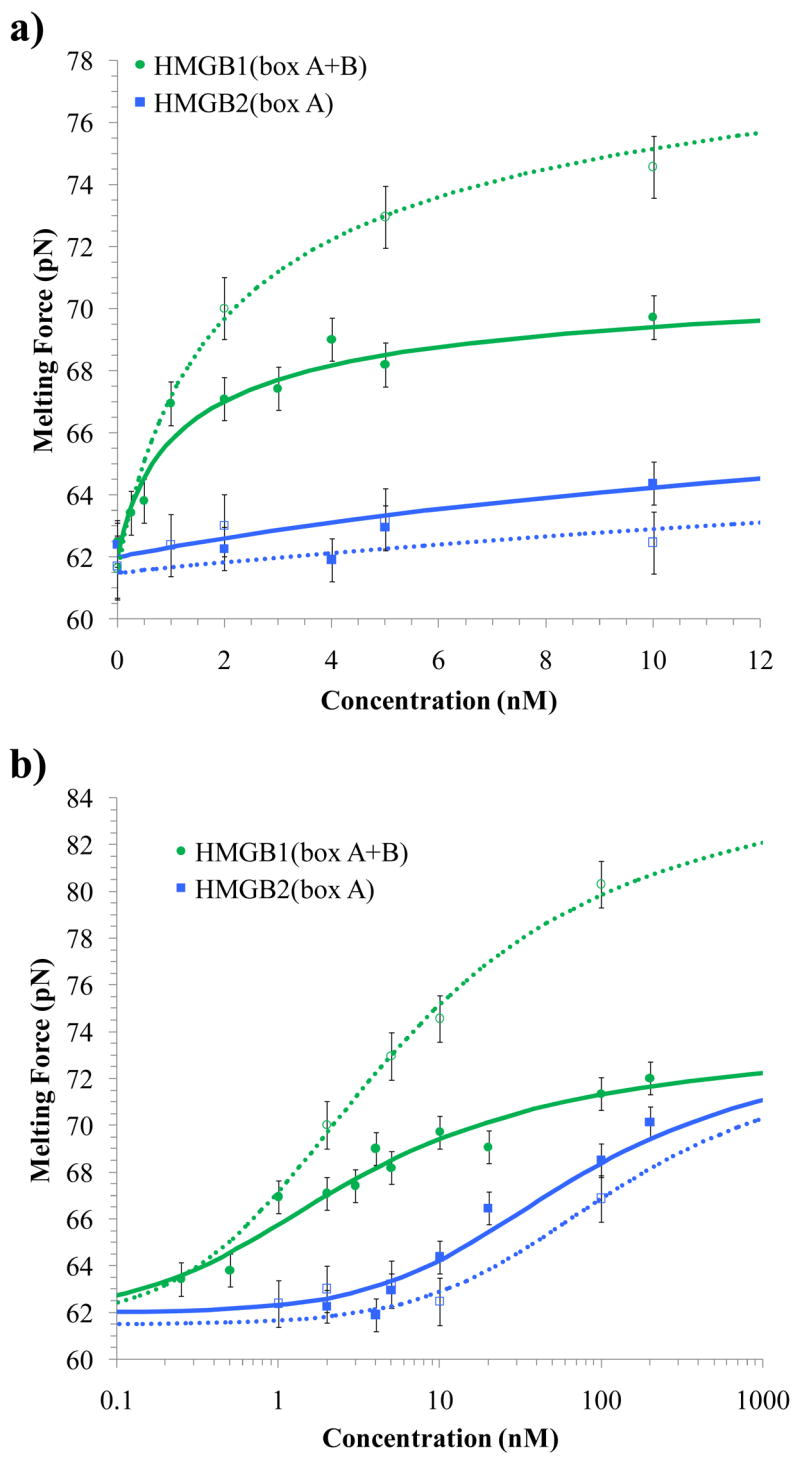
Binding isotherms for the change in DNA melting force (ΔFm) as a function of concentrations (c) of added HMGB protein and ions. Solid data points and lines are for DNA/protein complexes in 100 mM Na+, while open data points and dotted lines are for binding in 50 mM Na+. Each point represents an average over 4 – 10 extension cycles. a) Over relatively low concentrations (< 10 nM protein), there is little change in the melting force for dsDNA bound to HMGB2(box A), while HMGB1(box A+B) strongly stabilizes the nucleic acid. b) At higher concentrations, stabilization is evident for the single box domain, due to cooperative binding to DNA. While the cooperative binding of HMGB2(box A) appears to be unaffected by salt concentration over this range, the binding of HMGB1(box A+B) is strongly enhanced in low salt, due possibly to an increase in cooperativity. In 100 mM Na+ the fits to binding models determine K = 0.028 ± 0.010 × 10⁹ M−1 for HMGB2(box A) and K = 13 ± 3 × 10⁹ M−1 for HMGB1(box A+B), while in 50 mM Na+, K = 0.014 ± 0.006× 10⁹ M−1 for HMGB2(box A) and K = 7 ± 2 × 10⁹ M−1 for HMGB1(box A+B).
If protein binding completely prevents or simply inhibits DNA melting within the binding site, the experimentally observed melting force (Fm) should vary between the value in the absence of protein ( ) and a value when DNA is completely bound by protein ( ). The fractional DNA saturation (Θ), ranging from zero to one, may assume a linear form;49,50
| (5) |
This saturation corresponds to the fractional DNA saturation model described by the McGhee and von Hippel isotherm of Equation 2. Fitting the force versus protein concentration data to these formulae yields the lines shown in Figure 5. In 100 mM Na+, K = 2.8 ± 1.0 × 10⁷ M−1 for HMGB2(box A) and K = 1.3 ± 0.3 × 10¹⁰ M−1 for HMGB1(box A+B), where the values for n were chosen as discussed above. For dsDNA saturated with either protein, the midpoint of the melting force ( ) increases from 62 ± 1 pN to 74 ± 1 pN. The binding constant for HMGB1(box A+B) confirms the binding constant determined through the change in the persistence length. However, the binding constant for HMGB2(box A) is substantially lower than the value found above. We propose that for HMGB2(box A) observing the change in the melting force reveals a different binding mode than the one detected by the change in the persistence length. In 50 mM Na+, K = 1.4 ± 0.6 × 10⁷ M−1 for HMGB2(box A) and K = 7 ± 2 × 10⁹ M−1 for HMGB1(box A+B). Surprisingly, in lower salt, the double box shows a much higher saturated melting force of 86 ± 3 pN. These data are summarized together with the persistence length analysis in Table 1.
Why do double and single HMGB motifs behave differently?
Revisiting the structures of Figure 1, the individual boxes of HMGB proteins are similar, indicating that binding dsDNA to HMGB2(box A) and HMGB1(box A+B) should yield similar binding constants. Furthermore, as the double box contains two binding sites, the measured bending angle for HMGB1(box A+B) might be expected to be twice the induced angle for HMGB2(box A). That the two proteins bind into the minor groove and weakly intercalate suggests that both proteins should have similar effects on DNA stability. Table 1 summarizes the results of the stretching experiments and the binding analysis. Surprisingly, the estimated DNA bending angle induced by the double box protein is somewhat less than that induced by the protein with a single box HMG domain. Furthermore, the stabilization of dsDNA by nM concentrations of HMGB1(box A+B) but not HMGB2(box A) was unexpected. Finally, the equilibrium binding constants are quite different for the two proteins, and the binding constants for HMGB2(box A) as determined by the change in persistence length and the change in the melting force are not equal.
For the single box motif of HMGB2(box A), the equilibrium binding constant and the bending angle determined through the change in the persistence length appear reasonable and match previous results fairly well.8,25,51 The double box motif of HMGB1(box A+B) appears to bend the DNA somewhat less strongly, and this trend is consistent with the angles determined from the structures of Figure 1.21,24 Other resonance energy transfer studies estimated greater bending angles associated with the binding of an HMGB protein, though the DNA used was structurally altered (pre-bent due to nucleotide deletion).52 The significantly enhanced non –specific DNA binding affinity of the double box over the single box is surprising. Some estimates of the binding constant for HMGB1(box A+B) suggest not only stronger binding for the single box motif, but very weak binding for the two domain protein (K ~ 106 M−1).53 However, the full-length protein – DNA binding studies were performed in very high salt (10 mM HEPES, 10 mM MgCl, 50 mM LiCl, and 100 mM NaCl), which should lead to reduced binding and the single box studies were performed on mutated double box proteins to reduce the affinity of one of the binding sites. Other experimental evidence has suggested that increasing the number of binding domains does increase the overall binding constant of the protein,54,55 possibly due to the presence of the basic region that connects the two domains in the case of HMGB.54 Furthermore, theoretical estimates for two identical DNA binding sites on a single protein would lead to a binding constant that is the square of the binding constant of the single box domain,56 though the condition of identical, non-interacting binding sites may not hold for these specific protein domains. Finally, DNA cyclization assays determine the propensity of HMGB proteins to bend short segments of dsDNA (Bystry, E. & Maher, L. J., 3rd. unpublished observations). The fact that these experiments see enhanced cyclization for HMGB1(box A+B) may simply reflect a stronger interaction as suggested by our experiments.
The force melting data reveal the more unexpected result that nM concentrations of HMGB1(box A+B) stabilize dsDNA melting while similar concentrations of HMGB2(box A) do not. As the A and B binding domains affect dsDNA similarly, the difference must lie in the tethering of the two domains in HMGB1(box A+B). In this protein, the two binding sites and the tether form an ‘open clamp’ that does not fully enclose dsDNA but that links van der Waals contacts and hydrogen bonding in consecutive minor grooves. The distance between the two binding sites is the overall site size less the individual site size for one box, or approximately 4 –5 base pairs. The structures shown in Figure 1b and 1c suggest the region between the two sites may approach 7 base pairs. We suggest that as the protein/dsDNA complex is extended in the optical tweezers, the DNA spanned by the two – box HMGB ‘clamp’ is unable to completely melt and convert to single–stranded DNA without disrupting the bound protein. The hysteresis evident in Figure 4b suggests that the protein may partially unbind. The relaxation curve would be expected to overlap the bare DNA extension curve if unbinding were complete. Full unbinding events that were reported for loop stabilization and for E. coli HU and histone proteins at low forces (< 10 pN) were not evident in our extension data (see Figure 2).20,57,58 At high (100 nM) concentrations, HMGB1(box A+B) shows an increased slope in the melting force extension data, evidence of decreased melting cooperativity as binding nears saturation. Furthermore, more hysteresis is evident upon relaxation, suggesting that full melting of dsDNA requires unbinding of one of the HMGB boxes while leaving the other box bound. Upon relaxation, dsDNA re-annealing may be hindered by these unbound protein domains.
According to this hypothesis, if binding of a single HMGB box enhances DNA flexibility by initiating incomplete dsDNA denaturation, HMGB2(box A) may not show any melting stabilization at nM concentrations. Figure 4d confirms this suspicion. Only at high (100 nM) concentrations does stabilization become evident. We attribute this latter effect to protein –protein interactions between bound HMGB2(box A) monomers, an effect that we observed to lead to filament formation in our previous work.25 The relaxation curve shows very strong hysteresis, close to the extension/relaxation cycles of naked dsDNA, confirming that these protein – protein contacts must be disrupted to fully melt dsDNA. Because the low force relaxation data do not correspond to dsDNA, the protein appears not to completely unbind. Furthermore, we expect significant protein – protein contacts only when the nucleic acid approaches saturation with HMGB2(box A). Thus the binding constant determined by the change in the melting force differs from the equilibrium binding constant seen from the change in the persistence length. While the latter is due to protein – dsDNA binding, the former is due to protein – protein interactions evident only after protein – dsDNA binding nears saturation. Finally, in low salt the double box of HMGB1(box A+B) participates in protein-protein interactions that raise the melting force still further, evidence of a torsionally constrained mode. These protein – protein interactions may further stabilize the bound dsDNA, making unwinding and melting impossible over the force ranges of our experiment.
CONCLUDING REMARKS
Overall, our results suggest that a double box HMGB protein exhibits similar binding characteristics to a single box protein, but under very different conditions. These binding characteristics include the ability to render dsDNA much more flexible, and the ability to stabilize dsDNA against melting. Notably, an order of magnitude higher single box protein concentration is required to observe an effect on DNA flexibility comparable to that of the double box protein. Similarly, almost two orders of magnitude higher single box protein concentration relative to that of the double box protein is required to observe significant DNA stabilization. Therefore, while both proteins ultimately achieve the same result, the double box protein acts at much lower concentrations.
HMGB box binding into the minor groove of dsDNA induces a large bend in the helix axis and an increase in the apparent flexibility of the bases near the binding site. Bound HMGB proteins do not unbind easily, even during the force – induced melting transition. The twin boxes of HMGB1(box A+B) are connected by a flexible tether to form an open clamp. This clamp appears to stabilize the base pairs between the hinges, and this structure must be disrupted to fully melt the nucleic acid. With no tether, the single box of HMGB2(box A) does not stabilize dsDNA until binding begins to saturate and protein – protein interactions arise. These contacts must be broken to observe dsDNA melting. These results imply that over nM concentrations the HMGB box motif enhances the flexibility of dsDNA, while the double box also stabilizes the nucleic acid against melting.
MATERIALS AND METHODS
Dual laser optical tweezers
Optical tweezers experiments immobilize an object (typically spherical) within an optical trap, which generates a restoring force proportional to the displacement.26,33,59–61 The restoring force arises from the refraction of rays within a focused laser. A dual beam trap is formed with counter propagating lasers (SDS) that are brought to focus of ~ 1.3 μm by a pair of 60× water immersion objectives (Nikon).26,33,60,62 A flow cell placed at the trap allows various solutions to be introduced. A 5.5 μm diameter streptavidin bead (Bangs Labs) may be caught while another is immobilized upon a micropipette tip (WPI). Between these beads, 3′ biotinylated phage λ DNA (Roche and Invitrogen) may be tethered. The moving the cell generates a force upon the DNA that may be determined by the displacement of each beam, measured upon a pair of lateral effect diode detectors (Melles Griot). The numerical aperture of the beams is usually less than that of the objective (the optics are underfilled), to allow deflection of the lasers without substantial power loss.
A plot of the measured force versus extension is shown in Figure 6a. The data were collected for phage λ DNA in 10 mM Hepes buffer, pH 7.5 containing 100 Na+. Low forces (< 10 pN) show a linear response, interpreted as an entropic spring, while the linear data at higher forces (~ 30 pN) are described enthalpically. A Worm-Like Chain (WLC) model of polymer elasticity may be fit to these data below 45 pN and is shown as a solid line in the figure. Above a critical force of 62 pN, the DNA lengthens at nearly constant force as it undergoes a phase transition to single stranded DNA.29-36 This transition is reversible upon relaxation and subsequent extension/relaxation cycles are repeatable. Extending the DNA beyond this plateau reveals single stranded DNA tethered by a few GC rich regions, though the strands may be permanently separated at higher forces (~ 150 pN). A model more appropriate for this region is the Freely Jointed Chain (FJC) as is shown as a solid line to this part of the curve.60 The free energy of the melting transition is represented by the shaded area between these two curves. Multiple dsDNA strands may be caught between the two beads and the melting force observed is then an integral multiple of the melting force for the individual transition, as shown in Figure 6b. This provides a convenient check on the linearity of the instrument at high pulling forces. The instrument described above is linear up to pulling forces of 240 pN, and with a linear power correction (as the beams are clipped by the objectives), up to the observed instrument maximum of 325 pN.
Figure 6.

Stretching curves for dsDNA. a) Force extension (filled blue) and relaxation (open blue) curves for double stranded dsDNA in 10 mM Hepes (pH 7.5) including 100 nM Na+. Low forces reveal an entropic spring regime, while the extension at higher forces is described enthalpically, as the chain stretches and unwinds. At ~ 62 pN, dsDNA abruptly lengthens, as bases pairs cooperatively melt and base stacking is disrupted. Relaxing the nucleic acid allows reannealing, while continuing to higher forces extends the predominantly single stranded construct, until strand separation is reached (green and red). Solid lines are models of polymer elasticity described in the text, and the area between them determines the free energy of melting. b) Trapping multiple strands of labeled dsDNA reveals melting plateaus at integer multiples of the dsDNA melting force, and confirms the linearity of the force measurement. This dual beam instrument can examine trapping forces up to ~ 325 pN.
Preparation of recombinant HMGB proteins
Recombinant plasmid clones encoding rat HMGB1 (HMG boxes A and B) and human HMGB2 (HMG box A) were obtained from P. Sharp (MIT) and D. Edwards (University of Colorado Health Sciences Center), respectively. The proteins were cloned with amino-terminal hexahistidine tags and expressed in derivatives of E. coli strain BL21(DE3) after induction with IPTG. A volume of 5 mL of an overnight bacterial culture was washed by centrifugation to remove excess β-lactamase, and the cells were diluted into 250 mL LB media containing carbenicillin. Cultures were grown with shaking at 37°C to an OD600 density of 0.6. IPTG was added to 1 mM, and cells were incubated with shaking at 37 °C for an additional 3 hours. Cells were collected by centrifugation, frozen at −80 °C, and disrupted by thawing and sonication in 10 mL binding buffer (5 mM imidazole, 500 mM NaCl, 20 mM Tris-HCl, pH 7.9) per 250 mL of original culture. After clarification, the supernatant was loaded onto a nickel-chelate column (Novagen, San Diego, CA), washed with 20 mL binding buffer followed by 10 mL wash buffer (60 mM imidazole, 500 mM NaCl, 20 mM Tris-HCl, pH 7.9), and eluted in four 1-mL aliquots with elution buffer (1 M imidazole, 1 M NaCl, 40 mM tris-HCl, pH 7.9). Proteins were concentrated using a 10,000 molecular weight cut-off centrifugal concentration unit (Vivaspin, Edgewood, NY) and dialyzed into 20 mM HEPES, pH 7.5 containing 100 mM KCl and 1 mM EDTA and 5% glycerol. The resulting protein was further purified by reverse phase HPLC on a Jupiter C18 column (250 × 21.2 mm, 15 μm; Phenomenex, Torrance, CA) in 0.1% TFA/water with a 50 min gradient from 10–70% B, with B being 80% acetonitrile/0.1% TFA. Protein concentrations were then estimated by Bradford assay (BioRad, Hercules, CA).
Acknowledgments
This work was funded by NIH (GM75965) and (GM072462) and NSF (MCB-02381890).
Footnotes
Publisher's Disclaimer: This is a PDF file of an unedited manuscript that has been accepted for publication. As a service to our customers we are providing this early version of the manuscript. The manuscript will undergo copyediting, typesetting, and review of the resulting proof before it is published in its final citable form. Please note that during the production process errors may be discovered which could affect the content, and all legal disclaimers that apply to the journal pertain.
References
- 1.Bustin M. Regulation of DNA-dependent activities by the functional motifs of the high-mobility group chromosomal proteins. Mol Cell Biol. 1999;19:5237–5246. doi: 10.1128/mcb.19.8.5237. [DOI] [PMC free article] [PubMed] [Google Scholar]
- 2.Bustin M. Revised nomenclature for high mobility group (HMG) chromosomal proteins. Trends Biochem Sci. 2001;26:152–3. doi: 10.1016/s0968-0004(00)01777-1. [DOI] [PubMed] [Google Scholar]
- 3.Bustin M, Reeves R. High-mobility-group chromosomal proteins: architectural components that facilitate chromatin function. Prog Nucleic Acid Res Mol Biol. 1996;54:35–100. doi: 10.1016/s0079-6603(08)60360-8. [DOI] [PubMed] [Google Scholar]
- 4.Johns E, editor. HMG Chromosomal Proteins. Academic Press; New York: 1982. [Google Scholar]
- 5.Bianchi ME, Beltrame M. Upwardly mobile proteins. Workshop: the role of HMG proteins in chromatin structure, gene expression and neoplasia. EMBO Rep. 2000;1:109–14. doi: 10.1093/embo-reports/kvd030. [DOI] [PMC free article] [PubMed] [Google Scholar]
- 6.Ragab A, Travers A. HMG-D and histone H1 alter the local accessibility of nucleosomal DNA. Nucleic Acids Res. 2003;31:7083–9. doi: 10.1093/nar/gkg923. [DOI] [PMC free article] [PubMed] [Google Scholar]
- 7.Falciola L, Spada F, Calogero S, Langst G, Voit R, Grummt I, Bianchi ME. High mobility group 1 protein is not stably associated with the chromosomes of somatic cells. J Cell Biol. 1997;137:19–26. doi: 10.1083/jcb.137.1.19. [DOI] [PMC free article] [PubMed] [Google Scholar]
- 8.Ross ED, Hardwidge PR, Maher LJ., 3rd HMG proteins and DNA flexibility in transcription activation. Mol Cell Biol. 2001;21:6598–605. doi: 10.1128/MCB.21.19.6598-6605.2001. [DOI] [PMC free article] [PubMed] [Google Scholar]
- 9.LeRoy G, Orphanides G, Lane WS, Reinberg D. Requirement of RSF and FACT for transcription of chromatin templates in vitro. Science. 1998;282:1900–1904. doi: 10.1126/science.282.5395.1900. [DOI] [PubMed] [Google Scholar]
- 10.Agresti A, Bianchi ME. HMGB proteins and gene expression. Curr Opin Genet Dev. 2003;13:170–8. doi: 10.1016/s0959-437x(03)00023-6. [DOI] [PubMed] [Google Scholar]
- 11.Bianchi ME, Beltrame M. Flexing DNA: HMG-box proteins and their partners. Am J Hum Genet. 1998;63:1573–7. doi: 10.1086/302170. [DOI] [PMC free article] [PubMed] [Google Scholar]
- 12.Vijayanathan V, Thomas T, Shirahata A, Thomas TJ. DNA condensation by polyamines: a laser light scattering study of structural effects. Biochemistry. 2001;40:13644–13651. doi: 10.1021/bi010993t. [DOI] [PubMed] [Google Scholar]
- 13.Paull TT, Carey M, Johnson RC. Yeast HMG proteins NHP6A/B potentiate promoter-specific transcriptional activation in vivo and assembly of preinitiation complexes in vitro. Genes Dev. 1996;10:2769–81. doi: 10.1101/gad.10.21.2769. [DOI] [PubMed] [Google Scholar]
- 14.Mitsouras K, Wong B, Arayata C, Johnson RC, Carey M. The DNA architectural protein HMGB1 displays two distinct modes of action that promote enhanceosome assembly. Mol Cell Biol. 2002;22:4390–401. doi: 10.1128/MCB.22.12.4390-4401.2002. [DOI] [PMC free article] [PubMed] [Google Scholar]
- 15.Jayaraman L, Moorthy NC, Murthy KG, Manley JL, Bustin M, Prives C. High mobility group protein-1 (HMG-1) is a unique activator of p53. Genes Dev. 1998;12:462–72. doi: 10.1101/gad.12.4.462. [DOI] [PMC free article] [PubMed] [Google Scholar]
- 16.Kruppa M, Moir RD, Kolodrubetz D, Willis IM. Nhp6, an HMG1 protein, functions in SNR6 transcription by RNA polymerase III in S. cerevisiae. Mol Cell. 2001;7:309–18. doi: 10.1016/s1097-2765(01)00179-4. [DOI] [PubMed] [Google Scholar]
- 17.Laser H, Bongards C, Schuller J, Heck S, Johnsson N, Lehming N. A new screen for protein interactions reveals that the Saccharomyces cerevisiae high mobility group proteins Nhp6A/B are involved in the regulation of the GAL1 promoter. Proc Natl Acad Sci U S A. 2000;97:13732–7. doi: 10.1073/pnas.250400997. [DOI] [PMC free article] [PubMed] [Google Scholar]
- 18.Travers AA, Ner SS, Churchill ME. DNA chaperones: a solution to a persistence problem? Cell. 1994;77:167–9. doi: 10.1016/0092-8674(94)90306-9. [DOI] [PubMed] [Google Scholar]
- 19.Paull TT, Haykinson MJ, Johnson RC. The nonspecific DNA-binding and -bending proteins HMG1 and HMG2 promote the assembly of complex nucleoprotein structures. Genes Dev. 1993;7:1521–34. doi: 10.1101/gad.7.8.1521. [DOI] [PubMed] [Google Scholar]
- 20.Van Noort J, Verbrugge S, Goosen N, Dekker C, Dame RT. Dual architectual roles of HU: Formation of flexible hinges and rigid filaments. Proc Natl Acad Sci U S A. 2004;101:6969–6974. doi: 10.1073/pnas.0308230101. [DOI] [PMC free article] [PubMed] [Google Scholar]
- 21.Murphy FVI, Sweet RM, Churchill ME. The structure of a chromosomal high mobility group protein-DNA complex reveals sequence-neutral mechanisms important for non-sequence-specific DNA recognition. EMBO J. 1999;18:6610–8. doi: 10.1093/emboj/18.23.6610. [DOI] [PMC free article] [PubMed] [Google Scholar]
- 22.Klass J, Murphy FI, Fouts S, Serenil M, Changela A, Siple J, Churchill ME. The role of intercalating residues in chromosomal high-mobility-group protein DNA binding, bending and specificity. Nucleic Acids Res. 2003;31:2852–2864. doi: 10.1093/nar/gkg389. [DOI] [PMC free article] [PubMed] [Google Scholar]
- 23.Churchill ME, Changela A, Dow LK, Krieg AJ. Interactions of high mobility group box proteins with DNA and chromatin. Methods Enzymol. 1999;304:99–103. doi: 10.1016/s0076-6879(99)04009-4. [DOI] [PubMed] [Google Scholar]
- 24.Stott K, Tang GSF, Lee KB, Thomas JO. Structure of a complex of tandem HMG boxes and DNA. J Mol Biol. 2006;360:90–104. doi: 10.1016/j.jmb.2006.04.059. [DOI] [PubMed] [Google Scholar]
- 25.McCauley M, Hardwidge PR, Maher LJ, 3rd, Williams MC. Dual binding modes for an HMG domain from human HMGB2 on DNA. Biophys J. 2005;89:353–64. doi: 10.1529/biophysj.104.052068. [DOI] [PMC free article] [PubMed] [Google Scholar]
- 26.McCauley MJ, Williams MC. Mechanisms of DNA binding determined in optical tweezers experiments. Biopolymers. 2007;85:154–168. doi: 10.1002/bip.20622. [DOI] [PubMed] [Google Scholar]
- 27.Hardwidge PR, Kahn JD, Maher LJ, 3rd, Ross ED. Dominant effect of protein charge rather than protein shape in apparent DNA bending by engineered bZIP domains; HMG proteins and DNA flexibility in transcription activation. Biochemistry. 2002;41:8277–88. doi: 10.1021/bi020185h. [DOI] [PubMed] [Google Scholar]
- 28.Hardwidge PR, Parkhurst KM, Parkhurst LJ, Maher LJ., 3rd Reflections on apparent DNA bending by charge variants of bZIP proteins. Biopolymers. 2003;69:110–7. doi: 10.1002/bip.10321. [DOI] [PubMed] [Google Scholar]
- 29.Rouzina I, Bloomfield VA. Force-induced melting of the DNA double helix. 1. Thermodynamic analysis. Biophys J. 2001;80:882–893. doi: 10.1016/S0006-3495(01)76067-5. [DOI] [PMC free article] [PubMed] [Google Scholar]
- 30.Mihailovic A, Vladescu I, McCauley M, Ly E, Williams MC, Spain EM, Nunez ME. Exploring the interaction of Ruthenium(II) polypyridyl complexes with DNA using single-molecule techniques. Langmuir. 2006;22:4699–4709. doi: 10.1021/la053242r. [DOI] [PMC free article] [PubMed] [Google Scholar]
- 31.Vladescu ID, McCauley MJ, Rouzina I, Williams MC. Mapping the phase diagram of single DNA molecule force-induced melting in the presence of ethidium. Phys Rev Lett. 2005;95:158102. doi: 10.1103/PhysRevLett.95.158102. [DOI] [PubMed] [Google Scholar]
- 32.Krautbauer R, Fischerlander S, Allen S, Gaub HE. Mechanical fingerprints of DNA drug complexes. Single Mol. 2002;3:97–103. [Google Scholar]
- 33.Wenner JR, Williams MC, Rouzina I, Bloomfield VA. Salt Dependence of the Elasticity and Overstretching Transition of Single DNA Molecules. Biophys J. 2002;82:3160–3169. doi: 10.1016/S0006-3495(02)75658-0. [DOI] [PMC free article] [PubMed] [Google Scholar]
- 34.Williams MC, Wenner JR, Rouzina I, Bloomfield VA. The effect of pH on the overstretching transition of dsDNA: Evidence of force-induced DNA melting. Biophys J. 2001;80:874–881. doi: 10.1016/S0006-3495(01)76066-3. [DOI] [PMC free article] [PubMed] [Google Scholar]
- 35.Williams MC, Rouzina I. Force Spectroscopy of Single DNA and RNA Molecules. Curr Opin Struct Biol. 2002;12:330–336. doi: 10.1016/s0959-440x(02)00340-8. [DOI] [PubMed] [Google Scholar]
- 36.Williams MC, Rouzina I, Bloomfield VA. Thermodynamics of DNA Interactions from Single Molecule Stretching Experiments. Acc Chem Res. 2002;35:159–166. doi: 10.1021/ar010045k. [DOI] [PubMed] [Google Scholar]
- 37.Skoko D, Yan J, Johnson RC, Marko JF. Low-force DNA condensation and discontinuous high-force decondensation reveal a loop-stabilizing function of the protein FIS. Phys Rev Lett. 2005;95 doi: 10.1103/PhysRevLett.95.208101. [DOI] [PubMed] [Google Scholar]
- 38.Odijk T. Stiff chains and filaments under tension. Macromolecules. 1995;28:7016–7018. [Google Scholar]
- 39.Baumann CG, Smith SB, Bloomfield VA, Bustamante C. Ionic Effects On the Elasticity Of Single DNA Molecules. Proc Natl Acad Sci U S A. 1997;94:6185–6190. doi: 10.1073/pnas.94.12.6185. [DOI] [PMC free article] [PubMed] [Google Scholar]
- 40.Podgornik R, Hansen PL, Parsegian PA. Elastic moduli renormalization in self-interacting stretchable polyelectrolytes. J Chem Phys. 2000;113:9343–9350. [Google Scholar]
- 41.Press WH, Teukolsky SA, Vetterling WT, Flannery BP. Numerical Recipies in C: The Art of Scientific Computing. Cambridge University Press; Cambridge: 2002. [Google Scholar]
- 42.Bevington PR, Robinson DK. Data Reduction and Error Analysis for the Physical Sciences. McGraw-Hill; New York: 1992. [Google Scholar]
- 43.Bouchiat C, Wang MD, Allemand JF, Strick T, Block SM, Croquette V. Estimating the persistence length of a Worm-Like Chain molecule from Force-Extension measurements. Biophys J. 1999;76:409–413. doi: 10.1016/s0006-3495(99)77207-3. [DOI] [PMC free article] [PubMed] [Google Scholar]
- 44.McGhee JD, von Hippel PH. Theoretical aspects of DNA-protein interactions: Cooperative and non-cooperative binding of large ligands to a one-dimensional homogeneous lattice. J Mol Biol. 1974;86:469–489. doi: 10.1016/0022-2836(74)90031-x. [DOI] [PubMed] [Google Scholar]
- 45.Rouzina I, Bloomfield VA. DNA bending by small, mobile multivalent cations. Biophys J. 1998;74:3152–64. doi: 10.1016/S0006-3495(98)78021-X. [DOI] [PMC free article] [PubMed] [Google Scholar]
- 46.Schellman JA. Flexibility of DNA. Biopolymers. 1974;13:217–26. doi: 10.1002/bip.1974.360130115. [DOI] [PubMed] [Google Scholar]
- 47.Taudte S, Xin H, Bell AJ, Kallenbach NR. Interactions between HMG boxes. Protein Eng. 2001;14:1015–1023. doi: 10.1093/protein/14.12.1015. [DOI] [PubMed] [Google Scholar]
- 48.Rouzina I, Bloomfield VA. Force-induced melting of the DNA double helix. 2. Effect of solution conditions. Biophys J. 2001;80:894–900. doi: 10.1016/S0006-3495(01)76068-7. [DOI] [PMC free article] [PubMed] [Google Scholar]
- 49.Cruceanu M, Urbaneja MA, Hixson CV, Johnson DG, Datta SA, Fivash MJ, Stephen AG, Fisher RJ, Gorelick RJ, Casas-Finet JR, Rein A, Rouzina I, Williams MC. Nucleic acid binding and chaperone properties of HIV-1 Gag and nucleocapsid proteins. Nucleic Acids Res. 2006;34:593–605. doi: 10.1093/nar/gkj458. [DOI] [PMC free article] [PubMed] [Google Scholar]
- 50.Cruceanu M, Gorelick RJ, Musier-Forsyth K, Rouzina I, Williams MC. Rapid kinetics of protein-nucleic acid interaction is a major component of HIV-1 nucleocapsid protein's nucleic acid chaperone function. J Mol Biol. 2006;363:867–877. doi: 10.1016/j.jmb.2006.08.070. [DOI] [PubMed] [Google Scholar]
- 51.Dragan AI, Read CM, Makeyeva EN, Milgotina EI, Churchill ME, Crane-Robinson C, Privalov PL. DNA binding and bending by HMG boxes: Energetic determinants of specificity. J Mol Biol. 2004;343:371–393. doi: 10.1016/j.jmb.2004.08.035. [DOI] [PubMed] [Google Scholar]
- 52.Lorenz M, Hillisch A, Payet D, Buttinelli M, Travers A, Diekmann S. DNA bending induced by high mobility group proteins studied by fluorescence resonance energy transfer. Biochemistry. 1999;38:12150–12158. doi: 10.1021/bi990459+. [DOI] [PubMed] [Google Scholar]
- 53.Jung Y, Lippard SJ. Nature of full-length HMGB1 binding to cisplatin-modified DNA. Biochemistry. 2003;42:2664–2671. doi: 10.1021/bi026972w. [DOI] [PubMed] [Google Scholar]
- 54.Grasser KD, Teo SH, Lee KB, Broadhurst RW, Rees C, Hardman CH, Thomas JO. DNA-binding properties of the tandem HMG boxes of high-mobility-group protein 1 (HMG1) Eur J Biochem. 1998;253:787–795. doi: 10.1046/j.1432-1327.1998.2530787.x. [DOI] [PubMed] [Google Scholar]
- 55.Cui T, Wei S, Brew K, Leng F. Energetics of binding the mammalian high mobility group protein HMGA2 to poly(dA-dT)2 and poly(dA)-poly(dT) J Mol Biol. 2005;325:629–645. doi: 10.1016/j.jmb.2005.07.048. [DOI] [PubMed] [Google Scholar]
- 56.Crothers DM, Metzger H. The influence of polyvalency on the binding properties of antibodies. Immunochemistry. 1972;9:341–357. doi: 10.1016/0019-2791(72)90097-3. [DOI] [PubMed] [Google Scholar]
- 57.Leuba SH, Bennink ML, Zlatanova J. Single molecule analysis of chromatin. Methods Enzymol. 2004;376:73–105. doi: 10.1016/S0076-6879(03)76006-6. [DOI] [PubMed] [Google Scholar]
- 58.Salomo M, Kroy K, Kegler K, Gutsche C, Struhalla M, Reinmuth J, Skokov W, Immisch C, Hahn U, Kremer F. Binding of TmHU to single dsDNA as observed by optical tweezers. J Mol Biol. 2006;359:769–776. doi: 10.1016/j.jmb.2006.04.006. [DOI] [PubMed] [Google Scholar]
- 59.Ashkin A. Forces of a single-beam gradient laser trap on a dielectric sphere in the ray optics regime. In: Sheetz MP, editor. Laser Tweezers in Cell Biology. Vol. 55. Academic Press; San Diego: 1998. pp. 1–27. [DOI] [PubMed] [Google Scholar]
- 60.Smith SB, Cui YJ, Bustamante C. Overstretching B-DNA: The elastic response of individual double-stranded and single-stranded DNA molecules. Science. 1996;271:795–799. doi: 10.1126/science.271.5250.795. [DOI] [PubMed] [Google Scholar]
- 61.Wang MD, Yin H, Landick R, Gelles J, Block SM. Stretching DNA With Optical Tweezers. Biophys J. 1997;72:1335–1346. doi: 10.1016/S0006-3495(97)78780-0. [DOI] [PMC free article] [PubMed] [Google Scholar]
- 62.Smith SB, Cui Y, Bustamante C. Optical-trap force transducer that operates by direct measurement of light momentum. Methods Enzymol. 2003;361:134–162. doi: 10.1016/s0076-6879(03)61009-8. [DOI] [PubMed] [Google Scholar]