

Abstract
Class switch recombination (CSR) is regulated by the expression of activation-induced deaminase (AID) and germline transcripts (GLTs). AID-dependent double-strand breaks (DSBs) are introduced into switch (S) regions and stimulate CSR. Although histone acetylation (Ac) has been well documented in transcription regulation, its role in DNA damage repair remains largely unexplored. The 1B4.B6 B cell line and normal splenic B cells were activated to undergo CSR and analyzed for histone Ac by chromatin immunoprecipitation (ChIP). A detailed study of the Iγ3-Sγ3-Cγ3 locus demonstrated that acetylated histones are focused to the Iγ3 exon and the Sγ3 region but not to the intergenic areas. Histone H3 Ac is strongly correlated with GLT expression at four S regions, whereas H4 Ac was better associated with B cell activation and AID expression. To more directly examine the relationship between H4 Ac and AID, LPS-activated AID KO and WT B cells were analyzed and express comparable levels of GLTs. In AID-deficient B cells, both histones H3 and H4 are reduced where H4 is more severely affected as compared with WT cells. Our findings raise the intriguing possibility that histone H4 Ac at S regions is a marker for chromatin modifications associated with DSB repair during CSR.
Immunoglobulin class switch recombination (CSR) involves an intrachromosomal deletional rearrangement that focuses on regions of repetitive switch (S) DNA located upstream of each CH gene (with the exception of Cδ) (for review see reference 1). S regions are comprised of 20–80 bp tandem repeats that are reiterated over 1–10 kb and are C-rich on the template strand (2). In CSR, composite Sμ-Sx junctions are formed on the chromosome while the intervening genomic material is looped out and excised as a circle. Thus, CSR is most likely initiated by formation of DNA double-strand breaks (DSBs) on the two participating S regions and completed through nonhomologous end joining (NHEJ) DNA repair (for reviews see references 3, 4). Targeting of particular S regions for CSR is dependent on expression of germline transcripts (GLTs) (for reviews see references 1, 5) and correlated with the expression of isotype-specific factors that facilitate CSR (6–8).
Although the molecular machineries that carryout CSR and somatic hypermutation (SHM) are distinct, both processes absolutely require activation induced deaminase (AID) (9–11) (for review see reference 12). CSR and SHM are initiated by AID through direct deamination of dC to form dU residues in single-stranded (ss) DNA of target genes (13–19). The resulting dU:dG mismatch could be differentially processed to produce mutations in V genes and DSBs in S regions. Although it has been proposed that AID functions as an RNA editing enzyme (20) the preponderance of evidence currently favors the DNA deamination model (for reviews see references 21, 22).
The specificity of AID for ssDNA templates requires that substrate become accessible in chromatin before CSR. GLT expression in S DNA leads to the production of R-loops in which the transcript stably associates with the template strand, thus displacing the nontemplate strand as ssDNA (23–27). The physiological significance of R-loops remains unclear because their presence only marginally increases the efficiency of CSR in size-matched S regions in knockin studies (28, 29). Furthermore, V genes are not G rich and are not prone to form R-loops or other secondary structures raising the question of how AID can target substrate during SHM. Biochemical studies indicate that a modified form of AID from B cells interacts with replication protein A (RPA) and that AID–RPA c complexes specifically bind to ssDNA located in transcription bubbles at DGYW motifs and deaminate DNA (16). Thus, transcription may be sufficient to allow AID–RPA access to ssDNA targets. Consistent with this model, the targeted deletion of promoters (30–33) and enhancers regulating GLT expression (34, 35) severely impairs CSR in cis.
Highly localized changes in chromatin structure are required to promote many DNA-directed processes, including transcription, replication, recombination, and repair. Nucleosomes are covalently modified on the NH2-terminal tails of histones H3 and H4 by histone modifiers to create localized DNA accessibility to trans-acting factors. Indeed, modification of histones H3 and H4 are correlated with V(D)J recombination in early B cell development (36–38) and with differential targeting of downstream S regions during CSR (39, 40). A fuller description of S region–specific chromatin modifications is required to better understand how these sites are rendered targets of AID attack. Chromatin-remodeling and histone-modifying enzymes also alter chromatin topology in response to DNA damage. Histone acetylation (Ac) and deAc are required for both regulated gene expression (for review see reference 41) and efficient DSB repair in yeast (42). AID-dependent double-strand breaks (DSBs) are introduced into S regions and stimulate recombination (43–46) and it is possible that DSB formation contributes to chromatin modification. We sought to determine whether histone Ac at S regions is a consequence of DSB formation and functions to provide DNA with accessibility to repair proteins that facilitate NHEJ.
Herein, we report that transcription, B cell activation, and AID expression influence histone Ac of S region chromatin. These processes are both overlapping and hierarchically organized with respect to their impact on H3 and H4 histone Ac. We found that H3 Ac is more strongly correlated with GLT expression. Strikingly, H3 and H4 Ac in S region chromatin are also correlated with AID expression where H4 Ac is more highly influenced. These studies suggest that chromatin modification may occur secondary to AID-directed DNA damage and may be important for DNA repair targeted to the S regions.
RESULTS
The chromatin immunoprecipitation (ChIP) assay was used to examine the acetylated histone status in four S regions and their associated GLT promoters using anti (α)-acetylated histone H3 (H3Ac) and H4 (H4Ac) antiserum. CSR is a dynamic process that is dependent on GLT and AID expression, DSB formation specific to S regions, and proliferation (5, 12, 46–48). We chose to analyze the B cells at 48 h of activation for histone Ac of the IgH locus because GLTs and AID are well expressed and AID-dependent DSBs are formed but recombination has not yet occurred. Consequently, the 48-h point likely represents events that are predisposing for CSR, whereas at later times these modifications may reflect changes that occur after recombination. At 5 d after LPS induction, robust CSR has occurred and its detection is representative of the frequency of switching.
Acetylated histones mark S regions targeted for CSR
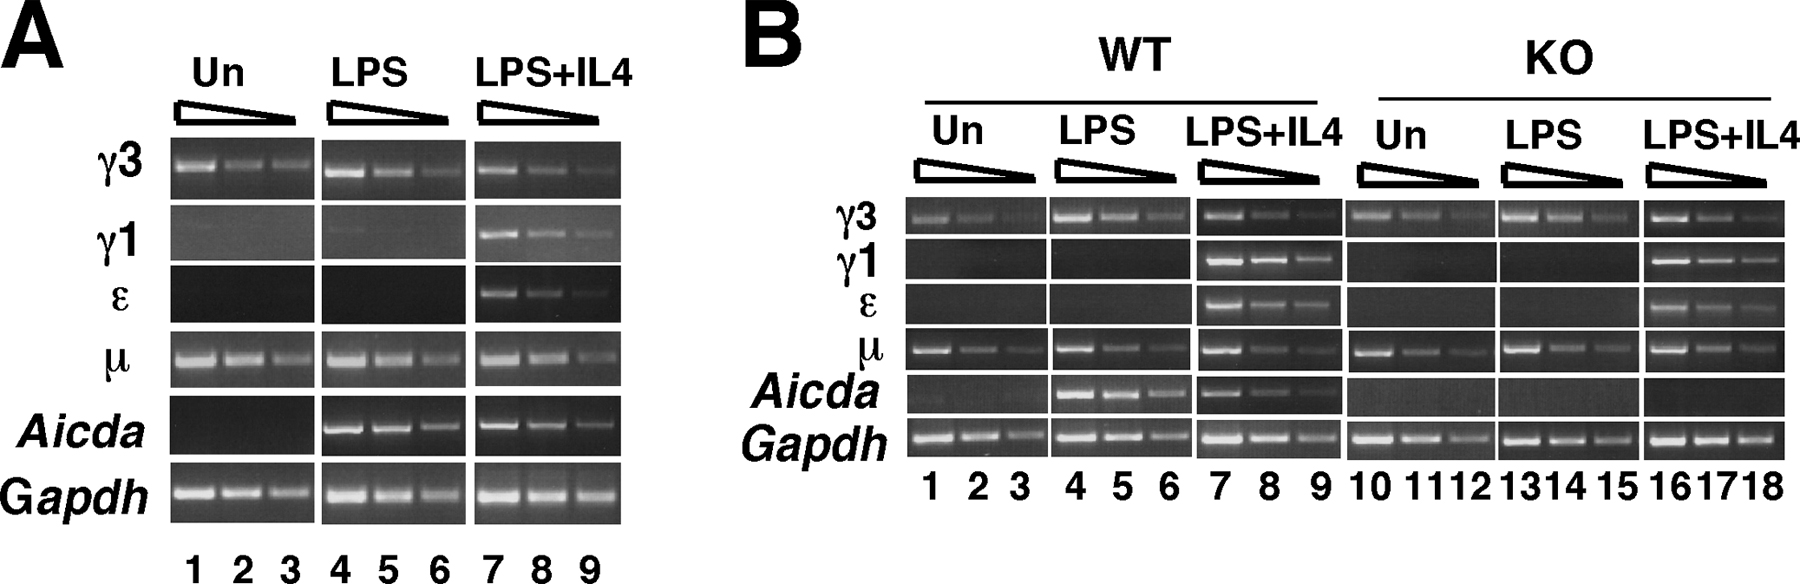
The 1.B4.B6 cell line is capable of highly regulated GLT expression and inducible CSR (7). Examination of the status of histone Ac at S regions in 1.B4.B6 cells provides an opportunity to determine the relationship between induction of Ac and GLT expression in a homogeneous population of cells. 1.B4.B6 cells were successfully activated to switch as determined by the induction of the μ and γ3 GLTs compared with the Gapdh loading control after 48 h of stimulation with LPS+CD40 ligand (CD40L) (Fig. 1 A). These GLTs are nearly undetectable in unstimulated 1.B4.B6 cells, whereas they are induced in treated cells (Fig. 1 A). Activation of the cells with LPS+CD40L+IL-4 for 48 h represses the γ3 GLT and induces the γ1 and ɛ GLTs, as previously reported (Fig. 1 A) (7). The postswitch transcript expression profile, an indicator of successful CSR, was analyzed after 5 d of stimulation and tightly recapitulated the GLT expression pattern (Fig. 1 B) (11).
Figure 1.

Histones H3 and H4 become hyperacetylated in 1.B4.B6 cells induced to undergo CSR. GLTs (A) and postswitch transcripts (B) were analyzed by semi-quantitative RT-PCR using cDNA derived from 1.B4.B6 cells that were unstimulated (Un) or activated with LPS+CD40L (L+C) and LPS+CD40L+IL-4 (L+C+IL4) for 48 h and 5 d, respectively. GLT and Aicda PCR products were harvested after 33 cycles (lanes 1, 5, 9), 31 cycles (lanes 2, 6, 10), 29 cycles (lanes 3, 7, 11), and 27 cycles (lanes 4, 8, 12). Gapdh PCR products were harvested after 30 cycles (lanes 1, 5, 9), 28 cycles (lanes 2, 6, 10), 26 cycles (lanes 3, 7, 11), and 24 cycles (lanes 4, 8, 12). (B) Postswitch PCR products were harvested after 33 cycles (lanes 1, 4, 7), 31 cycles (lanes 2, 5, 8), and 29 cycles (lanes 3, 6, 9). Gapdh PCR products were harvested after 30 cycles (lanes 1, 4, 7), 28 cycles (lanes 2, 5, 8), and 26 cycles (lanes 3, 6, 9). (C) A schematic diagram is shown of a generic Ix-S-Cx locus containing the I exon (Ix), an S region, and a constant region gene (Cx). The position of primer sets are indicated by the arrows. (D) Anti-(α)H3Ac or αH4Ac histone antisera were used in ChIP assays performed on nuclei derived from 1.B4.B6 cells that were unstimulated or stimulated with LPS+CD40L and LPS+CD40L+IL-4 for 48 h. The results from five samples derived from three independent experiments are shown with standard deviations. Samples were analyzed in duplicate and averaged. All ChIP PCR values were normalized against ChIP for the Gapdh locus and input DNA in the same sample.
We designed primers to amplify regions immediately flanking the 3′ ends of the Sμ, Sγ3, Sγ1, and Sɛ regions and three of their associated GLT promoters, Iγ3P, Iγ1P, and IɛP (Table I and Fig. 1 C). Primers located within S regions are difficult to design as a result of the reiterative composition of these DNA sequences. Quantitation of immunopreciptitated H3 Ac and H4 Ac histones was determined by quantitative real time (q) PCR from 1.B4.B6 cells that were unstimulated, or activated with LPS+CD40L and LPS+CD40L+IL-4 for 48 h. Each histogram represents the average value ± SD of five independent experimental samples derived from at least three independent B cell activations. The histone Ac index is calculated as the PCR product concentration relative to 10% input and indicates the enrichment of a sequence after immunoprecipitation. For 1.B4.B6 cells, the histone Ac data from the IgH locus was also normalized to that from the Gapdh gene to factor in the efficiency of immunoprecipitation for each sample. The fold induction of Ac is calculated by taking the ratio of the Ac index from induced cells divided by that from unstimulated cells (see Materials and methods).
Table I.
Primers used in chromatin immunoprecipitation assays
| Amplicon | Forward primer | Reverse primer |
|---|---|---|
| SμDS | CTGAATGAGTTTCACCAGGCC | GCCTGTCCTGCTTGGCTTC |
| Iγ3UP | GGCCCCTTGAACCAAACCT | TCAGTCTCACCTGCATGGTCAT |
| Iγ3-P | CACTCACTCTTGCCTTCTCCTACAT | GGGGGAAAACTGGTACAGCAGTGTG |
| Iγ3Ex | AGATCCCAAAGCTAAGCTCCTG | CAGAGAGACCCCCTCCACAGT |
| Iγ3Ex-D | GCCAAGAGTGTGGAACTCTAAGGT | GTGCCTCAGTACCTCTCAGCTG |
| Sγ3-U | GCTGAGAGTATGCACAGCCA | GGATCATGGAAACTCCTCCG |
| Sγ3-D | ACAGGGTCCCAGGTTATGCAG | GTCACTCACACTGGCTTCCC |
| Cγ3-U | GTTCCCATTAGAAAAATACC | CTGCTAGATTCTGCACTGAC |
| Cγ3-D | ATGGTGACCACGAGGGAGAG | CACCTTGGGAAGGCAGTGAGA |
| Iγ1-P | GAGTCTCAAGGGTACCGCCTCA | CAGAGTCACAGCCTTTGTCCCA |
| Sγ1-U | GGAGGAGATATCCAAGAGCA | CAGCTCTTTTGCAGGTCTTG |
| Sγ1-D | CAGGCAAACTAAACCAGTGGG | AGGATGTCCACCCTCACCCAGGC |
| Iɛ-P | GCCTCAGGGCAGTGACACTC | GCCTCAGTGCCCTCAGCTAA |
| Sɛ-U | AGGAGAGGCTGGAGAGGAATCG | AGGGCAGCACAGATCCCACC |
| Sɛ-D | AGCTGAGCCCCTCTCTCAGG | CACTCACTGCCCCTAGCTGGCT |
| VH/JH3 | GGAAAGGGTCTGCGAGTGGCT | CCTTGGCCCCAGTAAGCAA |
| β-globin | GCCTTGCCTGTTCCTGCTC | CAGACCATAAACTGTATTTTTCTTATTGAGCCC |
| Mb-1 | CCACGCACTAGAGAGAGACTCAA | CCGCCTCACTTCCTGTTCAGCCG |
In unstimulated 1.B4.B6 cells, basal Ac levels were detectable across all the regions analyzed, with Sμ being the highest for both H3 Ac and H4 Ac histones (Fig. 1 D). The hyperacetylated H3 and H4 histones in the Sμ region are correlated with detectable μ GLT expression and very low amounts of Aicda transcription (Fig. 1, A and D). When cells are activated with LPS+CD40L histone Ac levels in Sμ, Iγ3 promoter (P) and Sγ3 are induced, whereas the S regions and promoters for the γ1 and ɛ loci are only slightly affected (Fig. 1 D). Reciprocally, induction with LPS+CD40L+IL-4 repressed the γ3 locus and induced Ac at γ1 and ɛ loci, whereas Sμ was unaffected. The reciprocal relationship between the relative levels of Ac induced in the presence and absence of IL-4 are also clearly evident when the change in the fold induction of Ac is calculated (Fig. 1 D, rightmost panels). PCR reactions of these regions were also run on ChIP samples and resolved on agarose gels to validate the real-time PCR quantitation (Fig. S1, available at http://www.jem.org/cgi/content/full/jem.20051774/DC1). The I region promoter and S region–specific increases in histone Ac in 1.B4.B6 cells activated to switch strongly indicate a functional role for chromatin modification during CSR. These studies also demonstrate a correlation between GLT expression and histone Ac and generally agree with previous studies (39, 40). It should be noted, however, that the degree of induced Ac at the Iγ3P was significantly lower than that found for Sγ3 and for other I region promoters. In contrast, the relative levels of Ac for Iγ1P and IɛP were very similar to their respective S regions. This discrepancy is addressed in the following sections.
The relative level of H3 Ac may distinguish VH and Sμ DNA in 1.B4.B6 cells
SHM does not occur in LPS-activated B cells that are active for CSR (49), although the VH and S regions are both transcriptionally active. It is not possible to compare VH with Sμ Ac in splenic B cells as a result of the heterogeneity of VH region usage. To circumvent this problem, we compared the Ac status of the expressed VH gene and the Sμ region in 1.B4.B6 cells that were unstimulated or treated with CD40L+LPS in the presence or absence of IL-4. The productively rearranged VH gene is comprised of Q52, DFL16.2, and JH3 upstream of Cμ (7) and was analyzed in ChIP assays using VH and JH3-specific primers (Table I). We found that in the VH region H3 and H4 were both hyperacetylated, although H3 Ac was approximately two to threefold higher than H4 (Fig. 2). We also found that H3 Ac for VH was approximately twofold higher than that for Sμ. The relative ratio of Ac for Sμ and Sγ3 is similar to that observed in Fig. 1. It is striking that H4 Ac is not induced in the VH gene after cell activation, whereas this modification is marked in all downstream S regions tested (Figs.1 and 2). Based on these data, it is possible that the differential levels of H3 Ac serve as a mark to distinguish the VH and Sμ regions for recognition by AID during CSR, although additional work is required to confirm this result.
Figure 2.

In 1.B4.B6 cells, the VH and Sμ regions have distinguishable histone Ac patterns. Anti-(α)H3Ac or αH4Ac histone antisera were used in ChIP assays performed on nuclei derived from 1.B4.B6 cells that were unstimulated (Unstim) or stimulated with LPS+CD40L (L+C) and LPS+CD40L+IL-4 (L+C+IL4) for 48 h. The results from four immunoprecipitated samples derived from three independent experiments are shown with standard deviations. Samples were analyzed in duplicate then averaged. All ChIP PCR values were normalized against ChIP for the Gapdh locus and input DNA in the same sample.
Histone Ac is localized to two distinct subdomains in the Iγ3-Sγ3-Cγ3 locus
We wished to determine whether acetylated nucleosomes are evenly distributed throughout the I-S-CH locus or are locally constrained to specific subregions. Eight primer pairs beginning 5 kb upstream of the Sγ3 region and extending 2 kb downstream of Cγ3 were designed to span the Iγ3-Sγ3-Cγ3 locus (Fig. 3 A). 1.B4.B6 cells were activated with LPS+CD40L in the presence or absence of IL-4 for 48 h or unstimulated. In unstimulated cells, histone Ac levels were low across the γ3 locus (Fig. 3 B). After 48 h of stimulation, two subregions of hyperAc were evident and centered on the Iγ3 exon and the Sγ3 region. Treatment of the 1.B4.B6 cells with LPS+CD40L+IL-4 led to a reduction of H3 Ac across both Iγ3 exon and the Sγ3 region. Although H4 Ac was slightly reduced in the Iγ3 exon, it was dramatically repressed in the Sγ3 region. The specificity of reduced H4 Ac to the Sγ3 region demonstrates that H3 and H4 Ac levels are differentially regulated in the Sγ3 region.
Figure 3.

Distinct subregions of acetylated histones are induced in the Iγ3 exon and the Sγ3 region in LPS activated splenic B cells and stimulated 1B4.B6 cells. (A) Eight primer sets used in the ChIP assays are located on a schematic diagram of the γ3 locus. The distance, in kilobases, between each primer set is shown under the horizontal bars. (B) Nuclei from 1.B4.B6 cells were used in ChIP analyses. Cells were either untreated or stimulated with LPS+CD40L in the presence or absence of IL-4 for 48 h and at least five samples derived from three independent experiments were tested. All ChIP PCR values were normalized against ChIP for the Gapdh locus and input DNA in the same sample. (C) Anti-H3Ac or αH4Ac histone antisera were used in ChIP assays performed on nuclei derived from BALB/c (nu/nu) splenic B cells. A time course study was performed in which cells were activated with LPS for 0, 24, and 48 h or with LPS+IL-4 for 48 h from at least four samples derived from two independent experiments. All qPCR values were normalized against input DNA to obtain the Ac histone index.
To further examine this issue, splenic B cells were activated with LPS in the presence or absence of IL-4 for 0, 24, and 48 h and histone Ac was determined by ChIP analysis. Ac levels progressively increased over time across γ3 locus for both H3 and H4 histones and peaked over the Iγ3 exon and at the 5′ end of the Sγ3 region (Fig. 3 C). The Iγ3 promoter region is located upstream of the Iγ3 exon and is less acetylated relative to the Iγ3 exon and similar to the region downstream of Sγ3 (Fig. 3 A). The areas analyzed by PCR for the Iγ3 promoter and Iγ3 exon are separated by 700 bp. H3 and H4 Ac also slightly decreased in the region between the Iγ3 exon and Sγ3. Significantly, B cell activation with LPS+IL-4 for 48 h led to reduced H3 and H4 histone Ac across the entire γ3 locus, indicating that chromatin is in a relatively inaccessible state when B cells are activated to switch μ→γ1. The bimodal distribution of acetylated nucleosomes spanning the Iγ3-Sγ3 region observed in activated 1.B4.B6 cells was less apparent in LPS-activated B cells. The more subtle findings in LPS B cells may be a result of the inherent heterogeneity of the primary B cell cultures or the difference between normal and transformed cells. For both 1.B4.B6 cells and LPS B cells, Ac does not extend into the intergenic regions, demonstrating local gene-specific control.
The relatively low level of histone Ac at the Iγ3 promoter region was surprising especially because the Iγ1 and Iɛ promoters become hyperacetylated after the specific induction of the promoters and expression of their associated GLTs (Fig. 1 D) (39). The primers used for ChIP analyses of the GLT promoters are all positioned over the NF-κB binding sites (39) (Table I). The positions of the ɛ and γ1 GLT promoters are centered on two or three NF-κB binding sites located immediately 5′ of the Iɛ and Iγ1 exons, respectively (50, 51). Although the γ3 GLT promoter is also centered on an NF-κB binding site, this motif is located 433 bp upstream of its I box (52). Thus, the γ3 promoter and the Iγ3 exon are relatively well separated, whereas the γ1 and ɛ promoters and I boxes are nearly superimposed. Consequently, the primers scoring for promoter Ac in the γ1 and ɛ loci are also scoring for I box Ac. It is, therefore, possible that hyperAc emanating from the γ1 and ɛ promoters actually originate from their I exons.
Histone Ac at S regions is only partially correlated with GLT expression in splenic B cells
To more directly examine the relationship between GLT expression and histone Ac, it would be efficacious to perform the ChIP analysis in the presence of GLTs and in the absence of AID and CSR. GLTs are constitutively expressed in unstimulated splenic B cells in some strains of mice. However, AID expression is strictly dependent on mitogenic induction in these cells. This provides an opportunity to assess the effect of transcription on histone Ac in S regions in the absence or presence of AID. B cells were successfully activated as determined by the induction of Aicda and GLTs as compared with the Gapdh loading control after 48 h of stimulation with LPS only or LPS and IL-4 (Fig. 4 A). The γ3 GLTs continue their expression after LPS activation and are not affected by IL-4 treatment, whereas the γ1 and ɛ GLT expression are LPS and IL-4 dependent. The postswitch transcript expression profile is largely correlated with the expression of GLTs and AID (Fig. 4 A, right).
Figure 4.

Histone H3 but not H4 is acetylated in S regions actively expressing GLTs in unstimulated splenic B cells. (A) GLTs (left) and postswitch transcripts (right) were analyzed by semi-quantitative RT-PCR using cDNAs derived from splenic B cells of BALB/c nu/nu that were unstimulated or activated with LPS and LPS+IL-4 for 48 h and 5 d, respectively. Gapdh PCR products were harvested after 30 cycles (lanes 1, 4, 7), 28 cycles (lanes 2, 5, 8), and 26 cycles (lanes 3, 6, 9) (left and right). GLTs and Aicda PCR products and postswitch PCR products were harvested after 33 cycles (lanes 1, 4, 7), 31 cycles (lanes 2, 5, 8), and 29 cycles (lanes 3, 6, 9). (B) A schematic diagram of a generic Ix-S-Cx locus containing the I exon (Ix), an S region, and a constant region gene (Cx) is shown. The position of the primer sets flanking the S region upstream (Sx-U) and downstream (Sx-D) are shown. (C) ChIP using αH3Ac or αH4Ac histone antisera was performed on nuclei derived from either unstimulated cells or cells stimulated with LPS and LPS+ IL-4 for 48 h from at least four samples derived from two independent experiments. All samples were analyzed in duplicate and averaged; SDs are shown. All qPCR values were normalized against input DNA to obtain the Ac histone index. The fold induction is calculated from the ratio of Ac histone index from stimulated and unstimulated cells.
Using these B cell cultures, we studied the level of H3 Ac and H4 Ac histones at S regions in nuclei from B cells either unstimulated or activated with LPS or LPS+IL-4 for 48 h (Fig. 4 C). The β-globin gene, which is not expressed in B lymphocytes, provided a negative control for histone Ac. In unstimulated splenic B cells, the baseline for histone H3 Ac at Sμ and Sγ3 regions was high relative to that found for Sγ1 and Sɛ regions and is correlated with the expression of the μ and γ3 GLTs. In contrast, the baseline for H4 histone Ac was low for all the S regions studied, implying that H4 Ac may be independent of transcription.
After LPS activation, the Sμ and Sγ3 regions become newly acetylated on H4 and further hyperacetylated on H3 histones. Stimulation with LPS+IL-4 leads to reduced H3 Ac of Sγ3 and hyperAc of Sγ1 and Sɛ. This is particularly apparent when the fold induction of Ac is calculated (Fig. 4 C, right). It is striking that, in activated B cells, the level of induced Ac in S regions for H4 Ac was three- to fourfold higher than H3 Ac. Furthermore, there was detectable hyperAc at the Sγ1 locus in response to LPS alone, particularly for histone H4, whereas γ1 GLT expression was low. Significantly, some μ→γ1 switching is found under these conditions (Fig. 4 A). Reciprocally, treatment of splenic B cells with LPS+IL-4 did not reduce γ3 GLTs, but instead led to reduced Ac at Sγ3 and consequently reduced a level of μ→γ3 CSR as indicated by postswitch transcripts expression levels (Fig. 4, A and C). It is noteworthy that histone H3 and H4 Ac levels across Iγ3-Sγ3 increase between the 24- and 48-h time points, even though no further change is found for GLT expression (Figs. 3 B and 4 A; Fig. S2, available at http://www.jem.org/cgi/content/full/jem.20051774/DC1). Together, these findings indicate that a component of histone Ac of S region DNA is correlated with transcription whereas another component is most strongly associated with B cell activation and is less tightly correlated with GLT expression.
Histone acetylation is biased toward the Sμ proximal side of the CH locus in LPS-activated splenic B cells
Ac progressively decreased across the locus so that H3 Ac histone index at Sμ was 10-fold higher than Sɛ. This gradient may be a result of the initially high basal level of H3 histone Ac associated with the transcriptionally active μ and γ3 GLTs in unstimulated B cells. However, in these B cells, the basal level of histone H4 Ac was very low in all four S regions, irrespective of the GLT expression status and LPS induction led to an asymmetrical increase of H4 Ac across the locus (Fig. 4 C, left). Globally, the level of induced histone Ac shows a clear bias toward the Eμ-proximal portion of the CH locus for both H3 and H4 histones in activated splenic B cells.
Histone H4 Ac in S regions is dependent on AID expression
The constitutive expression of the μ and γ3 GLTs in unstimulated splenic B cells is correlated with H3 hyperAc at these loci, whereas H4 hyperAc emerges after B cell activation and AID expression (Fig. 4, A and C). Thus, H4 Ac parallels AID expression better than GLT expression and may be a consequence of DSB formation. To test this proposition, we investigated the H3 and H4 Ac status of S regions in WT and AID KO B cells that were unstimulated or activated with LPS alone or LPS and IL-4 for 48 h. The GLT expression levels were essentially identical in AID WT and KO B cells that were unstimulated or activated for 48 h (Fig. 5 A) and are similar to those found for BALB/c splenic B cells (Fig. 4 A). Furthermore, CSR was successfully activated for WT but not KO B cells as determined by postswitch transcript analyses (Fig. 4 B). Histone H3 and H4 Ac levels in four S regions were determined and compared with the Mb-1 gene after normalization to input DNA (Fig. 5 C). The Mb-1 gene, which is expressed in mature B lymphocytes but is not a substrate for DSBs, showed few differences in the levels of H3 or H4 histone Ac between AID WT and KO B cells (Fig. 5 C). LPS activation of the KO, induced Mb-1–associated H3 and H4 Ac approximately threefold more than in the WT and may indicate that, under certain conditions, AID expression affects the B cell differentiation state. However, we conclude that this is unlikely because no differences with respect to global gene expression were found in microarray analyses that scored 7,000 genes (unpublished data). We conclude that the differentiation state of AID WT and KO B cells is essentially the same after LPS induction and that use of the Mb-1 gene as a control for the Ac studies is valid.
Figure 5.

Histone H4 Ac is significantly reduced in AID KO B cells stimulated with LPS. GLTs (A) and postswitch transcripts (B) were analyzed by semi-quantitative RT-PCR using cDNAs derived from splenic B cells that were unstimulated or activated with LPS and LPS+IL-4 for 48 h and 5 d, respectively. (A) Gapdh PCR products were harvested after 30 cycles (lanes 1, 4, 7, 10, 13, 16), 28 cycles (lanes 2, 5, 8, 11, 14, 17), and 26 cycles (lanes 3, 6, 9, 12, 15, 18) (left and right). GLT and Aicda PCR products and postswitch PCR products were harvested after 33 cycles (lanes 1, 4, 7, 10, 13, 16), 31 cycles (lanes 2, 5, 8, 11, 14, 17), and 29 cycles (lanes 3, 6, 9, 12, 15, 18). The position of the primers flanking the S region upstream (Sx-U) and downstream (Sx-D) are shown in Fig. 4. (C) Anti-H3 or αH4 acetylated histone antisera were used in ChIP assays performed on nuclei derived from AID WT and KO splenic B cells that were stimulated with LPS or LPS+IL-4 for 48 h and at least four samples derived from two independent experiments were tested. All samples were analyzed in duplicate and averaged. All ChIP PCR values were normalized against input to obtain the Ac histone index (left) and fold induction (right) and SDs are shown. The Mb-1 gene was used as a specificity control to compare levels of Ac histone in WT and KO samples.
We found that H3 histone Ac indices were consistently twofold lower in AID KO B cells as compared with those from the WT (Fig. 5 C). The WT B cell profile of IL-4–induced repression of H3 Ac at Sγ3 and induction at Sγ1 and Sɛ was paralleled in the AID KO B cells, albeit at reduced levels (Fig. 5 C). Strikingly, histone H4 was measurably hypoacetylated in AID KO B cells as compared with WT and was not subject to the repressive or stimulatory influence of IL-4. The induction of H4 Ac is reduced four- to fivefold in the AID KO (Fig. 5 C, right). The dependency of histone H4 Ac on AID expression is consistent with the possibility that a large component of this chromatin modification in S regions is triggered by direct involvement of AID and/or by DSB formation.
To further examine this phenomenon, we performed a detailed analysis of the H3 and H4 Ac pattern in the Iγ3-Sγ3-Cγ3 region in AID WT and KO B cells. B cells were either unstimulated or activated by LPS for 24 and/or 48 h and analyzed by ChIP. We found that, for the WT B cells, H3 and H4 Ac increased over time and focused to the Iγ3 exon and Sγ3 region (Fig. 6 A) as previously observed (Fig. 3 B). Although some increase of H3 Ac was found at 24 h of activation for KO B cells, these cells failed to accumulate acetylated H3 histones between 24 and 48 h of activation in the Iγ3 exon and Sγ3 region (Fig. 6, A and B). Thus, late-forming histone Ac is AID dependent and is distinguished from that which occurs between 0 and 24 h. Similar results were observed when B cells were analyzed for H4 Ac, which was more poorly induced than H3 Ac, consistent with the global IgH locus analysis (Figs. 5 C and 6, C and D). Collectively, these findings indicate that a large component of H3 Ac and an even more significant component of H4 Ac are dependent on the expression of AID.
Figure 6.

Histone H3 and H4 Ac in significantly reduced across the γ3 locus in LPS activated AID KO B cells. (A and B) Splenic B cells from AID WT and AID KO mice were activated with LPS for 0, 24, and 48 h and analyzed by ChIP for Ac histone H3 using at least four samples derived from two independent experiments. Histone indices (A) and fold inductions (B) after 24 and 48 h of activation with LPS are shown. (C and D) Splenic B cells from AID WT and AID KO mice were activated with LPS for 0 and 48 h and then analyzed by ChIP for Ac histone H4 using two samples derived from two independent experiments. Histone indices (C) and fold inductions (D) following 48 h of activation with LPS are shown. The six primer sets used in the ChIP assays are located on a schematic diagram of the γ3 locus shown in Fig. 2.
DISCUSSION
A global analysis of histone Ac status in S regions of B cells indicates that activation of CSR is correlated with changes in total H3 and H4 Ac, in agreement with previous studies (39, 40). Our studies newly demonstrate that transcription, B cell activation, and AID expression differentially impact on chromatin modification of S DNA and these processes are hierarchically organized with respect to their influence on histone H3 and H4 Ac. Several observations support this conclusion. Our data demonstrate that in unstimulated splenic B cells in which μ and γ3 GLTs are constitutively expressed, the Sμ and Sγ3 loci contain acetylated H3 but not H4 histones, indicating that H3 Ac is preferentially targeted by germline transcription. B cell activation after LPS treatment stimulates both H3 and H4 Ac at Sγ1 in the absence of GLTs, demonstrating that histone Ac of these loci can occur by a transcription-independent process. Examination of S regions across the IgH locus in AID-deficient mice indicates that histone Ac is significantly reduced compared with that found in WT B cells, showing that AID expression also influences chromatin remodeling. We conclude that, in S regions, H3 and H4 Ac are most strongly correlated with germline transcription and AID expression, respectively. It should be stressed that these correlations are not absolute and some overlap of Ac potential for both H3 and H4 histones after B cell activation is also observed. It is also important to note that several acetylated lysines are detected with the αH3 and αH4 antisera used in our studies. When these modifications are further dissected, it is conceivable that some will be strongly correlated with transcription, whereas others will be clearly associated with AID expression.
Detailed analysis of the histone Ac status for the Iγ3-Sγ3-Cγ3 locus before and during CSR yielded several unanticipated findings. Histone Ac is localized to the Iγ3 exon, but not to the GLT promoter. It is now well established that, in many genes, histone Ac levels are highest at transcription start sites with a gradual decline over the length of the gene (53–55). Histone Ac is also focused to the Sγ3 region and not to intergenic areas or the Cγ3 exons, demonstrating that these chromatin modifications are targeted and not spread across the entire IgH locus. In 1.B4.B6 cells, the Iγ3 box and the Sγ3 region were differentially regulated with respect to histone Ac. We observed that, in response to IL-4, conditions that suppressed μ→γ3 CSR, H4 Ac was repressed in the Sγ3 region, but not the Iγ3 exon. Although these findings are limited to the 1.B4.B6 cell line, they nonetheless demonstrate that the I box and S region loci can be differentially targeted by histone acetyltransferases and deacetylases and imply that chromatin remodeling may specifically identify the S region for AID attack.
Our finding that transcriptionally active Sμ and Sγ3 are acetylated on H3 histones in unstimulated splenic B cells demonstrates that GLT expression is correlated with histone H3 Ac, but not H4 Ac. It is now well established that transcription disrupts chromatin through partial disassembly followed by rapid reassembly of the underlying nucleosomes (56, 57). Histone turnover and deposition of variant histone H3.3 occurs in transcriptionally active genes (58–60). H3.3 is highly enriched for modifications that are associated with active chromatin, indicating that transcription plays a role in establishing and maintaining an active epigenetic state (61). It is, therefore, likely that increased H3 Ac at S regions is causally linked with GLT expression.
Chromatin is remodeled before and during transcription initiation by ATP-dependent remodelers and during RNA polymerase II transcription elongation (for review see reference 62). There are two theories, which are not mutually exclusive, as to how histone Ac might facilitate transcription and accessibility. Ac could affect transcription by neutralizing histone charge, thus weakening histone–DNA interactions and reducing chromatin compaction (for review see reference 63). Second, the resulting pattern or “code” of histone modifications may function as an interface for additional factors that regulate gene expression and DNA accessibility, including ATP-dependent remodeling complexes that alter nucleosome phasing, and heterochromatin-associated proteins that are thought to silence gene expression (64–66). Thus, S region accessibility, germline transcription, and histone Ac are per force coupled.
Chromatin modifications at S regions have been interpreted to represent histone marks that serve to target them for AID attack (39, 40). However, chromatin remodeling also occurs secondary to DNA lesions. For example, DNA DSBs induce phosphorylation of the variant histone, H2AX (γH2AX) (67), and γH2AX repair foci have been found associated with both CSR and VDJ recombination, processes that involve a DSB intermediate (68, 69). Phosphorylated H2AX has been detected at Sμ regions in B cells undergoing CSR by ChIP assays (70) and CSR is defective in H2AX-deficient mice (71). Strikingly, histone Ac and deAc have also been linked to alteration of chromatin topology in response to DNA damage (72). The generation of DSBs has been correlated with histone H4 hyperAc in yeast and mammalian cells (42, 73–75). These observations compel us to consider the possibility that transcription-independent histone hyperAc at S regions undergoing CSR is linked to a DNA repair process and unrelated to the initial generation of accessibility. DSBs in S regions are detected after mitogen activation of B cells (47) and are AID and UNG dependent (43, 45, 46). Our studies clearly indicate that histone H4 Ac in S regions is linked to AID expression because AID deficiency leads to a reduction of H4 Ac in B cells stimulated to undergo CSR, whereas H3 Ac is more modestly affected. In yeast, Ac of histone H4 by EsaI is essential for repair of DSBs through both homologous recombination and NHEJ repair pathways (73). The human homologue of EsaI, Tip60, is a component of the large multisubunit complex NuA4 that contains HAT activity and is also essential for DSB repair (74, 75). Further investigation is necessary to fully elucidate a causal relationship of H4 Ac in S DNA with DSB repair during CSR.
A major unresolved question is how AID is targeted specifically to its substrates: V regions in the case of SHM and S regions during CSR when both V and S regions are transcriptionally active. LPS-activated B cells transcribe both the VH and Sμ regions, but undergo only CSR and not SHM (49). Our analysis of histone Ac patterns in 1.B4.B6 cells demonstrates higher levels of acetylated H3 histones in VH as compared with Sμ and this difference is maintained after activation of the CSR program. Furthermore, H4 Ac is not inducible for the VH or Sμ regions as it is for all S regions tested. Therefore, in 1.B4.B6 cells, which undergo CSR but not SHM, there is a skewed ratio of chromatin modifications in the VH and Sμ elements that serve to differentiate between these regions. A study using the GC-derived cell line BL2, capable of induced SHM, concluded that histone Ac is partially responsible for targeting SHM to the IgH V region because this region is hyperacetylated as compared with Cμ (76). However, in that analysis, the Sμ region was not examined for histone Ac. More recently, H3 and H4 Ac levels were found to be similar in the VH and Sμ of naive and purified GC B cells. After induction of SHM, both VH and Sμ regions showed evidence of DNA damage by virtue of heightened levels of H2BSER14P, suggesting that in these cells both regions are targeted for AID attack (77). LPS-activated mature splenic B cells are restricted to CSR. In contrast, GC B cells and GC B cell lines appear to be capable of both SHM and CSR, depending on the activation conditions (78, 79). Therefore, in GC B cells, the default chromatin topology may provide for accessibility to both VH and Sμ by AID. Additional work is required to determine whether the different levels of histone Ac in VH and Sμ regions are functionally meaningful.
MATERIALS AND METHODS
Mice, cell culture, and RT-PCR analysis.
The Animal Care and Institutional Biosafety Committee at the University of Illinois gave approval for the animal protocols used here. BALB/c (nu/nu) mice and C57B6×129 (AID WT) mice were purchased from Jackson ImmunoResearch Laboratories. AID KO mice, which were a gift from T. Honjo (Kyoto University, Kyoto, Japan), were bred under specific pathogen-free conditions in a fully accredited animal facility at the University of Illinois College of Medicine. All mice were used at 8–10 wk of age. Purified splenic B cells were obtained and stimulated as described previously (6). Enrichment of B cells from mouse spleens was accomplished using Cellect Immunocolumns (Cedarlane Laboratories) according to the manufacturer's instructions. The concentrations of supplements used in this study were 50 μg/ml LPS (Sigma-Aldrich), 10 ng/ml rIL-4 (R&D Systems). 1B4.B6 cells were induced to switch μ→γ3 with LPS and CD40L (50% vol/vol) as described previously (6). 1B4.B6 cells were activated to undergo μ→γ1 switching by stimulating cells with LPS and CD40L (10% vol/vol) and rIL-4 (10 ng/ml). Total RNA was extracted from cultured splenic B cells or 1B4.B6 cells with TRIzol (Invitrogen) according to the manufacturer's instructions, and cDNA was prepared by standard methods. Semi-quantitative RT-PCR was performed as described previously (80). Primers for GLTs (μ, γ3, γ1, ɛ), Aicda, Gapdh and postswitch transcripts (for μ→γ3 μ→γ1 μ→ɛ switching) were described previously (7, 11).
Chromatin immunoprecipitation.
Chromatin immunoprecipitation (ChIP) assays were performed according to the Upstate Biology protocol (http://www.upstate.com/misc/protocols.asp?prot=chips) with modifications. In brief, 107 splenic B cells were collected and washed twice with Hank's solution. The cells were cross-linked in 10 ml 1% formaldehyde in Hank's solution at 37°C for 10 min. The reaction was stopped by adding glycine to a final concentration 0.125M and incubated for 5 min at room temperature. The cells were rinsed with ice-cold Hank's solution and incubated on ice for 10 min in 4 ml of buffer (1% Triton X-100, 50 mM MgCl2, 100 mM Tris-HCl, pH 7.1, 11% sucrose). Nuclei were pelleted by centrifugation at 780 g for 15 min at 4°C, resuspended in 1% SDS, 50 mM Tris-HCl, 10 mM EDTA with fresh protease inhibitor cocktail (Roche), and incubated on ice for 10 min. Chromatin was sonicated (SonicDismembrator 550, Fisher Scientific Microtip) to an average length of 500 bp. To preclear the chromatin, the sonicated cell suspension was diluted 10-fold with a buffer containing 0.01% SDS, 1.1% Triton X-100, 1.2 mM EDTA, 16.7 mM Tris-HCl, pH 8.1, 167 mM NaCl and incubated with 80 μl salmon sperm DNA/protein A Agarose 50% Slurry (Upstate Biotechnology Inc.) for 3 h with rotation at 4°C. The one third of the precleared chromatin was incubated with 2 μg of one of the following polyclonal antibodies overnight: anti-H3Ac, anti-H4Ac (Upstate Biotechnology Inc.), and control antibodies (Santa Cruz Biotechnology, Inc.). One tenth of the precleared chromatin was saved as input. Each immunoprecipitation was recovered, washed, eluted from the beads, and processed as described by the Upstate protocol. ChIP DNA pellets were resuspended in 60 μl of TE.
Semi-quantitative and quantitative real-time PCR.
The samples were analyzed by semi-quantitative PCR by serially diluting the samples then amplifying using Taq polymerase (MBI) at 95°C for 30 s, 60°C for 45 s, and 72°C for 45 s for 29–33 cycles and analyzed by agarose gel analysis. ChIP DNA was also analyzed by qPCR analysis using an iCycler iQ Real-Time PCR Detection System (Optical Module, Bio-Rad Laboratories) with SYBR green Master Mix (Applied Biosystems) or iQ SYBR green Supermix (Bio Rad Laboratories) in the 96-well plate format. To ensure that a single PCR product was amplified from each primer pair, the dissociation curves were examined and the PCR products were run on agarose gels. Primers were designed using Primer Express software (ABI) and all the primers have approximately equal efficiency of amplification. Primers used in the semi-quantitative PCR or qPCR are listed in Table I. All samples were analyzed in duplicate and averaged. The amount of PCR product amplified was calculated relative to a standard curve. The value of control IgG immunoprecipitation was subtracted from the specific IP before the calculations were made. All the calculations were based on ABI Prism 7700 sequence Detection System user bulletin no. 2 (Applied Biosystems). Histone Ac index = bound/ input. SDs were calculated using data from independent experiments.
Online supplemental material.
In Fig. S1, histone H3 becomes hyperacetylated when 1.B4.B6 cells are induced to undergo CSR. Fig. S2 shows analysis of GLT expression in splenic B cells activated with LPS and LPS+IL-4 for 24 h. Online supplemental material is available at http://www.jem.org/cgi/content/full/jem.20051774/DC1.
Supplemental Material
Acknowledgments
We wish to thank Drs. Wuerffel and Bhattacharya for helpful discussions.
This work was supported by R01 AI052400 (to A.L. Kenter).
The authors have no conflicting financial interests.
Abbreviations used: Ac, acetylation; AID, activation-induced deaminase; CD40L, CD40 ligand; ChIP, chromatin immunoprecipitation; CSR, class switch recombination; DSB, double-strand break; GLT, germline transcript; NHEJ, nonhomologous end joining; P, promoter; q, quantitative; RPA, replication protein A; ss, single stranded; SHM, somatic hypermutation.
References
- 1.Manis, J.P., M. Tian, and F.W. Alt. 2002. Mechanism and control of class-switch recombination. Trends Immunol. 23:31–39. [DOI] [PubMed] [Google Scholar]
- 2.Gritzmacher, C.A. 1989. Molecular aspects of heavy-chain class switching. Crit. Rev. Immunol. 9:173–200. [PubMed] [Google Scholar]
- 3.Kenter, A.L. 2005. Class switch recombination: an emerging mechanism. Curr. Top. Microbiol. Immunol. 290:171–199. [DOI] [PubMed] [Google Scholar]
- 4.Chaudhuri, J., and F.W. Alt. 2004. Class-switch recombination: interplay of transcription, DNA deamination and DNA repair. Nat. Rev. Immunol. 4:541–552. [DOI] [PubMed] [Google Scholar]
- 5.Stavnezer, J. 2000. Molecular processes that regulate class switching. Curr. Top. Microbiol. Immunol. 245:127–168. [DOI] [PubMed] [Google Scholar]
- 6.Shanmugam, A., M.-J. Shi, L. Yauch, J. Stavnezer, and A. Kenter. 2000. Evidence for class specific factors in immunoglobulin isotype switching. J. Exp. Med. 191:1365–1380. [DOI] [PMC free article] [PubMed] [Google Scholar]
- 7.Ma, L., H. Wortis, and A.L. Kenter. 2002. Two new isotype specific switching factors detected for Ig class switching. J. Immunol. 168:2835–2846. [DOI] [PMC free article] [PubMed] [Google Scholar]
- 8.Kenter, A.L., R. Wuerffel, C. Dominguez, A. Shanmugam, and H. Zhang. 2004. Mapping of a functional recombination motif that defines isotype specificity for μ−>γ3 switch recombination implicates NF-κB p50 as the isotype-specific switching factor. J. Exp. Med. 199:617–627. [DOI] [PMC free article] [PubMed] [Google Scholar]
- 9.Revy, P., T. Muto, Y. Levy, F. Geissmann, A. Plebani, O. Sanal, N. Catalan, M. Forveille, R. Dufourcq-Labelouse, A. Gennery, et al. 2000. Activation-induced cytidine deaminase (AID) deficiency causes the autosomal recessive form of the hyper-IgM syndrome (HIGM2). Cell. 102:565–575. [DOI] [PubMed] [Google Scholar]
- 10.Muramatsu, M., V.S. Sankaranand, S. Anant, M. Sugai, K. Kinoshita, N.O. Davidson, and T. Honjo. 1999. Specific expression of activation-induced cytidine deaminase (AID), a novel member of the RNA-editing deaminase family in germinal center B cells. J. Biol. Chem. 274:18470–18476. [DOI] [PubMed] [Google Scholar]
- 11.Muramatsu, M., K. Kinoshita, S. Fagarasan, S. Yamada, Y. Shinkai, and T. Honjo. 2000. Class switch recombination and hypermutation require activation-induced cytidine deaminase (AID), a potential RNA editing enzyme. Cell. 102:553–563. [DOI] [PubMed] [Google Scholar]
- 12.Kenter, A.L. 2003. Class-switch recombination: after the dawn of AID. Curr. Opin. Immunol. 15:190–198. [DOI] [PMC free article] [PubMed] [Google Scholar]
- 13.Petersen-Mahrt, S.K., R.S. Harris, and M.S. Neuberger. 2002. AID mutates E. coli suggesting a DNA deamination mechanism for antibody diversification. Nature. 418:99–103. [DOI] [PubMed] [Google Scholar]
- 14.Rada, C., G.T. Williams, H. Nilsen, D.E. Barnes, T. Lindahl, and M.S. Neuberger. 2002. Immunoglobulin isotype switching is inhibited and somatic hypermutation perturbed in UNG-deficient mice. Curr. Biol. 12:1748–1755. [DOI] [PubMed] [Google Scholar]
- 15.Chaudhuri, J., M. Tian, C. Khuong, K. Chua, E. Pinaud, and F.W. Alt. 2003. Transcription-targeted DNA deamination by the AID antibody diversification enzyme. Nature. 422:726–730. [DOI] [PubMed] [Google Scholar]
- 16.Chaudhuri, J., C. Khuong, and F.W. Alt. 2004. Replication protein A interacts with AID to promote deamination of somatic hypermutation targets. Nature. 430:992–998. [DOI] [PubMed] [Google Scholar]
- 17.Bransteitter, R., P. Pham, M.D. Scharff, and M.F. Goodman. 2003. Activation-induced cytidine deaminase deaminates deoxycytidine on single-stranded DNA but requires the action of RNase. Proc. Natl. Acad. Sci. USA. 100:4102–4107. [DOI] [PMC free article] [PubMed] [Google Scholar]
- 18.Dickerson, S.K., E. Market, E. Besmer, and F.N. Papavasiliou. 2003. AID mediates hypermutation by deaminating single-stranded DNA. J. Exp. Med. 197:1291–1296. [DOI] [PMC free article] [PubMed] [Google Scholar]
- 19.Sohail, A., J. Klapacz, M. Samaranayake, A. Ullah, and A.S. Bhagwat. 2003. Human activation-induced cytidine deaminase causes transcription-dependent, strand-biased C to U deaminations. Nucleic Acids Res. 31:2990–2994. [DOI] [PMC free article] [PubMed] [Google Scholar]
- 20.Honjo, T., H. Nagaoka, R. Shinkura, and M. Muramatsu. 2005. AID to overcome the limitations of genomic information. Nat. Immunol. 6:655–661. [DOI] [PubMed] [Google Scholar]
- 21.Barreto, V.M., A.R. Ramiro, and M.C. Nussenzweig. 2005. Activation-induced deaminase: controversies and open questions. Trends Immunol. 26:90–96. [DOI] [PubMed] [Google Scholar]
- 22.Longerich, S., and U. Storb. 2005. The contested role of uracil DNA glycosylase in immunoglobulin gene diversification. Trends Genet. 21:253–256. [DOI] [PubMed] [Google Scholar]
- 23.Yu, K., F. Chedin, C.L. Hsieh, T.E. Wilson, and M.R. Lieber. 2003. R-loops at immunoglobulin class switch regions in the chromosomes of stimulated B cells. Nat. Immunol. 4:442–451. [DOI] [PubMed] [Google Scholar]
- 24.Daniels, G.A., and M.R. Lieber. 1995. RNA:DNA complex formation upon transcription of immunoglobulin switch regions: implications for the mechanism and regulation of class switch recombination. Nucleic Acids Res. 23:5006–5011. [DOI] [PMC free article] [PubMed] [Google Scholar]
- 25.Reaban, M.E., J. Lebowitz, and J.A. Griffin. 1994. Transcription induces the formation of a stable RNA.DNA hybrid in the immunoglobulin α switch region. J. Biol. Chem. 269:21850–21857. [PubMed] [Google Scholar]
- 26.Reaban, M.E., and J.A. Griffin. 1990. Induction of RNA-stabilized DNA conformers by transcription of an immunoglobulin switch region. Nature. 348:342–344. [DOI] [PubMed] [Google Scholar]
- 27.Tian, M., and F.W. Alt. 2000. Transcription-induced cleavage of immunoglobulin switch regions by nucleotide excision repair nucleases in vitro. J. Biol. Chem. 275:24163–24172. [DOI] [PubMed] [Google Scholar]
- 28.Zarrin, A.A., M. Tian, J. Wang, T. Borjeson, and F.W. Alt. 2005. Influence of switch region length on immunoglobulin class switch recombination. Proc. Natl. Acad. Sci. USA. 102:2466–2470. [DOI] [PMC free article] [PubMed] [Google Scholar]
- 29.Zarrin, A.A., F.W. Alt, J. Chaudhuri, N. Stokes, D. Kaushal, L. Du Pasquier, and M. Tian. 2004. An evolutionarily conserved target motif for immunoglobulin class-switch recombination. Nat. Immunol. 5:1275–1281. [DOI] [PubMed] [Google Scholar]
- 30.Zhang, J., A. Bottaro, S. Li, V. Stewart, and F.W. Alt. 1993. A selective defect in IgG2b switching as a result of targeted mutation of the Ig2b promoter and exon. EMBO J. 12:3529–3537. [DOI] [PMC free article] [PubMed] [Google Scholar]
- 31.Bottaro, A., R. Lansford, L. Xu, J. Zhang, P. Rothman, and F. Alt. 1994. I region transcription (per se) promotes basal IgE class switch recombination but additional factors regulate the efficiency of the process. EMBO J. 13:665–674. [DOI] [PMC free article] [PubMed] [Google Scholar]
- 32.Jung, S., K. Rajewsky, and A. Radbruch. 1993. Shutdown of class switch recombination by deletion of a switch region control element. Science. 259:984–987. [DOI] [PubMed] [Google Scholar]
- 33.Lorenz, M., S. Jung, and A. Radbruch. 1995. Switch transcripts in immunoglobulin class switching. Science. 267:1825–1828. [DOI] [PubMed] [Google Scholar]
- 34.Cogne, M., R. Lansford, A. Bottaro, J. Zhang, J. Gorman, F. Young, H.L. Cheng, and F.W. Alt. 1994. A class switch control region at the 3′ end of the immunoglobulin heavy chain locus. Cell. 77:737–747. [DOI] [PubMed] [Google Scholar]
- 35.Pinaud, E., A.A. Khamlichi, C. Le Morvan, M. Drouet, V. Nalesso, M. Le Bert, and M. Cogne. 2001. Localization of the 3′ IgH locus elements that effect long-distance regulation of class switch recombination. Immunity. 15:187–199. [DOI] [PubMed] [Google Scholar]
- 36.McMurry, M.T., and M.S. Krangel. 2000. A role for histone acetylation in the developmental regulation of VDJ recombination. Science. 287:495–498. [DOI] [PubMed] [Google Scholar]
- 37.Morshead, K.B., D.N. Ciccone, S.D. Taverna, C.D. Allis, and M.A. Oettinger. 2003. Antigen receptor loci poised for V(D)J rearrangement are broadly associated with BRG1 and flanked by peaks of histone H3 dimethylated at lysine 4. Proc. Natl. Acad. Sci. USA. 100:11577–11582. [DOI] [PMC free article] [PubMed] [Google Scholar]
- 38.Osipovich, O., R. Milley, A. Meade, M. Tachibana, Y. Shinkai, M.S. Krangel, and E.M. Oltz. 2004. Targeted inhibition of V(D)J recombination by a histone methyltransferase. Nat. Immunol. 5:309–316. [DOI] [PubMed] [Google Scholar]
- 39.Nambu, Y., M. Sugai, H. Gonda, C.G. Lee, T. Katakai, Y. Agata, Y. Yokota, and A. Shimizu. 2003. Transcription-coupled events associating with immunoglobulin switch region chromatin. Science. 302:2137–2140. [DOI] [PubMed] [Google Scholar]
- 40.Li, Z., Z. Luo, and M.D. Scharff. 2004. Differential regulation of histone acetylation and generation of mutations in switch regions is associated with Ig class switching. Proc. Natl. Acad. Sci. USA. 101:15428–15433. [DOI] [PMC free article] [PubMed] [Google Scholar]
- 41.Carrozza, M.J., R.T. Utley, J.L. Workman, and J. Cote. 2003. The diverse functions of histone acetyltransferase complexes. Trends Genet. 19:321–329. [DOI] [PubMed] [Google Scholar]
- 42.Jazayeri, A., A.D. McAinsh, and S.P. Jackson. 2004. Saccharomyces cerevisiae Sin3p facilitates DNA double-strand break repair. Proc. Natl. Acad. Sci. USA. 101:1644–1649. [DOI] [PMC free article] [PubMed] [Google Scholar]
- 43.Catalan, N., F. Selz, K. Imai, P. Revy, A. Fischer, and A. Durandy. 2003. The block in immunoglobulin class switch recombination caused by activation-induced cytidine deaminase deficiency occurs prior to the generation of DNA double strand breaks in switch μ region. J. Immunol. 171:2504–2509. [DOI] [PubMed] [Google Scholar]
- 44.Imai, K., N. Catalan, A. Plebani, L. Marodi, O. Sanal, S. Kumaki, V. Nagendran, P. Wood, C. Glastre, F. Sarrot-Reynauld, et al. 2003. Hyper-IgM syndrome type 4 with a B lymphocyte-intrinsic selective deficiency in Ig class-switch recombination. J. Clin. Invest. 112:136–142. [DOI] [PMC free article] [PubMed] [Google Scholar]
- 45.Imai, K., G. Slupphaug, W.I. Lee, P. Revy, S. Nonoyama, N. Catalan, L. Yel, M. Forveille, B. Kavli, H.E. Krokan, et al. 2003. Human uracil-DNA glycosylase deficiency associated with profoundly impaired immunoglobulin class-switch recombination. Nat. Immunol. 4:1023–1028. [DOI] [PubMed] [Google Scholar]
- 46.Schrader, C.E., E.K. Linehan, S.N. Mochegova, R.T. Woodland, and J. Stavnezer. 2005. Inducible DNA breaks in Ig S regions are dependent on AID and UNG. J. Exp. Med. 202:561–568. [DOI] [PMC free article] [PubMed] [Google Scholar]
- 47.Wuerffel, R.A., J. Du, R.J. Thompson, and A.L. Kenter. 1997. Ig Sγ3 DNA-specifc double strand breaks are induced in mitogen-activated B cells and are implicated in switch recombination. J. Immunol. 159:4139–4144. [PubMed] [Google Scholar]
- 48.Rush, J.S., M. Liu, V.H. Odegard, S. Unniraman, and D.G. Schatz. 2005. Expression of activation-induced cytidine deaminase is regulated by cell division, providing a mechanistic basis for division-linked class switch recombination. Proc. Natl. Acad. Sci. USA. 102:13242–13247. [DOI] [PMC free article] [PubMed] [Google Scholar]
- 49.Manser, T. 1987. Mitogen-driven B cell proliferation and differentiation are not accompanied by hypermutation of immunoglobulin variable region genes. J. Immunol. 139:234–238. [PubMed] [Google Scholar]
- 50.Lin, S.C., and J. Stavnezer. 1996. Activation of NF-κB/Rel by CD40 engagement induces the mouse germline immunoglobulin Cγ1 promoter. Mol. Cell. Biol. 16:4591–4603. [DOI] [PMC free article] [PubMed] [Google Scholar]
- 51.Delphin, S., and J. Stavnezer. 1995. Characterization of an interleukin 4 (IL-4) responsive region in the immunoglobulin heavy chain germline ɛ promoter: regulation by NF-IL-4, a C/EBP family member and NF-κB/p50. J. Exp. Med. 181:181–192. [DOI] [PMC free article] [PubMed] [Google Scholar]
- 52.Gerondakis, S., C. Gaff, D.J. Goodman, and R.J. Grumont. 1991. Structure and expression of mouse germline immunoglobulin γ 3 heavy chain transcripts induced by the mitogen lipopolysaccharide. Immunogenetics. 34:392–400. [DOI] [PubMed] [Google Scholar]
- 53.Liang, G., J.C. Lin, V. Wei, C. Yoo, J.C. Cheng, C.T. Nguyen, D.J. Weisenberger, G. Egger, D. Takai, F.A. Gonzales, and P.A. Jones. 2004. Distinct localization of histone H3 acetylation and H3-K4 methylation to the transcription start sites in the human genome. Proc. Natl. Acad. Sci. USA. 101:7357–7362. [DOI] [PMC free article] [PubMed] [Google Scholar]
- 54.Kuo, M.H., E. vom Baur, K. Struhl, and C.D. Allis. 2000. Gcn4 activator targets Gcn5 histone acetyltransferase to specific promoters independently of transcription. Mol. Cell. 6:1309–1320. [DOI] [PubMed] [Google Scholar]
- 55.Kouskouti, A., and I. Talianidis. 2005. Histone modifications defining active genes persist after transcriptional and mitotic inactivation. EMBO J. 24:347–357. [DOI] [PMC free article] [PubMed] [Google Scholar]
- 56.Kireeva, M.L., W. Walter, V. Tchernajenko, V. Bondarenko, M. Kashlev, and V.M. Studitsky. 2002. Nucleosome remodeling induced by RNA polymerase II: loss of the H2A/H2B dimer during transcription. Mol. Cell. 9:541–552. [DOI] [PubMed] [Google Scholar]
- 57.Belotserkovskaya, R., S. Oh, V.A. Bondarenko, G. Orphanides, V.M. Studitsky, and D. Reinberg. 2003. FACT facilitates transcription-dependent nucleosome alteration. Science. 301:1090–1093. [DOI] [PubMed] [Google Scholar]
- 58.Schwartz, B.E., and K. Ahmad. 2005. Transcriptional activation triggers deposition and removal of the histone variant H3.3. Genes Dev. 19:804–814. [DOI] [PMC free article] [PubMed] [Google Scholar]
- 59.Henikoff, S., T. Furuyama, and K. Ahmad. 2004. Histone variants, nucleosome assembly and epigenetic inheritance. Trends Genet. 20:320–326. [DOI] [PubMed] [Google Scholar]
- 60.Ahmad, K., and S. Henikoff. 2002. The histone variant H 3.3 marks active chromatin by replication-independent nucleosome assembly. Mol. Cell. 9:1191–1200. [DOI] [PubMed] [Google Scholar]
- 61.McKittrick, E., P.R. Gafken, K. Ahmad, and S. Henikoff. 2004. Histone H 3.3 is enriched in covalent modifications associated with active chromatin. Proc. Natl. Acad. Sci. USA. 101:1525–1530. [DOI] [PMC free article] [PubMed] [Google Scholar]
- 62.Studitsky, V.M., W. Walter, M. Kireeva, M. Kashlev, and G. Felsenfeld. 2004. Chromatin remodeling by RNA polymerases. Trends Biochem. Sci. 29:127–135. [DOI] [PubMed] [Google Scholar]
- 63.Workman, J.L., and R.E. Kingston. 1998. Alteration of nucleosome structure as a mechanism of transcriptional regulation. Annu. Rev. Biochem. 67:545–579. [DOI] [PubMed] [Google Scholar]
- 64.Strahl, B.D., and C.D. Allis. 2000. The language of covalent histone modifications. Nature. 403:41–45. [DOI] [PubMed] [Google Scholar]
- 65.Jenuwein, T., and C.D. Allis. 2001. Translating the histone code. Science. 293:1074–1080. [DOI] [PubMed] [Google Scholar]
- 66.Smale, S.T. 2003. The establishment and maintenance of lymphocyte identity through gene silencing. Nat. Immunol. 4:607–615. [DOI] [PubMed] [Google Scholar]
- 67.Pilch, D.R., O.A. Sedelnikova, C. Redon, A. Celeste, A. Nussenzweig, and W.M. Bonner. 2003. Characteristics of γ-H2AX foci at DNA double-strand breaks sites. Biochem. Cell Biol. 81:123–129. [DOI] [PubMed] [Google Scholar]
- 68.Petersen, S., R. Casellas, B. Reina-San-Martin, H.T. Chen, M.J. Difilippantonio, P.C. Wilson, L. Hanitsch, A. Celeste, M. Muramatsu, D.R. Pilch, et al. 2001. AID is required to initiate Nbs1/γ-H2AX focus formation and mutations at sites of class switching. Nature. 414:660–665. [DOI] [PMC free article] [PubMed] [Google Scholar]
- 69.Chen, H.T., A. Bhandoola, M.J. Difilippantonio, J. Zhu, M.J. Brown, X. Tai, E.P. Rogakou, T.M. Brotz, W.M. Bonner, T. Ried, and A. Nussenzweig. 2000. Response to RAG-mediated VDJ cleavage by NBS1 and γ-H2AX. Science. 290:1962–1965. [DOI] [PMC free article] [PubMed] [Google Scholar]
- 70.Begum, N.A., K. Kinoshita, N. Kakazu, M. Muramatsu, H. Nagaoka, R. Shinkura, D. Biniszkiewicz, L.A. Boyer, R. Jaenisch, and T. Honjo. 2004. Uracil DNA glycosylase activity is dispensable for immunoglobulin class switch. Science. 305:1160–1163. [DOI] [PubMed] [Google Scholar]
- 71.Celeste, A., S. Petersen, P.J. Romanienko, O. Fernandez-Capetillo, H.T. Chen, O.A. Sedelnikova, B. Reina-San-Martin, V. Coppola, E. Meffre, M.J. Difilippantonio, et al. 2002. Genomic instability in mice lacking histone H2AX. Science. 296:922–927. [DOI] [PMC free article] [PubMed] [Google Scholar]
- 72.Fernandez-Capetillo, O., and A. Nussenzweig. 2004. Linking histone deacetylation with the repair of DNA breaks. Proc. Natl. Acad. Sci. USA. 101:1427–1428. [DOI] [PMC free article] [PubMed] [Google Scholar]
- 73.Bird, A.W., D.Y. Yu, M.G. Pray-Grant, Q. Qiu, K.E. Harmon, P.C. Megee, P.A. Grant, M.M. Smith, and M.F. Christman. 2002. Acetylation of histone H4 by Esa1 is required for DNA double-strand break repair. Nature. 419:411–415. [DOI] [PubMed] [Google Scholar]
- 74.Doyon, Y., W. Selleck, W.S. Lane, S. Tan, and J. Cote. 2004. Structural and functional conservation of the NuA4 histone acetyltransferase complex from yeast to humans. Mol. Cell. Biol. 24:1884–1896. [DOI] [PMC free article] [PubMed] [Google Scholar]
- 75.Ikura, T., V.V. Ogryzko, M. Grigoriev, R. Groisman, J. Wang, M. Horikoshi, R. Scully, J. Qin, and Y. Nakatani. 2000. Involvement of the TIP60 histone acetylase complex in DNA repair and apoptosis. Cell. 102:463–473. [DOI] [PubMed] [Google Scholar]
- 76.Woo, C.J., A. Martin, and M.D. Scharff. 2003. Induction of somatic hypermutation is associated with modifications in immunoglobulin variable region chromatin. Immunity. 19:479–489. [DOI] [PubMed] [Google Scholar]
- 77.Odegard, V.H., S.T. Kim, S.M. Anderson, M.J. Shlomchik, and D.G. Schatz. 2005. Histone modifications associated with somatic hypermutation. Immunity. 23:101–110. [DOI] [PubMed] [Google Scholar]
- 78.Zan, H., A. Cerutti, P. Dramitinos, A. Schaffer, Z. Li, and P. Casali. 1999. Induction of Ig somatic hypermutation and class switching in a human monoclonal IgM+ IgD+ B cell line in vitro: definition of the requirements and modalities of hypermutation. J. Immunol. 162:3437–3447. [PMC free article] [PubMed] [Google Scholar]
- 79.Pape, K.A., V. Kouskoff, D. Nemazee, H.L. Tang, J.G. Cyster, L.E. Tze, K.L. Hippen, T.W. Behrens, and M.K. Jenkins. 2003. Visualization of the genesis and fate of isotype-switched B cells during a primary immune response. J. Exp. Med. 197:1677–1687. [DOI] [PMC free article] [PubMed] [Google Scholar]
- 80.Wuerffel, R.A., L. Ma, and A.L. Kenter. 2001. NF-κB p50-dependent in vivo footprints at Ig Sγ3 DNA are correlated with μ−>γ3 switch recombination. J. Immunol. 166:4552–4559. [DOI] [PMC free article] [PubMed] [Google Scholar]
Associated Data
This section collects any data citations, data availability statements, or supplementary materials included in this article.