

Abstract
Hypertension promotes atherosclerosis and is a major source of morbidity and mortality. We show that mice lacking T and B cells (RAG-1−/− mice) have blunted hypertension and do not develop abnormalities of vascular function during angiotensin II infusion or desoxycorticosterone acetate (DOCA)–salt. Adoptive transfer of T, but not B, cells restored these abnormalities. Angiotensin II is known to stimulate reactive oxygen species production via the nicotinamide adenosine dinucleotide phosphate (NADPH) oxidase in several cells, including some immune cells. Accordingly, adoptive transfer of T cells lacking the angiotensin type I receptor or a functional NADPH oxidase resulted in blunted angiotensin II–dependent hypertension and decreased aortic superoxide production. Angiotensin II increased T cell markers of activation and tissue homing in wild-type, but not NADPH oxidase–deficient, mice. Angiotensin II markedly increased T cells in the perivascular adipose tissue (periadventitial fat) and, to a lesser extent the adventitia. These cells expressed high levels of CC chemokine receptor 5 and were commonly double negative (CD3+CD4−CD8−). This infiltration was associated with an increase in intercellular adhesion molecule-1 and RANTES in the aorta. Hypertension also increased T lymphocyte production of tumor necrosis factor (TNF) α, and treatment with the TNFα antagonist etanercept prevented the hypertension and increase in vascular superoxide caused by angiotensin II. These studies identify a previously undefined role for T cells in the genesis of hypertension and support a role of inflammation in the basis of this prevalent disease. T cells might represent a novel therapeutic target for the treatment of high blood pressure.
Approximately 50 million people in the United States have overt hypertension, and up to 60% of the population is prehypertensive (1, 2). This is a major health care concern because hypertension markedly increases the risk of death from stroke, ischemic heart disease, and other vascular diseases (3). An important mediator of hypertension is the hormone angiotensin II, which increases thirst, promotes salt retention by the kidney, causes vasoconstriction, and enhances the release of catecholamines from nerves and the adrenal gland (4). Angiotensin II also directly promotes inflammation and the development of atherosclerosis (5). Drugs that block the action of angiotensin II or prevent its formation are generally effective antihypertensive agents and, in some clinical trials, have reduced cardiovascular events in humans with atherosclerosis (6).
There is substantial debate regarding the relative contributions of the vasculature, kidney, and central nervous system to the development of hypertension. In most cases of human hypertension, systemic vascular resistance is increased, and genetically altered mice with increased vascular tone are hypertensive, suggesting that blood vessel constriction is a cause of hypertension (7, 8). In keeping with this, potent vasodilators, such as calcium channel antagonists, lower blood pressure in most humans with hypertension. In contrast to this direct vascular mechanism, angiotensin II injection into the third ventricle of the brain elevates blood pressure, and lesioning of neurons linking the forebrain to the brainstem cardiorespiratory center prevents many forms of experimental hypertension, indicating a neural etiology (9). Finally, there is strong evidence that hypertension is solely caused by altered renal handling of salt and water. Transplantation of kidneys lacking the angiotensin II type 1 (AT1) receptor into mice prevents hypertension caused by angiotensin II infusion (10), and mutations of genes regulating sodium transport in the distal nephron of the kidney cause hypertension in humans (11). These seemingly conflicting observations provide a very confusing picture of the pathogenesis of hypertension, and a mechanism linking these various organs is lacking.
Recent studies have focused on a contribution of superoxide (O2 ·−) produced by the Nox-based nicotinamide adenosine dinucleotide phosphate (NADPH) oxidases. These are multisubunit enzymes that are similar to the neutrophil oxidases that are present in vascular cells, kidney, and central nervous system (12). Reactive oxygen species (ROS) produced by the Nox enzymes have been implicated in several models of experimental hypertension (13, 14). Angiotensin II can activate these enzymes, and the O2 ·− that is subsequently produced can react with the endogenous vasodilator nitric oxide (NO) at diffusion-limited rates, thereby promoting vasoconstriction (15, 16). This could increase systemic vascular resistance and elevate blood pressure. It has also been proposed that O2 ·− and related ROS can increase renal sodium reabsorption, which could also contribute to hypertension (17). An NADPH oxidase is present in the circumventricular organs of the brain, and its stimulation in these sites contributes to hypertension (18). It has been difficult to understand how activation of the NADPH oxidases in these various organs could affect blood pressure in a concerted fashion.
T lymphocytes contain a functional NADPH oxidase and an AT1 receptor, and angiotensin II stimulates T cell proliferation (19, 20). Moreover, perturbation of immune function by thymectomy or by pharmacological interventions prevents hypertension in several experimental models (21, 22). Infusion of alloactivated T cells for treatment of cancer increases blood pressure in humans (23). There is activation of both humoral and cellular immunity in women with preeclampsia (24). Conversely, suppression of the adaptive immune system can inhibit hypertension in experimental animals and humans (21, 25–27). Finally, a recent study has shown that patients with suppressed CD4 counts caused by human immunodeficiency virus infection have a low incidence of hypertension, but also that blood pressure is increased by highly aggressive antiretroviral therapy (28). Collectively, these studies suggest that adaptive immunity contributes to hypertension via yet undefined mechanisms. In this study, we demonstrate that the T lymphocyte, particularly the AT1 receptor and the NADPH oxidase in T cells, is required for the full development of hypertension. The adventitia and periadventitial fat of vessels from hypertensive mice contain increased amounts of lymphocytes and an inordinate proportion of CD3+/CD4−/CD8−/CD44high/CC chemokine receptor (CCR) 5+ cells. Our data indicate that peripheral blood T cells are activated to produce TNFα, IFNγ, and to express tissue-homing receptors upon angiotensin II infusion. Blockade of TNFα normalized blood pressure and vascular O2 ·− production in angiotensin II–infused animals. Thus, this study identifies a previously unknown role of the T lymphocyte in the development of hypertension and related vascular abnormalities.
RESULTS
Role of T lymphocytes in modulation of blood pressure and vascular function
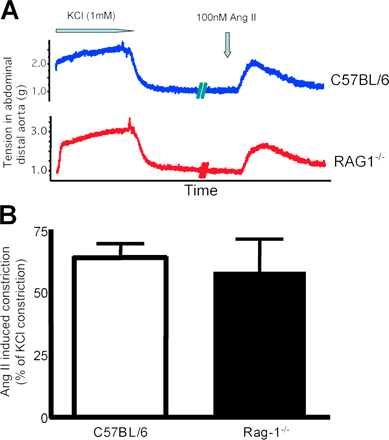
Using both the noninvasive tail cuff method and invasive monitoring with indwelling catheters, we found that the hypertension caused by chronic low-dose angiotensin II infusion was markedly blunted in mice with genetic deletion of the recombinase-activating gene (RAG; RAG-1−/− mice), which lack both T and B lymphocytes (Fig. 1). Expression of AT1 and AT2 receptors was similar in RAG1−/− and C57BL/6 aortas (Figs. 1 F). In keeping with this, the acute constrictor response to exogenous angiotensin II was similar in vessels of these animals (Fig. S1, available at http://www.jem.org/cgi/content/full/jem.20070657/DC1). These data indicate that blunted hypertensive responses in RAG−/− mice are not caused by differences in angiotensin II receptor amount or signaling. A hallmark of hypertension is an increase in vascular O2 ·− production; however, in RAG-1−/− mice, the vascular production of O2 ·− was lower than that in C57BL/6 mice, both at baseline and after development of angiotensin II–induced hypertension (Fig. 2 B). As previously reported, we found that chronic angiotensin II infusion impaired endothelium-dependent vasodilatation, but not endothelium-independent vasodilatation in C57BL/6 mice (Fig. 2 A). In contrast, angiotensin II caused minimal perturbation of endothelium-dependent vasodilatation in RAG-1−/− mice (Fig. 2 A). Angiotensin II also causes vascular hypertrophy in animals and humans (29, 30). This was significantly blunted in RAG-1−/− compared with C57BL/6 mice (Fig. 2 C). Thus, many of the vascular consequences of angiotensin II were prevented in mice lacking lymphocytes.
Figure 1.

Role of lymphocytes in development of angiotensin II–dependent hypertension. C57BL/6 and RAG-1−/− mice were treated for 14 d with 490 ng/min/kg angiotensin II, which was administered subcutaneously via osmotic minipump. (A) Noninvasive blood pressure measurements obtained via the tail cuff method (n = 10 in each group). (B) Sample traces of telemetric systolic blood pressure recordings obtained in freely moving C57BL/6 and RAG1−/− mice showing the 3 d before angiotensin II pump implantation (control) and the last 3 d of angiotensin II infusion. (C) Mean values of invasive measurements of blood pressure at baseline and during angiotensin II infusion (n = 6–12). (D) Sample Western blots (top) and densitometric analysis (bottom; n = 4 in each group) for expression of AT1 and AT2 receptors in aortas of C57BL/6 and RAG-1−/− mice. *, P < 0.01 vs. C57BL/6; †, P < 0.05 vs. sham. Data are expressed as the means ± the SEM.
Figure 2.

Role of lymphocytes in the development of vascular dysfunction and hypertrophy in angiotensin II–dependent hypertension. (A) Effect of angiotensin II–induced hypertension on endothelium-dependent vasodilatation to acetylcholine (Ach) in aortas of C57BL/6 (n = 6) and RAG-1−/− (n = 9) mice (left). Relaxations to sodium nitroprusside (SNP) were examined as a measure of nonendothelium-dependent vasodilatation (right). (B) Aortic superoxide levels measured by monitoring the oxidation of dihydroethidium to 2-hydroxyethidium using high pressure liquid chromatography after 14 d of angiotensin II infusion (n = 8–10). (C) Effect of angiotensin II–induced hypertension on aortic hypertrophy in C57BL/6 (n = 6 in each group) and RAG-1−/− (n = 6 in each group) mice measured as wall thickness (top left) and by total wall area determined by planimetry (bottom left) in hematoxylin-eosin–stained sections of thoracic aorta. Sample sections are shown on the right. *, P < 0.01 vs. C57BL/6; †, P < 0.05 vs. sham. Data are expressed as the means ± the SEM. Bar, 50 μm.
To determine if the reduced hypertensive response in RAG-1−/− was specific to angiotensin II, we also studied desoxycorticosterone acetate (DOCA)-salt hypertension, which is characterized by low levels of circulating angiotensin II. The increase in blood pressure in this model was also blunted in RAG-1−/− mice, indicating that lymphocytes likely play a role in other causes of hypertension than angiotensin II (Fig. 3 A). Moreover, vascular O2 ·− production was also blunted in RAG1−/− mice with DOCA-salt hypertension (Fig. 3 B).
Figure 3.

Role of lymphocytes in development of DOCA-salt–induced hypertension and vascular oxidative stress. C57BL/6 and RAG-1−/− mice were subjected to DOCA-salt hypertension for 40 d. (A) Noninvasive blood pressure measurements were obtained via the tail cuff method (n = 5–6) in DOCA-salt–induced hypertension and in sham-operated C57BL/6 (n = 5) and RAG1−/− (n = 6) mice. (B) Aortic superoxide levels measured by monitoring the oxidation of dihydroethidium to 2-hydroxyethidium using high pressure liquid chromatography after 40 d of DOCA-salt hypertension (n = 8–10). *, P < 0.01 vs. C57BL/6; †, P < 0.05 vs. sham. Data are expressed as the means ± the SEM.
Using negatively selected lymphocyte subtypes, we restored either the T or B cell population in RAG-1−/− mice (Fig. 4 A). Adoptive transfer of B cells into RAG-1−/− mice had little effect on the increase in blood pressure or vascular O2 ·− production caused by angiotensin II (Fig. 4, B and C). In contrast, adoptive transfer of T cells restored the hypertension and increased vascular O2 ·− levels in response to angiotensin II (Fig. 4, B and C). Likewise, acetylcholine-mediated vasodilatation was impaired by angiotensin II in mice after T cell adoptive transfer (Fig. 4 D). These data indicate that the T lymphocyte plays a critical role in the development of hypertension, vascular O2 ·− production, and vascular dysfunction caused by angiotensin II. The hypertensive effect of angiotensin II can be inhibited by blockade of the angiotensin type AT1 receptor. We found that this could be caused, in part, by blockade of the T cell AT1 receptor, as adoptive transfer of T cells from AT1a−/− mice only partially restored the angiotensin II–induced hypertensive response (Fig. 4, B and C). In several tissues, the AT1a receptor signals activation of the NADPH oxidase (31). In keeping with this, the increase in blood pressure and vascular O2 ·− caused by angiotensin II was blunted after adoptive transfer of T cells from mice lacking the oxidase subunit p47phox compared with wild-type T cell–reconstituted mice (Fig. 4, B and C).
Figure 4.

Comparison of the role of B and T lymphocytes in modulation of blood pressure and vascular function in response to angiotensin II–mediated hypertension using adoptive transfer. RAG-1−/− mice received either no cells (saline; n = 4), B cells (n = 4), wild-type T cells (n = 10), or T cells from mice lacking AT1a receptors (n = 6) or from mice lacking p47phox NADPH oxidase subunit (n = 4). 3 wk after this, osmotic minipumps for angiotensin II infusion were surgically implanted. (A) Flow cytometric analysis of lymphocyte surface markers from C57BL/6 and RAG-1−/− mice at baseline and 3 wk after adoptive transfer of T and B lymphocytes. (B) Blood pressures at baseline and after angiotensin II infusion measured by tail cuff. (C) Aortic O2 ·− levels after angiotensin II infusion. (D) Endothelium-dependent vasodilatation to acetylcholine and sodium nitroprusside after angiotensin II infusion. *, P < 0.01 vs. C57BL/6; †, P < 0.01 vs. sham; #, P < 0.01 vs. RAG-1−/−. Data are expressed as the means ± the SEM.
Vascular T cell infiltration in hypertension
To gain insight into how T cells might contribute to hypertension and vascular dysfunction, we examined the effect of angiotensin II to promote vascular infiltration of T cells. We observed that the number of circulating CD4+ lymphocytes expressing the hyaluronan receptor CD44 and the chemokine receptor CCR5 was significantly increased in C57BL/6 mice after 2 wk of angiotensin II infusion (Fig. 5 A). Notably, angiotensin II also stimulated vascular expression of the CCR5 ligand RANTES (Fig. 5 B). T cell expression of CD62L and CD11b, which promote T cell infiltration into the vessel wall in atherosclerosis (32), were not affected by angiotensin II treatment (unpublished data). In other studies, we confirmed prior observations that angiotensin II stimulated aortic levels of the intracellular adhesion molecule (ICAM)-1, although not changing expression of the vascular adhesion molecule-1 (Fig. S2, available at http://www.jem.org/cgi/content/full/jem.20070657/DC1) (33). The coordinated actions of angiotensin II to induce the hyaluronan receptor, which increases T cell interaction with the vascular endothelium, CCR5, and its vascular ligand, could predispose to vascular infiltration of T cells. Indeed, using immunostaining for CD3 and immunofluorescence for the T cell receptor, we found that angiotensin II markedly increased the number of T cells in the aortic adventitia, particularly in the periadventitial fat (Fig. 5 C). This was confirmed using real-time PCR for aortic CD3 mRNA (Fig. 5 D) and by FACS analysis of cell suspensions of collagenase-digested aortas (Fig. 6, A and B). Total leukocytes were also substantially increased by angiotensin II infusion (Fig. 6 B). Flow cytometric analysis further revealed that angiotensin II increased aortic content of CD4+ and, to a lesser extent, CD8+ lymphocytes (Fig. 6 B). Notably, 30% of aortic CD3+ cells were negative for both CD4 and CD8 (Fig. 6 C), and the total number of aortic double-negative (DN) T cells was increased ∼7-fold by angiotensin II (Fig. 6 D). Interestingly, the percentage of aortic DN T cells expressing α/β, as opposed to γ/δ, T cell receptors, increased from 35 ± 2 to 51 ± 9% (n = 6 each) during angiotensin II infusion. Analysis of peripheral blood revealed that only 5.1 ± 0.6% of circulating T cells were DN in sham-treated mice (n = 6; P < 0.001 vs. aorta), and that this was increased by angiotensin II infusion to 7.6 ± 0.5% (n = 6; P < 0.005). Another unique feature of vascular T cells in both sham and angiotensin II–treated mice was that a very high percentage expresses CCR5, compared with circulating T cells (Fig. 6 E).
Figure 5.

T cell homing and vascular infiltration in response to angiotensin II–induced hypertension. (A) The percentage of circulating CD4+ lymphocytes expressing CCR5 and high levels of CD44, as determined by flow cytometric analysis (n = 10). (B) Aortic mRNA expression of the CCR5 ligand RANTES, as determined by real time PCR (n = 6). (C) Immunostaining of aortas from sham-treated and angiotensin II–infused C57BL/6 mice using anti-CD3 (top) and a fluorescent anti–TCR antibody (representative of n = 4–6 experiments). (D) Aortic CD3 (ε chain) mRNA determined by real-time PCR in sham-treated and angiotensin II–infused C57BL/6 (n = 6 in each group). *, P < 0.05 vs. sham. Data are expressed as the means ± the SEM. Bar, 20 μm.
Figure 6.

Characteristics of T cells infiltrating the aorta in response to angiotensin II–induced hypertension. (A) Examples of flow cytometric analysis of collagenase-digested cell suspensions of sham- and angiotensin II–infused mouse aortas. Fluorescent staining was performed to detect CD45 (total leukocytes) and CD3 (T cells). (B) Absolute numbers of total leukocytes (CD45+, top left), total T cells (CD3+, bottom left), and CD4+ and CD8+ subclasses (right) in whole aortas from sham- (open bars) and angiotensin II–infused mice (filled bars; n = 9). Insert shows the alteration of CD4/CD8 index caused by angiotensin II infusion. (C) Sample flow cytometric analysis and (D) absolute numbers of total DN (CD3+CD4-CD8-) T cells in single-cell suspensions from aortas of sham-infused (n = 9) and angiotensin II–treated mice (n = 9). CD4+ and CD8+ cells were both labeled with PerCP, and CD3+ cells were labeled with APC. DN T cells were gated based on control experiments in which isotype antibody control (PerCP) was added instead of anti-CD4 and -CD8. (E) Percentage of CCR5+ T cells in the aorta, peripheral blood, and spleen of sham-treated (n = 5) and angiotensin II–infused mice (n = 5). Inset shows sample histograms of the CCR5 expression within the CD3+ gate. *, P < 0.05 vs. sham; †, P < 0.01 vs. aorta. Data are expressed as the means ± the SEM.
Role of the NADPH oxidase in T cell activation caused by angiotensin II
As shown in Fig. 3 B, the T cell NADPH oxidase is necessary for full development of angiotensin II–induced hypertension. In keeping with this, we found that activation of T cells by angiotensin II was dependent on the NADPH oxidase. In vitro, incubation of T cells with angiotensin II alone had no effect on T cell activation as measured by CD69 surface expression. However, coincubation with angiotensin II augmented anti-CD3–induced expression of this marker at 3 h (Fig. 7 A). This response was completely prevented by the NADPH oxidase inhibitor apocynin (Figs. 7 A). In vivo, the increase in CD69, CCR5, and CD44 caused by angiotensin II was diminished in p47phox −/− mice (Fig. 7 B). Similarly, aortic T cell infiltration, as quantified by real time PCR for CD3 mRNA was absent in p47phox −/− mice (Fig. 7 C). Importantly, angiotensin II infusion increased T cell expression of the NADPH oxidase subunits p47phox, p22phox, and Nox2 (Fig. 7 D). This was accompanied by a striking increase in the ability of T cells to produce O2 ·− (Fig. 7 E).
Figure 7.

Role of the T lymphocyte NADPH oxidase in modulating T cell activation, tissue homing, and blood pressure in response to angiotensin II. (A) Effect of 100 nM angiotensin II on the early activation marker CD69 in cultured T cells exposed to anti-CD3 (n = 5). Parallel experiments were performed in the presence of the NADPH oxidase inhibitor apocynin (300 μM/liter; n = 4). (B) Role of the NADPH oxidase on angiotensin II modulation of CD4+ CD69, CCR5, and CD44 expression, as determined using flow cytometry. Experiments were performed in C57BL/6 and p47phox −/− mice. (C) Role of the NADPH oxidase in modulating aortic T cell infiltration, as determined by levels of ε chain CD3 mRNA. Measurements were obtained in sham and angiotensin II–infused mice. (D; left) Western blots examining NADPH oxidase cytosolic (p47phox and p67phox) and membrane (p22phox and gp91phox) subunits in isolated T cells from sham-infused and angiotensin II–treated mice. Purity of T cell preparations was >98% as determined by flow cytometry, and it did not differ between groups. (right) Densitometric analysis of four separate experiments. (E) T cell production of O2 ·− determined by electron spin resonance at baseline and in response to the phorbol ester PMA in T cells from sham and angiotensin II–infused mice. (left) Sample time scans of the low field peak of the CAT1-H spectra; (right) mean data from five experiments. *, P < 0.05 vs. sham; †, P < 0.02 vs. C57BL/6; #, P < 0.05 PMA vs. basal; ¶, P < 0.03 vs. αCD3 alone. Data are expressed as the means ± the SEM.
Effect of cytokine blockade on angiotensin II–induced hypertension
The T cell NADPH oxidase has recently been shown to affect cytokine production, which in turn might mediate hypertension and vascular dysfunction. Accordingly, we observed that T cell production of TNFα and IFNγ was increased after 2 wk of angiotensin II infusion in wild-type, but not in p47phox −/− mice (Fig. 8 A). In contrast, the production of other cytokines by T cells, including IL-2, -4, and -5 as measured with cytometric bead array were not significantly altered by angiotensin II. This is likely caused in part by a direct action on the T cell, because in vitro angiotensin II augmented production of TNFα in response to anti-CD3 (Fig. 8 B). To determine if the increase in TNFα and IFNγ were of pathophysiological significance, C57BL/6 mice were treated with either the soluble TNFα receptor etanercept or a neutralizing anti-IFNγ antibody during the angiotensin II infusion. Etanercept prevented the hypertension and markedly reduced the increase in vascular O2 ·− production caused by angiotensin II (Fig. 8, C and D), whereas the anti-IFNγ antibody was without significant effect (not depicted).
Figure 8.

Role of cytokines in blood pressure regulation and vascular O2·− production. (A) Production of TNF-α (top) and IFN-γ (bottom) measured by cytometric bead array from anti-CD3–stimulated peripheral blood T cells isolated from C57BL/6 and p47phox−/− mice infused with saline (sham) or angiotensin II for 14 d (n = 8 in each group). (B) Anti-CD3–stimulated production of TNF-α from spleen-derived T cells in response to in vitro coincubation without (vehicle; n = 6) or with 100 nm angiotensin II (Ang II; n = 6). (C) Noninvasive blood pressure measurements at baseline and during angiotensin II infusion measured by tail cuff in mice injected IP with control IgG (n = 4) or with anti-TNFα therapy (etanercept, ETA; 8 mg/kg; n = 6) 3 d before and every 3 d throughout the experiment. (D) Aortic O2 ·− levels after angiotensin II infusion in control mice or mice injected with etanercept (n = 6) compared with sham-infused mice. In preliminary experiments, we showed that ETA did not directly inhibit contraction of vascular rings in response to angiotensin II. *, P < 0.05 vs. sham; ¶, P < 0.05 vs. α-CD3 + vehicle using a paired one-tailed t test; †, P < 0.05 vs. control Ig; #, P < 0.01 vs. Ang II alone. Data are expressed as the means ± the SEM.
DISCUSSION
In this study, we show that the T cell plays an important role in the genesis of hypertension. RAG-1−/− mice lacking T and B cells demonstrated a blunted blood pressure increase to both angiotensin II infusion and DOCA-salt hypertension, a model in which circulating angiotensin II levels are suppressed (34). Adoptive transfer of T cells, but not B cells, restored the hypertensive response to angiotensin II in RAG-1−/− mice. Both in vivo and, to a lesser extent, in vitro, angiotensin II augmented CD69 expression, which is an early marker of T cell activation. In vivo, angiotensin II exerted a coordinated effect on T cells to increase the tissue-homing proteins CD44 and CCR5 and on vessels to increase levels of the CCR5 ligand RANTES. In accordance with these molecular events, angiotensin II caused a striking infiltration of T cells into the periadventitial fat and adventitia. Our data also indicate that angiotensin II increases T cell production of TNFα, and that blockade of TNFα prevents the hypertension and increase in vascular O2 ·− production caused by angiotensin II. These studies identify a yet to be unidentified role of the T cell in modulation of blood pressure– and hypertension-related vascular dysfunction.
An important finding in this study is that angiotensin II exerts dual effects on T cells and vessels, increasing CD44 and CCR5 in the former and RANTES in the latter. These events would favor vascular accumulation of T cells and, indeed, we found that CD4+ and, to a lesser extent, CD8+ T cells preferentially accumulate in the adventitia and periadventitial fat of hypertensive animals. Notably, ∼30% of T cells present in this site lack both CD4 and CD8. Under normal circumstances, DN T cells compose no more than 5% of circulating T cells. More commonly, DN cells possess γ/δ T cell receptors, and have been suggested to act as regulatory T cells (35). Recently, it has been shown that abDN cells are proinflammatory, and that they are increased in humans with cutaneous leishmaniasis (36). DN T cells have been reported to produce IL-17, which is a potent proinflammatory cytokine involved in autoimmune disorders (37). Therefore, the α/βDN T cells observed in the periaortic tissues in this study could participate in vascular inflammatory responses. Our findings regarding leukocyte infiltration are in keeping with prior reports in spontaneously hypertensive rats (38, 39).
Because vascular T cells are CCR5+ and CD44high, they have the phenotype of effector T cells. Such cells have a low activation threshold, produce TNFα and IFNγ, and could contribute to vascular dysfunction and hypertension (40). A potentially important finding is the localization of T cells to the perivascular fat. It has recently been recognized that activated effector CD4+ cells migrate to nonlymphoid tissue, including fat (41). Moreover, Wu et al. have recently shown that fat feeding of mice increases expression of RANTES in adipose tissue, and that this is associated with T cell accumulation. In this study, the authors also showed a correlation between CCR5 and RANTES mRNA in fat and body mass index in humans (42). There has been increasing interest in the role of visceral adipose tissue as a source of cytokines and systemic inflammation (43, 44). It is interesting to speculate that the increase in visceral adipose tissue in humans with the metabolic syndrome leads to accumulation of perivascular fat, which in turn serves as a reservoir for activated effector T cells, which in turn promote vascular dysfunction and hypertension. This might, in part, explain the common coexistence of visceral obesity and hypertension and also provide insight into why weight loss commonly leads to blood pressure reduction (45).
Our studies show that T cells are important in the alteration of vascular tone encountered in angiotensin II–induced hypertension. Infiltration of T cells in other tissues might also be important in the development of hypertension. In preliminary studies, we found a modest degree of T cell infiltration in the kidneys of angiotensin II–infused animals. Analogous to the situation in vessels, the balance between NO and O2 ·− in the renal medulla affects the tone of the vasa recta, which in turn modulates sodium and water and affects blood pressure (46–48). Similarly, T cell infiltration into adrenal glands, could affect regulation of blood pressure. In preliminary studies using RT-PCR, we have found the levels of CD3 mRNA to be 20-fold lower in the adrenals compared with the aortas, but they are doubled by angiotensin II infusion. Additional studies are needed to define the importance of this finding.
It has previously been reported that angiotensin II can promote T cell proliferation (20). Our experiments with adoptive transfer of AT1a receptor–deficient T cells indicate that at least some of the hypertensive effect of angiotensin II is caused by its direct action on T cells. The hypertensive response that remained after adoptive transfer of AT1a−/− T cells is almost certainly caused by actions on other cells, which in turn might interact with T cells. For example, angiotensin II stimulates dendritic cell migration, CCR7 expression, and differentiation, which in turn promotes T cell activation (25). It is also possible that oxidatively modified lipoproteins or fatty acids released from fat cells surrounding the vessels gain antigenic properties and are presented by dendritic cells to activate T cell receptors (49, 50). Finally, angiotensin II could augment immune responses to pathogens normally encountered from the skin and gut, linking those common inflammatory processes to hypertension.
It is interesting that vascular O2 ·− levels were reduced in RAG-1−/− mice, and that after adoptive transfer of T cells, there was normalization of these values, suggesting that T lymphocytes play a crucial role in modulating vascular O2 ·− production. Because our measurements of vascular O2 ·− were made in segments of vessels in which the adventitia and periadventitial fat were carefully dissected from the vessel, this is probably not because our measurements of O2 ·− reflect T cell production of this radical. A more plausible explanation is that cytokines released from T cells in the periadventitial fat, such as TNFα, stimulate the NADPH oxidase in the vascular smooth muscle (51, 52). Indeed, when we cotreated mice with etanercept, this not only prevented hypertension but also markedly blunted the increase in vascular O2 ·− production. It is possible that the combination of TNFα, angiotensin II, and perhaps catecholamines released in response to angiotensin II serves as a prooxidant milieu to activate the vascular oxidase, such that blockade of any one of these might prove effective. In keeping with a role of O2 ·− in modulating NO bioavailability, parallel findings were observed for endothelium-dependent vasodilatation, such that angiotensin II caused only a minor alteration of endothelial function in RAG-1−/− mice. In contrast, after adoptive transfer of T cells to these animals, angiotensin II infusion caused a markedly altered vascular relaxation response.
In addition to angiotensin II–induced hypertension, the increase in blood pressure caused by DOCA-salt hypertension was also blunted in RAG-1−/− mice. In preliminary studies, we also found that DOCA-salt hypertension increases circulating T cells containing CD69 and CCR5, which is similar to the situation during angiotensin II–induced hypertension. DOCA-salt hypertension is associated with suppressed plasma renin and angiotensin II levels (53), suggesting that the lack of T cells likely plays a role in several forms of hypertension. We chose these two models because angiotensin II–induced hypertension is, at least in part, mediated by vasoconstriction, whereas the DOCA-salt model is completely independent of vascular tone (54, 55).
Blood pressure in RAG−/− mice was not lower than C57BL/6 mice under basal conditions, indicating that T cells do not modulate hemodynamics in the absence of a pathophysiological stimulus. The modulation of blood pressure under normal conditions is complex and involves an interaction of the central nervous system, the kidney, the adrenals, and the vasculature (56). Moreover, there are buffer mechanisms such as the carotid baroreflex, the phenomenon of pressure natriuresis, and adaptive changes in vascular gene expression that compensate for modest fluctuations in blood pressure (57–59). Our data indicate that the infiltration of T cells overcomes these compensatory mechanisms.
Our data also implicate a role of the T cell NADPH oxidase in hypertension and T cell activation and tissue homing. In wild-type mice, angiotensin II–induced hypertension caused an increase in expression of most subunits of the T cell NADPH oxidase and markedly increased the ability of T cells to produce O2 ·−. It has previously been reported that the NADPH oxidase can modulate T cell cytokine production, as can alterations in T cell redox status (19, 60). In keeping with this, adoptive transfer of T cells that lack p47phox, which is a critical cytosolic subunit of the oxidase, only partially restored the hypertensive response to angiotensin II in RAG-1−/− mice, and it eliminated the increase in vascular O2 ·− caused by angiotensin II.
Etanercept prevented the hypertension and blunted the increase in O2 ·− caused by angiotensin II, supporting a role of TNFα in the genesis of angiotensin II. Etanercept has been shown to prevent renal damage in genetically hypertensive rats and to lower blood pressure in rats with hypertension induced by angiotensin II and salt (25, 61). A recent study has shown that etanercept reduced pulse wave velocity and improved endothelium-dependent vasodilatation in patients with rheumatoid arthritis (62).
These findings, together with prior studies, indicate that the NADPH oxidase contributes to the pathophysiology of hypertension in several organs. In the circumventricular organs, the NADPH oxidases promote sympathetic outflow and hypertension (63). T cell–rich regions of lymph nodes and the spleen are innervated by sympathetic nerves, and sympathetic nerve stimulation promotes T cell activation (64–66). In T cells, the NADPH oxidase contributes to their activation, cytokine production, and tissue homing (19, 67). Our studies indicate that activated T cells stimulate the vascular production of O2 ·−, which is dependent on the NADPH oxidase and promotes hypertension (15, 68). In this regard, the T cell likely plays a central role in modulation of hypertension and provides a new therapeutic target for treatment of this common disease.
MATERIALS AND METHODS
Animals.
C57BL/6, RAG-1−/−, and AT1a−/− mice were obtained from Jackson ImmunoResearch Laboratories. The p47phox −/− mice and their appropriate controls were obtained from Taconic. All experimental protocols were approved by the institutional Animal Care and Use Committee at Emory University. All mice were on a C57BL/6 background. 490 ng/min/kg angiotensin II was infused and blood pressure was measured both invasively and noninvasively, as previously described (69). Animals were maintained in a sterile environment and were regularly screened for infections. For adoptive transfer, mice were anesthetized with xylazine/ketamine and cells were injected via tail vein. Angiotensin II infusion and blood pressure monitoring was begun 3 wk after adoptive transfer. In some experiments, 8 mg/kg etanercept (AmGen) or a neutralizing IFNγ antibody (eBioscience; clone R4-6A2; 0.5 mg per injection per 30 g mouse) was administered i.p. 3 d before and every 3 d during angiotensin II infusion. In some mice, DOCA-salt hypertension was created as previously described, and studies were performed after 40 d from the induction of hypertension (14).
Flow cytometry.
Spleens were removed and tissue-disrupted using forceps to release a single-cell suspension, which was passed through a 70-μm sterile strainer. Total blood leukocytes were isolated from the whole heparinized blood after osmotic lysis of excess red blood cells. Cells were centrifuged (800 g), washed twice with PBS and 0.5% BSA (FACS buffer), counted, resuspended in 1% BSA/PBS, and stored on ice for <30 min. Within 30 min, 106 cells were stained for 15 min at 4°C with antibodies and washed twice with FACS buffer. Antibodies used for staining, and in different multicolor combinations, are as follows: FITC anti-CD45 (30-F11); PerCP anti-CD45 (30-F11); APC anti-CD19 (1D3); PE anti-CD4 (GK1.5); APC anti-CD4 (GK1.5); FITC anti-CD4 (GK1.5); PerCP anti-CD8 (53–6.7); APC anti-CD3 (145-2C11); PE anti-I-Ab (AF6-120.1); FITC anti-I-Ab (AF6-120.1); APC anti-CD11b (HL3); APC CD11b (M1/70); PE 62L (MEL-14); PE CD25 (PC61); APC CD4 (RM4-5); PerCP CD4 (RM4-5); PE CCR5; FITC γ/δ (GL3); FITC Vβ7; FITC CD44 (IM7); FITC CD69 (H1.2F3); PE TcR β chain (H57-597); PE CD19 (1D3); and PE NK1.1 (PK136).
After immunostaining, cells were resuspended in FACS buffer and analyzed immediately on a LSR-II flow cytometer with DIVA software (Becton Dickinson). Data were analyzed with FlowJo software (Tree Star, Inc.). T cells were analyzed as a percentage of the PBMC, and they were also expressed in absolute numbers.
Analysis of leukocytes in vessels.
Mouse aortas were digested using collagenase type IX (125 U/ml), collagenase type IS (450 U/ml), and hyaluronidase IS (60 U/ml) dissolved in 20 mM Hepes-PBS buffer containing calcium and magnesium for 30 min at 37°C, with constant agitation. Aortas were then passed through a 70-μm sterile cell strainer (Falcon; BD Biosciences), yielding single-cell suspensions. Cells were washed twice with 1% BSA PBS buffer and additionally incubated for 30 min in 37°C with complete media (RPMI; 10%FCS), then washed again, counted, and stained, using multicolor flow cytometry as described in the previous paragraph. An initial gate was applied to exclude cell debris from further analysis (Fig. 6 A), and CD45 staining was used to identify leukocytes within the aortic cell suspension. Within the CD45+ gate, T cells were identified with anti-CD3, -CD4, and -CD8 antibodies, as well as antibodies to detect other supplementary surface molecules.
Aortic T cell infiltration was confirmed by real time PCR using specific primers to detect CD3 ε (forward, CGTCCGCCATCTTGGTAGAGAGAGCAT; reverse, CTACTGCTGTCAGGTCCACCTCCAC). Longer PCR product encompassing above sequences was used as standard.
T and B cell separation.
For purified T or B cell separation, splenocytes or PBMC were isolated from donor mice and were purified using autoMACS and either a Pan T or B cell isolation kit (Miltenyi Biotech). Cell purity was confirmed to be ≥95%.
Adoptive transfer of purified T or B cells.
Adoptive transfer was performed 3 wk before angiotensin II infusion. In preliminary studies, we found that longer delays after adoptive transfer had only minimal effect in either splenic or circulating T cell number. Total splenocytes were isolated from donor mice, and either T or B cells were isolated using cell-specific isolation kits (Miltenyi Biotech) and negative magnetic sorting (AutoMACS), yielding sterile and highly enriched T or B cells. The purity of these was confirmed to be ≥ 95% by flow cytometry before injection. Immediately after the cell isolation, 2 × 10⁷ cells were resuspended in 150 μl of sterile PBS, passed through a 70-μm filter, and injected into RAG-1−/− mice via tail vein. Successful adoptive transfer was confirmed at the time of sacrifice using flow cytometry. 3 wk after adoptive transfer of T cells, the number of T cells in the spleen of RAG1−/− mice averaged 2.6 ± 0.3 × 10⁶. B cell adoptive transfer resulted in a total of 1.1 ± 0.107 B cells per spleen.
Cytokine determinations.
Cytokines were quantified in the media after 48 h of culture of isolated T cells in anti-CD3 antibody–coated plates (BD PharMingen). Cells were cultured in 96-well plates T cells were plated at a density of 2 × 10⁵ per well. Cytometric Bead Array (BD PharMingen) was used according to the manufacturer's recommendations, which allowed for simultaneous determination of TNF-α, IFN-γ, IL-2, IL-4, and IL-5.
To determine aortic RANTES expression, SYBR green real time PCR was used using specific primers (forward, 3′-TGCTCCAATCTTGCAGTCGT-5′; reverse, 3′-GCGTATACAGGGTCAGAATCAAG-5′). A longer PCR product encompassing this target sequence was used as standard.
Immunohistochemistry and immunofluorescence.
For immunohistochemistry, mice were initially perfused with saline, and then with 10% formalin. After tissue processing, the aorta was embedded in paraffin. 5-μm sections of the aorta were prepared from the thoracic aorta segments 1 mm above the diaphragm. After deparafinization, antigen retrieval was performed in citrate buffer, pH 6.0. Blocking was sequentially performed with 2% BSA, normal horse serum (Vector Laboratories), with avidin-biotin block (SP-2001; Vector Laboratories) and 1.5% hydrogen peroxide to remove endogenous peroxidase activity. Staining was performed using a rabbit polyclonal anti-CD3 zeta (Abcam; 1:100 dilution) as a primary antibody for 1 h at room temperature. After this, the sections were extensively washed and incubated for 45 min with a biotinylated secondary antibody from the ABC Vectastain system (PK-6101; Vector). Brown staining was visualized using 3,3′ diamino-benzidine tetrachloride (peroxidase substrate kit; SK-4100; Vector Labs). Immunofluorescence was performed on frozen 6-μm sections of the same region of the aorta using rat monoclonal anti-TCR (β chain) antibody (H57-597; BD Biosciences; 1:100). A PE-conjugated antibody was used for detection of fluorescence.
Measurements of vascular reactivity and O2 ·− production.
Vascular reactivity of aortic rings was measured in organ chambers, as previously described (14). Aortic O2 ·− production was measured by quantifying formation of 2-hydroxyethidium from dihydroethidium (25 μM) by HPLC. This product specifically reflects the reaction of O2 ·− with dihydroethidium and has been validated previously (70). Superoxide production by lymphocytes was determined using electron spin resonance and the spin probe CAT1-H, as previously described (71).
Vascular wall morphometry.
Aortic segments were obtained as described in Immunohistochemistry and immunofluorescence, and sections from 1 mm above the diaphragm were stained with hematoxylin and eosin and were analyzed using an Axioskop with an AxioCam system and AxioVision 4.6 software (all from Carl Zeiss MicroImaging, Inc.). Wall thickness was measured from the internal to the external elastic lamina at 10 evenly spaced sites around the aorta. To determine total cross-sectional wall area, the internal and external elastic laminas were planimetered and their areas subtracted. This difference was reported as cross-sectional wall area.
In vitro effect of angiotensin II on T cell activation.
Spleen-derived T cells isolated by magnetic sorting as described above were suspended in RPMI 1640 with 25 mM Hepes, 1% FBS, 0.1% l-glutamine, and 0.1% penicillin/streptomycin, with or without 100 μM angiotensin II. Cells were plated at a density of 2 × 10⁵ per well in 96-well plates precoated with anti-CD3 (BD Biosciences) and cultured for 3 h at 37°C with 5% CO2. After incubation, cells were collected, washed with 1% BSA/PBS, and stained using anti-CD69–FITC, anti-CD4–APC, and anti-CD8–PerCP. FACS analysis was then performed using an LSR II (BD Biosciences) and FlowJo Software (Tree Star, Inc.).
To analyze the effect of angiotensin II on cytokine production by isolated T lymphocytes, cells were plated at a density of 2 × 10⁵ per well in 96-well plates precoated with anti-CD3 and cultured for 48 h at 37°C with 5% CO2. After the incubation period, the media were collected and analyzed using the Cytometric Bead Array (BD Biosciences) to measure secreted TNF-α.
Statistics.
All data are expressed as the means ± the SEM. Comparisons between groups of animals or treatments were made by one-way ANOVA, followed by either the Student-Newman-Keuls or Bonferroni tests when specific comparisons were desired. Analysis of dose–response curves for vascular studies was performed using ANOVA for repeated measures. Values of P < 0.05 were considered statistically significant.
Online supplemental material.
To determine if reduced hypertensive responses to angiotensin II in Rag−/− mice could be caused by blunted vascular contractions, abdominal aortic rings from C57BL/6 and RAG1−/− mice were exposed to 100 nM angiotensin II (Fig. S1). We also studied the effect of angiotensin II on aortic expression of the adhesion molecules ICAM-1 and vascular adhesion molecule-1 (Fig. S2). The online version of this article is available at http://www.jem.org/cgi/content/full/jem.20070657/DC1.
Supplemental Material
Acknowledgments
This work was supported by National Institutes of Health (NIH) grants HL390006 and HL59248, NIH Program Project grant HL58000, and a Department of Veterans Affairs Merit grant.
Dr. Weyand is supported by NIH (HL 63919 and EY 11916). Dr. Guzik is additionally supported by the Polish Ministry of Science and Technology.
The authors have no conflicting financial interests.
Abbreviations used: CCR, CC chemokine receptor; DN, double-negative; DOCA, desoxycorticosterone acetate; ICAM, intercellular adhesion molecule; NADPH, nicotinamide adenosine dinucleotide phosphate; NO, nitric oxide; RAG, recombinase-activating gene; ROS, reactive oxygen species.
References
- 1.Wang, Y., and Q.J. Wang. 2004. The prevalence of prehypertension and hypertension among US adults according to the new joint national committee guidelines: new challenges of the old problem. Arch. Intern. Med. 164:2126–2134. [DOI] [PubMed] [Google Scholar]
- 2.Chobanian, A.V., G.L. Bakris, H.R. Black, W.C. Cushman, L.A. Green, J.L. Izzo Jr., D.W. Jones, B.J. Materson, S. Oparil, J.T. Wright Jr., and E.J. Roccella. 2003. The Seventh Report of the Joint National Committee on Prevention, Detection, Evaluation, and Treatment of High blood pressure: the JNC 7 report. JAMA. 289:2560–2572. [DOI] [PubMed] [Google Scholar]
- 3.Lewington, S., R. Clarke, N. Qizilbash, R. Peto, and R. Collins. 2002. Age-specific relevance of usual blood pressure to vascular mortality: a meta-analysis of individual data for one million adults in 61 prospective studies. Lancet. 360:1903–1913. [DOI] [PubMed] [Google Scholar]
- 4.Naviar, G.L., M.C. Prieto-Carrasquero, and H. Kobori. 2006. Molecular Aspects of the renal renin-angiotensin system. In Molecular Mechanisms in Hypertension. R. Re, D. DiPette, E. Schiffrin, and R. Sowers J., editors. Taylor and Francis, London and New York. 3–14 pp.
- 5.Kim, S., and H. Iwao. 2000. Molecular and cellular mechanisms of angiotensin II-mediated cardiovascular and renal diseases. Pharmacol. Rev. 52:11–34. [PubMed] [Google Scholar]
- 6.Yusuf, S., P. Sleight, J. Pogue, J. Bosch, R. Davies, and G. Dagenais. 2000. Effects of an angiotensin-converting-enzyme inhibitor, ramipril, on cardiovascular events in high-risk patients. The Heart Outcomes Prevention Evaluation Study Investigators. N. Engl. J. Med. 342:145–153. [DOI] [PubMed] [Google Scholar]
- 7.Huang, P.L., Z. Huang, H. Mashimo, K.D. Bloch, M.A. Moskowitz, J.A. Bevan, and M.C. Fishman. 1995. Hypertension in mice lacking the gene for endothelial nitric oxide synthase. Nature. 377:239–242. [DOI] [PubMed] [Google Scholar]
- 8.Tang, K.M., G.R. Wang, P. Lu, R.H. Karas, M. Aronovitz, S.P. Heximer, K.M. Kaltenbronn, K.J. Blumer, D.P. Siderovski, Y. Zhu, and M.E. Mendelsohn. 2003. Regulator of G-protein signaling-2 mediates vascular smooth muscle relaxation and blood pressure. Nat. Med. 9:1506–1512. [DOI] [PubMed] [Google Scholar]
- 9.Hoffman, W.E., M.I. Phillips, E. Wilson, and P.G. Schmid. 1977. A pressor response associated with drinking in rats. Proc. Soc. Exp. Biol. Med. 154:121–124. [DOI] [PubMed] [Google Scholar]
- 10.Crowley, S.D., S.B. Gurley, M.J. Herrera, P. Ruiz, R. Griffiths, A.P. Kumar, H.S. Kim, O. Smithies, T.H. Le, and T.M. Coffman. 2006. Angiotensin II causes hypertension and cardiac hypertrophy through its receptors in the kidney. Proc. Natl. Acad. Sci. USA. 103:17985–17990. [DOI] [PMC free article] [PubMed] [Google Scholar]
- 11.Lifton, R.P., A.G. Gharavi, and D.S. Geller. 2001. Molecular mechanisms of human hypertension. Cell. 104:545–556. [DOI] [PubMed] [Google Scholar]
- 12.Lassegue, B., and R.E. Clempus. 2003. Vascular NAD(P)H oxidases: specific features, expression, and regulation. Am. J. Physiol. Regul. Integr. Comp. Physiol. 285:R277–R297. [DOI] [PubMed] [Google Scholar]
- 13.Landmesser, U., H. Cai, S. Dikalov, L. McCann, J. Hwang, H. Jo, S.M. Holland, and D.G. Harrison. 2002. Role of p47(phox) in vascular oxidative stress and hypertension caused by angiotensin II. Hypertension. 40:511–515. [DOI] [PMC free article] [PubMed] [Google Scholar]
- 14.Landmesser, U., S. Dikalov, S.R. Price, L. McCann, T. Fukai, S.M. Holland, W.E. Mitch, and D.G. Harrison. 2003. Oxidation of tetrahydrobiopterin leads to uncoupling of endothelial cell nitric oxide synthase in hypertension. J. Clin. Invest. 111:1201–1209. [DOI] [PMC free article] [PubMed] [Google Scholar]
- 15.Griendling, K.K., C.A. Minieri, J.D. Ollerenshaw, and R.W. Alexander. 1994. Angiotensin II stimulates NADH and NADPH oxidase activity in cultured vascular smooth muscle cells. Circ. Res. 74:1141–1148. [DOI] [PubMed] [Google Scholar]
- 16.Gryglewski, R.J., R.M. Palmer, and S. Moncada. 1986. Superoxide anion is involved in the breakdown of endothelium-derived vascular relaxing factor. Nature. 320:454–456. [DOI] [PubMed] [Google Scholar]
- 17.Wilcox, C.S. 2005. Oxidative stress and nitric oxide deficiency in the kidney: a critical link to hypertension? Am. J. Physiol. Regul. Integr. Comp. Physiol. 289:R913–R935. [DOI] [PubMed] [Google Scholar]
- 18.Zimmerman, M.C., E. Lazartigues, J.A. Lang, P. Sinnayah, I.M. Ahmad, D.R. Spitz, and R.L. Davisson. 2002. Superoxide mediates the actions of angiotensin II in the central nervous system. Circ. Res. 91:1038–1045. [DOI] [PubMed] [Google Scholar]
- 19.Jackson, S.H., S. Devadas, J. Kwon, L.A. Pinto, and M.S. Williams. 2004. T cells express a phagocyte-type NADPH oxidase that is activated after T cell receptor stimulation. Nat. Immunol. 5:818–827. [DOI] [PubMed] [Google Scholar]
- 20.Nataraj, C., M.I. Oliverio, R.B. Mannon, P.J. Mannon, L.P. Audoly, C.S. Amuchastegui, P. Ruiz, O. Smithies, and T.M. Coffman. 1999. Angiotensin II regulates cellular immune responses through a calcineurin-dependent pathway. J. Clin. Invest. 104:1693–1701. [DOI] [PMC free article] [PubMed] [Google Scholar]
- 21.Rodriguez-Iturbe, B., Y. Quiroz, M. Nava, L. Bonet, M. Chavez, J. Herrera-Acosta, R.J. Johnson, and H.A. Pons. 2002. Reduction of renal immune cell infiltration results in blood pressure control in genetically hypertensive rats. Am. J. Physiol. Renal Physiol. 282:F191–F201. [DOI] [PubMed] [Google Scholar]
- 22.Bataillard, A., J.C. Freiche, M. Vincent, J. Sassard, and J.L. Touraine. 1986. Antihypertensive effect of neonatal thymectomy in the genetically hypertensive LH rat. Thymus. 8:321–330. [PubMed] [Google Scholar]
- 23.Balsari, A., R. Marolda, C. Gambacorti-Passerini, G. Sciorelli, G. Tona, E. Cosulich, D. Taramelli, G. Fossati, G. Parmiani, and N. Cascinelli. 1986. Systemic administration of autologous, alloactivated helper-enriched lymphocytes to patients with metastatic melanoma of the lung. A phase I study. Cancer Immunol. Immunother. 21:148–155. [DOI] [PMC free article] [PubMed] [Google Scholar]
- 24.Minagawa, M., J. Narita, T. Tada, S. Maruyama, T. Shimizu, M. Bannai, H. Oya, K. Hatakeyama, and T. Abo. 1999. Mechanisms underlying immunologic states during pregnancy: possible association of the sympathetic nervous system. Cell. Immunol. 196:1–13. [DOI] [PubMed] [Google Scholar]
- 25.Muller, D.N., E. Shagdarsuren, J.K. Park, R. Dechend, E. Mervaala, F. Hampich, A. Fiebeler, X. Ju, P. Finckenberg, J. Theuer, et al. 2002. Immunosuppressive treatment protects against angiotensin II-induced renal damage. Am. J. Pathol. 161:1679–1693. [DOI] [PMC free article] [PubMed] [Google Scholar]
- 26.Herrera, J., A. Ferrebuz, E.G. Macgregor, and B. Rodriguez-Iturbe. 2006. Mycophenolate mofetil treatment improves hypertension in patients with psoriasis and rheumatoid arthritis. J. Am. Soc. Nephrol. 17:S218–S225. [DOI] [PubMed] [Google Scholar]
- 27.Tian, N., J.W. Gu, S.J. Braddy, R.A. Rose, M.D. Hughson, and R.D. Manning Jr. 2007. Immune suppression prevents renal damage and dysfunction and reduces arterial pressure in salt-sensitive hypertension. Am. J. Physiol. Heart Circ. Physiol. 292:H1018–H1025. [DOI] [PubMed] [Google Scholar]
- 28.Seaberg, E.C., A. Munoz, M. Lu, R. Detels, J.B. Margolick, S.A. Riddler, C.M. Williams, and J.P. Phair. 2005. Association between highly active antiretroviral therapy and hypertension in a large cohort of men followed from 1984 to 2003. AIDS. 19:953–960. [DOI] [PubMed] [Google Scholar]
- 29.Morishita, R., G.H. Gibbons, K.E. Ellison, W. Lee, L. Zhang, H. Yu, Y. Kaneda, T. Ogihara, and V.J. Dzau. 1994. Evidence for direct local effect of angiotensin in vascular hypertrophy. In vivo gene transfer of angiotensin converting enzyme. J. Clin. Invest. 94:978–984. [DOI] [PMC free article] [PubMed] [Google Scholar]
- 30.Schiffrin, E.L., J.B. Park, H.D. Intengan, and R.M. Touyz. 2000. Correction of arterial structure and endothelial dysfunction in human essential hypertension by the angiotensin receptor antagonist losartan. Circulation. 101:1653–1659. [DOI] [PubMed] [Google Scholar]
- 31.Cai, H., K.K. Griendling, and D.G. Harrison. 2003. The vascular NAD(P)H oxidases as therapeutic targets in cardiovascular diseases. Trends Pharmacol. Sci. 24:471–478. [DOI] [PubMed] [Google Scholar]
- 32.Galkina, E., A. Kadl, J. Sanders, D. Varughese, I.J. Sarembock, and K. Ley. 2006. Lymphocyte recruitment into the aortic wall before and during development of atherosclerosis is partially L-selectin dependent. J. Exp. Med. 203:1273–1282. [DOI] [PMC free article] [PubMed] [Google Scholar]
- 33.Liu, J., F. Yang, X.P. Yang, M. Jankowski, and P.J. Pagano. 2003. NAD(P)H Oxidase Mediates Angiotensin II-induced vascular macrophage infiltration and medial hypertrophy. Arterioscler. Thromb. Vasc. Biol. 23:776–782. [DOI] [PubMed] [Google Scholar]
- 34.Somers, M.J., K. Mavromatis, Z.S. Galis, and D.G. Harrison. 2000. Vascular superoxide production and vasomotor function in hypertension induced by deoxycorticosterone acetate-salt. Circulation. 101:1722–1728. [DOI] [PubMed] [Google Scholar]
- 35.Hayday, A., and R. Tigelaar. 2003. Immunoregulation in the tissues by gammadelta T cells. Nat. Rev. Immunol. 3:233–242. [DOI] [PubMed] [Google Scholar]
- 36.Antonelli, L.R., W.O. Dutra, R.R. Oliveira, K.C. Torres, L.H. Guimaraes, O. Bacellar, and K.J. Gollob. 2006. Disparate immunoregulatory potentials for double-negative (CD4- CD8-) alpha beta and gamma delta T cells from human patients with cutaneous leishmaniasis. Infect. Immun. 74:6317–6323. [DOI] [PMC free article] [PubMed] [Google Scholar]
- 37.Umemura, M., T. Kawabe, K. Shudo, H. Kidoya, M. Fukui, M. Asano, Y. Iwakura, G. Matsuzaki, R. Imamura, and T. Suda. 2004. Involvement of IL-17 in Fas ligand-induced inflammation. Int. Immunol. 16:1099–1108. [DOI] [PubMed] [Google Scholar]
- 38.Clozel, M., H. Kuhn, F. Hefti, and H.R. Baumgartner. 1991. Endothelial dysfunction and subendothelial monocyte macrophages in hypertension. Effect of angiotensin converting enzyme inhibition. Hypertension. 18:132–141. [DOI] [PubMed] [Google Scholar]
- 39.Hinglais, N., D. Heudes, A. Nicoletti, C. Mandet, M. Laurent, J. Bariety, and J.B. Michel. 1994. Colocalization of myocardial fibrosis and inflammatory cells in rats. Lab. Invest. 70:286–294. [PubMed] [Google Scholar]
- 40.Agace, W.W. 2006. Tissue-tropic effector T cells: generation and targeting opportunities. Nat. Rev. Immunol. 6:682–692. [DOI] [PubMed] [Google Scholar]
- 41.Agrewala, J.N., D.M. Brown, N.M. Lepak, D. Duso, G. Huston, and S.L. Swain. 2007. Unique ability of activated CD4+ T cells but not rested effectors to migrate to non-lymphoid sites in the absence of inflammation. J. Biol. Chem. 282:6106–6115. [DOI] [PubMed] [Google Scholar]
- 42.Wu, H., S. Ghosh, X.D. Perrard, L. Feng, G.E. Garcia, J.L. Perrard, J.F. Sweeney, L.E. Peterson, L. Chan, C.W. Smith, and C.M. Ballantyne. 2007. T-cell accumulation and regulated on activation, normal T cell expressed and secreted upregulation in adipose tissue in obesity. Circulation. 115:1029–1038. [DOI] [PubMed] [Google Scholar]
- 43.Tilg, H., and A.R. Moschen. 2006. Adipocytokines: mediators linking adipose tissue, inflammation and immunity. Nat. Rev. Immunol. 6:772–783. [DOI] [PubMed] [Google Scholar]
- 44.Guzik, T.J., D. Mangalat, and R. Korbut. 2006. Adipocytokines - novel link between inflammation and vascular function? J. Physiol. Pharmacol. 57:505–528. [PubMed] [Google Scholar]
- 45.Moore, L.L., A.J. Visioni, M.M. Qureshi, M.L. Bradlee, R.C. Ellison, and R. D'Agostino. 2005. Weight loss in overweight adults and the long-term risk of hypertension: the Framingham study. Arch. Intern. Med. 165:1298–1303. [DOI] [PubMed] [Google Scholar]
- 46.Cowley, A.W., Jr., T. Mori, D. Mattson, and A.P. Zou. 2003. Role of renal NO production in the regulation of medullary blood flow. Am. J. Physiol. Regul. Integr. Comp. Physiol. 284:R1355–R1369. [DOI] [PubMed] [Google Scholar]
- 47.Dickhout, J.G., T. Mori, and A.W. Cowley Jr. 2002. Tubulovascular nitric oxide crosstalk: buffering of angiotensin II-induced medullary vasoconstriction. Circ. Res. 91:487–493. [DOI] [PubMed] [Google Scholar]
- 48.Mori, T., and A.W. Cowley Jr. 2004. Renal oxidative stress in medullary thick ascending limbs produced by elevated NaCl and glucose. Hypertension. 43:341–346. [DOI] [PubMed] [Google Scholar]
- 49.Kabelitz, D. 2007. Expression and function of Toll-like receptors in T lymphocytes. Curr. Opin. Immunol. 19:39–45. [DOI] [PubMed] [Google Scholar]
- 50.Parks, B.W., A.J. Lusis, and J.H. Kabarowski. 2006. Loss of the lysophosphatidylcholine effector, G2A, ameliorates aortic atherosclerosis in low-density lipoprotein receptor knockout mice. Arterioscler. Thromb. Vasc. Biol. 26:2703–2709. [DOI] [PubMed] [Google Scholar]
- 51.De Keulenaer, G.W., R.W. Alexander, M. Ushio-Fukai, N. Ishizaka, and K.K. Griendling. 1998. Tumour necrosis factor alpha activates a p22phox-based NADH oxidase in vascular smooth muscle. Biochem. J. 329(Pt 3):653–657. [DOI] [PMC free article] [PubMed] [Google Scholar]
- 52.Picchi, A., X. Gao, S. Belmadani, B.J. Potter, M. Focardi, W.M. Chilian, and C. Zhang. 2006. Tumor necrosis factor-alpha induces endothelial dysfunction in the prediabetic metabolic syndrome. Circ. Res. 99:69–77. [DOI] [PubMed] [Google Scholar]
- 53.Gavras, H., H.R. Brunner, J.H. Laragh, E.D. Vaughan Jr., M. Koss, L.J. Cote, and I. Gavras. 1975. Malignant hypertension resulting from deoxycorticosterone acetate and salt excess: role of renin and sodium in vascular changes. Circ. Res. 36:300–309. [DOI] [PubMed] [Google Scholar]
- 54.Parker, S.B., S.S. Wade, and R.L. Prewitt. 1998. Pressure mediates angiotensin II-induced arterial hypertrophy and PDGF-A expression. Hypertension. 32:452–458. [DOI] [PubMed] [Google Scholar]
- 55.Huang, M., R.L. Hester, T.G. Coleman, M.J. Smith, and A.C. Guyton. 1992. Development of hypertension in animals with reduced total peripheral resistance. Hypertension. 20:828–833. [DOI] [PubMed] [Google Scholar]
- 56.Guyton, A.C., A.W. Cowley Jr., D.B. Young, T.G. Coleman, J.E. Hall, and J.W. DeClue. 1976. Integration and control of circulatory function. Int. Rev. Physiol. 9:341–385. [PubMed] [Google Scholar]
- 57.McDonough, A.A., P.K. Leong, and L.E. Yang. 2003. Mechanisms of pressure natriuresis: how blood pressure regulates renal sodium transport. Ann. N. Y. Acad. Sci. 986:669–677. [DOI] [PubMed] [Google Scholar]
- 58.Chapleau, M.W., G. Hajduczok, and F.M. Abboud. 1989. Peripheral and central mechanisms of baroreflex resetting. Clin. Exp. Pharmacol. Physiol. Suppl. 15:31–43. [DOI] [PubMed] [Google Scholar]
- 59.Laude, K., H. Cai, B. Fink, N. Hoch, D.S. Weber, L. McCann, G. Kojda, T. Fukai, H.H. Schmidt, S. Dikalov, et al. 2005. Hemodynamic and biochemical adaptations to vascular smooth muscle overexpression of p22phox in mice. Am. J. Physiol. Heart Circ. Physiol. 288:H7–12. [DOI] [PubMed] [Google Scholar]
- 60.Hehner, S.P., R. Breitkreutz, G. Shubinsky, H. Unsoeld, K. Schulze-Osthoff, M.L. Schmitz, and W. Droge. 2000. Enhancement of T cell receptor signaling by a mild oxidative shift in the intracellular thiol pool. J. Immunol. 165:4319–4328. [DOI] [PubMed] [Google Scholar]
- 61.Elmarakby, A.A., J.E. Quigley, D.M. Pollock, and J.D. Imig. 2006. Tumor necrosis factor alpha blockade increases renal Cyp2c23 expression and slows the progression of renal damage in salt-sensitive hypertension. Hypertension. 47:557–562. [DOI] [PubMed] [Google Scholar]
- 62.Maki-Petaja, K.M., F.C. Hall, A.D. Booth, S.M. Wallace, Yasmin, P.W. Bearcroft, S. Harish, A. Furlong, C.M. McEniery, J. Brown, and I.B. Wilkinson. 2006. Rheumatoid arthritis is associated with increased aortic pulse-wave velocity, which is reduced by anti-tumor necrosis factor-alpha therapy. Circulation. 114:1185–1192. [DOI] [PubMed] [Google Scholar]
- 63.Zimmerman, M.C., R.P. Dunlay, E. Lazartigues, Y. Zhang, R.V. Sharma, J.F. Engelhardt, and R.L. Davisson. 2004. Requirement for Rac1-dependent NADPH oxidase in the cardiovascular and dipsogenic actions of angiotensin II in the brain. Circ. Res. 95:532–539. [DOI] [PubMed] [Google Scholar]
- 64.Felten, D.L., S. Livnat, S.Y. Felten, S.L. Carlson, D.L. Bellinger, and P. Yeh. 1984. Sympathetic innervation of lymph nodes in mice. Brain Res. Bull. 13:693–699. [DOI] [PubMed] [Google Scholar]
- 65.Romano, T.A., S.Y. Felten, J.A. Olschowka, and D.L. Felten. 1994. Noradrenergic and peptidergic innervation of lymphoid organs in the beluga, Delphinapterus leucas: an anatomical link between the nervous and immune systems. J. Morphol. 221:243–259. [DOI] [PubMed] [Google Scholar]
- 66.Madden, K.S., S.Y. Felten, D.L. Felten, C.A. Hardy, and S. Livnat. 1994. Sympathetic nervous system modulation of the immune system. II. Induction of lymphocyte proliferation and migration in vivo by chemical sympathectomy. J. Neuroimmunol. 49:67–75. [DOI] [PubMed] [Google Scholar]
- 67.van der Veen, R.C., T.A. Dietlin, A. Karapetian, S.M. Holland, and F.M. Hofman. 2004. Extra-cellular superoxide promotes T cell expansion through inactivation of nitric oxide. J. Neuroimmunol. 153:183–189. [DOI] [PubMed] [Google Scholar]
- 68.Rajagopalan, S., S. Kurz, T. Munzel, M. Tarpey, B.A. Freeman, K.K. Griendling, and D.G. Harrison. 1996. Angiotensin II-mediated hypertension in the rat increases vascular superoxide production via membrane NADH/NADPH oxidase activation. Contribution to alterations of vasomotor tone. J. Clin. Invest. 97:1916–1923. [DOI] [PMC free article] [PubMed] [Google Scholar]
- 69.Widder, J.D., T.J. Guzik, C.F. Mueller, R.E. Clempus, H.H. Schmidt, S.I. Dikalov, K.K. Griendling, D.P. Jones, and D.G. Harrison. 2007. Role of the multidrug resistance protein-1 in hypertension and vascular dysfunction caused by angiotensin II. Arterioscler Thromb Vasc Biol. 27:762–768. [DOI] [PubMed] [Google Scholar]
- 70.Fink, B., K. Laude, L. McCann, A. Doughan, D.G. Harrison, and S. Dikalov. 2004. Detection of intracellular superoxide formation in endothelial cells and intact tissues using dihydroethidium and an HPLC-based assay. Am. J. Physiol. Cell Physiol. 287:C895–C902. [DOI] [PubMed] [Google Scholar]
- 71.Gongora, M.C., Z. Qin, K. Laude, H.W. Kim, L. McCann, J.R. Folz, S. Dikalov, T. Fukai, and D.G. Harrison. 2006. Role of extracellular superoxide dismutase in hypertension. Hypertension. 48:473–478. [DOI] [PubMed] [Google Scholar]
Associated Data
This section collects any data citations, data availability statements, or supplementary materials included in this article.