Abstract
Macroscopic ion channel current can be derived by summation of the stochastic records of individual channel currents. In this paper we present two probability density functions of single channel records that can uniquely determine the macroscopic current regardless of other statistical properties of records or the stochastic model of channel gating (presented often with stationary Markov models). We show that H(t), probability density function of channel opening events (introduced explicitly in this paper), and D(t), probability density function of the open duration (sometimes has named dwell time distribution as well), determine the normalized macroscopic current, G(t), through:
where P(t) is the cumulative density function of H(t), Q(t) is the cumulative density function of D(t), * is the symbol of convolution integral and G(t) is the macroscopic current divided by the amplitude of single channel current and the number of single channel sweeps.
Compared to other equations for the macroscopic current, here the macroscopic current is expressed only in terms of the statistical properties of single channel current and not the stochastic model of ion channel gating or a conditioned form of macroscopic current.
Single channel currents of an inactivating BK channel were used to validate this relationship experimentally too. In this paper we used median filters as they can remove the unwanted noise without smoothing the transitions between open and closed states (compare to low pass filters). This filtering leads to more accurate measurement of transition times and less amount of missed events.
Keywords: Ion Channels, Ion Channel Current, Ion Channel Statistics
INTRODUCTION
The patch clamp technique for recording single ion channel current was demonstrated first by Neher and Sakmann [1] and has been used extensively since. Today it is a standard technique for studying cell electrophysiology. Ion channels exhibit discrete conductance levels, typically fully open or fully closed [1, 2]. Opening and closing of the ion channels as a function of membrane voltage is a stochastic process. Recordings of the same ion channel under the same test conditions exhibit different opening and closing patterns, suggesting that they should be characterized using statistical methods.
Single channel records can be considered as ensembles of a stochastic process that models the channel gating and can be fully characterized from complete knowledge of this process. Direct modeling of the stochastic process of channel gating requires a very detailed knowledge of the mechanism of channel gating which is rarely available. Therefore, statistical properties of single channel data are used to study, classify and compare different sets of single channel records and also to estimate the underlying stochastic process of channel gating (also called channel dynamics, channel kinetics, or mechanistic structure). Many different parameters can be defined to describe the characteristics of single channel records. Because of the stochastic nature of such records, these parameters assume random values among different records and within the same record. Some examples of these parameters are: open duration, closed duration, latency to first opening, duration of the first opening, time of opening event, number of openings per record [3]. We term these parameters “statistical parameters” as they are random variables that describe the statistical characteristics of single channel records. The probability density functions (pdf) of these statistical parameters (random variables) provide quantitative information about the characteristics of the records and help to estimate their underlying stochastic rules. We use the term “statistical property” for the probability density function (pdf) or the cumulative density function (cdf) of a statistical parameter of single channel records. Any scaled (by a constant) pdf (or cdf) of a statistical property can also be considered a statistical property.
Stationary Markov models are the accepted stochastic models in the literature for modeling the stochastic process of channel gating [4]. Comprehensive analyses have been conducted to define different statistical properties of single channel records generated by a known Markov model [4, 5]. Different calibration procedures (mostly numerical) have been developed to find the transition rates between kinetic states of a particular Markov structure to optimally replicate a set of single channel records. These procedures are based on maximum likelihood techniques [6] for matching the statistical properties of the model to the single channel records [7] or the macroscopic current [8, 9] (The macroscopic current is the summation current through a large ensemble of ion channels). There are in theory infinite number of stochastic models (including many Markov structures) that can be calibrated to a set of single channel records to replicate certain statistical properties of the records and/or the resultant macroscopic current. Assuming that all ion channels in an ensemble have the same stochastic rules for gating, the macroscopic current is equivalent to summation of a large number of records from one channel. Therefore, it is proportional to the probability that a channel is open at time t (termed “open probability”). The macroscopic current does not constitute a statistical parameter of ion channels as, unlike the statistical parameters of single channel records that assume random values, it is the same in all similar tests (excluding small fluctuations). The macroscopic current is also not proportional to pdf or cdf (statistical properties) of any random statistical parameter of the single channel records. We term such functions that are neither statistical parameters nor statistical properties of single channel records “macroscopic features” associated with these records; they provide information about the average behavior of the records, not about characteristics of a single channel record. In general, the macroscopic features (including macroscopic current) can be deduced from the relevant statistical properties of single channel records. The macroscopic current, generated by a large ensemble of ion channels in the cell membrane, determines the role of the ion channel in action potential generation and cell electrophysiology. Therefore, it is important to understand the relationship between this current and the statistical properties of its single channel components. The goals of this study are to determine which statistical parameters of single channel records govern the shape of the macroscopic current and to derive a quantitative formulation that relates the pdf of these parameters to the macroscopic current. Such formulation will enhance our understanding of how changes in the statistical properties of channel gating caused by different structural or environmental factors (e.g. mutation, phosphorylation, ligand binding, and ion concentration) affect the macroscopic current and therefore the electrophysiology of the cell. The macroscopic current can be calculated in terms of transition-rates between kinetic states of a known Markov model of the channel gating [5], or directly from the statistical properties of single channel records. The second approach does not require knowledge of the underlying stochastic process of channel gating [3, 10–12] and is the approach taken in this study.
Although the relationship between the statistical properties of single channel currents and the macroscopic current is of great interest, many of its aspects have not yet been fully characterized. For example, it has not been established whether two sets of single channel records with different statistical properties can generate the same macroscopic current. Conversely, can two sets of single channel records with the same commonly used statistical properties generate different macroscopic currents? And if so, what identical statistical properties give rise to identical macroscopic currents? In this work we identify the statistical properties of single channel sweeps that uniquely determine the shape of the macroscopic current.
The relationship between the macroscopic current and single channel records was first explained by Anderson and Stevens [11]. They assumed that all channels open simultaneously (single opening) with an exponentially distributed open duration and showed that the life time of open duration is equal to the time constant of the exponentially decaying macroscopic current. If ion channels all open at the beginning of the test (t = 0) and after the first closing reopen and close multiple times (burst opening), then the burst openings may add another time constant to the macroscopic relaxation curve, reflecting primarily the duration of bursting [3, 12].
Typically, the first openings of ion channels occur with variable latencies after the beginning of the test. The effect of the latency to first opening on macroscopic current was first studied by Aldrich et al. [10]. They defined F(t) as the probability density function of the latency to first opening and introduced the function M(t) as the probability of finding a channel open t seconds after its first opening. M(t) is proportional to the macroscopic current when all the records are aligned so that their first openings all occur at time zero; it therefore represents a conditioned macroscopic current. Similar to the macroscopic current, M(t) depends on statistical properties of the single channel records, but is not a statistical property of these records. If the first openings in different records occur after different latencies with a known probability density function, F(t), then the probability that a channel is open at time t (a scale of the macroscopic current) can be obtained from the convolution of M(t) and F(t) [10]. If channels do not open more than once, then M(t) is equal to the probability density function of open durations [10, 13], a statistical property of single channel records. Using Markov representation of channel gating, Colquhoun and Hawks [3] have shown that M(t) does not represent a statistical property of a single channel and concluded that there is no simple relationship between single channel distributions (statistical properties of single channel records) and macroscopic current. M(t) has been termed burst open probability [14] or conditioned open probability [3] in the ion channel literature.
Here we derive a mathematical relationship between the macroscopic current and statistical properties of single channel records that uniquely determine the macroscopic current. Specifically, we formulate the macroscopic current generated by a voltage clamp protocol in terms of statistical properties of single channel recordings obtained from the same protocol and determine which statistical properties uniquely define the macroscopic current. We then use experimental data recorded from large conductance inactivating BK potassium channels to validate our analysis.
METHODS
Theoretical Methods
Macroscopic current is defined here as the summation of a large number of single channel currents, recorded by repetitive testing of a single ion channel. The amplitude of the macroscopic current depends on the number of records which is different from the number of channels in the cell membrane. Therefore, the whole cell current of an ion channel can be approximated as a scale of the macroscopic current of that ion channel. Regardless of the scale, the shape of the macroscopic current can also be slightly different from the whole cell current because individual ion channels of the same type may have slightly different characteristics. Therefore the summation of currents recorded from one particular channel (macroscopic current) may be slightly different from the summation of currents generated by many channels of the same type (whole cell current). In addition, experimental limitations like imperfect block of other types of channels in a cell may introduce errors in the recorded current, causing some deviations from the whole cell current of a particular channel type.
We define the normalized macroscopic current, G(t), as the macroscopic current divided (normalized) by the amplitude of the single channel current, Ios, and the number of records, N. G(t) represents the macroscopic current where the scaling effect of both the number of records and the amplitude of single channel current has been removed. Therefore G(t) depends only on the statistics of channel gating. From a statistical point of view G(t) is the open probability, however, as it is more a representative of the macroscopic current than the statistical properties of channel gating we would rather to use the term normalized macroscopic current. We also define the normalized single channel current, gi(t), as the current of a single channel record normalized to its amplitude, Ios, meaning that gi(t)=1 in the conducting state and gi(t)=0 in the nonconducting state. G(t) can be written in terms of gi(t) as:
| (1) |
where N is the number of records.
In this work we define the “time of opening events” as a new statistical parameter for single channel records. This statistical parameter is the time (measured from the beginning of the test) of any transition from the closed to the open state (an opening event). To quantify this statistical parameter, we define H(t) by defining the probability that an opening event occurs between time t and t+dt in a single channel record as H(t)dt. H(t) is a function that shows the probability distribution of an opening event occurring at time t. It is obtained by dividing the number of openings between t and t+dt (among all records) by the number of records. For inactivating records, integral of H(t) over the time domain of records (generally speaking from zero to infinity) is the expectation of the number of openings per record. Alternatively, the time of opening events may be quantified by its probability density function, H*(t), obtained by dividing the number of openings between t and t+dt by the total number of openings (in all records). With this definition, the integral over the time domain of the distribution function, H*(t) is one. Clearly H(t) is related to H*(t), the pdf of the time of opening events by:
| (2) |
where A is the average number of openings per record in the ensemble. We termed H(t) the probability density function (pdf) of opening events. Note that H(t) is a scale of the pdf of the time of opening events, H*(t). Physiologically, H(t) is the expectation for the frequency of opening events (number of openings per unit time) in a single channel record at time t. Therefore, the expectation for the number of opening events before time t is:
| (3) |
P(t) is the cumulative density function of opening events.
Although the exact underlying stochastic process of single channel records is not important for the analysis of this paper, however, we put one limit on that and assume the open duration is independent of the time that channel opens. Clearly this is meaningless (valid by nature) for the single channel records that are recorded from nonzero steady state currents as the origin of time is meaningless. This assumptions has been validated for many channels with an acceptable level of accuracy [10, 14, 15] However for some inactivating channels under some special conditions it has been observed that the open duration may have a small dependency on the time that channel has opened [16]. We term the probability density function of the open duration D(t). The cumulative density function of open duration is Q(t) where:
| (4) |
Neglecting the small differences among individual channels of the same type, the whole cell current of an ion channel can be estimated by multiplying the normalized macroscopic current of the single channel data by the number of channels in the cell and the amplitude a single channel current:
| (5) |
where Nch is the number of channels in the cell.
Recording Single Channel Currents
To test the applicability of this model to experimental data, we use a set of 100 inactivating sweeps of single channel records from inactivating BK potassium channels. Recordings were made from inside-out patches from Oocytes expressing mSlo1 α subunits along with the inactivating β2 auxiliary subunit [17]. Following a 100 ms step to −160 mV, channels were activated by a step to +80 mV in the presence of 10 mM Ca2+ bathing the cytosolic face of the membrane. Acquired currents were digitized by sampling every 10 microseconds with filtering at 10 kHz. The capacitance effect was removed and the baseline was adjusted to zero in a preprocessing procedure. At the open state, the currents of all records were of equal magnitude verifying that these ion channels did not have multiple conductance levels and that there was only one channel in the clamped region of membrane in the test protocol. Macroscopic recordings of inactivating BK channels were also obtained under the same conditions. The single channel currents and macroscopic current recorded under the above conditions from Oocyte BK potassium channels (expressing mSlo1 α subunits along with the inactivating β2 auxiliary subunits) exhibited complete inactivation [17]. Therefore, the gating mechanism of channels generating these data is different from that of the common noninactivating BK channels and so are the statistical properties of the records [18].
Deriving the Statistical Properties of Records
For performing statistical analysis, the recorded data are transformed to an ideal rectangular form which represents the original records. The converted sweeps assume the value one if the channel is open or zero if the channel is closed, transition between open and closed states is instantaneous.
The recorded data were filtered to remove the high frequency noise superimposed on the records and eliminate pulses of very short duration that are considered noise rather than true openings or closings. Finite Impulse Response (FIR) or Infinite Impulse Response (IIR) digital filters [19] remove the high frequency noise by removing high frequency components of the records (low pass filtering), which also causes smoothing of the instantaneous transitions between the open and closed states. Bessel filters and Gaussian filters are commonly used low pass filters for removing noise from single channel records. A Gaussian filter tuned to cut off frequency fc, causes a rise time (from 10% to 90% of open state current) of about 0.34/fc in opening events and a similar decay time in closing events [20]. In addition to this delay in event detection, when the pulse duration is close to cut off duration, Tc=1/fc, the amplitude of the filtered current lies between zero and the open state current amplitude instead of obtaining the ideal values of zero or the open state current amplitude.
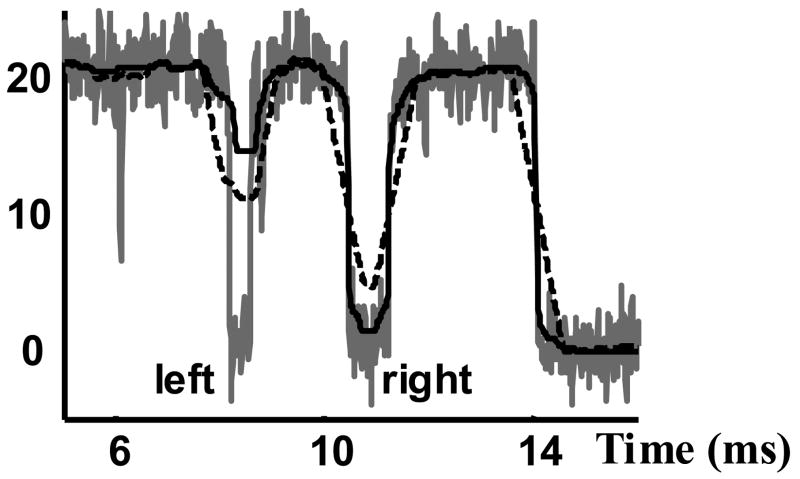
In this work we used median filters [21], which remove the high frequency noise from the signal but keep the sharp transitions of true openings and closings (Figure 1). Compared to low pass filters; median filters perform better in preserving the amplitude and time of events for pulses with duration longer than the cut off duration, and in suppressing pulses with duration less than the cut of duration. The cut off frequency of the filter was tuned to 5 kHz to remove pulses with durations smaller than 0.2 ms.
Figure 1.
Comparison of the performance of a median (solid black) and a FIR filter (dashed black) for removing noise and unwanted pulses from single channel current recordings (grey). Both filters are tuned to a cut off duration of 0.5 ms to remove pulses with pulse duration, d, less than 0.5 ms and pass the pulses with duration greater than 0.5 ms. The duration of the left pulse is slightly less that 0.5 ms (should be suppressed by the filter) and the duration of the right pulse is slightly more than 0.5 ms (should pass through the filter).
After removing the high frequency noise, we set a threshold at 35% of the single-channel current amplitude. The normalized single channel current, gi, was set to one if the channel current exceeded the threshold (open state) or zero where it was smaller (closed state).
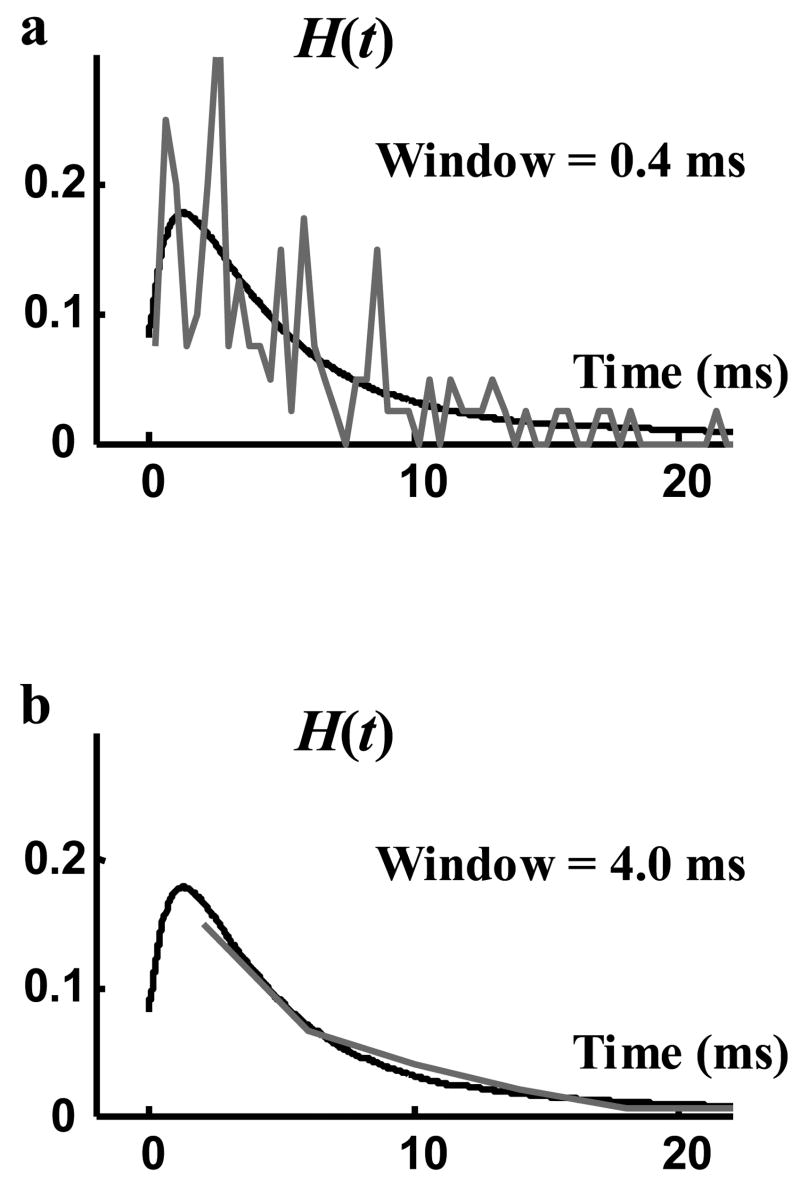
Normalized single channel currents, gi, were used to find the single channel statistics. For the purpose of this paper we need to find the two probability density functions, H(t) and D(t). The common method for deriving such functions is to divide the variable domain (time domain) into several intervals and count the number of events that their values (time of channel opening for H(t) and open duration for D(t)) fall within each interval (among all records) to estimate the average probability in that interval. These time intervals may be of variable length (e.g. logarithmic binning) for a more uniform distribution of the number of events in each interval [22]. Clearly, using this method the information of how the pdf varies within each time interval can not be obtained. However, these estimated averages can be connected in a stepwise manner or using first or higher order interpolation, to find a continuous estimate for the pdf. This method requires a relatively large number of events to be accurate. For a limited number of events, choosing the length of these time intervals involves a trade off for optimum accuracy. Reducing the length of the time intervals increases their number, resulting in a better capture of the time variation of the function. However, increasing the number of intervals reduces the number of events in each interval, which in turn reduces the accuracy of estimating the average probability by counting the events. This introduces an error in the derived probability density function, causing sharp variations between adjacent intervals (Figure 2a). Increasing the length of the time interval increases the number of events in each interval, leading to a more accurate estimate of the average pdf in each interval. However, this decreases the number of intervals and therefore increases the probability of loosing important pdf information because the average pdf is estimated for fewer intervals.
Figure 2.
Probability density function (pdf) of opening events. Black curve is the derivative of the smooth curve fitted to P(t), the cumulative density function of opening events. Grey curves were derived by counting the events in time windows of 0.4 ms (panel a) and 4.0 ms (panel b).
If the number of recordings is not sufficiently large, it would be impossible to find an optimal size for the time intervals that ensures smooth and accurate probability density function without loosing considerable information. In order to cope with that problem we chose a slightly different approach. First, we found the cumulative density functions P(t) and Q(t) by counting the number of events before time t or of less than duration t, respectively. As these estimated functions are stepwise functions, the derivative of each will be a series of delta functions spread over the time domain. In order to obtain smooth derivatives, smooth curves were fitted to each cumulative density function. The derivatives of these fitted smooth curves were used where the measured probability functions were needed. Fitting should be as perfect as possible to reduce the estimation error.
In Figure 2 we show an estimate of H(t) using this method (black) in comparison with the time interval method (grey). In Figure 2a a small time interval (0.4 ms) was chosen to capture the time variations of the function. This led to an inaccurate estimate for the average pdf in each interval. However, both estimates are qualitatively similar and show a fast initial increase followed by a slow decreasing tail. The estimated H(t) with a longer 4.0 ms interval is shown in Figure 2b (grey). For the tail part of H(t), it shows a perfect match with the derivative method used in this paper. However, for this long interval the initial rise and fall of H(t) are completely lost, as they occur within the first 4.0 ms.
RESULTS
In this section we first examine the ability of the commonly used statistical properties of single channel data to determine the macroscopic current. We then derive the macroscopic current in terms of a proper set of statistical parameters that can uniquely determine it. Finally, we test and validate our analysis using experimental data recorded from inactivating BK channels.
Macroscopic Current and the Common Statistical Parameters of Single Channel Records
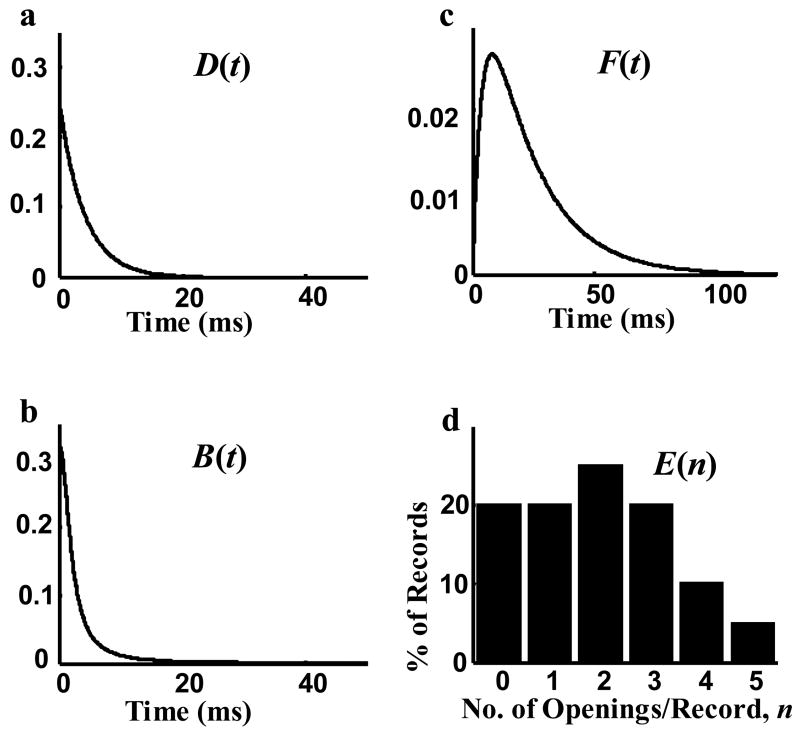
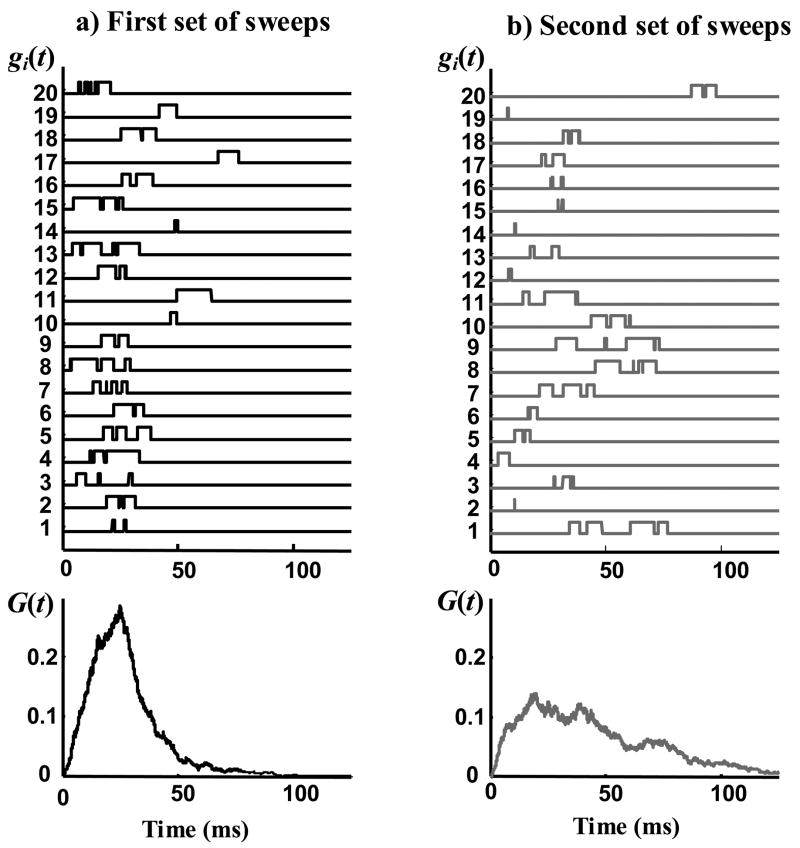
The most commonly used statistical parameters of single channel records are pdf of open duration, D(t), pdf of the latency to first opening, F(t), pdf of closed duration, B(t), and the distribution of the number of openings per record, E(n). The question is: can these statistical properties determine the macroscopic current uniquely? In order to answer this question we wrote a computer program to generate two sets of single channel sweeps (1000 sweeps in each set) using two different stochastic processes. Both stochastic processes generate records with the same statistical properties mentioned above. However, the two sets of sweeps are different statistically and their other statistical properties are not all the same. Figure 3 shows the statistical properties used to generate the data. These statistics are representative of single channel records of inactivating channels, meaning that the probability that a channel transitions to the open state, approaches zero after a certain time. Figures 4a and 4b show the first 20 sweeps of two different sets of data generated with these statistics and the normalized macroscopic current for each data set. The difference between the two normalized macroscopic currents is clear and considerably large, demonstrating that the commonly used statistical parameters of single channel records do not uniquely determine the shape of the macroscopic current. From this perspective, this is an improper choice of a parameter set.
Figure 3.
The statistical properties used in generating single channel records. a) Probability density function (pdf) of open duration D(t)=0.25*exp(−t/4). b) pdf of closed duration B(t)=4/(π(t2+4)). c) pdf of latency to first opening F(t)=0.05*(exp(−t/20)− exp(−t/4)). d) Distribution of the number of openings per record, E(n), with up to five openings per channel.
Figure 4.
Two sets of single channel sweeps that have the same statistical properties (statistical properties are shown in figure 3). Each panel a or b, shows 20 randomly selected sweeps (from 1000 computer generated sweeps) on top and the average of all 1000 sweeps on bottom. gi(t) is the normalized current of a single channel and G(t) is the normalized macroscopic current.
Macroscopic Current in Terms of Proper Statistical Properties of Single Channel Records
In this section we will express the normalized macroscopic current in terms of a proper set of statistical parameters of single channel records. Normalized macroscopic current is defined by Equation (1) of the Methods section. Summation of gi(t) is equivalent to summation of all square pulses that exist in the data set. Each square pulse can be substituted by subtraction of two unit step functions one at the pulse start (opening event) and one at the pulse end (closing event):
| (6) |
where Ki is the number of pulses in record i, oji(t) is the unit step function at jth opening of record i and cji(t) is the unit step function at jth closing of record i. Combining the two summations and assigning one index to each square pulse we may write:
| (7) |
Where is the total number of pulses in the data set and N is the number of records.
O(t) is the average of the opening event unit steps and C(t) is the average of the closing event unit steps. Figure 5 shows a schematic explanation of Equation (7). Note that in deriving Equation (7) it is implicitly assumed that all the channels are in the closed state at time zero. This is a valid assumption for many test protocols (especially for completely inactivating channels). However, for cases that the cell has some initial current (before performing the test protocol) some of the channels are in the open state at time zero. This effect can be compensated for easily by adding the fraction of channels that are open at time zero to the right side of Equation (1). We call this fraction Gi, which is a constant term proportional to the initial current of cell (the normalized initial current). For channels with initial current Equation (1) can be rewritten as:
Figure 5.
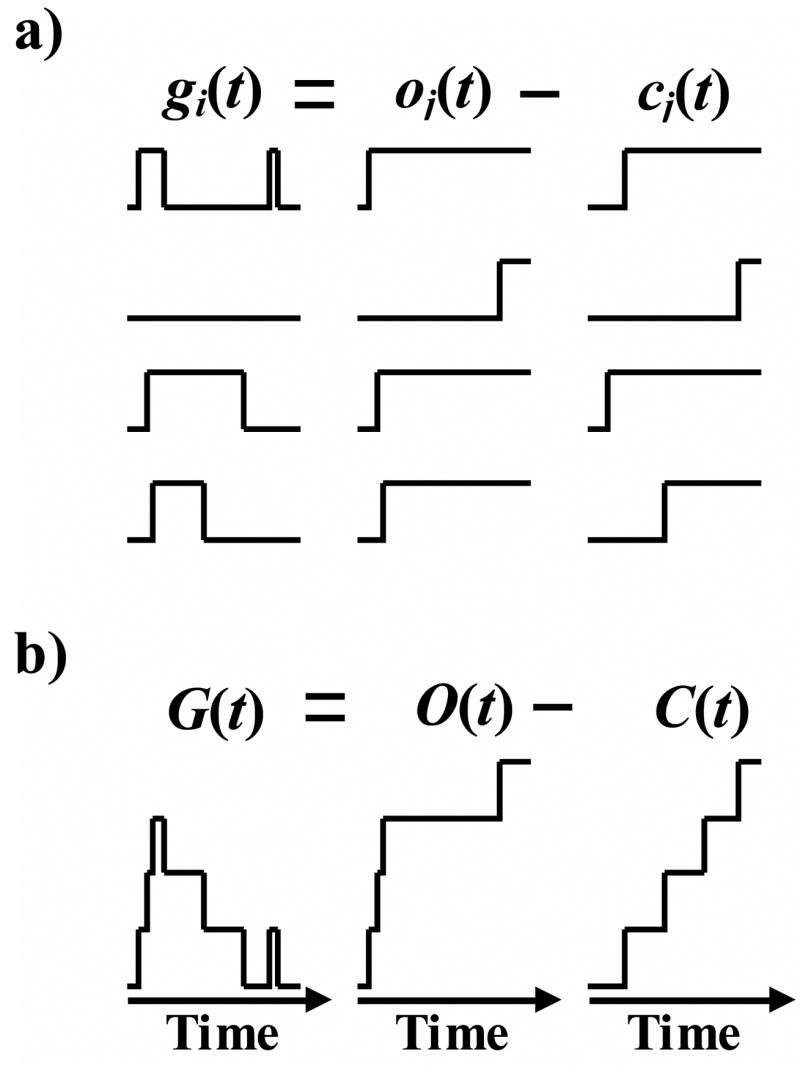
a) Representation of pulses of the normalized single channel current as the subtraction of two unit step functions. gi(t) is the normalized single channel current, and oj(t) and cj(t) are unit step functions at the opening and closing events respectively.
b) Representation of summation of normalized single channel currents as a difference of summations of unit steps functions at opening and closing events. G(t) is the summation of all gi(t), and O(t) and C(t) are the summation of all oj(t) and cj(t) respectively.
| (8) |
O(t) and C(t) are defined through Equation (7), but in order to relate them to statistical properties of single channel sweeps we need to find their statistical interpretations. In fact, G(t) is the fraction of channels that are open at time t, or, from the statistical perspective (for a large ensemble), the probability that a channel is open at time t (called open probability). Similarly O(t) is the proportion of transitions from the closed to the open state before time t and C(t) is the proportion of transitions from the open to the closed state before time t.
For a large ensemble, O(t) is equal to the expectation of the number of openings events before time t in a record and therefore:
| (9) |
Similarly, for large ensemble C(t) is equal to the expectation of the number of closing events before time t. In order for a transition from the open state to the closed state to occur before time t (closing event), an opening should have occurred at some time τ<t for a duration d<t−τ. As the opening event and open duration are independent statistical variables, we can write for the probability P:
| (10) |
But we know that:
| (11) |
| (12) |
Integrating over all possible range of τ (from zero to t), we conclude:
| (13) |
where * is the symbol of convolution integral. In deriving Equation (13) it is implicitly assumed that no channel is open at time zero, as every closing event is associated with an opening event between times zero and t.
However, a fraction of channels may be in the open state at time zero. The closure of these channels should be included in C(t). The proportion of channels in the open state at time zero is Gi and the proportion of these channels that close before time t is the proportion of channels that stay open for less than t, or the cumulative density function of open duration, Q(t). Therefore the general form of C(t):
| (14) |
Substituting for C(t) and O(t) in Equation (8), we obtain the following expression for G(t):
| (15) |
For channels with zero initial current Equation (14) reduces to:
| (16) |
Equation (16) indicates that the two chosen statistical parameters of single channel records, the probability density function of opening events, H(t), and the probability density function of open duration, D(t), uniquely determine the normalized macroscopic current.
Calculating H(t) from a Known Markov Model
As stationary Markov models are accepted models in the literature for modeling the stochastic process of channel gating, it is useful in the context of this paper to establish a relationship between Markov structures and the statistical parameters used in our analysis. The pdf of open duration of a known Markov model has been calculated in terms of the rate constants of the model [4]. Here we calculate the probability of opening events, H(t), for a known Markov model.
Assume that the states of a Markov model are divided into two groups: ky nonconducting states (y states) and kz conducting states (z states) and so the total number of states is: k = ky + kz. Also assume that qij is the transition rate from state i to state j and si(t) is the fractional concentration of channels in state i. Defining Q and s(t) as:
| (17) |
| (18) |
where
| (19) |
s(t) will be:
| (20) |
For an opening to exist between t and t + dt, the channel should be in one of the nonconducting states at time t and transition to one of the conducting states during dt. Assume that states 1 to ky are the nonconducting states and states ky + 1 to k are the conducting states. Also assume that i is the index showing an arbitrary nonconducting state at time t and j is the index showing an arbitrary conducting state at t + dt (after opening transition). The probability of an opening event between t and t + dt can be found by summation of the probabilities of all possible transitions paths. Therefore:
| (21) |
By labeling the nonconducting states y and the conducting states z, Q and s can be written as:
| (22) |
| (23) |
And the matrix form of Equation (21) is:
| (24) |
where uz is a column vector of size kz with all elements equal one.
It should be noted here that the assumption that the open duration is independent of the time of opening event imposes a constraint on the rate constants of the Markov model.
Estimating the Number of Channels in the Cell
Another application of this analysis is obtaining an estimate of the number of ion channels in a cell. To accomplish this, a priori knowledge of statistical properties of the ion channel is required. Assume that the normalized macroscopic current generated by a particular ion channel type during a specific patch clamp test is derived directly from single channel sweeps (if available) using Equation (1), or computed using Equation (16) from the statistical properties H(t) and D(t). Small differences among individual channels of the same type have negligible effect on our estimation and we assume that the behavior of the channel in the patch clamp test represents all channels of its type.
In principle, once G(t) is measured from a single channel test, the whole cell current of the ion channel, Ic(t), can be measured experimentally for the same test protocol and substituted into Equation (5) to compute the number of ion channels in the cell, Nch. However, the measured whole cell current, Ic(t), and the normalized macroscopic current, G(t), are not exactly related by a scaling factor (as Equation (5) suggests). Therefore Nch is estimated by the value that minimizes the difference between the left and right sides of Equation (5); for root mean square (RMS) minimization:
| (25) |
Application to Measured Data
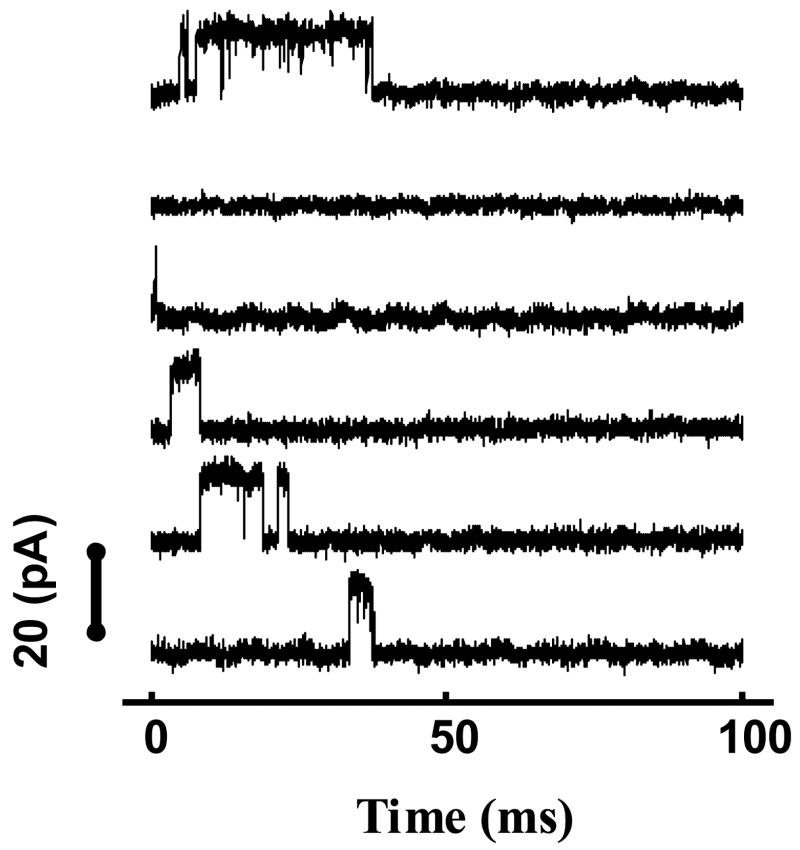
One hundred single channel sweeps, recorded from inactivating BK potassium channels were used to evaluate the ability of the model to predict macroscopic current. These channels have a clear opening and closing behavior and sample records are shown in Figure 6. In this section we first derive the statistical properties of the single channel data. Then we show how accurately Equation (16) predicts the macroscopic current from single channel statistics.
Figure 6.
Samples of single channel currents recorded from BK channels.
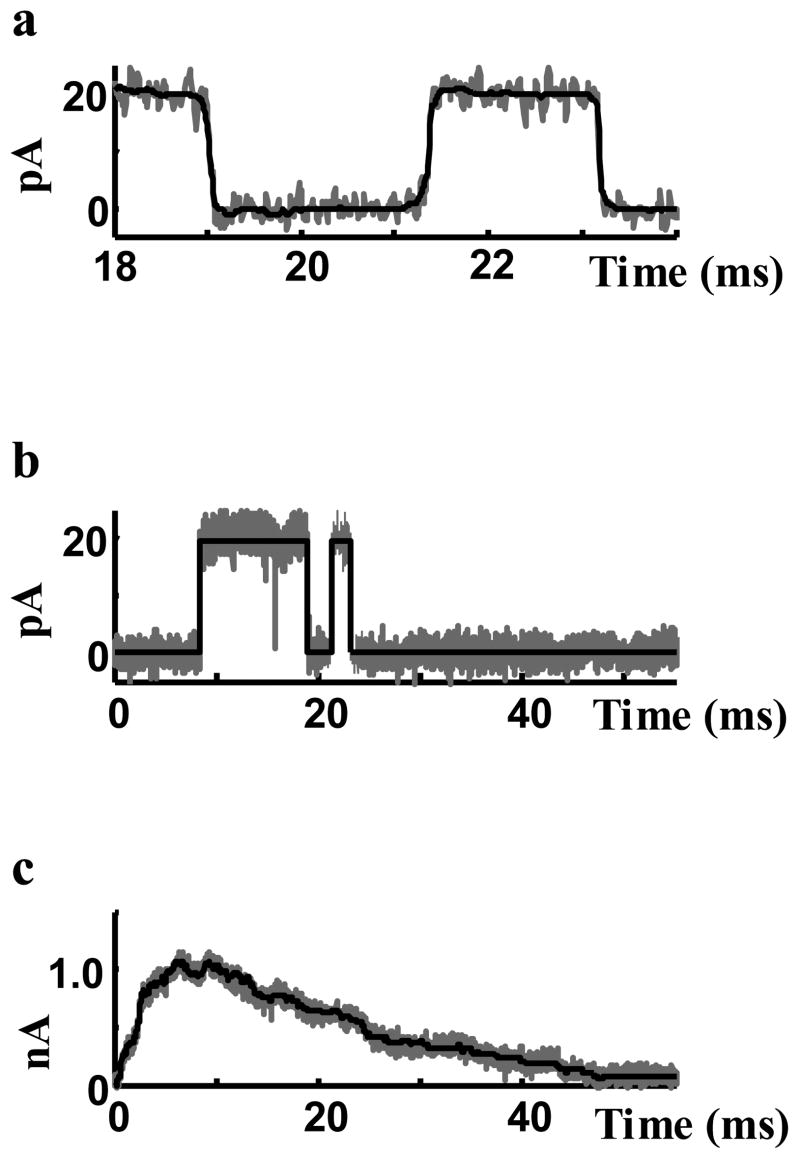
Filtered data are shown in Figure 7a (black curve) together with unfiltered recorded current (grey curve). Filtering successfully removed the high frequency noise from the records without loss of frequency information in the transition edges. In the filtered data, the times of transition events and the durations of open and closed states are preserved. Figure 7b shows how closely the square-pulse representation of the data (black) can represent the raw recorded data (grey) and preserve the transition times and durations. The idealized single channel currents, represented by the square pulses, can accurately regenerate the macroscopic current (Figure 7c) and are therefore adequate representation for studying the relationships between statistical properties of single channel records and macroscopic current.
Figure 7.
Processed single channel data. a) Black is the filtered data (median filter) and grey is the recorded current. Filter removed the high frequency noise without smoothing the transition edges. b) Black is the rectangular pulse representation of the recorded data (grey). c) Summation of the rectangular-pulse representation of channel currents (black) compared to the summation of recorded single channel currents (grey).
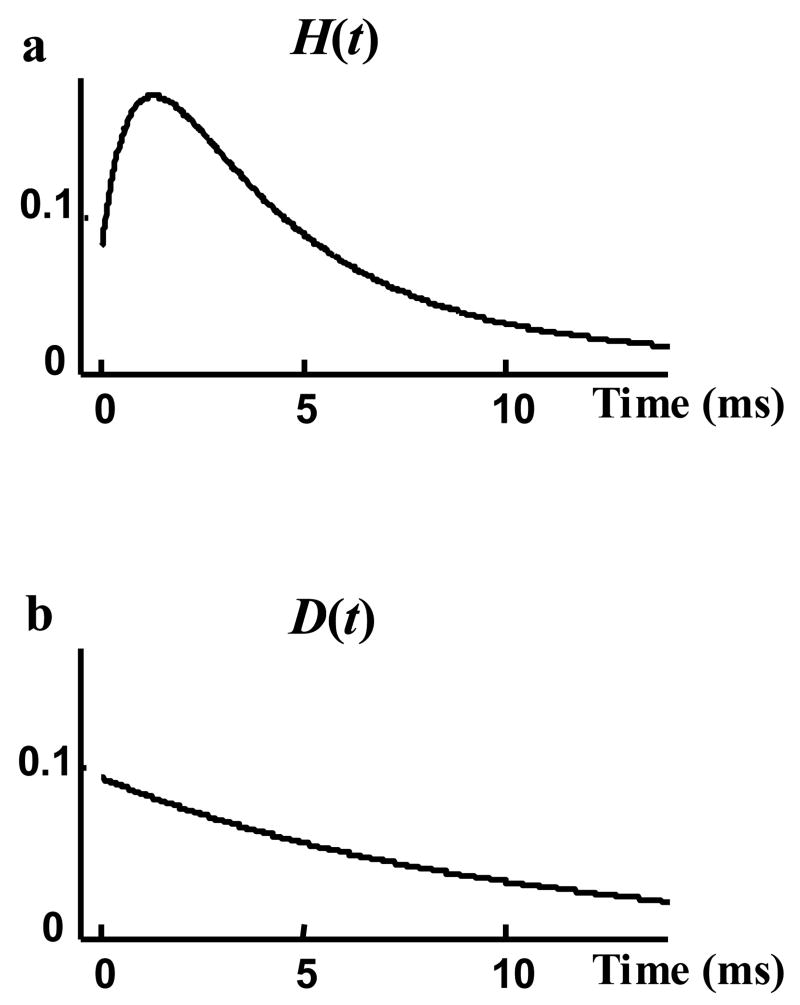
H(t) and D(t) are the probability density functions that are used to represent the single channel records and are estimated from the measured data. As mentioned in the Methods section, it is more accurate to first estimate the related cumulative density functions P(t) and Q(t). Exponential functions were fitted to P(t) and Q(t), providing accurate fits. Figure 8 compares P(t) and Q(t) estimated from the data (grey curves) with the fitted exponential curves (black curves). Three exponential terms were needed to obtain a perfect fit to P(t). Q(t) is the cumulative density function of open duration and could be fitted properly with a single exponential function, indicating that BK channels open time behavior is similar to many other ion channels that follow an exponential distribution function with one time constant. The probability density functions H(t) and D(t) were estimated by the derivatives of the fitted curves P(t) and Q(t), respectively (Figure 9).
Figure 8.
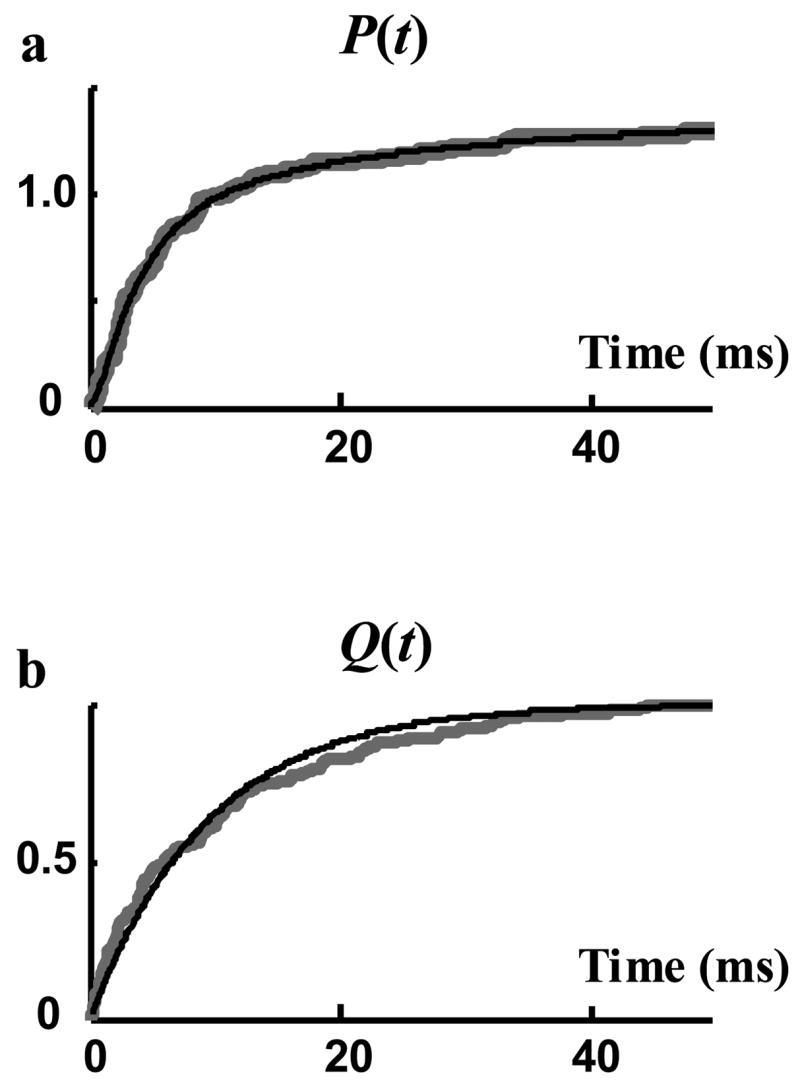
Cumulative density functions (cdf) of recorded data. Grey curves are measured directly from rectangular-pulse representation of single channel sweeps and black curves are fitted to these measured curves. a) P(t), cdf of opening events fitted with three terms exponential function. b) Q(t), cdf of the open duration fitted with a single exponential function.
Figure 9.
Probability density functions: a) H(t), opening events b) D(t), open duration, derived by taking derivatives of the fitted curves of Figure 8.
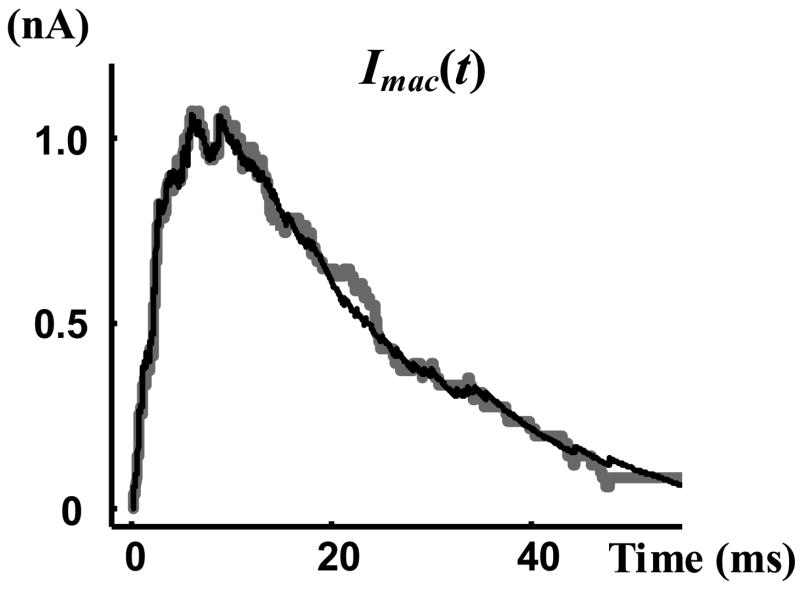
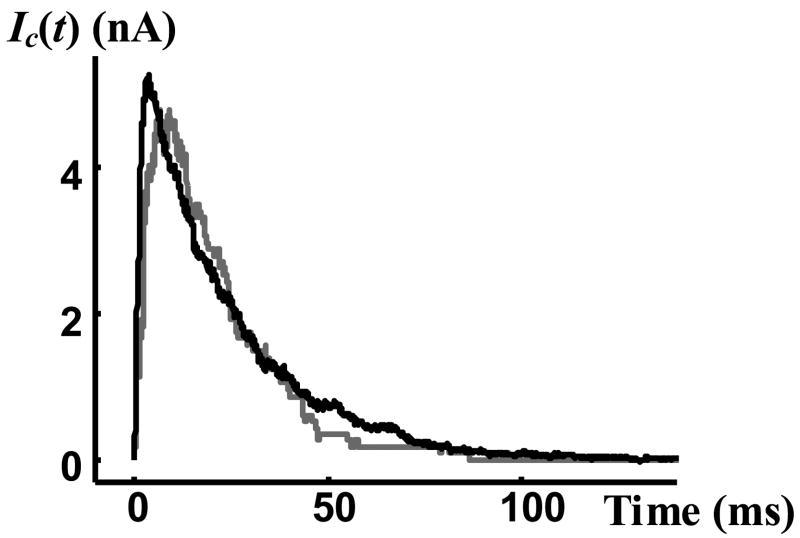
After deriving the required statistical properties of the single channel data, we can test the theoretical results of this study that relate channel statistics and macroscopic current. Equation (16) shows that proper statistical properties of single channel records uniquely determine the normalized macroscopic current, G(t). From G(t) the macroscopic current can be computed through multiplication by the amplitude of the single channel current, Ios, and the number of records, N. The experimentally measured value of Ios is 19.5 pA. Figure 10 shows the macroscopic current of the data (grey curves) compared to the macroscopic current derived from the statistical properties of records using Equation (16). It is evident that Equation (16) accurately regenerates the macroscopic current from the statistics of single channel data.
Figure 10.
Macroscopic current. Grey curve is the summation of single channel currents, and black curve is the macroscopic current derived using Equation (16).
A macroscopic current generated by the BK ion channels was measured for the same test protocol (Figure 11). The number of channels contributing to this macroscopic current can be estimated using Equation (25). The grey curve in Figure 11 is the normalized macroscopic current of single channel records scaled to fit the measured macroscopic current (black curve) using RMS optimization. The slight differences between the two curves could be related to slight differences in the behavior of different individual channels. The optimal scaling factor was 446, indicating that about 450 BK ion channels contributed to the measured macroscopic current.
Figure 11.
Black curve is the experimentally measured macroscopic current and grey curve is its scaled optimal fit. The scaling factor is 446, which is an estimate of the number of channels.
DISCUSSION
Relating Macroscopic Current to Channel Statistics
In the literature of ion channel analysis, macroscopic current has been related to single channel properties using two different approaches and two different types of ion channel parameters. In one approach the macroscopic current is formulated in terms of the stochastic process of channel gating (rather than the statistical properties of single channel records) and more specifically, in terms of the transition rates of a stationary Markov model that represents the channel. A complete formulation of the macroscopic current in terms of the transition rates and initial distribution of states of a general Markov model can be found in the published work of Colquhoun et al [5]. This formulation provides a scheme for studying the effects of altered model rates on the macroscopic current.
While the Markov model can reproduce the statistical properties that it has been calibrated to (for an accurate calibration), it can not reproduce all statistical properties of the single channel records. Therefore, it is important to determine what statistical properties of single channel records govern the shape of the macroscopic current. A Markov model can not provide a direct relationship between the statistical properties of single channel records (that are directly measurable) and the macroscopic current; it simulates the macroscopic current from a set of transition rates that are neither unique nor directly measurable (must be estimated numerically by fitting experimental data).
In a second approach, the macroscopic current has been formulated directly in terms of statistical properties of single channel records. This approach has been limited to a few record patterns including: single opening with or without latency to first opening, where the macroscopic current has been formulated in terms of the distributions of latency to first opening and open duration [3, 10, 11]; multiple openings without latency to first opening, where the time constants of the macroscopic current were found to correspond approximately to the time constants of the distributions of open duration and burst length [12]; a general case where the relationship has been formulated in terms of the distribution of latency to first opening and a conditioned form of the macroscopic current [10]. In this paper, we have formulated the macroscopic current solely in terms of statistical properties of single channel records for the general case, with the assumption that the channel open duration is independent of the time when the opening has occurred, an assumption that is applicable to many channels.
We introduced a new statistical parameter for single channel records, the time of opening events and its corresponding statistical property, the probability density function of opening events, termed H(t). H(t) together with D(t), the pdf of the open durations, determines the macroscopic current uniquely, independent of other statistical properties of single channel records or their underlying stochastic process. Two sets of single channel records may have different probability distribution functions for latency to first opening, number of openings per record, or closed duration, but as long as their probability density functions of opening events and open durations are the same, their macroscopic current will be the same. H(t) is a statistical property of single channel records that is directly related to the macroscopic current through Equation (16) and in turn, to the electrophysiological properties of the cell.
Equation (16) is similar in form to equation (5) in Aldrich et. al. (1983) which can be rewritten based on the terminology of this paper as:
However, the two equations are completely different. M(t) in equation (5) of Aldrich et al. is the normalized macroscopic current when all the records are shifted so that their first openings all occur at time zero. They show that the distribution of latency to first opening can be convolved with M(t), a conditioned macroscopic current from which latency to first opening has been eliminated, to generate the actual macroscopic current with latency restored. This relationship describes the effect of latency on the macroscopic current but does not express the macroscopic current solely in terms of statistical properties of single channel records, as M(t) is a manipulated form of the macroscopic current and not a statistical parameter of single channel records. As such, M(t) does not provide a link between single channel statistical properties and the channel’s role in macroscopic current generation and whole-cell electrophysiology. Recognizing this limitation, Aldrich et al neglected reopening of sodium channels and for this single-opening approximation substituted M(t) with “duration distribution function, L(t)”, a statistical property of ion channels (with our definition L(t)=1−Q(t), which is the proportion of channels that stay open for duration > t). From a Markov model perspective, Colquhoun and Hawkes concluded that “Although the first latency distribution is a single-channel quantity, P11(t) (same as M(t)) is not, and there is, therefore, in general, no simple relationship between single channel distributions and macroscopic current.” (page 453 in reference [3]). We show that a simple relation have not been found because the commonly used distributions (statistical properties) of single channel records can not uniquely determine the macroscopic current. We found a simple relationship by first identifying two distribution functions that uniquely determine the macroscopic current.
An explicit relationship like Equation (16) can not be derived by calibrating a Markov model to a set of statistical properties of single channel records (the “Markov approach”) for two reasons. First, although the macroscopic current can be calculated for a known Markov model, the transition rates of the Markov model are usually calibrated using numerical procedures and can not be expressed explicitly in terms of statistical properties of single channel records. Second, there are many Markov models capable of replicating a particular set of channel-records statistical properties. These different Markov models may generate different macroscopic currents if the chosen statistical properties can not determine the macroscopic current uniquely.
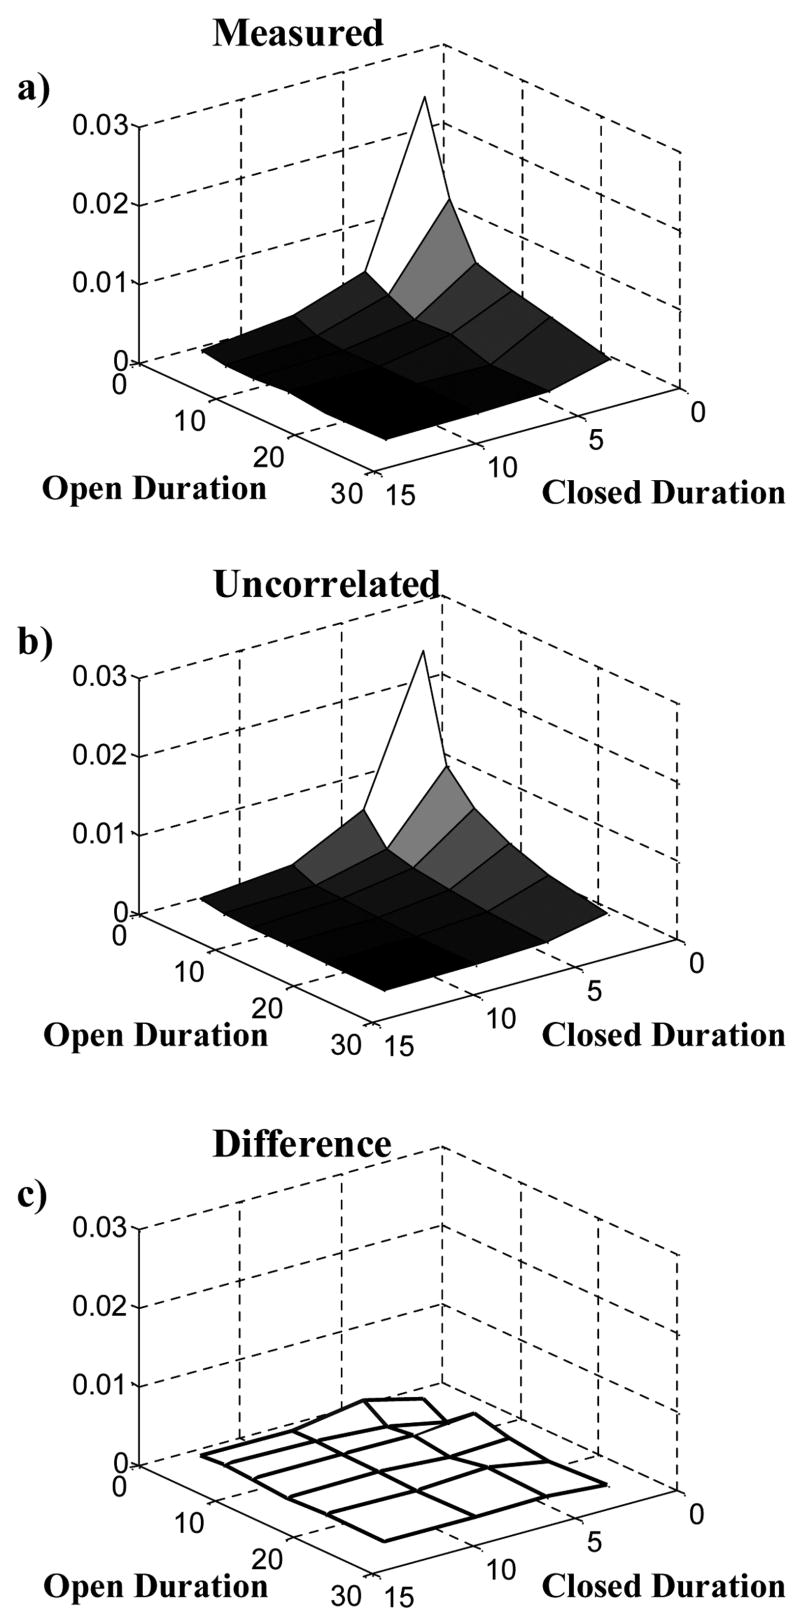
Equation (16) assumes that the open duration is independent of the time of the channel opening event (Equation (10)). The accurate match between the experimental macroscopic current (derived by summation of experimentally measured single channel records) and the prediction of Equation (16) validates this assumption for the data used in this study (Figure 10). Therefore, we can conclude that the open duration of inactivating BK potassium channels, like that of many other channels, is independent of the time of opening event (for similar test conditions). Moreover, a two dimensional dwell time distribution shows that there is almost no correlation between adjacent open and closed intervals of the single channel records used in this paper (Figure 12), meaning that the open duration of inactivating BK potassium channels not only is independent of the time of opening event but also is independent of the previous closed duration.
Figure 12.
Two-dimensional (joint) probability density function (pdf) of adjacent open and closed durations. The two random variables are a closed duration and the open duration following it. a) Two-dimensional pdf of adjacent open and closed duration measured from the experimental data by binning the durations. b) Two-dimensional pdf of adjacent uncorrelated open and closed duration. The pdf of open duration and closed duration were measured from the data. The expectation value for the pdf of uncorrelated adjacent open and closed durations was calculated analytically for the same binning intervals as in panel a. c) Difference between b and a. The small difference between the measured two-dimensional pdf and the expectation for the uncorrelated pdf is within the measurement error, indicating that the open duration is not correlated to the previous closed duration.
Equation (16) can provide qualitative insights about the shape of the macroscopic current associated with specific forms of single channel records. If single-channel opening events are distributed over a long time interval from the beginning of the test with short open durations compared to the length of this interval (burst opening), then the shape of the normalized macroscopic current is almost proportional to the probability density function of opening events H(t), which is the expectation of frequency of openings (number per unit time) at time t. In this case, the mean open duration τ only scales the macroscopic current and the specific distribution of open duration has a negligible effect on the shape of the macroscopic current. As τ increases, the specific shape of the open durations distribution D(t) becomes more important in determining the macroscopic current and the distribution of opening events becomes less important. For a very long mean open duration (compared to the time interval over which the opening events occur) the macroscopic current becomes almost proportional to the probability of an open duration longer than t, (1−Q(t)), and the scaling factor is average H(t), the average number of openings per record. Physiologically, this is the case when all channels open within a very short interval after beginning of the test (which causes a rapid rise in macroscopic current) and stay open on average for a very long duration (which forms a slow decaying macroscopic tail). In this case, most of the channels do not open more than once and the average number of openings per record is less than one. The extreme case of this behavior is when all channel openings occur at time zero.
Explaining Previous Observations
Using the derived relationship between macroscopic current and statistical properties of single channel records, it is possible to explain previous observations about the relation between macroscopic current and single channel statistics.
One example is the case of single channel opening that occurs at the beginning of the test. It has been reported that for this case, the life time of open duration (with a single exponential distribution) is equal to the time constant of an exponentially decaying macroscopic current [11, 23]. Here H(t) will be a Dirac delta function as all the openings occur at time zero:
| (26) |
and Equation (16) reduces to:
| (27) |
where A is the average number of openings per record and is less than or equal to one. Having an exponential function for D(t),
| (28) |
Q(t) becomes:
| (29) |
and consequently:
| (30) |
Therefore τ is both the time constant of the distribution function of open duration (Equation (28)) and the time constant of the exponentially decaying macroscopic current (Equation (30)).
Another example is the case of channel bursting (multiple openings) with all first openings at time zero [3, 12]. The duration of burst opening is a random variable, commonly modeled with a single exponential pdf. It was concluded that in this case the burst openings add another time constant to the macroscopic current relaxation curve, which reflects primarily the duration of bursting. Assuming a uniform probability density function for opening events within all bursts and an exponential pdf for the duration of the bursts, we write the following probabilities, P:
| (31) |
| (32) |
Also:
| (33) |
and therefore:
| (34) |
substituting in Equation (16):
| (35) |
In this case, the macroscopic current shows a two time constant exponential behavior. One time constant is equal to the mean channel open duration (τ) and the other is equal to the mean burst duration (τb). If the mean burst duration is considerably longer than the mean channel open duration (which usually it is), then for the macroscopic current of Equation (35), the time constant of the decaying tail current is equal to the mean burst duration, rather than to the mean channel open duration. Equation (35) is the general form of a function that is formulated as the convolution of two single exponential functions. For example, for the special case where single channel sweeps have only single openings with variable latencies, the equation developed by Aldrich et al [10] has a similar form but the time constants are associated with open duration and latency to first opening.
Number of Channels
We propose a method for estimating the number of channels that contribute to measured macroscopic current (e.g. the whole cell current) as an application of the presented analysis. This method has advantages and disadvantages compared to other methods of estimation including channel labeling, gating current measurement, fluctuation analysis, and computation of the ratio between the peak cell current and the amplitude of single channel current [24]. The labeling method requires knowledge of the specificity and stoichiometry of binding of the labeling agent for an accurate estimate. However, this is a direct approach that provides information about the distribution of the channels as well. Estimating the number of channels by measuring gating current is only applicable for channels with steep voltage dependence and requires isolating the gating current of one channel type. Estimating the number of channels using fluctuation analysis [25] is not applicable for channels with transient current. The ratio method gives the number of channels that are open at peak current (a lower limit for the number of channels) and the actual number of channels can be much greater. To obtain a reasonably accurate estimate of the number of channels using this method, the fraction of open channels contributing to the peak current must be known.
The method suggested in this paper requires certain knowledge of the statistical properties of single channel data. Fortunately, the statistical behavior of a particular ion channel is determined by channel properties that are consistent among different cells of the same type. Therefore, it is not necessary to repeat the single channel recordings each time the number of channels is estimated. Note that this method estimates the number of channels by fitting the entire waveform of the macroscopic current, not only its peak value, thus providing a more accurate estimation.
The Inverse Relationship
In this paper we show how the macroscopic current can be computed from certain statistical properties of single channel records. The next question is: is it possible to compute any of the statistical properties of single channel gating from measured macroscopic current? and if so, what statistical properties and how? Importantly, is it possible to generate the single channel sweeps from these estimated statistical properties? These are addressed in the accompanying paper [26].
Acknowledgments
The authors would like to thank Professor Christopher J. Lingle for providing the experimental data for this study. Many thanks go to Dr. Leonid Livshitz, Dr. Gregory Faber, Jonathan Silva, Thomas O'Hara, Keith Decker, Namit Gaur and Niloufar Ghoreishi for useful advice and discussions. This research was supported by NIH-NHLBI Merit Award R37-HL 33343 and RO1-HL 49054 (to Y.R.). Yoram Rudy is the Fred Saigh Distinguished Professor at Washington University in St. Louis.
Footnotes
Publisher's Disclaimer: This is a PDF file of an unedited manuscript that has been accepted for publication. As a service to our customers we are providing this early version of the manuscript. The manuscript will undergo copyediting, typesetting, and review of the resulting proof before it is published in its final citable form. Please note that during the production process errors may be discovered which could affect the content, and all legal disclaimers that apply to the journal pertain.
References
- 1.Neher E, Sakmann B. Single-channel currents recorded from membrane of denervated frog muscle fibres. Nature. 1976;260:799–802. doi: 10.1038/260799a0. [DOI] [PubMed] [Google Scholar]
- 2.Hamill OP, Marty A, Neher E, Sakmann B, Sigworth FJ. Improved patch-clamp techniques for high-resolution current recording from cells and cell-free membrane patches. Pflugers Arch. 1981;391:85–100. doi: 10.1007/BF00656997. [DOI] [PubMed] [Google Scholar]
- 3.Colquhoun D, Hawkes AG. The Principles of the Stochastic Interpretation of Ion-Channel Mechanism. In: Sakmann B, Neher E, editors. Single-Channel Recordings. Plenum Press; New York: 1995. pp. 409–482. [Google Scholar]
- 4.Colquhoun D, Hawkes AG. Relaxation and fluctuations of membrane currents that flow through drug-operated channels. Proc R Soc Lond B Biol Sci. 1977;199:231–62. doi: 10.1098/rspb.1977.0137. [DOI] [PubMed] [Google Scholar]
- 5.Colquhoun D, Hawkes AG, Merlushkin A. Properties of single ion channel currents elicited by a pulse of agonist concentration or voltage. Phil Trans R Soc Lond A. 1997:1743–1786. [Google Scholar]
- 6.Horn R, Lange K. Estimating kinetic constants from single channel data. Biophys J. 1983;43:207–23. doi: 10.1016/S0006-3495(83)84341-0. [DOI] [PMC free article] [PubMed] [Google Scholar]
- 7.Colquhoun D, Hawkes AG. On the stochastic properties of single ion channels. Proc R Soc Lond B Biol Sci. 1981;211:205–35. doi: 10.1098/rspb.1981.0003. [DOI] [PubMed] [Google Scholar]
- 8.Milescu LS, Akk G, Sachs F. Maximum likelihood estimation of ion channel kinetics from macroscopic currents. Biophys J. 2005;88:2494–515. doi: 10.1529/biophysj.104.053256. [DOI] [PMC free article] [PubMed] [Google Scholar]
- 9.Celentano JJ, Hawkes AG. Use of the covariance matrix in directly fitting kinetic parameters: application to GABAA receptors. Biophys J. 2004;87:276–94. doi: 10.1529/biophysj.103.036632. [DOI] [PMC free article] [PubMed] [Google Scholar]
- 10.Aldrich RW, Corey DP, Stevens CF. A reinterpretation of mammalian sodium channel gating based on single channel recording. Nature. 1983;306:436–41. doi: 10.1038/306436a0. [DOI] [PubMed] [Google Scholar]
- 11.Anderson CR, Stevens CF. Voltage clamp analysis of acetylcholine produced end-plate current fluctuations at frog neuromuscular junction. J Physiol. 1973;235:655–91. doi: 10.1113/jphysiol.1973.sp010410. [DOI] [PMC free article] [PubMed] [Google Scholar]
- 12.Neher E, Steinbach JH. Local anaesthetics transiently block currents through single acetylcholine-receptor channels. J Physiol. 1978;277:153–76. doi: 10.1113/jphysiol.1978.sp012267. [DOI] [PMC free article] [PubMed] [Google Scholar]
- 13.Vandenberg CA, Horn R. Inactivation viewed through single sodium channels. J Gen Physiol. 1984;84:535–64. doi: 10.1085/jgp.84.4.535. [DOI] [PMC free article] [PubMed] [Google Scholar]
- 14.Horn R, Vandenberg CA. Statistical properties of single sodium channels. J Gen Physiol. 1984;84:505–34. doi: 10.1085/jgp.84.4.505. [DOI] [PMC free article] [PubMed] [Google Scholar]
- 15.Gibb AJ, Colquhoun D. Activation of N-methyl-D-aspartate receptors by L-glutamate in cells dissociated from adult rat hippocampus. J Physiol. 1992;456:143–79. doi: 10.1113/jphysiol.1992.sp019331. [DOI] [PMC free article] [PubMed] [Google Scholar]
- 16.Correa AM, Bezanilla F. Gating of the squid sodium channel at positive potentials: II. Single channels reveal two open states. Biophys J. 1994;66:1864–78. doi: 10.1016/S0006-3495(94)80980-4. [DOI] [PMC free article] [PubMed] [Google Scholar]
- 17.Xia XM, Ding JP, Lingle CJ. Molecular basis for the inactivation of Ca2+- and voltage-dependent BK channels in adrenal chromaffin cells and rat insulinoma tumor cells. J Neurosci. 1999;19:5255–64. doi: 10.1523/JNEUROSCI.19-13-05255.1999. [DOI] [PMC free article] [PubMed] [Google Scholar]
- 18.Rothberg BS, Magleby KL. Kinetic structure of large-conductance Ca2+-activated K+ channels suggests that the gating includes transitions through intermediate or secondary states. A mechanism for flickers. J Gen Physiol. 1998;111:751–80. doi: 10.1085/jgp.111.6.751. [DOI] [PMC free article] [PubMed] [Google Scholar]
- 19.Oppenheim AV, Schafer RW, Buck JR. Discrete-Time Signal Processing. Prentice Hall; Englewood Cliffs, N.J: 1989. [Google Scholar]
- 20.Colquhoun D, Sigworth FJ. Fitting and Statistical Analysis of Single-Channel Records. In: Sakmann B, Neher E, editors. Single-Channel Recording. Plenum Press; New York: 1995. pp. 483–588. [Google Scholar]
- 21.Pratt WK. Digital image processing. John Wiley & Sons; New York: 1978. [Google Scholar]
- 22.Sigworth FJ, Sine SM. Data transformations for improved display and fitting of single-channel dwell time histograms. Biophys J. 1987;52:1047–54. doi: 10.1016/S0006-3495(87)83298-8. [DOI] [PMC free article] [PubMed] [Google Scholar]
- 23.Colquhoun D. How fast do drugs work. Trends Pharmacol Sci. 1981;2:212–217. [Google Scholar]
- 24.Hillie B. Ion Channels of Excitable Membranes. Sinauer Associates, Inc; Sunderland: 2001. pp. 377–404. [Google Scholar]
- 25.Sigworth FJ. The variance of sodium current fluctuations at the node of Ranvier. J Physiol. 1980;307:97–129. doi: 10.1113/jphysiol.1980.sp013426. [DOI] [PMC free article] [PubMed] [Google Scholar]
- 26.Nekouzadeh A, Rudy Y. Statistical properties of ion channel: II. Estimation from macroscopic current. Math Biosci. 2006 doi: 10.1016/j.mbs.2007.04.003. Submitted. [DOI] [PMC free article] [PubMed] [Google Scholar]


