

Abstract
Despite the widespread use of chemotherapy and other control strategies over the past 50 years, transmission rates for schistosomiasis have changed little. Regardless of the approach used, future control efforts will require a more complete understanding of fundamental parasite biology. Schistosomes undergo complex development involving an alteration of parasite generations within a mammalian and freshwater molluscan host in the completion of its lifecycle. Little is known about factors controlling schistosome development, but understanding these processes may facilitate the discovery of new control methods. Therefore, our goal in this study is to determine global developmentally-regulated and stage-specific gene expression in Schistosoma mansoni using Serial Analysis of Gene Expression (SAGE). We present a preliminary analysis of genes expressed during development and sexual differentiation in the mammalian host and during early larval development in the snail host. A number of novel, differentially expressed genes have been identified, both within and between the different developmental stages found in the mammalian and snail hosts.
1. Introduction
Schistosomiasis is an important tropical parasitic disease that results from infection by various species of the blood fluke Schistosoma. More than 200 million people are estimated to be infected in more than 70 countries (Hotez et al., 2006). Currently, schistosomiasis treatment is based on a single agent, praziquantel, and there is evidence supporting the development of drug resistance in this parasite (Fenwick et al., 2003). Slow progress in vaccine development (Pearce, 2003) suggests we are limited by our lack of knowledge on how schistosomes evade the host immune response and persist in their host. Clearly more detailed information about the basic biology of schistosomes is necessary to facilitate vaccine and novel drug design (Colley et al., 2001; Pearce and MacDonald, 2002) or to discover new approaches to disrupting parasite development throughout its lifecycle.
As genome sequencing of S. mansoni is nearing completion, functional genomic studies will be essential to capitalize on the massive genomic database being generated (Wilson et al., 2006). Analysis of global gene expression will complement the genome sequencing effort through the identification of a substantial portion of all transcribed genes, thus providing a novel source of dynamic genome annotation. It is anticipated that these studies will provide important insights into mechanisms controlling development and host adaptation of this significant human parasite.
Methods for assessing gene expression on a genomic scale include DNA microarrays, Serial Analysis of Gene Expression (SAGE) (Velculescu et al., 2000; Velculescu et al., 1995; Velculescu et al., 1997), Massively Parallel Signature Sequencing (MPSS) (Brenner et al., 2000), differential display reverse transcriptase polymerase chain reaction (DD RT-PCR) (Liang et al., 1992; Liang and Pardee, 1992), and subtraction hybridization (Jiang et al., 2000; Jiang et al., 1995). The variety of gene expression profiling techniques facilitates adaptation to nearly any organism or question of interest.
The use of DNA microarrays has been widely applied to schistosomes and is considered the method-of-choice for “global” or genome-wide evaluation of gene expression among the mammalian host stages (Fitzpatrick et al., 2004; Fitzpatrick et al., 2005; Chai et al., 2006; DeMarco et al., 2006; Fitzpatrick and Hoffmann 2006; Gobert et al., 2006; Moertel et al., 2006) and those involved in larval development within the snail host (Vermeire et al., 2006). However, a major drawback of microarrays is their dependence upon pre-selection of probes. In our case, this would require a priori knowledge of expressed genes in S. mansoni (including sequence data for probe design), construction of microarrays containing every predicted open reading frame in the (currently incomplete) S. mansoni genome, or construction of probes from an exhaustively sampled cDNA library.
In contrast, SAGE requires no a priori knowledge of the genome, differentially expressed genes, or gene sequences. In SAGE, a short sequence tag (21 bp) from a unique position of an mRNA molecule is used to uniquely identify the source gene from within the genome (Velculescu et al., 1995). Sequence tags are isolated from the mRNA pool of a cell and are linked together to form long concatenated molecules that are cloned and sequenced. The population of tags defines patterns of expression of individual genes (Fig. S1). Quantification of all tags provides a relative measure of gene expression (i.e., mRNA abundance). SAGE thus provides both the identity of expressed genes and levels of their expression. The material benefits of SAGE are its simplicity, low cost, and efficiency.
The utility of SAGE and other functional genomics approaches are greatly increased if complete genome sequences are known or large amounts of genomic shotgun sequences are made available. In this way, the ongoing S. mansoni genome project has augmented the power of functional genomics investigations of S. mansoni’s biology, development, adaptation and sexual differentiation (Wilson et al., 2006). Since SAGE identifies complete mRNA transcripts from 21 bp tags, measures of relative expression can be directly connected to genome sequences or predicted ORFs within the genome (Velculescu et al., 1995; Velculescu et al., 1997). Such a combination of SAGE expression data and a known genome sequence provides the ability to confirm ORF predictions, detect unpredicted ORFs, and annotate a complete genome with gene expression information. However, Long-SAGE is equally promising for parasites lacking available EST or genome information (Coyne et al., 2004). High-throughput methods exist to identify full transcripts from SAGE tag sequences (Chen et al., 2000, 2002a,b) and, in some cases, SAGE tag sequences have been used to prime 5′ Rapid Amplification of cDNA Ends (RACE) for isolation of nearly complete transcripts (AGM, unpublished).
SAGE has been used to identify nitric oxide responsive changes in gene expression in S. mansoni following a 3 hour exposure to sodium nitroprusside, a nitric oxide donor (Messerli et al., 2006). Nitric oxide is a gaseous intercellular signaling molecule that also plays a role in host-parasite relations. Adult worms showed only a modest response to nitric oxide, with 13 SAGE tags upregulated 2-fold or greater in treated parasites. In addition, a total of 8 tags were uniquely present in the sodium nitroprusside-treated library and 21 tags uniquely present in the control library. Overall, this study indicated that nitric oxide does not rapidly induce large-scale changes in schistosome gene expression after a 3 hour exposure, but that expression of particular genes of interest, such as superoxide dismutase, cyclic nucleotide phosphodiesterase and calcineurin, appears to respond to nitric oxide.
In this study, SAGE was used to profile gene expression during development and sexual differentiation of S. mansoni. Ten stage-specific SAGE libraries have been constructed and sequenced and a preliminary analysis is presented.
2. Materials and methods
2.1. Parasite material used in SAGE library construction
Cercariae were obtained from infected Biomphalaria glabrata snails obtained the Biomedical Research Institute in Rockville, MD. Juvenile liver worms were collected by perfusion of NIH-Swiss mice 23 days after percutaneous infection of the tail skin by cercariae for 1 hr in water containing 500 S. mansoni cercariae (Lewis, 1998). Adult worms were collected 7–8 weeks after percutaneous infection of NIH-Swiss mice with 150–200 cercariae. To obtain adult worms from single-sex infections, NIH-Swiss mice were infected with 500 cercariae obtained from a single snail infected with a single miracidium hatched from eggs isolated from infected mouse livers (Lewis, 1998). A single miracidium infecting a snail will produce a clonal population of cercariae that are all of the same sex and infections resulting from these cercariae will produce all male or all female parasites (Kunz, 2001). Worms were identified as male or females based on known characteristics; males from single-sex infections closely resemble those from mixed sex infections (and females will be absent), while females from single-sex infections are stunted in size and exhibit an immature reproductive system (Kunz, 2001). This study was approved by the Institutional Animal Care and Use Committee of Illinois State University (08–2002; DHHS animal welfare assurance number A3762-01).
Free-living miracidia and in vitro cultured mother sporocysts were obtained as previously described by Yoshino and Laursen (1995). S. mansoni eggs were recovered from homogenates of livers removed from mice at 7–8 weeks post-infection. Miracidia were hatched from the eggs in sterile artificial pond water and concentrated on ice in conical polypropylene tubes. Cold-immobilized miracidia were either centrifuged and harvested for RNA immediately or transferred to a 24-well culture plate to permit transformation into primary or mother sporocysts. Sporocysts were cultured for 6 or 20 days at 26°C in either sporocyst medium (Ivanchenko et al., 1999) or sporocyst media ‘conditioned’ with B. glabrata embryonic (Bge) cell factors (Vermeire et al., 2004). Culture media in all wells of sporocysts were changed at two-day intervals. On 6d and 20d developmental time points, total RNA from all cultured sporocysts was isolated as described below.
2.2. RNA isolation and SAGE library construction and sequencing
Total RNA was isolated with Trizol reagent (Roche Biochemicals, Indianapolis, IN) according to manufacturer’s protocols. The I-SAGE Long kit (Invitrogen, Carlsbad, CA) was used to construct LongSAGE libraries according to manufacturer’s protocols, with the exception of the use of pGEM3Z as the cloning vector. Plasmid sequencing templates were prepared from 1.2 ml cultures using alkaline lysis as performed by a RevPrep Orbit robotic workstation (GeneMachines, San Carlos, CA). Sequencing reactions were set up on a Tecan Miniprep 75 workstation (Tecan US, Durham NC) and performed in an ABI 9600 PCR machine. Recombinant DNA sequencing was performed at the Marine Biological Laboratory’s Josephine Bay Paul Center on an ABI 3730xl capillary DNA sequencer.
2.3. SAGE data analysis
Sequences collected were analyzed with software created at the MBL specifically for SAGE analysis. The SAGE software parses out individual SAGE tag sequences from the DNA sequencing results according to the SAGE sequence grammar, excludes tags with sequence ambiguities, and reduces all SAGE tags to a look-up table of unique SAGE tag sequences and their observed frequencies among all of the S. mansoni SAGE libraries. SAGE tags not detected more than once in at least one SAGE library were excluded from analyses as putative sequencing error, unless the tag sequence had a perfect match to all available genomic and EST data. The unique tag sequences were mapped to available S. mansoni DNA sequences to determine the identity of expressed genes. These included ongoing TIGR/Sanger genome assemblies, TIGR S. mansoni gene index sequences (http://www.tigr.org/tdb/tgi), sequences from the S. mansoni EST project (http://verjo18.iq.usp.br/schisto/), and S. mansoni entries in GenBank. From this collective data, we produced a reference cDNA/EST database to aid gene identification and annotation. Genes with significant differential expression between the SAGE libraries were additionally annotated by BLAST against the S. mansoni GeneDB (http://www.genedb.org/genedb/smansoni).
SAGE tags were scored for differential expression among the two libraries using the R-statistic (Stekel et al., 2000). Higher scores represent a greater deviation from the null hypothesis of equal frequencies, while scores close to zero represent near constitutive expression. Hierarchical clustering, as performed by Eisen’s CLUSTER package (Eisen et al., 1998), was additionally used to determine patterns of correlated expression among SAGE libraries. For these cluster analyses, SAGE data was log transformed and median centered for both individual tags and libraries. Clustering was performed using Pearson’s correlation (i.e. centered) as a distance metric and the average linkage algorithm.
2.4. Semi-quantitative RT-PCR validation of SAGE tag frequencies
Complementary DNA (cDNA) was synthesized from the ten different parasite life stags using 1μg of RNA and oligo (dT)20 primer with 200 U of SuperScript II reverse transcriptase in 20 μl reactions according to manufacturer’s protocol (Invitrogen, Carlsbad, CA). Semi-quantitative PCR reactions were performed using, 1 μl of cDNA template, 1.25 mM dNTPs, 5 pmol/μl gene specific primers (Supplemental Table S1), and 1 U Taq DNA polymerase (Promega, Madison, WI) in 50 μl reactions. The number of cycles used for each semi-quantitative PCR reaction was individually optimized to fall within the exponential phase of template amplification by checking the product on 1.2 % agarose gels every cycle of the PCR (between cycles 10–38).
3. Results and discussion
3.1. SAGE library construction
Construction, sequencing, and preliminary analysis of ten S. mansoni SAGE libraries profiling the development and sexual differentiation of the juvenile to adult worm stages in the mammalian host, and the intramolluscan development of the miracidium to 20-day cultured sporocysts have been completed. More than 60,000 SAGE tags were generated from each library constructed from sub-adult liver parasites (SA_LIVER), adult male and female worms from both single sex (AM_SS and AF_SS) and mixed sex (AM_MS and AF_MS) infections, miracidia (MIRA), and sporocysts cultured for 6 days in media pre-conditioned by Bge cells (6D_S_COND) or in media without additions (6D_S_UN). In addition, significant numbers of SAGE tags also were generated from sporocysts cultured for 20 days in media pre-conditioned by Bge cells (20D_S_COND) or in media without additions (20D_S_UN) (Table 1). A total of 28,837 unique SAGE tag sequences were sampled (Table 2), many of which varied in frequency among the SAGE libraries. 28,837 unique tags potentially represents the total number of unique transcripts in S. mansoni. However, based on gene numbers obtained from fully sequenced genomes of other invertebrate metazoans such as Caenorhabditis elegans and Drosophila melanogastor, it is estimated that S. mansoni probably has from 15,000–18,000 genes (Verjovski-Almeida et al., 2003). Most likely, the discrepancy in estimated gene numbers represents artifacts in the production of SAGE tags, including those containing sequencing errors or those resulting from incomplete NlaIII digestion of cDNAs, producing multiple tags from a single transcript. These tags, when identified, are indicated as ‘alternative sense’ (AS) SAGE tags. SAGE tags mapped to a site proximal to the 3′ end of a putative transcript, either shown by the presence of a poly-A tail or a predicted poly-adenylation sequence, are designated ‘primary sense’ (PS) SAGE tags.
TABLE 1.
SAGE tag statistics for completed libraries
| SAGE Library | Acronym | Total Tags Sampled | Putative Sequencing Error Tags | Total Tags Used in Analyses |
|---|---|---|---|---|
| Adult male – single sex infection | AM_SS | 74,549 | 7,446 | 67,103 |
| Adult female – single sex infection | AF_SS | 74,427 | 6,304 | 68,123 |
| Adult male –mixed sex infection | AM_MS | 75,804 | 7,477 | 68,327 |
| Adult female – mixed sex infection | AF_MS | 75,456 | 7,676 | 67,780 |
| Sub-adult liver stage | SA_LIVER | 78,076 | 6,861 | 71,215 |
| Miracidia | MIRA | 76,098 | 7,648 | 68,450 |
| 6d sporocysts (un-cond.) | 6D_S_UN | 75,659 | 7,615 | 68,044 |
| 6d sporocysts (cond.) | 6D_S_CON | 68,603 | 8,432 | 60,171 |
| 20d sporocysts (un-cond.) | 20D_S_UN | 34,574 | 3,890 | 30,684 |
| 20d sporocysts (cond.) | 20D_S_CON | 59,865 | 7,199 | 52,666 |
TABLE 2.
Ability to assign SAGE tags to putative genes and transcripts. The genomic data represent the v2.0 assembly contigs while the transcript data represent our database of cDNA and EST sequences (see Methods). We did not attempt to predict open reading frames (ORFs) for the putative genome sequence contigs, but instead used them as a reference for the uniqueness of SAGE tag sequences within the genome.
| Statistic | Genomic | Transcript |
|---|---|---|
| Total Number of Unique Tag Sequences | 28,837 | |
| Tags that Do Not Map to the Contigs | 11.91% | 35.66% |
| Tags that Map to One Location in the Contigs | 78.23% | 55.99% |
| Tags that Map to Multiple Locations in the Contigs | 9.85% | 8.35% |
| Tags Mapped to an Open Reading Frame | 0.00% | 32.10% |
| Tags Not Mapped to an Open Reading Frame (UK) | 100.00% | 67.90% |
Mapping the SAGE tags to the cDNA/EST database can be used to identify the gene of origin of the tag. When SAGE tags are mapped to the assembled S. mansoni cDNA/EST (i.e., transcript) database, ~56% of the tags map to a unique transcript contig, ~36% did not map to any transcript contig, and ~8% mapped to multiple transcript contigs (Table 2). Overall, ~32% of the SAGE tags mapped to an open reading frame, while 68% either mapped to transcript contigs with no obvious open reading frame or to no transcript contig at all (Table 2). The fraction of SAGE tags that do not map to any transcript contig may represent tag sequencing errors or, perhaps more likely, considering the results relative to the draft genome sequence (see below), may be produced from transcripts for which the region of the transcript producing the SAGE was not captured in an EST. The vast majority of transcript sequences in the S. mansoni transcript database are ESTs that were produced using the ORESTES method (Verjovski-Almeida et al., 2003), which generates partial open reading frame sequences. Full-length ESTs and/or complete annotation of the S. mansoni genomic sequence will be required to identify the origin of the majority of the SAGE tags. However, the usefulness of the SAGE tag remains, whether its gene of origin is known or not. Analysis of the presence and abundance of SAGE tag can be made without knowledge of the origin and SAGE tags having a particular expression pattern can be used to identify (and then clone) genes displaying a particular expression pattern (see below).
Approximately 78% of SAGE tags mapped to a unique site in the S. mansoni genomic sequence (assembly v2.0, September, 2005), while 12% did not map to the genome (Table 2). The latter group of SAGE tags either originated from an unsequenced region of the genome or represent SAGE-tag sequencing artifacts. Approximately 10% of the SAGE tags map to multiple locations in the genome, either originating from identical sequences in gene families or in unrelated genes or represent SAGE sequencing artifacts (Table 2). Linkage of SAGE tags to predicted or known open reading frames will be accomplished with complete annotation of the S. mansoni genome sequence and in the immediate term will aid in the annotation of the S. mansoni genome. In addition, a completed genome sequence with accompanying gene/transcript models will greatly aid in evaluation of alternate sense tags (incomplete NlaIII digestion) and the presence and abundance of antisense transcripts, which appear to be quite prevalent and may be functionally significant in Plasmodium and Toxoplasma (Panankar et al., 2001; Radke et al., 2005) and have been shown to occur in Schistosoma (Smyth et al., 2003).
3.2. Ontology of transcripts identified by SAGE tags
The assignment of all open reading frames in transcripts from PS SAGE tags (R>0), differentially expressed tags (assigned from PS tags R>4) in mammalian and snail stages into the three different GO categories (molecular function, biological process, cellular localization) was performed using Goblet program (http://goblet.molgen.mpg.de; Groth et al., 2004). Of the 2500 total sequences (R>0), 57 % are assigned a molecular function (GO: 0003674), 44 % assigned to a biological process (GO: 0008150), and 30 % assigned to a cellular component (GO: 0005575). The majority of proteins receive a functional assignment as binding activity (70%), physiological process (85%), and to the cellular compartment (74%) (Fig. S2). Approximately 7 % and 4 % of the total proteins are found to be differentially expressed in mammalian and snail stages, respectively. Gene ontology analysis of these differentially expressed proteins showed a three fold increase in proteins involved in signal transduction and cell communication, a four fold increase in proteins involved in development, in mammalian stages compared to snail stages (Fig. S2). On the other hand, proteins involved in the regulation of physiological process and complex formation exhibited increases of 12 fold and 3 fold, respectively, in the snail stages compared to mammalian stages (Fig. S2).
3.3. Expression analysis
Similar to results from microarrays, SAGE tags can be clustered based on their abundance in tag libraries constructed from different tissues, treatments, or developmental stages and displayed as a heatmap. Hierarchical clustering of 502 differentially expressed (R>4) PS tags is represented in Figure 1, and clearly illustrates global changes in gene expression levels as the parasite undergoes maturation and development throughout its lifecycle. A variety of stage-associated differentially expressed genes were identified by Blast sequence analyses and examples are shown in Tables 3 and 4. However, the data also show that approximately ~59% of mammalian stage PS tags and ~47% of snail stage PS tags represent unknown or hypothetical gene sequences, which underscores the fact that we still lack a significant amount of information on a large proportion of differentially expressed genes potentially involved in worm development.
Fig. 1.

Hierarchical clustering of 502, differentially expressed (R > 4) PS tags from all stages profiled was done using Cluster 3.00 and Treeview 1.0.13 programs (Stanford MicroArray Database). Red indicates up regulation and green indicates down regulation relative to the median abundance (black) for each tag. Abbreviations used for stage SAGE libraries are sub-adult liver, SA_Liver; adult female and male from single-sexed infections, AF_SS and AM_SS; adult male and female from mixed sex infections, AM_MS and AF_MS; miracidia, MIRA; 6-day mother sporocysts without or with Bge-conditioned media, 6D_S_UN and 6D_S_COND; and 20-day sporocyst without or with Bge-conditioned media 20D_S_UN and 20D_S_COND.
TABLE 3.
Differentially-expressed transcripts (log-likelihood statistic R > 4) between adult male/single-sexed (AM_SS), adult female/single-sexed (AF_SS), and subadult/liver (SA_Liver) Schistosoma mansoni SAGE libraries; PS SAGE tags only; see Fig. 1.
| AM_SS | AF_SS | SA_Liver | # Genes | Examples |
|---|---|---|---|---|
| ↑ | 10 | GST-28 kDa, Prx1, CytC ox; actin; fatty acid binding protein | ||
| ↑ | 11 | Ubq-CytC Red, Fructose aldolase, purine nucleoside phosphorylase | ||
| ↑ | 30 | Immunophilin, cyclophilin, ferritin, HSP 70, lamin B receptor | ||
| ↑ | ↑ | 15 | Saposin type B, serpin, β-xylosidase | |
| ↑ | ↑ | 6 | RNA Pol B transcription factor, leucine rich protein | |
| ↑ | ↑ | 6 | Receptor activated PKC |
TABLE 4.
Differentially-expressed transcripts (log-likelihood statistic R > 4) between miracidial (MIRA), 6-day cultured mother sporocysts (6D_S_UN), and 20-day cultured sporocysts (20D_S_UN); see Fig. 1.
| MIRA | 6D_S_UN | 20D_S_UN | # Genes | Examples |
|---|---|---|---|---|
| ↑ | 27 | P40 egg antigen, Ca-binding protein (SME16), histone H1, PEPCK, GPx, proteorhodopsin, CP391S (S. japonicum egg protein) | ||
| ↑ | 4 | RNA polB, TF, 14-3-3 epsilon2 | ||
| ↑ | 2 | SM28 GST | ||
| ↑ | ↑ | 17 | Stathmin-like protein (SPO-1), Sm26 GST, fatty acid-binding protein, calreticulin (Sm4), 4 ribosomal-related genes, S. japonicum egg protein CP391B | |
| ↑ | ↑ | 3 | Trypsin-like protein |
SAGE profiling will be useful to monitor specific aspects of parasite biology. For instance, development across different stages and in different host environments could be investigated by profiling Homeobox (Hox) genes, which are involved in controlling pattern during development (McGinnis and Krumlauf, 1992). Because their expression is tightly regulated and their transcripts are not abundant, Hox transcripts would make good tests for the sensitivity and specificity of our SAGE analysis. Several S. mansoni Hox genes have been identified, including orthologues of Drosophila labial (SmHox1), deformed (SmHox4), and abdominal A (SmHox8) (Pierce et al., 2005). SAGE tags for these Hox genes as well as the related nuclear receptor co-repressor S. mansoni Fushi Tarazu-Factor 1 interacting protein (Oger et al., 2006) were identified and their expression pattern analyzed. While the expression of Fushi Tarazu-Factor 1 interacting protein was seen in all developmental stages analyzed, as was suggested previously (Oger et al., 2006), it was found to vary from a low of 0.0044% in AF_SS (3 tags in 68,123 total tags) to 0.01519% in 20D_S_COND (8 tags out of 52,666 total tags), a difference of 3.5 fold (Fig. 2). Hox genes showed varying levels of low and stage-specific expression (Fig. 2). For example, tags for abdominal A (SmHox8) were only identified in SA_Liver, AF_SS, and AM_MS worms, while deformed (SmHox4) displayed a similar expression pattern in mammalian stages and it was also present in 6-day cultured sporocysts. For comparison, the SAGE-tag frequency determined for two highly expressed genes, beta-tubulin and GAPDH, were found to be expressed at more than 10 and nearly 100 times higher, respectively, than the Hox genes.
Fig. 2.
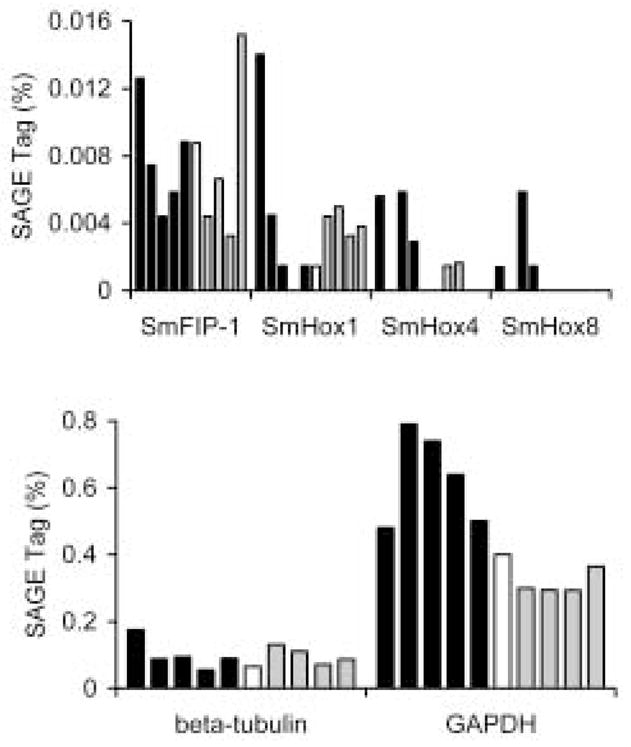
SAGE profiling of Hox genes during S. mansoni lifecycle. A. SAGE tags from all 10 profiled stages for S. mansoni Fushi Tarazu-Factor 1 interacting protein (SmFIP-1), labial (SmHox1), deformed (SmHox4), and abdominal A (SmHox8) are shown. In this figure, and in Figures 4 and 5, for each gene examined the stages are shown in the following order: 1–5, mammalian host stages (closed bars), 1: sub-adult liver; 2: adult males from single-sex infections; 3: adult females from single-sex infections; 4: adult males from mixed sex infections; 5 adult females from mixed sex infections; 6: miracidia (open bar); 7–10 invertebrate host stages (gray bars), 7: 6-day mother sporocysts without Bge-conditioned media; 8: 6-day mother sporocysts with Bge-conditioned media; 9: 20-day sporocysts without Bge-conditioned media; and 10: 20-day sporocysts with Bge-conditioned media. B. SAGE tags for two constitutive, highly expressed genes, beta-tubulin and glyceraldehyde 3-phosphate dehydrogenase (GAPDH), are shown. Tag libraries as in A.
In order to verify that SAGE tag frequencies represent true variations in transcript abundance, several SAGE tags showing differential expression were further investigated by semi-quantitative reverse transcription PCR (RT-PCR). In all tags examined, the relative expression levels indicated by the SAGE results were reflected in the RT-PCR (Fig. 3). This relationship was consistent for low abundance tags, 0-~20 tags per library, to highly abundant tags, 100 to >400 tags per library. For example, SAGE results for a putative cationic amino acid transporter (SAGE tag 13441) indicate very low expression in levels in AM__SS and AM_MS stages and at significantly higher levels in AF_SS, but to be completely absent from AF_MS and sub-adult liver parasites; the same pattern was seen in semi-quantitative RT-PCR analysis.
Fig. 3.
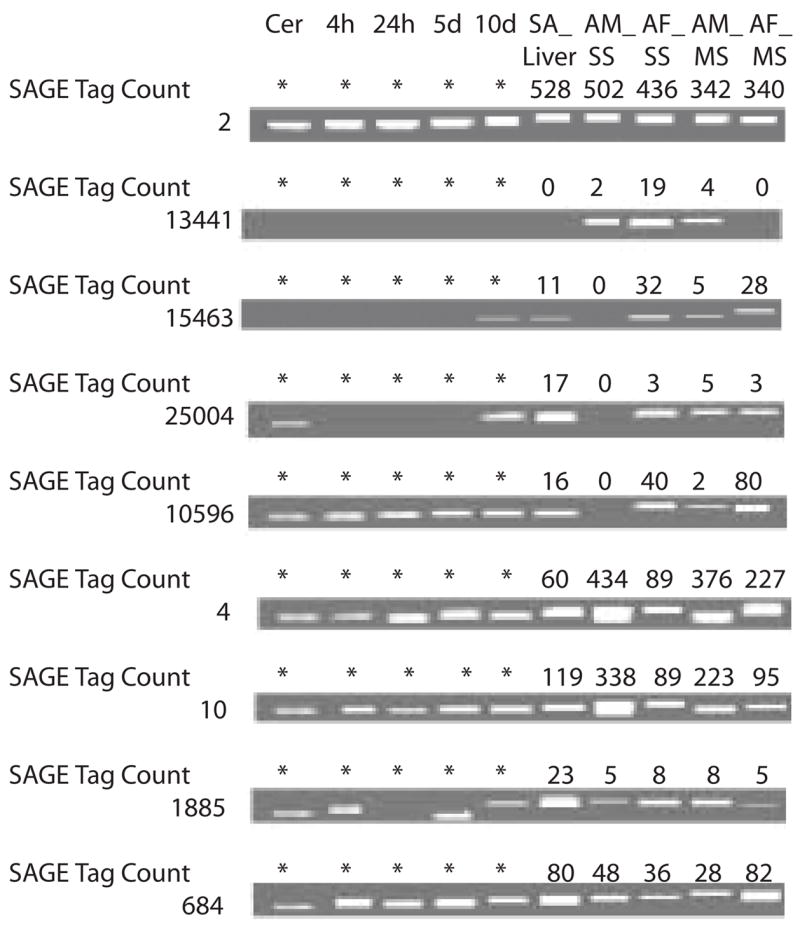
Semi-quantitative reverse-transcription – PCR analysis of SAGE tags. Identity of the SAGE tags and the number of cycles used in the PCR are: 2, GAPDH, 21 cycles; 13441, high affinity cationic amino acid transporter, 36 cycles; 15463, purine nucleoside phosphorylase, 35 cycles; 25004, lamin B receptor, 36 cycles; 10596, histone H3.3, 33 cycles; 4, fatty acid binding protein, 21 cycles; 10, 28 kDa glutathione S-transferase, 23 cycles; 1885, similar to nuclear ribonucleoprotein K, 36 cycles; and 684, similar to nucleoside diphosphate kinase, 30 cycles.
Known, female-specific transcripts were clearly identified by SAGE. For example, tyrosinase 1 and 2 (Fitzpatrick et al., 2006) and FS800 (Reis et al., 1989) were preferentially expressed in females from mixed sex infections (Table 5). The low number of SAGE tags in male SAGE libraries most likely represents the presence of small amounts of contaminating female worm fragments in the male worms. The SAGE tags for these genes were almost entirely absent in males and females from single-sex infections. However, the very low number of SAGE tags found in these stage libraries may support the hypothesis others have suggested that worms developing in single-sex infections do not have a committed transcriptome, instead one that may represent the primordial hermaphroditic state of trematodes (Fitzpatrick and Hoffmann, 2006). Of note, a novel tetraspanin was identified that was found to have nearly 20 times higher expression in AF_MS than other stages. The expression of this transcript is strongly induced by worm pairing, suggesting that it plays a role in male-female interactions. Tetraspanins are surface proteins with four membrane-spanning domains that form molecular complexes with each other and other surface proteins and function in the maintenance of cell membrane integrity and in cell-cell interactions (Boucheix and Rubinstein, 2001). Tetraspanins in S. mansoni have recently been shown to be promising vaccine candidates (Tran et al., 2006).
Table 5.
Female-specific SAGE tags. Group I, transcripts encode genes encoding structural proteins of the eggshell; Group II, transcripts encode enzymes involved in formation of the egg shell; Group III, female-specific transcripts encoding proteins not directly involved in eggshell formation; and Group IV, partial list of female-specific SAGE tags with unknown function. Abbreviations are: subadult/liver worms (SA_Liver); adult male worms/single-sex infection (AM_SS); adult female worms/single-sex infection (AF_SS); adult male worms/mixed sex infection (AM_MS); and adult female worms/mixed sex infection (AF_MS).
| Tag ID | SA LIVER | AM SS | AF SS | AM MS | AF MS | Identification | R-value | |
|---|---|---|---|---|---|---|---|---|
| 5962 | 1 | 6 | 3 | 84 | 1022 | Eggshell protein precursor p14 | 627 | I |
| 5116 | 1 | 5 | 0 | 34 | 684 | Eggshell protein precursor p19 | 434 | |
| 10392 | 0 | 1 | 0 | 19 | 327 | Eggshell protein precursor p34 | 209 | |
| 8450 | 0 | 4 | 0 | 12 | 215 | Eggshell protein precursor p48 | 133 | |
| 9799 | 0 | 2 | 0 | 12 | 208 | Eggshell protein precursor | 131 | |
| 10548 | 0 | 0 | 0 | 0 | 92 | Eggshell protein precursor | 65 | |
| 10396 | 0 | 0 | 0 | 4 | 86 | Eggshell protein precursor | 56 | |
| 10409 | 0 | 0 | 0 | 4 | 79 | Eggshell protein precursor | 52 | |
| 21221 | 0 | 0 | 0 | 0 | 67 | Eggshell protein precursor | 47 | |
|
| ||||||||
| 10423 | 0 | 0 | 0 | 4 | 52 | Tyrosinase 1 | 33 | II |
| 11230 | 0 | 0 | 0 | 0 | 14 | Tyrosinase 2 | 10 | |
|
| ||||||||
| 1610 | 2 | 6 | 1 | 5 | 108 | Tetraspanin | 60 | III |
| 8987 | 0 | 1 | 0 | 5 | 62 | Pro-His-rich protein | 38 | |
| 21936 | 0 | 0 | 1 | 4 | 20 | Female-specific protein 800 | 11 | |
|
| ||||||||
| 10435 | 0 | 0 | 0 | 8 | 162 | SJCHGC09430 protein | 106 | IV |
| 8056 | 0 | 1 | 0 | 2 | 94 | SJCHGC06578 protein | 62 | |
| 10397 | 0 | 0 | 0 | 1 | 53 | SJCHGC05655 protein | 36 | |
| 11223 | 0 | 0 | 0 | 2 | 52 | SJCHGC05655 protein | 34 | |
| 10688 | 0 | 0 | 0 | 5 | 51 | SJCHGC09200 protein | 32 | |
| 10611 | 0 | 0 | 0 | 5 | 49 | SJCHGC09200 protein | 31 | |
| 21702 | 0 | 0 | 0 | 2 | 47 | SJCHGC05655 protein | 31 | |
| 10545 | 0 | 0 | 0 | 3 | 43 | SJCHGC01837 protein | 28 | |
| 22694 | 0 | 0 | 1 | 4 | 34 | SJCHGC02864 protein | 20 | |
| 10687 | 0 | 0 | 0 | 0 | 32 | SJCHGC06422 protein | 23 | |
Egg formation in S. mansoni involves the action of two main cell types; the fertilized ovum and 25–30 vitelline cells combine in the ootype of the female worm to produce the egg (Kunz, 2001; Hoffmann, 2004). Vitelline cells are produced in the vitellaria of females and provide components for synthesis of the eggshell, which consists of a number of eggshell precursor proteins that are cross-linked by tyrosinase to form a melanized, proteinacious network (Ebersberger et al., 2005). SAGE tags from transcripts encoding eggshell precursors are found to be both highly and specifically expressed in AF_MS worms (Table 5). The expression of the eggshell precursors and associated proteins accounts for ~4% of the total transcripts in AF_MS worms. The eggshell cross-linking enzymes tyrosinase1 and 2 were also found to be AF_MS-specific transcripts (Table 5).
For molluscan stages of S. mansoni, marked differential expression of transcripts between the freeliving miracidium and parasitic mother sporocyst stage also have been noted, especially for several “egg proteins”. For example, transcripts for SME 16 (calcium binding protein), ESP3-6 (S. mansoni egg secreted protein 3–6), and CP391S (S. japonicum egg protein) are exclusively produced by miracidia, whereas S. japonicum egg protein CP391B transcripts are highly expressed only in the sporocyst stages. One assumes that such tightly-regulated, stage-specific expression at high steady-state levels is associated with larval functions that are critical to normal growth and development. However, slow progress in the development of tools for manipulating specific gene expression in intact worms has impeded research efforts aimed at addressing important functional genomics questions. Currently RNA interference (RNAi) methods being applied to S. mansoni mammalian (Skelly et al., 2003; Correnti et al., 2005; Sayed et al., 2006) and snail (Boyle et al., 2003; Dinguirard and Yoshino, 2006) stages represent the most promising approach to date for gene manipulation in these parasites, although advances in schistosome transgenic technology recently have been reported (Grevelding, 2006; Kines et al., 2006; Brindley and Pearce, 2007) showing potential for application to functional gene studies.
One of the main uses of SAGE will undoubtedly be to assign potential function to genes encoding proteins of unknown function and to discover novel genes. For example, Table 5 has a partial list of SAGE tags showing highly AF_MS-specific expression, with most of these genes being completely silent in AF_SS, male and juvenile worms. Many of these SAGE tags originate from transcripts with moderate to high levels of expression, but their sequences and/or protein products have not been previously identified. Several of these SAGE tags mapped to ESTs that had significant similarity to predicted proteins of unknown function in S. japonicum. Although the precise role of proteins encoded in these transcripts remains unknown, we now have a list of genes likely to play key roles in female schistosome biology that can be investigated in situ hybridization, RNA silencing, and two-hybrid technologies in future studies.
SAGE data will provide clues as to how different stages accomplish routine biochemical functions across different stages and in different host environments. For example, profiling lactate dehydrogenase (Fig. 4) supports the idea that parasites in the mammalian host use lactic acid fermentation more extensively than do parasites in their invertebrate host; lactate dehydrogenase tags are significantly higher in mammalian lifecycle stages than in snail stages. Other glycolytic enzymes profiled show a generally constitutive expression pattern. However, role of oxygen in adult metabolism is less well defined. While it has been reported that no increase in lactate production is seen in worms incubated under anaerobic conditions (Bueding, 1950), other studies indicate that oxygen may be essential, especially if worms are to maintain high egg production levels, and that adult worms possess a functional tricarboxcylic acid cycle and respiratory chain (Coles, 1972). Profiling SAGE tags for the tricarboxcylic acid enzyme, succinate dehydrogenase, and the terminal oxidase beta subunit clearly indicate that the expression of genes encoding enzymes of oxidative respiration is equal or higher in mammalian-stage parasites than in snail-stage parasites (Fig. 4) suggesting that aerobic energy production is significant in adult worms in the mammalian host.
Fig. 4.
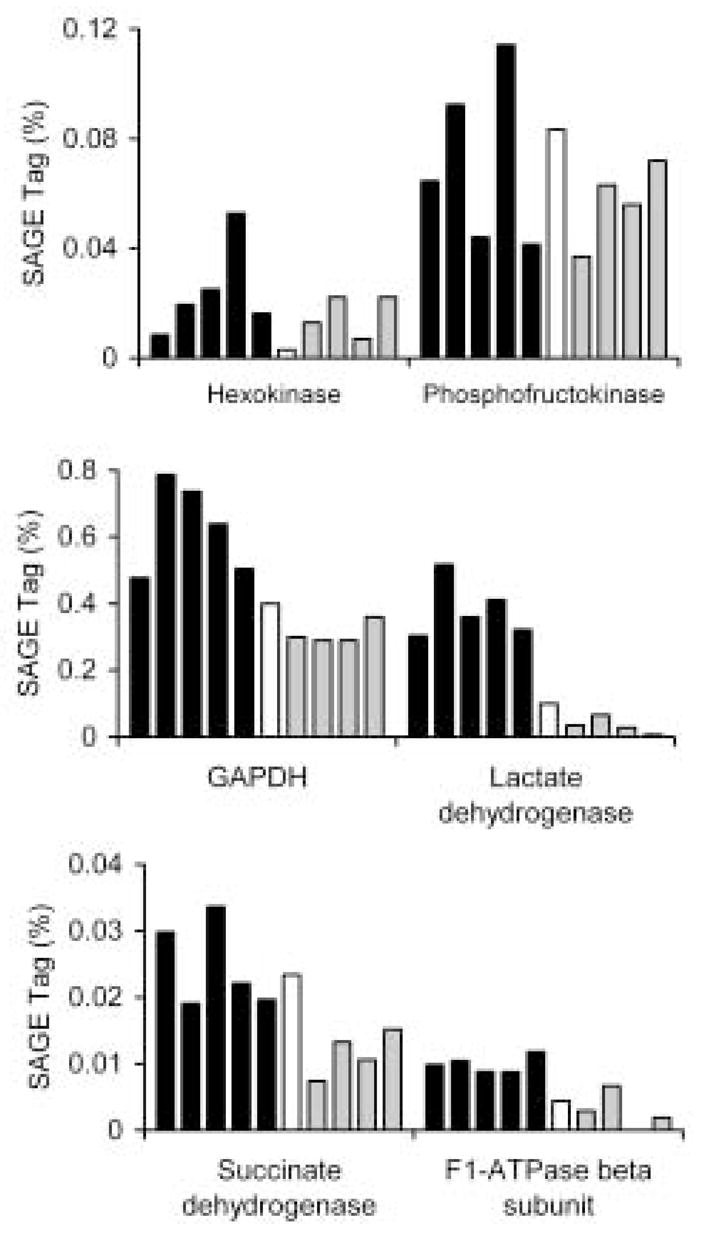
SAGE profiling energy metabolism during S. mansoni development. Stage-specific SAGE-tag libraries are shown as indicated in Figure 2. GAPDH, glyceraldehyde 3-phosphate dehydrogenase.
Redox biology is an important biochemical process in all aerobic organisms. Schistosomes are thought to be especially sensitive to oxidative stress and antioxidant enzymes have been shown to play important roles in the host-parasite interaction (LoVerde, 1998; Sayed et al., 2006). Figure 5 illustrates the tag expression patterns for a number of antioxidant enzymes. Although we cannot comment on the expression of antioxidants during the entire developmental cycle, a number of interesting points can be made. Peroxiredoxins appear to be the main hydrogen peroxide-reducing activity in the parasite (Sayed et al., 2006). Cytoplasmic peroxiredoxin 2 and mitochondrial peroxiredoxin 3 appear to be constitutively expressed in the stages profiled. However, the most abundant form in adult worms, peroxiredoxin 1, has a highly specific expression, being nearly absent in liver worms and sporocysts. In addition, although peroxiredoxin 1 expression appears to be negligible in 6-day cultured sporocysts by SAGE analysis, recent quantitative PCR studies have shown a temporal expression pattern for sporocyst peroxiredoxin 1 and 2, in which larval steady-state transcript levels increase at 2–3 days in culture, after which time transcript levels begin to fall off (Vermeire et al., in revision). Moreover, sporocyst peroxiredoxin gene expression is stimulated by exogenous H2O2 treatment, suggesting that gene expression may be regulated by H2O2-responsive elements. Also of note, although peroxiredoxin 1 has been shown to be present in schistosome eggs (Williams et al., 2001) no peroxiredoxin 1 tags were present in the miracidial library. This suggests that the expression of peroxiredoxin 1, and perhaps other secreted egg proteins, occurs in extra-miracidial tissues within the egg (Williams et al., 2001) and conforms to the pattern of peroxiredoxin expression recently seen in S. japonicum (Kumagai et al., 2006). Glutathione peroxidase is another hydrogen peroxide-reducing enzyme in the parasite. Although both glutathione peroxidase 1 and 2 appear to be generally constitutively expressed, sexually mature females and miracidia have significantly elevated levels of glutathione peroxidase 1. Sexually mature females also have very high levels of the secretory form of superoxide dismutase; the bar for adult female worms from mixed sex infections does not accurately indicate the SAGE tag percent, which is 0.71%, or 20 times the level found in adult male worms from mixed sex infections. Although egg-producing females may be under significant oxidative stress due to egg production, not all redox enzymes are elevated in these worms.
Fig. 5.
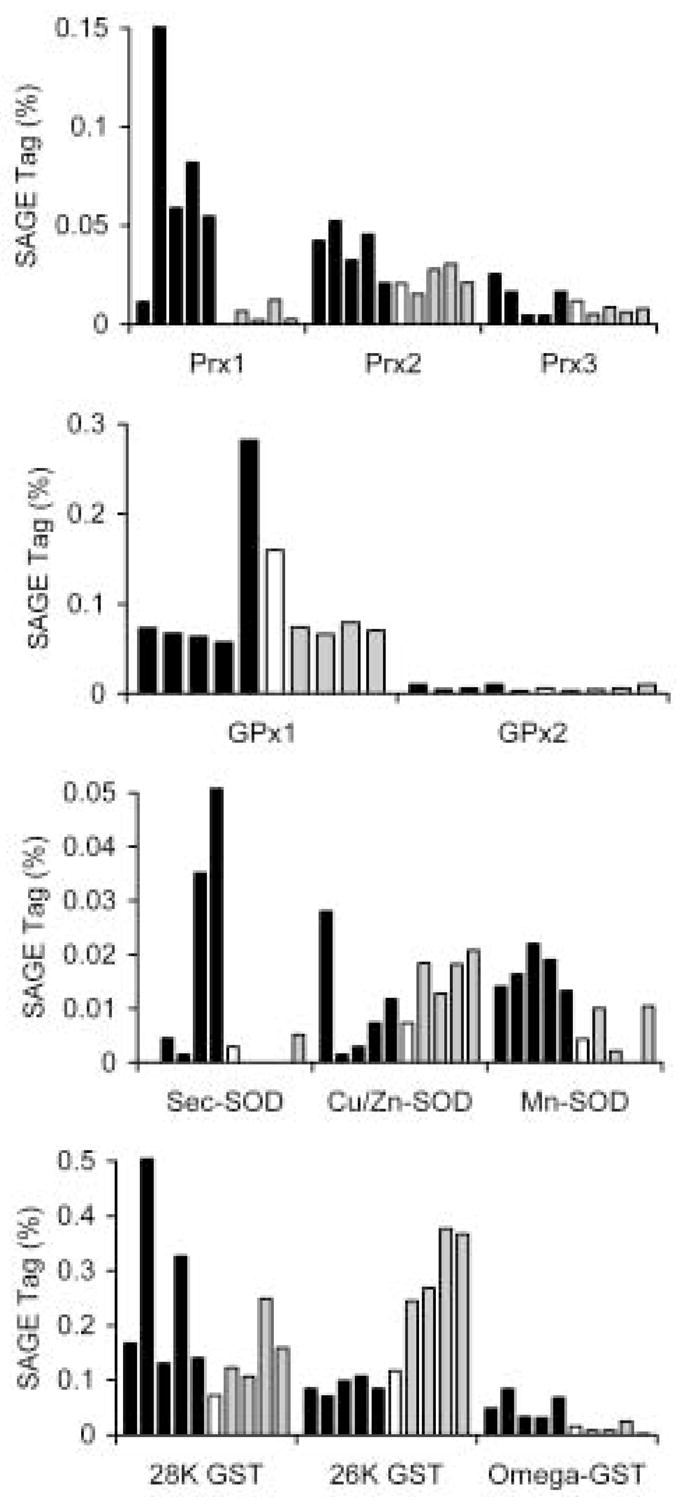
SAGE profiling redox enzymes during S. mansoni development. Stage-specific SAGE-tag libraries are shown as indicated in Figure 2. Abbreviations used: Prx, peroxiredoxin; GPx, glutathione peroxidase; SOD, superoxide dismutase; Sec-SOD, secretory SOD; GST, glutathione S-transferase. The bar for adult female worms from mixed sex infections does not accurately indicate the SAGE tag percent, which is 0.71%, or 20 times the level found in adult male worms from mixed sex infections.
Another, general pattern that emerges from profiling antioxidant enzymes is the unusual finding that sets of genes appear to be coordinately expressed in the mammalian compared to molluscan stages of the lifecycle. This expression pattern is shown in broad strokes in Figure 1, with significant numbers of genes following a sporocyst-specific expression pattern or a mammalian stage-specific expression pattern. In Figure 5, the expression of the Cu/Zn-superoxide dismutase and 26 kDa glutathione S-transferase are similar and increased during the early larval stages of development, while Mn-superoxide dismutase and omega-glutathione S-transferase are coordinated and increased during the juvenile and adult stages of the lifecycle. We also have evidence for a fourth, snail-stage specific peroxiredoxin, whose expression essentially mirrors that of peroxiredoxin 1 (unpublished). Whether enzymes are selectively expressed because of differential activity in the homeothermic vs. the poikilothermic host remains to be determined.
4. Summary and future prospects
In this report we present a preliminary analysis of SAGE profiling the S. mansoni lifecycle. We have shown that SAGE is sensitive and that tag frequency accurately reflects the expression pattern of a variety of genes. We are able to monitor the expression of genes involved in development and have identified of a number of novel transcripts differentially expressed in sexually mature female parasites including a novel tetraspanin. We present results showing the utility of SAGE to profile house-keeping functions and biochemical pathways of interest. However, a significant number of goals remain to be accomplished. Many SAGE tags identify transcripts with unknown function. These may be truly new, previously uncharacterized transcripts/proteins or they are transcripts with short or no ORFs. Many tags did not map to any transcript, those identified as UK tags. This analysis only included PS tags, a fraction of the total number of tags. Assignment of identity of the UK tags will require coordination with genome annotation and prediction of all ORFs in the S. mansoni genome. We have begun to construct tag libraries to profile the transition from cercariae to lung stage parasites as well as the egg. Completion and analysis of these libraries will allow for rapid profiling of gene expression during the entire lifecycle of S. mansoni.
Supplementary Material
Supplemental Fig. S1. Illustration of SAGE protocol using NlaIII as the anchoring enzyme and MmeI as the tagging enzyme (LongSAGE). In this diagram, MmeI cleaves downstream from its recognition site (TCCRAC), creating a 21 bp tag that includes the NlaIII recognition site (CATG) and 17 bp of 3′-adjacent sequence after removal of the linker by NlaIII digestion.
Supplemental Fig. S2. Gene ontology (GO) assignment. Gene ontology of all proteins (assigned from PS SAGE tags R > 0) [closed bars], differentially expressed mammalian-stage proteins (assigned from PS tags R > 4) [gray bars], and differentially expressed snail-stage proteins (assigned from PS tags R > 4) [open bars] are plotted against the percentage of the protein distribution in each of the GO categories.
Acknowledgments
Supported by NIH/NIAID grant R21AI062845-01 (DLW) and R01AI061436-02 (TPY). Schistosome life stages used in this research were supplied in part by the National Institute of Allergy and Infectious Diseases (NIAID) Schistosomiasis Resource Center at the Biomedical Research Institute (Rockville, Maryland, United States) through NIAID Contract NO1-AI-30026. AGM, SRB, JB, ARP and MJC were additionally supported by the Marine Biological Laboratory’s Program in Global Infectious Diseases, funded by the Ellison Medical Foundation. Computational resources were provided by the Josephine Bay Paul Center for Comparative Molecular Biology and Evolution (Marine Biological Laboratory) through funds provided by the W.M. Keck Foundation and the G. Unger Vetlesen Foundation. We would like to thank Dr. Detlef Groth, Max Planck Institute for Molecular Genetics, Berlin, for his help with the GO analysis.
Abbreviations
- SAGE
serial analysis of gene expression
- Bge
Biomphalaria glabrata embryonic cells
- SA_LIVER
sub-adult liver parasites
- AM_SS
adult male from single sex infections
- AF_SS
adult female worms from single sex infections
- AM_MS
adult male worms from mixed sex infections
- AF_MS
adult female worms from mixed sex infections
- MIRA
miracidia
- 6D_S_COND
sporocysts cultured for 6 days in media pre-conditioned by Bge cells
- 6D_S_UN
sporocysts cultured for 6 days in media without additions
- 20D_S_COND
sporocysts cultured for 20 days in media pre-conditioned by Bge cells
- 20D_S_UN
sporocysts cultured for 20 days in media without additions
- PS SAGE tags
primary sense SAGE tags
- Hox
homeobox genes
- RT-PCR
semi-quantitative reverse transcription PCR
Footnotes
Publisher's Disclaimer: This is a PDF file of an unedited manuscript that has been accepted for publication. As a service to our customers we are providing this early version of the manuscript. The manuscript will undergo copyediting, typesetting, and review of the resulting proof before it is published in its final citable form. Please note that during the production process errors may be discovered which could affect the content, and all legal disclaimers that apply to the journal pertain.
References
- Boucheix C, Rubinstein E. Tetraspanins. Cellular and Molecular Life Science. 2001;58:1189–1205. doi: 10.1007/PL00000933. [DOI] [PMC free article] [PubMed] [Google Scholar]
- Boyle JP, Wu XJ, Shoemaker CB, Yoshino TP. Using RNA interference to manipulate endogenous gene expression in Schistosoma mansoni sporocysts. Molecular and Biochemical Parasitology. 2003;128:205–215. doi: 10.1016/s0166-6851(03)00078-1. [DOI] [PubMed] [Google Scholar]
- Brenner S, Johnson M, Bridgham J, Golda G, Lloyd DH, Johnson D, Luo S, McCurdy S, Foy M, Ewan M, Roth R, George D, Eletr S, Albrecht G, Vermaas E, Williams SR, Moon K, Burcham T, Pallas M, DuBridge RB, Kirchner J, Fearon K, Mao J, Corcoran K. Gene expression analysis by massively parallel signature sequencing (MPSS) on microbead arrays. Nature Biotechnology. 2000;18:630–634. doi: 10.1038/76469. [DOI] [PubMed] [Google Scholar]
- Brindley PJ, Pearce EJ. Genetic manipulation of schistosomes. International Journal for Parasitology. 2007;37:465–473. doi: 10.1016/j.ijpara.2006.12.012. [DOI] [PubMed] [Google Scholar]
- Bueding E. Carbohydrate metabolism of Schistosoma mansoni. Journal of General Physiology. 1950;33:475–495. doi: 10.1085/jgp.33.5.475. [DOI] [PMC free article] [PubMed] [Google Scholar]
- Chai M, McManus DP, McInnes R, Moertel L, Tran M, Loukas A, Jonesa MK, Gobert GN. Transcriptome profiling of lung schistosomula, in vitro cultured schistosomula and adult Schistosoma japonicum. Cellular and Molecular Life Science. 2006;63:919–929. doi: 10.1007/s00018-005-5578-1. [DOI] [PMC free article] [PubMed] [Google Scholar]
- Chen J, Lee S, Zhou G, Wang SM. High-throughput GLGI procedure for converting a large number of serial analysis of gene expression tag sequences into 3' complementary DNAs. Genes Chromosomes and Cancer. 2002a;33:252–61. doi: 10.1002/gcc.10017. [DOI] [PubMed] [Google Scholar]
- Chen J, Sun M, Lee S, Zhou G, Rowley JD, Wang SM. Identifying novel transcripts and novel genes in the human genome by using novel SAGE tags. Proceedings of the National Academy of Science USA. 2002b;99:12257–62. doi: 10.1073/pnas.192436499. [DOI] [PMC free article] [PubMed] [Google Scholar]
- Chen JJ, Rowley JD, Wang SM. Generation of longer cDNA fragments from serial analysis of gene expression tags for gene identification. Proceedings of the National Academy of Science USA. 2000;97:349–53. doi: 10.1073/pnas.97.1.349. [DOI] [PMC free article] [PubMed] [Google Scholar]
- Coles GC. Oxidative phosphorylation in Schistosoma mansoni. Nature. 1972;240:488–489. doi: 10.1038/240488a0. [DOI] [PubMed] [Google Scholar]
- Colley DG, LoVerde PT, Savioli L. Infectious disease. Medical helminthology in the 21st century. Science. 2001;293:1437–1438. doi: 10.1126/science.1060733. [DOI] [PubMed] [Google Scholar]
- Correnti JM, Brindley PJ, Pearce EJ. Long-term suppression of cathepsin B levels by RNA interference retards schistosome growth. Molecular and Biochemical Parasitology. 2005;143:209–215. doi: 10.1016/j.molbiopara.2005.06.007. [DOI] [PubMed] [Google Scholar]
- Coyne KJ, Burkholder JM, Feldman RA, Hutchins DA, Cary SC. Modified serial analysis of gene expression method for construction of gene expression profiles of microbial eukaryotic species. Applied and Environmental Microbiology. 2004;70:5298–304. doi: 10.1128/AEM.70.9.5298-5304.2004. [DOI] [PMC free article] [PubMed] [Google Scholar]
- DeMarco R, Oliveira KC, Venancio TM, Verjovski-Almeida S. Gender biased differential alternative splicing patterns of the transcriptional cofactor CA150 gene in Schistosoma mansoni. Molecular and Biochemical Parasitology. 2006;150:123–131. doi: 10.1016/j.molbiopara.2006.07.002. [DOI] [PubMed] [Google Scholar]
- Dinguirard N, Yoshino TP. Potential role of a CD36-like class B scavenger receptor in the binding of modified low-density lipoprotein (acLDL) to the tegumental surface of Schistosoma mansoni sporocysts. Molecular and Biochemical Parasitology. 2006;146:219–230. doi: 10.1016/j.molbiopara.2005.12.010. [DOI] [PubMed] [Google Scholar]
- Ebersberger I, Knobloch J, Kunz W. Cracks in the shell--zooming in on eggshell formation in the human parasite Schistosoma mansoni. Development Genes and Evolution. 2005;215:261–267. doi: 10.1007/s00427-005-0467-z. [DOI] [PubMed] [Google Scholar]
- Eisen MB, Spellman PT, Brown PO, Botstein D. Cluster analysis and display of genome-wide expression patterns. Proceedings of the National Academy of Science USA. 1998;95:14863–14868. doi: 10.1073/pnas.95.25.14863. [DOI] [PMC free article] [PubMed] [Google Scholar]
- Fenwick A, Savioli L, Engels D, Bergquist RN, Todd MH. Drugs for the control of parasitic diseases: current status and development in schistosomiasis. Trends in Parasitology. 2003;19:509–515. doi: 10.1016/j.pt.2003.09.005. [DOI] [PubMed] [Google Scholar]
- Fitzpatrick JM, Johansen MV, Johnston DA, Dunne DW, Hoffmann KF. Gender-associated gene expression in two related strains of Schistosoma japonicum. Molecular and Biochemical Parasitology. 2004;136:191–209. doi: 10.1016/j.molbiopara.2004.03.014. [DOI] [PubMed] [Google Scholar]
- Fitzpatrick JM, Johnston DA, Williams GW, Williams DJ, Freeman TC, Dunne DW, Hoffmann KF. An oligonucleotide microarray for transcriptome analysis of Schistosoma mansoni and its application/use to investigate gender-associated gene expression. Molecular and Biochemical Parasitology. 2005;141:1–13. doi: 10.1016/j.molbiopara.2005.01.007. [DOI] [PubMed] [Google Scholar]
- Fitzpatrick JM, Hoffmann KF. Dioecious Schistosoma mansoni express divergent gene repertoires regulated by pairing. International Journal of Parasitology. 2006;36:1081–1089. doi: 10.1016/j.ijpara.2006.06.007. [DOI] [PubMed] [Google Scholar]
- Fitzpatrick JM, Hirai Y, Hirai H, Hoffmann KF. Schistosome egg production is dependent upon the activities of two developmentally regulated tyrosinases. FASEB Journal. 2006 Dec 13; doi: 10.1096/fj.06-7314com. Epub ahead of print. [DOI] [PubMed] [Google Scholar]
- Gobert GN, McInnes R, Moertel L, Nelson C, Jones MK, Hu W, McManus DP. Transcriptomics tool for the human Schistosoma blood flukes using microarray gene expression profiling. Experimental Parasitology. 2006;114:160–172. doi: 10.1016/j.exppara.2006.03.003. [DOI] [PubMed] [Google Scholar]
- Grevelding CG. Transgenic flatworms. In: Maule AG, Marks NJ, editors. Parasitic flatworms – Molecular biology, biochemistry, immunology and physiology. CABI International; Oxfordshire UK and Cambridge, MA: 2006. pp. 149–173. [Google Scholar]
- Groth D, Lehrach H, Hennig S. GOblet: a platform for Gene Ontology annotation of anonymous sequence data. Nucleic Acids Research. 2004;32:W313–317. doi: 10.1093/nar/gkh406. [DOI] [PMC free article] [PubMed] [Google Scholar]
- Hoffmann KF. An historical and genomic view of schistosome conjugal biology with emphasis on sex-specific gene expression. Parasitology. 2004;128(Suppl):S11–22. doi: 10.1017/S0031182004006213. [DOI] [PubMed] [Google Scholar]
- Hotez PJ, Molyneux DH, Fenwick A, Ottesen E, Ehrlich Sachs S, Sachs JD. Incorporating a Rapid-Impact Package for Neglected Tropical Diseases with Programs for HIV/AIDS, Tuberculosis, and Malaria: A comprehensive pro-poor health policy and strategy for the developing world. PLoS Medicine. 2006;3:e102. doi: 10.1371/journal.pmed.0030102. [DOI] [PMC free article] [PubMed] [Google Scholar]
- Jiang H, Kang DC, Alexandre D, Fisher PB. RaSH, a rapid subtraction hybridization approach for identifying and cloning differentially expressed genes. Proceedings of the National Academy Science USA. 2000;97:12684–12689. doi: 10.1073/pnas.220431297. [DOI] [PMC free article] [PubMed] [Google Scholar]
- Jiang H, Lin JJ, Su ZZ, Goldstein NI, Fisher PB. Subtraction hybridization identifies a novel melanoma differentiation associated gene, mda-7, modulated during human melanoma differentiation, growth and progression. Oncogene. 1995;11:2477–2486. [PubMed] [Google Scholar]
- Kines KJ, Mann VH, Morales ME, Shelby BD, Kalinna BH, Gobert GN, Chirgwin SR, Brindley PJ. Transduction of Schistosoma mansoni by vesicular stomatitis virus glycoprotein-pseudotyped Moloney murine leukemia retrovirus. Experimental Parasitology. 2006;112:209–220. doi: 10.1016/j.exppara.2006.02.003. [DOI] [PubMed] [Google Scholar]
- King CH, Dickman K, Tisch DJ. Reassessment of the cost of chronic helmintic infection: a meta-analysis of disability-related outcomes in endemic schistosomiasis. Lancet. 2005;365:1561–1569. doi: 10.1016/S0140-6736(05)66457-4. [DOI] [PubMed] [Google Scholar]
- Kumagai T, Osada Y, Kanazawa T. 2-Cys peroxiredoxins from Schistosoma japonicum: the expression profile and localization in the life cycle. Molecular and Biochemical Parasitology. 2006;149:135–143. doi: 10.1016/j.molbiopara.2006.05.004. [DOI] [PubMed] [Google Scholar]
- Kunz W. Schistosome male-female interaction: induction of germ-cell differentiation. Trends in Parasitology. 2001;17:227–231. doi: 10.1016/s1471-4922(01)01893-1. [DOI] [PubMed] [Google Scholar]
- Liang P, Averboukh L, Keyomarsi K, Sager R, Pardee AB. Differential display and cloning of messenger RNAs from human breast cancer versus mammary epithelial cells. Cancer Research. 1992;52:6966–6968. [PubMed] [Google Scholar]
- Liang P, Pardee AB. Differential display of eukaryotic messenger RNA by means of the polymerase chain reaction. Science. 1992;257:967–971. doi: 10.1126/science.1354393. [DOI] [PubMed] [Google Scholar]
- McGinnis W, Krumlauf R. Homeobox genes and axial patterning. Cell. 1992;68:283–302. doi: 10.1016/0092-8674(92)90471-n. [DOI] [PubMed] [Google Scholar]
- Lewis F. Schistosomiasis. In: Coligan JE, Kruisbeek AM, Margulies DH, Shevach EM, Strober W, editors. Current Protocols in Immunology. Suppl. Vol. 28. John Wiley & Sons Inc; New York: 1998. pp. 19.1.1–19.1.28. [Google Scholar]
- LoVerde PT. Do antioxidants play a role in schistosome host-parasite interactions? Parasitology Today. 1998;14:284–289. doi: 10.1016/s0169-4758(98)01261-7. [DOI] [PubMed] [Google Scholar]
- Messerli SM, Morgan W, Birkeland SR, Bernier J, Cipriano MJ, McArthur AG, Greenberg RM. Nitric oxide-dependent changes in Schistosoma mansoni gene expression. Molecular and Biochemical Parasitology. 2006;150:367–370. doi: 10.1016/j.molbiopara.2006.08.003. [DOI] [PMC free article] [PubMed] [Google Scholar]
- Moertel L, McManus DP, Piva TJ, Young L, McInnes RL, Gobert GN. Oligonucleotide microarray analysis of strain- and gender-associated gene expression in the human blood fluke, Schistosoma japonicum. Molecular and Cellular Probes. 2006;20:280–289. doi: 10.1016/j.mcp.2006.02.002. [DOI] [PubMed] [Google Scholar]
- Oger F, Bertin B, Caby S, Dalia-Cornette J, Adams M, Vicogne J, Capron M, Pierce RJ. Molecular cloning and characterization of Schistosoma mansoni Ftz-F1 interacting protein-1 (SmFIP-1), a novel corepressor of the nuclear receptor SmFtz-F1. Molecular and Biochemical Parasitology. 2006;148:10–23. doi: 10.1016/j.molbiopara.2006.02.016. [DOI] [PubMed] [Google Scholar]
- Patankar S, Munasinghe A, Shoaibi A, Cummings LM, Wirth DF. Serial analysis of gene expression in Plasmodium falciparum reveals the global expression profile of erythrocytic stages and the presence of anti-sense transcripts in the malarial parasite. Molecular Biology of the Cell. 2001;12:3114–3125. doi: 10.1091/mbc.12.10.3114. [DOI] [PMC free article] [PubMed] [Google Scholar]
- Pearce EJ. Progress towards a vaccine for schistosomiasis. Acta Tropica. 2003;86:309–313. doi: 10.1016/s0001-706x(03)00062-7. [DOI] [PubMed] [Google Scholar]
- Pearce EJ, MacDonald AS. The immunobiology of schistosomiasis. Nature Review Immunology. 2002;2:499–511. doi: 10.1038/nri843. [DOI] [PubMed] [Google Scholar]
- Pierce RJ, Wu W, Hirai H, Ivens A, Murphy LD, Noel C, Johnston DA, Artiguenave F, Adams M, Cornette J, Viscogliosi E, Capron M, Balavoine G. Evidence for a dispersed Hox gene cluster in the platyhelminth parasite Schistosoma mansoni. Molecular Biology and Evolution. 2005;22:2491–2503. doi: 10.1093/molbev/msi239. [DOI] [PubMed] [Google Scholar]
- Radke JR, Behnke MS, Mackey AJ, Radke JB, Roos DS, White MW. The transcriptome of Toxoplasma gondii. BMC Biology. 2005;3:26. doi: 10.1186/1741-7007-3-26. [DOI] [PMC free article] [PubMed] [Google Scholar]
- Reis MG, Kuhns J, Blanton R, Davis AH. Localization and pattern of expression of a female specific mRNA in Schistosoma mansoni. Molecular and Biochemical Parasitology. 1989;15:113–119. doi: 10.1016/0166-6851(89)90062-5. [DOI] [PubMed] [Google Scholar]
- Sayed AA, Cook SK, Williams DL. Redox balance mechanisms in Schistosoma mansoni rely on peroxiredoxins and albumin and implicate peroxiredoxins as novel drug targets. Journal of Biological Chemistry. 2006;281:17001–17010. doi: 10.1074/jbc.M512601200. [DOI] [PubMed] [Google Scholar]
- Skelly PJ, Da’dara A, Harn DA. Suppression of cathepsin B expression in Schistosoma mansoni by RNA interference. International Journal for Parasitology. 2003;33:363–369. doi: 10.1016/s0020-7519(03)00030-4. [DOI] [PubMed] [Google Scholar]
- Smyth D, McManus DP, Smout MJ, Laha T, Zhang W, Loukas A. Isolation of cDNAs encoding secreted and transmembrane proteins from Schistosoma mansoni by a signal sequence trap method. Infection and Immunity. 2003;71:2548–2554. doi: 10.1128/IAI.71.5.2548-2554.2003. [DOI] [PMC free article] [PubMed] [Google Scholar]
- Stekel DJ, Git Y, Falciani F. The comparison of gene expression from multiple cDNA libraries. Genome Research. 2000;10:2055–2061. doi: 10.1101/gr.gr-1325rr. [DOI] [PMC free article] [PubMed] [Google Scholar]
- Tran MH, Pearson MS, Bethony JM, Smyth DJ, Jones MK, Duke M, Don TA, McManus DP, Correa-Oliveira R, Loukas A. Tetraspanins on the surface of Schistosoma mansoni are protective antigens against schistosomiasis. Nature Medicine. 2006;12:835–840. doi: 10.1038/nm1430. [DOI] [PubMed] [Google Scholar]
- van der Werf MJ, de Vlas SJ, Brooker S, Looman CW, Nagelkerke NJ, Habbema JD, Engels D. Quantification of clinical morbidity associated with schistosome infection in sub-Saharan Africa. Acta Tropica. 2003;86:125–139. doi: 10.1016/s0001-706x(03)00029-9. [DOI] [PubMed] [Google Scholar]
- Velculescu VE, Zhang L, Vogelstein B, Kinzler KW. Serial analysis of gene expression. Science. 1995;270:484–487. doi: 10.1126/science.270.5235.484. [DOI] [PubMed] [Google Scholar]
- Velculescu VE, Zhang L, Zhou W, Vogelstein J, Basrai MA, Bassett DE, Jr, Hieter P, Vogelstein B, Kinzler KW. Characterization of the yeast transcriptome. Cell. 1997;88:243–251. doi: 10.1016/s0092-8674(00)81845-0. [DOI] [PubMed] [Google Scholar]
- Velculescu VE, Vogelstein B, Kinzler KW. Analysing uncharted transcriptomes with SAGE. Trends in Genetics. 2000;16:423–5. doi: 10.1016/s0168-9525(00)02114-4. [DOI] [PubMed] [Google Scholar]
- Verjovski-Almeida S, DeMarco R, Martins EA, Guimaraes PE, Ojopi EP, Paquola AC, Piazza JP, Nishiyama MY, Jr, Kitajima JP, Adamson RE, Ashton PD, Bonaldo MF, Coulson PS, Dillon GP, Farias LP, Gregorio SP, Ho PL, Leite RA, Malaquias LC, Marques RC, Miyasato PA, Nascimento AL, Ohlweiler FP, Reis EM, Ribeiro MA, Sa RG, Stukart GC, Soares MB, Gargioni C, Kawano T, Rodrigues V, Madeira AM, Wilson RA, Menck CF, Setubal JC, Leite LC, Dias-Neto E. Transcriptome analysis of the acoelomate human parasite Schistosoma mansoni. Nature Genetics. 2003;35:148–157. doi: 10.1038/ng1237. [DOI] [PubMed] [Google Scholar]
- Vermeire JJ, Taft AS, Hoffmann KF, Fitzpatrick JM, Yoshino TP. Schistosoma mansoni: DNA microarray gene expression profiling during the miracidium-to-mother sporocyst transformation. Molecular and Biochemical Parasitology. 2006;147:39–47. doi: 10.1016/j.molbiopara.2006.01.006. [DOI] [PubMed] [Google Scholar]
- Vermeire JJ, Yoshino TP. Antioxidant gene expression and function in in vitro-developing Schistosoma mansoni mother sporocysts: possible role in self-protection. Parasitology. 2007 doi: 10.1017/S0031182007002697. in press. [DOI] [PubMed] [Google Scholar]
- Williams DL, Asahi H, Botkin DJ, Stadecker MJ. Schistosome infection stimulates host CD4(+) T helper cell and B-cell responses against a novel egg antigen, thioredoxin peroxidase. Infection and Immunity. 2001;69:1134–1141. doi: 10.1128/IAI.69.2.1134-1141.2001. [DOI] [PMC free article] [PubMed] [Google Scholar]
- Wilson RA, Ashton PD, Braschi S, Dillon GP, Berriman M, Ivens A. ‘Oming in on schistosomes: prospects and limitations for post-genomics. Trends in Parasitology. 2007;23:14–20. doi: 10.1016/j.pt.2006.10.002. [DOI] [PubMed] [Google Scholar]
- Yoshino TP, Laursen JR. Production of Schistosoma mansoni daughter sporocysts from mother sporocysts maintained in synxenic culture with Biomphalaria glabrata embryonic (Bge) cells. Journal of Parasitology. 1995;81:714–722. [PubMed] [Google Scholar]
Associated Data
This section collects any data citations, data availability statements, or supplementary materials included in this article.
Supplementary Materials
Supplemental Fig. S1. Illustration of SAGE protocol using NlaIII as the anchoring enzyme and MmeI as the tagging enzyme (LongSAGE). In this diagram, MmeI cleaves downstream from its recognition site (TCCRAC), creating a 21 bp tag that includes the NlaIII recognition site (CATG) and 17 bp of 3′-adjacent sequence after removal of the linker by NlaIII digestion.
Supplemental Fig. S2. Gene ontology (GO) assignment. Gene ontology of all proteins (assigned from PS SAGE tags R > 0) [closed bars], differentially expressed mammalian-stage proteins (assigned from PS tags R > 4) [gray bars], and differentially expressed snail-stage proteins (assigned from PS tags R > 4) [open bars] are plotted against the percentage of the protein distribution in each of the GO categories.