Abstract
Recent investigations showed that most maize genes are present in compositional fractions of nuclear DNA that cover only a 1–2% GC (molar fraction of guanosine plus cytosine in DNA) range and represent only 10–20% of the genome. These fractions, which correspond to compositional genome compartments that are distributed on all chromosomes, were collectively called the “gene space.” Outside the gene space, the maize genome appears to contain no genes, except for some zein genes and for ribosomal genes. Here, we investigated the distribution of genes in the genomes of two other Gramineae, rice and barley, and used a new set of probes to study further the gene distribution of maize. We found that the distribution of genes in these three genomes is basically similar in that all genes, except for ribosomal genes and some storage protein genes, were located in gene spaces that (i) cover GC ranges of 0.8%, 1.0%, and 1.6% and represent 12%, 17%, and 24% of the genomes of barley, maize, and rice, respectively; (ii) are due to a remarkably uniform base composition in the sequences surrounding the genes, which are now known to consist mainly of transposons; (iii) have sizes approximately proportional to genome sizes, suggesting that expansion–contraction phenomena proceed in parallel in the gene space and in the gene-empty regions of the genome; and (iv) only hybridize on the gene spaces (and not on the other DNA fractions) of other Gramineae.
Keywords: chromosomes, isochores, plants
Previous investigations on angiosperms showed that their nuclear genomes are characterized by a compositional compartmentalization (1, 2) and that their nuclear genes may be contained in compositional compartments that cover only a narrow GC (molar fraction of guanosine plus cytosine in DNA) range (3). Recent work on the distribution of genes in the nuclear genome of maize (4) showed that the 20 probes used localized genes in compositional compartments (collectively called the gene space) that covered a 1–2% GC range and represented 10–20% of total nuclear DNA. Some zein genes detected by the zein probe used and ribosomal genes were, however, located in compartments lower and higher in GC, respectively, compared with all other protein-encoding genes tested. The gene distribution of the maize genome is very different from that found in the human genome. Indeed, the latter, which has a comparable haploid size and a similar compositional distribution of DNA molecules and coding sequences, has its genes distributed over its entire 30% GC range, although in a remarkably nonuniform way, most genes being located in the GC-rich regions of the genomes (5–7).
A question raised by the existence of the gene space of the maize genome is whether this particular gene distribution is shared by other plants of the family Gramineae (or Poaceae) and by other angiosperms. Here, we report results obtained for rice (from the Oryza group of the subfamily Bambooideae) and for barley (from the Triticum group of the subfamily Pooideae) and show that they are similar to those found in maize (from the Zea group of the subfamily Panicoideae). These results show, therefore, that gene spaces characterized by a remarkably uniform base composition exist in the genomes of all subfamilies of Gramineae. Moreover, the gene space of one Gramineae cross-hybridizes only with the DNA fractions corresponding to the gene spaces of other Gramineae and not with other fractions, a result which could be explained by the greater divergence of repeated vs. single copy sequences (8–10). These observations open the way to the in situ localization of the gene space on the chromosomes of Gramineae. In addition, gene enriched DNA fractions corresponding to the gene space can be prepared and used for cloning, mapping, and sequencing.
MATERIALS AND METHODS
Plants and DNA Preparations.
Maize cv. F7 × F2 and wheat cv. Cidéral were from the Institut National de la Recherche Agronomique, Versailles, France, and barley cv. Alexis, irrigated rice cv. Cigalon, and pluvial rice cv. Erat104 were from the Centre de Coopération International en Recherche Agronomique pour le Développement, Montpellier, France. Nuclear DNA was prepared from etiolated seedlings according to ref. 11. The sizes of DNA molecules were estimated by pulse field gel electrophoresis (PFGE) to be comprised between 50 and 100 kb.
DNA Fractionation and Gene Localization.
The nuclear DNAs of the four Gramineae were fractionated by preparative centrifugation in Cs2SO4 density gradients in the presence of 3,6-bis (acetatomercurimethyl)-1,4-dioxane (BAMD) as described (12). DNA fractions (usually 12–13) were then dialyzed, digested with EcoRI (Boehringer Mannheim), submitted to electrophoresis in 0.8% agarose gels, transferred to Hybond N+ filters (Amersham), hybridized with probes that were radioactively labeled (13) by use of a random priming kit (Amersham), and purified with use of microspin S-200 HR columns (Pharmacia). The intensities of the hybridization signals were quantitated with use of the software of Wayne Raband (National Institutes of Health, Bethesda) to assess the distribution of sequences probed in the DNA fractions. As in previous work (1–4), proportional loading of DNA fractions on the gels was used (see legend of Fig. 1). Although the principle of proportional loading is well established, in practice there may be errors associated with estimating DNA amounts in fractions. These errors were minimized, however, by using large initial DNA samples (500 μg) and by checking the amounts of DNA loaded on the gels. GC levels of DNA fractions were determined by analytical centrifugation in CsCl gradients.
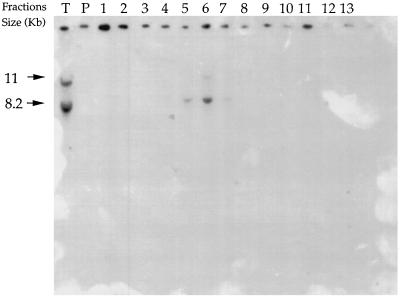
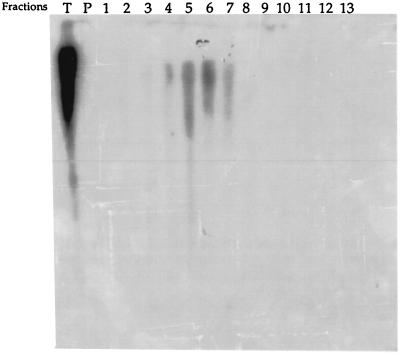
Figure 1.
Localization of sequences homologous to the BCD855 probe on the EcoRI digests of total DNA (lane T) and of Cs2SO4/BAMD fractions from barley. Aliquots of fractions proportional to their representation in 20 μg total DNA were loaded on the gel. Arrows indicate the hybridization bands. The signals on the top of the figure correspond to a nonspecific adsorption of labeled DNA on the pencil marks indicating the wells.
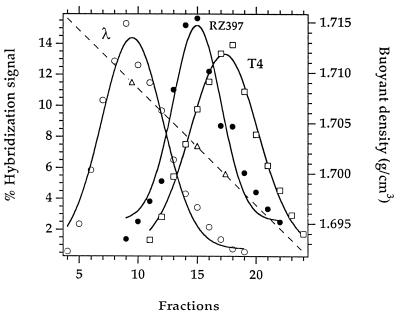
A more precise and much faster determination of the buoyant density of DNA fragments carrying the genes probed was achieved by a different procedure (14), in which nuclear DNA and two buoyant density markers (the DNAs of phages λ and T4) are centrifuged to equilibrium in a vertical rotor using very shallow CsCl density gradients. CsCl fractions were then transferred to positively charged nylon membranes, with use of a dot blot apparatus (Schleicher & Schuell), and probed as described (13). An advantage of this approach is that proportional loading of the fractions is obtained automatically by collecting equal-volume fractions; a disadvantage is the fact that fractions are too small to lend themselves to further investigations (such as analytical CsCl ultracentrifugation).
Probes.
The maize probes used were cDNAs and expressed sequence tags obtained from D. de Vienne (Station de Genetique Vegetale, Gif-sur-Yvette, France) and T. Musket (University of Missouri, Columbia, MO). The rice and barley probes were cDNAs obtained from S. MacCouch (Cornell University, Ithaca, NY). In the case of barley, two hybridizations were done with maize probes. Many of the cDNAs and expressed sequence tags used in this work corresponded to unknown sequences. Probes were prepared either by PCR amplification with use of M13 universal and reverse primers (Pharmacia), or by plasmid digestion with appropriate restriction enzymes and purification by electroelution. Heterologous hybridizations of the Cs2SO4/BAMD fractions corresponding to the gene space of some Gramineae were carried out on DNA fractions of other Gramineae as just described.
Determination of the Gene Space Size.
The gene space size was calculated as the percentage of the surface delimited by the analytical CsCl profile of total DNA that encompassed the modal buoyant densities of the DNA fractions hybridizing the gene probes. In estimating the gene space size, one should be careful about the following points. (i) The CsCl profiles should be close to those expected for DNA molecules of infinite molecular weight at zero DNA concentration. This situation is approached by determining the CsCl profiles on DNA having molecular weights in the 50–100 kb range and concentrations of 2 μg/ml. Deviations from these ideal conditions will spread the profile and lead to an underestimate of the size of the gene space. (ii) The probes used to determine the buoyant densities of DNA molecules carrying the genes may miss genes located on molecules having buoyant densities near the boundaries of the gene spaces simply because these genes located at the tails of the distribution may be absent in the small probe samples used. This will also lead to underestimating the gene space. This problem may, however, be overcome by cross-hybridization experiments involving fractions corresponding to the gene space (see Discussion). (iii) DNA molecules carrying no genes, like the vast majority of those located outside compartments of the gene space, may also occupy the same GC range as the gene space and overlap with it. This leads to an overestimate of the gene space size, compensating errors arising from i and ii. Although further work will certainly improve the present estimates of gene spaces, it appears that they are sufficiently accurate for the conclusions drawn here to be correct.
RESULTS
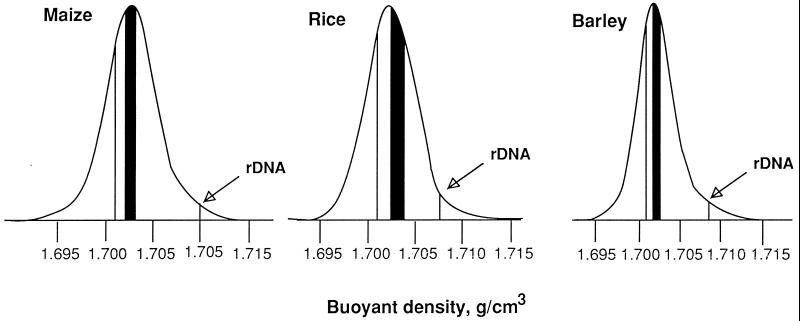
Maize probes, listed in Table 1, produced hybridization signals (Fig. 1), which were highest in two consecutive Cs2SO4/BAMD fractions showing buoyant densities (ρ) in analytical CsCl gradients of 1.7019 and 1.7035 g/cm3 (or 1.7019 and 1.7043 g/cm3 in a different experiment), respectively (see Table 2). The buoyant density determination of the DNA fragments carrying the sequences of interest by the shallow CsCl procedure (14) revealed (see Fig. 2 for an example) a narrower range of values, 1.7020–1.7030 g/cm3 (see Table 2), which corresponds to 1% GC. This narrower range, compared with the previous estimate of 1–2% (see ref. 4), is explained by the fact that the shallow CsCl approach has a higher resolving power compared with the Cs2SO4/BAMD fractionation simply because of the higher number of fractions collected. If one takes into account this range and the location of the gene space in the CsCl profile of maize DNA (Fig. 3), the gene space of maize can be estimated as approximately 17% of the genome (the previous estimate was 10–20%; see ref. 4).
Table 1.
List of the probes used
| Plant | Probe | Plant | Probe |
|---|---|---|---|
| Maize | Kinase | Rice | RZ630 |
| RNP1 | RZ403 | ||
| ATP1 | RZ143 | ||
| CSU32* | RZ166 | ||
| Clx1 | RZ14 | ||
| CSU134* | RZ900† | ||
| Eno1 | RZ323† | ||
| Grx1 | |||
| Rubisco | Barley | ANT1 (Maize) | |
| CSU11* | SPS (Maize) | ||
| CSU140* | BCD134 | ||
| NDME | BCD98 | ||
| CSU59* | BCD147 | ||
| Lhcb | BCD386 | ||
| CSU138* | BCD135 | ||
| FGS | BCD1421 | ||
| CSU71* | BCD454 | ||
| BCD926 | |||
| Rice | RZ583 | BCD828 | |
| RZ261† | BCD855 | ||
| RZ500† | BCD348 | ||
| RZ329† | BCD811 | ||
| RZ740 | BCD808 | ||
| RZ242 | |||
| RZ397 | |||
Kinase, protein kinase; RNP1, chloroplast binding protein; ATP1, ATPase; Clx1, calenexin; Eno1, enolase1; Grx1, Glutaredoxin; Rubisco, ribulose-1.5-biphosphate carboxylase; NDME, NADP-dependent malic enzyme; Lhcb, light-harvesting complex b; FGS, ferredoxin-dependent glutamate synthase; ANT1, adenine nucleotide translocator; SPS, sucrose phosphate synthase.
Unidentified ESTs.
In the case of rice, probes were used not only on irrigated rice, but also on pluvial rice.
Table 2.
Localization of maize probes in DNA fractions from Cs2SO4/BAMD and from CsCl density gradients
| Probes* | Cs2SO4/BAMD
|
CsCl†
|
||
|---|---|---|---|---|
| Fraction | ρ, g/cm3 | Hybr., % | ρ, g/cm3 | |
| CSU30 | 5‡ | 1.7019 | 100 | 1.7020 |
| CSU134 | 4‡ | 1.7013 | 25 | 1.7022 |
| 5‡ | 1.7019 | 75 | ||
| Rubisco | 5‡ | 1.7019 | 30 | 1.7030 |
| 6‡ | 1.7043 | 70 | ||
| CSU11 | 4§ | 1.7019 | 75 | 1.7020 |
| 5§ | 1.7021 | 25 | ||
| CSU140 | 5§ | 1.7021 | 55 | 1.7030 |
| 6§ | 1.7035 | 45 | ||
| FGS | 5§ | 1.7021 | 45 | 1.7027 |
| 6§ | 1.7035 | 55 | ||
Hybr., relative hybridization intensities.
See the Table 1 legend for probe abbreviations.
Experiments carried out using the shallow CdCl gradient approach (14).
§Two different Cs2SO4/BAMD fractionations were used; the analytical CsCl buoyant densities fractionally coincided for fractions 5, but were different for fraction 6.
Figure 2.
Distribution in a shallow CsCl gradient (14) of nuclear DNA from rice carrying sequences homologous to probe RZ397 (•) and of density markers, the DNA from bacteriophages, λ (○) and T4 (□). The intensities of hybridization signals (left-hand scale) are plotted against the number of fractions collected from the gradient (lower scale). The buoyant density of each fraction (right-hand scale) is represented by a diagonal dashed line in which open triangles correspond to the peak of each DNA.
Figure 3.
CsCl profiles of the DNAs from maize, rice, and barley, as obtained by analytical centrifugation of high molecular weight DNA (50–100 kb) in a CsCl density gradient. The gene spaces are indicated by the solid areas. The compartments containing zein genes in the maize genome reach buoyant densities as low as 1.7010 g/cm3 (vertical line). Almost all the probes tested on DNA fractions from barley and rice were localized in the gene space. RZ166 and BCD348 were, however, localized in fractions having buoyant densities of 1.7010 and 1.7012 g/cm3 (vertical lines), respectively, in the DNAs of rice and barley. The arrows indicate the localization of ribosomal genes.
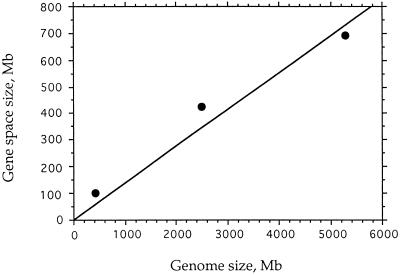
The results obtained for barley and rice genes were basically similar to those just mentioned for maize, yet the following significant differences were found. In rice (both irrigated and pluvial), the gene space covered a range of buoyant densities from 1.7024 to 1.7040 g/cm3, i.e., with bounds that were 0.4–1 mg/cm3 higher than those of maize. In barley, the gene space covered a range from 1.7017 to 1.7025 g/cm3, with bounds that were 0.3–0.4 mg/cm3 lower than those of maize. The buoyant density ranges correspond to 1.6% and 0.8% GC for rice and barley, respectively. These values indicate that the gene spaces of these plants represent approximately 24% and 12% of the genomes for rice and barley (see Fig. 3 and Table 3). Moreover, the sizes of gene spaces are approximately proportional to genome sizes (Fig. 4).
Table 3.
The gene spaces of Gramineae
| Plant | Compositional range
|
Relative amount in genome, % | Size,* Mb | |
|---|---|---|---|---|
| ρ, g/cm3 | GC, % | |||
| Maize | 1.7020–1.7030 | 1 | 17 | 425 |
| Rice | 1.7024–1.7040 | 1.6 | 24 | 100 |
| Barley | 1.7017–1.7025 | 0.8 | 12 | 690 |
Standard errors on buoyant density values are ±0.0002.
The sizes of the gene spaces were calculated by multiplying their relative amounts by the genome sizes (as obtained from ref. 15): 2,500 Mb for maize, 415 Mb for rice, and 5,300 Mb for barley.
Figure 4.
Plot of gene space size vs. genome size for rice, maize, and barley (from the data of Table 3).
When the DNA fractions corresponding to the gene space of rice were hybridized on the Cs2SO4/BAMD fractions of barley, the highest hybridization intensities were observed on fractions 5 and 6, which correspond to the gene space of barley (Fig. 5). Likewise, the cross-hybridizations of the gene space of maize on DNA fractions from rice and barley took place on the gene spaces of these genomes (data not shown).
Figure 5.
Hybridization of labeled gene space fractions from rice on compositional fractions from barley. Other indications are as in Fig. 3.
DISCUSSION
The results just described deserve several comments. (i) The gene space of maize (neglecting those zein genes that are located in GC-poorer DNA fractions) was independently estimated in previous work (4) and here. In the first case, 20 gene probes were chosen at random; these probes covered almost the whole GC3 (average GC level of third codon positions of genes) range of maize genes, corresponded to functionally different proteins, and were located on different chromosomes (as judged from the data of ref. 16). Using the Cs2SO4/BAMD approach, we estimated that the gene space corresponded to 10–20% of the genome (4). A different experimental approach allowing a higher resolution (14) and a new set of 18 genes, also chosen at random, that cover the whole GC3 range and are located on different chromosomes now leads to an estimate of the gene space of maize as 17% of the genome. It is worth noting that the higher resolution, due to the larger number of fractions that can be collected with this more recent method, leads to a more accurate, and narrower, estimate of the gene distribution than was previously possible (this is illustrated by the data of Table 2) and that the 38 probes used actually allowed a larger number of genes, at least 100, to be tested because of the hybridization of the probes on several members of multigene families.
(ii) The estimates of the gene spaces of other Gramineae investigated were based on the hybridization of cDNAs and expressed sequence tags, most of which corresponded to unknown genes. However, the genes tested were again chosen at random, and their numbers were higher than those of the probes. As in the case of maize, the gene space corresponded almost to the peak of the CsCl profile of total DNA. However, a few genes occupied fractions lower in density than the gene space. Indeed, two rice ((RZ166 and RZ403) and two barley (BCD348 and BCD808) probes localized genes in fractions that were poorer in GC than those corresponding to the gene space (see legend of Fig. 3). These sequences are assumed to code for seed storage proteins on the basis of the finding that all genes for seed storage protein genes tested so far, namely the zein genes from maize, the α and β gliadin genes from wheat, and the hordein genes from barley, were previously found to be localized in GC-poorer fractions compared with other protein-encoding genes (3, 4).
The small differences in buoyant densities shown by the gene spaces of different genomes may be due to slight compositional differences in the gene spaces themselves, as well as to differences in methylation levels. Indeed, methylation of DNA molecules decreases their buoyant densities by 0.7 g/cm3 per 1% of 5-methylcytosine (17–19), and fractions corresponding to the gene spaces of some of the Gramineae studied here are characterized by different levels of 5-methylcytosine (20, 21).
(iii) As already stressed in the Introduction, the distribution of maize genes (as well as of the other two Gramineae investigated here) is very different from those of mammalian genes. In a typical mammal, such as humans, coding sequences are distributed over the whole 30% GC range of the genome, and compositional correlations are found between coding and flanking sequences, GC-rich coding sequences being present in GC-rich genome regions and vice versa (5–7). In contrast, in the case of maize, genes having GC levels of 45–75% in their coding sequences and GC3 values of 25%–100% fit in a gene space covering only a 1% GC range. This indicates a remarkably uniform base composition in 100- to 200-kb regions (namely in regions about twice the size of the DNA molecules) surrounding genes, or gene clusters, and implies the lack of any positive compositional correlation between coding and flanking sequences in the same species. Results obtained for genes from Gramineae (refs. 2 and 3) confirm this lack of correlation. Along the same line, the Gpa1 and Gpc 1 genes of maize, which are GC-rich (62% and 54%, respectively), are surrounded (22, 23) by GC-poor sequences, which have a GC level of about 42%, namely the GC level of the gene space. Because maize retrotransposons (see refs. 24 and 25 for reviews), such as Mu, Ac, and Cin 4, are located within the gene space of maize (4, 26) and Because maize retrotransposons belonging to different families account for more than 60% of the 280-kb Adh1-F region, which is reported to be representative of the maize genome (see the following paragraph), these mobile elements are likely to be very largely responsible for the common, narrow GC range of the compositional compartments forming the gene space.
(iv) The sizes of the gene spaces of the three Gramineae investigated are approximately proportional to the corresponding genome sizes (see Table 3 and Fig. 4). If one considers that, apart from polyploidization phenomena, genome size essentially varies because noncoding sequences expand or contract, this finding suggests that expansion–contraction phenomena affected to comparable extents the gene-empty regions of the genomes and those corresponding to the gene space, indicating a similar behavior of the intergenic regions, whether in gene-dense or in gene-empty compartments of the genomes. This conclusion fits with the report (26) that the retrotransposons that account for more than 60% of the Adh1-F region also account for at least 50% of the nuclear DNA of maize.
(v) The interspecific hybridizations of the gene space of maize on DNA fractions from rice or barley or of the gene space of rice on barley DNA fractions are in keeping with the notion that repeated sequences from different Gramineae do not show homology (9) and that single-copy sequences in the rice genomes are still closely related to those in wheat and barley (10). The cross-hybridization of gene spaces from Gramineae are, however, very important in another respect. Indeed, these DNA fractions, which comprise many thousands of genes, provide an independent definition of the gene space which adds to, and strongly reinforces, that obtained with individual gene probes.
Finally, the present findings provide an independent line of evidence in favor of the concept of a single basic genome for Gramineae (28–32). Also, the finding that wheat genes occur in clusters along chromosomes (33) is in agreement with the observations concerning the gene space. As far as plant genome projects are concerned, they could take advantage of the possibility of cloning, mapping, and sequencing gene spaces that represent only 12–24% of the corresponding genomes. Moreover, the heterologous hybridizations of gene spaces should allow the identification of the chromosomal location of the genome compartments corresponding to the gene space by in situ hybridization of the gene space of one Gramineae on the chromosomes of another Gramineae.
Acknowledgments
We thank D. de Vienne, S. Santoni (Gif-sur-Yvette, France), and T. Musket (Columbia, MO) for the gift of the maize probes and S. MacCouch (Ithaca, NY) for the barley, wheat, and rice probes. We also thank our colleagues O. Clay and G. Matassi for critical reading of this paper. This research was supported, in part, by a fellowship from United Nations Educational, Scientific, and Cultural Organization/Third World Academy of Sciences to A.B.
ABBREVIATIONS
- BAMD
3,6-bis(acetatomercurimethyl)-1,4-dioxane
- GC
molar fraction of guanosine plus cytosine in DNA
- GC3
average GC level of third codon positions of genes
References
- 1.Salinas J, Matassi G, Montero L M, Bernardi G. Nucleic Acids Res. 1988;19:5561–5567. [Google Scholar]
- 2.Matassi G, Montero L M, Salinas J, Bernardi G. Nucleic Acids Res. 1989;17:5273–5290. doi: 10.1093/nar/17.13.5273. [DOI] [PMC free article] [PubMed] [Google Scholar]
- 3.Montero L M, Matassi G, Bernardi G. Nucleic Acids Res. 1990;18:1859–1867. doi: 10.1093/nar/18.7.1859. [DOI] [PMC free article] [PubMed] [Google Scholar]
- 4.Carels N, Barakat A, Bernardi G. Proc Natl Acad Sci USA. 1995;92:11057–11060. doi: 10.1073/pnas.92.24.11057. [DOI] [PMC free article] [PubMed] [Google Scholar]
- 5.Mouchiroud D, D’Onofrio G, Aissani B, Macaya G, Gautier C, Bernardi G. Gene. 1990;100:181–187. doi: 10.1016/0378-1119(91)90364-h. [DOI] [PubMed] [Google Scholar]
- 6.Bernardi G. Annu Rev Genet. 1995;29:445–476. doi: 10.1146/annurev.ge.29.120195.002305. [DOI] [PubMed] [Google Scholar]
- 7.Zoubak S, Clay O, Bernardi G. Gene. 1996;174:95–102. doi: 10.1016/0378-1119(96)00393-9. [DOI] [PubMed] [Google Scholar]
- 8.Benedik A J, McCarthy B J. Genetics. 1970;65:545–565. doi: 10.1093/genetics/65.4.545. [DOI] [PMC free article] [PubMed] [Google Scholar]
- 9.Smith D B, Flavell R B. Biochem Genet. 1974;12:243–256. doi: 10.1007/BF00486093. [DOI] [PubMed] [Google Scholar]
- 10.Moore G, Abbo S, Cheug W, Foote T, Gale M, Koebner L, Leitch A, Leitch I, Money T, Stancombe P, Yano M, Flavell R. Genomics. 1993;15:472–482. doi: 10.1006/geno.1993.1097. [DOI] [PubMed] [Google Scholar]
- 11.Jofuku K D, Goldberg R B. In: Plant Molecular Biology: A Practical Approach. Shaw C H, editor. Oxford: IRL; 1988. pp. 37–66. [Google Scholar]
- 12.Cortadas J, Macaya G, Bernardi G. Eur J Biochem. 1977;76:13–19. doi: 10.1111/j.1432-1033.1977.tb11565.x. [DOI] [PubMed] [Google Scholar]
- 13.Church G M, Gilbert W. Proc Natl Acad Sci USA. 1984;81:1991–1995. doi: 10.1073/pnas.81.7.1991. [DOI] [PMC free article] [PubMed] [Google Scholar]
- 14.De Sario A, Geigl E, Bernardi G. Nucleic Acids Res. 1995;23:4013–4014. doi: 10.1093/nar/23.19.4013. [DOI] [PMC free article] [PubMed] [Google Scholar]
- 15.Shields R. Nature (London) 1993;365:297–298. [Google Scholar]
- 16.Chao S, Baysdorfer C, Herdia-Dias O, Musket T, Xu G, Coe E H., Jr Theor Appl Genet. 1994;88:717–721. doi: 10.1007/BF01253975. [DOI] [PubMed] [Google Scholar]
- 17.Kirk J T O. J Mol Biol. 1967;28:171–172. doi: 10.1016/s0022-2836(67)80087-1. [DOI] [PubMed] [Google Scholar]
- 18.Kemp J D, Sutton D W. Biochim Biophys Acta. 1976;425:148–156. doi: 10.1016/0005-2787(76)90020-4. [DOI] [PubMed] [Google Scholar]
- 19.Wagner I, Capesius I. Biochim Biophys Acta. 1981;654:52–56. doi: 10.1016/0005-2787(81)90135-0. [DOI] [PubMed] [Google Scholar]
- 20.Matassi G, Melis R, Kuo K C, Macaya G, Gehrke C W, Bernardi G. Gene. 1992;122:239–245. doi: 10.1016/0378-1119(92)90211-7. [DOI] [PubMed] [Google Scholar]
- 21.Montero L M, Filipski J, Gil, Capel J, Martinez-Zapater J M, Salinas J. Nucleic Acids Res. 1992;20:3207–3210. doi: 10.1093/nar/20.12.3207. [DOI] [PMC free article] [PubMed] [Google Scholar]
- 22.Quigley F, Brinkmann H, Martin W F, Cerff R. J Mol Evol. 1989;29:412–421. doi: 10.1007/BF02602911. [DOI] [PubMed] [Google Scholar]
- 23.Martinez P, Martin W, Cerff R. J Mol Biol. 1989;208:551–565. doi: 10.1016/0022-2836(89)90147-2. [DOI] [PubMed] [Google Scholar]
- 24.Wessler S R, Bureau T E, White S E. Curr Opin Genet Dev. 1995;5:814–821. doi: 10.1016/0959-437x(95)80016-x. [DOI] [PubMed] [Google Scholar]
- 25.Voytas D F. Science. 1996;274:737–738. doi: 10.1126/science.274.5288.737. [DOI] [PubMed] [Google Scholar]
- 26.SanMiguel P, Tikhonov A, Jin Y, Moutchoulskaia N, Zakharov D, Melake-Berhan A, Springer P S, Edwards K J, Lee M, Avramova Z, Bennetzen J L. Science. 1996;274:765–768. doi: 10.1126/science.274.5288.765. [DOI] [PubMed] [Google Scholar]
- 27.Capel J, Montero L M, Martinez-Zapater J M, Salinas J. Nucleic Acids Res. 1993;21:2369–2373. doi: 10.1093/nar/21.10.2369. [DOI] [PMC free article] [PubMed] [Google Scholar]
- 28.Kurata N, Moore G, Nagamura Y, Foote T, Yano M, Minobe Y, Gale M. Bio/Technology. 1994;12:276–278. [Google Scholar]
- 29.Bennetzen J L, Freeling M. Trends Genet. 1993;9:259–261. doi: 10.1016/0168-9525(93)90001-x. [DOI] [PubMed] [Google Scholar]
- 30.Moore G, Devos K M, Wang Z, Gale M D. Curr Biol. 1995;5:737–739. doi: 10.1016/s0960-9822(95)00148-5. [DOI] [PubMed] [Google Scholar]
- 31.Moore G. Curr Opin Genet Dev. 1995;5:717–724. doi: 10.1016/0959-437x(95)80003-n. [DOI] [PubMed] [Google Scholar]
- 32.Moore G, Foote T, Helentjaris T, Devos K, Kurata N, Gale M. Trends Genet. 1995;11:81–82. doi: 10.1016/S0168-9525(00)89005-8. [DOI] [PubMed] [Google Scholar]
- 33.Gill K S, Gill B S, Endo T R. Chromosoma. 1993;102:374–381. [Google Scholar]


