

Abstract
Pro-inflammatory cytokines play a key role in various forms of metabolic bone diseases, including osteopenia and osteoporosis. Human MG-63 cells treated with IL-1α were used as a model system to identify potential marker genes that are differentially expressed. This study is designed to quantitate gene expression of actively translated mRNAs as compared to the steady-state mRNA population. Both steady-state mRNAs and actively translated mRNAs from control MG-63 cells and MG-63 cells treated with IL-1α were isolated and converted to cDNA. The gene expression analysis from these samples was then quantitated with an open expression analysis platform with no requirement for a priori knowledge of sequence information. As a result, many differentially regulated genes were discovered via IL-1α treatment. Some of the genes have been described previously as playing important roles in the regulation of inflammation and cell adhesion. These comparisons provided a panoramic overview of gene expression at both the total transcript and post-transcriptional levels. In addition, the quantitation of actively translated mRNAs associated with polysomes also provided a better estimation of protein expression levels. This methodology allows for the identification of genes acutely regulated during translation. Furthermore, the process may aid in the identification of new drug targets or biomarkers.
INTRODUCTION
It is well known that pro-inflammatory cytokines play a critical role in the development of bone-related diseases. One example is that children with inflammatory bowel disease are at risk of osteopenia. The cause of osteopenia is, at least in part, due to the overproduction of cytokines (1). Cytokines such as IL-1 also affect bone metabolism in response to fatty acids (2). Bone modeling/remodeling depends on close coordinated cellular activities that are controlled by interactions with growth factors and the extracellular matrix (ECM) (3). In fact, studies have shown that IL-1 regulates the expression of some of the growth factors, such as FGF-2 (4). During the past few decades, research into bone biology has used model systems, such as human osteoblast-like cells, derived from a variety of sources. One of the commonly used cell lines is human osteosarcoma MG-63 cells (5–7). However, currently there is no study to systematically analyze the marker genes in osteoblast-like cells such as MG-63 treated with cytokines.
Current methods for quantitative measurement of gene expression, such as chip-based array methods and real-time quantitative PCR (RT–QPCR) analysis, have mainly focused on measuring total cellular mRNA levels (8–10). Total mRNA levels in a cell are predictive of the expression levels of many proteins. However, for others the steady-state mRNA expression level does not accurately reflect the expression rate of the proteins (11). Post-transcriptional regulation of gene expression occurs by several mechanisms, including pre-mRNA splicing, mRNA transport, mRNA stability, translational regulation and post-translational regulation. It has been established that translational regulation plays a critical role in many biological processes, such as in cell cycle progression under normal and stress conditions (12,13). The central concept of translational regulation is that gene expression may be controlled by the efficiency of translation of a given mRNA in the absence of a corresponding change in the steady-state level of that mRNA (14). Translational regulation provides the cell with a more precise, immediate and energy-efficient way of controlling expression of a given protein. Translational regulation can induce rapid changes in protein synthesis without the need for transcriptional activation and subsequent mRNA processing steps. In addition, translational control also has the advantage of being readily reversible, providing the cell with great flexibility in responding to various cytotoxic stresses. Therefore, it is essential to know not just the levels of individual mRNAs, but also to what extent they are being translated into the corresponding proteins. The simultaneous monitoring of steady-state cellular mRNA levels and the translation state of all mRNAs provides not only a unique way to quantitate gene expression level, but also provides a more complete description of gene expression and their regulation. In addition, analysis of translationally active mRNAs is only one step away from direct quantitative protein analyses using mass spectrometry and two-dimensional gel electrophoresis analysis, but it provides considerable advantages over these approaches in terms of cost, simplicity, sensitivity and throughput. DNA chips have been used to study polysome-associated mRNA expression (15,16); however, the gene coverage is often limited (11). Therefore, there is a lack of direct, high-throughput open platform methods to identify genes that are potentially translationally regulated.
mRNAs that are being actively translated usually have multiple ribosomes associated with them, forming rather large complexes known as polysomes. Translationally inactive mRNAs are sequestered in messenger ribonucleoprotein (mRNP) particles or associated with a single ribosome (monosome). This fact allows for the separation of actively translated mRNAs from non-translated mRNAs. In one embodiment polysomes can be separated from mRNPs and monosomes by sucrose gradient centrifugation, which allows distinction between well-translated and under-translated mRNAs. Translational regulation is controlled by different cis-acting and trans-acting elements. In most cases, the cis-acting elements are located in the 5′-UTRs and 3′-UTRs of the mRNA and sometimes even in the protein coding region of the mRNA (reviewed in 17). The trans-acting elements involved in translational regulation are RNA-binding proteins serving as either positive or negative regulators of translation (11). In particular, identification of RNA-binding proteins involved in translational regulation might provide an alternative strategy for drug target discovery and therapeutic intervention in human diseases (18).
To take full advantage of the polysomal isolation method, it is necessary to combine it with an open, high throughput quantitative mRNA analysis detection platform that simultaneously measures and identifies every existing mRNA species. In this study, both actively translated mRNAs and steady-state mRNA were isolated and then used to prepare samples for analysis by GeneCalling, an open, high throughput mRNA expression analysis technology (19). This is the first time that an open platform expression technology has been used for the simultaneous measurement of steady-state and translated mRNA levels. This technology can serve as a discovery tool to find post-transcriptionally and translationally regulated genes during a variety of treatments or conditions.
As a model system, we have used serum starved human osteosarcoma MG-63 cells exposed to the inflammation cytokine IL-1α and control MG-63 cells not subjected to any growth factor to investigate the comprehensive gene expression. This experimental system was chosen for the following reasons: (i) IL-1α is a pro-inflammatory cytokine known to exert biological effects on osteoblast cells; (ii) several genes have been shown to be translationally regulated in human T cells in response to IL-1α (20); (iii) MG-63 is a human osteosarcoma cell line, which can be differentiated into osteoblast-like cells or adipocytes by various treatments; (iv) osteoblasts may participate in inflammatory events leading to the loss of bone mass. Thus, the response of MG-63 cells to IL-1α should reveal mechanisms, at the levels of transcriptional and post-transcriptional regulation, by which osteoblasts recruit lymphocytes, promote inflammation and regulate hematopoiesis.
MATERIALS AND METHODS
Cell culture
Human osteosarcoma MG-63 cells were maintained in MEM containing 10% fetal bovine serum (FBS) at 37°C and 5% CO2. Aliquots of 3 × 10⁶ MG-63 cells per T175 flask were serum starved in MEM medium containing 0.1% FBS for 24 h and then treated with 10 ng/ml IL-1α for 6 h. Rabbit polyclonal antibody against calcium-modulating cyclophilin ligand (CAML) was provided by Dr Richard J. Bram (Department of Pediatrics and Immunology, Mayo Clinic, Rochester, MN). Mouse anti-β-actin monoclonal antibody was purchased from Santa Cruz Biotechnology (Santa Cruz, CA). Mouse monoclonal antibody against proteinphosphatase 2A (PP-2A) was purchased from Upstate Biotechnology Inc. (Lake Placid, NY). Cycloheximide was purchased from ICN. IL-1α was purchased from R&D Systems (Minneapolis, MN).
Polyribosome analysis
For preparation of cytoplasmic extracts, cells from three 175 cm2 tissue culture plates (30% confluency) were treated with 100 µg/ml cycloheximide (Sigma, St Louis, MO) for 5 min at 37°C, washed with ice-cold phosphate-buffered saline containing cycloheximide (100 µg/ml) and harvested by trypsinization (21). Cells and homogenates were also snap frozen in liquid nitrogen after cycloheximide treatment and harvesting. The fresh cells were pelleted by centrifugation, swollen for 2 min in 375 µl of low salt buffer (LSB) (20 mM Tris pH 7.5, 10 mM NaCl and 3 mM MgCl2) containing 1 mM dithiothreitol and 50 U recombinant RNasin (Promega, WI) and lysed by addition of 125 µl of lysis buffer (1× LSB containing 0.2 M sucrose and 1.2% Triton X-100) (Sigma) followed by vortexing. The nuclei were pelleted by centrifugation in a microcentrifuge at 13 000 r.p.m. for 2 min. The supernatant (cytoplasmic extract) was transferred to a new 1.5 ml tube on ice. Cytoplasmic extracts were carefully layered over 0.5–1.5 M linear sucrose gradients (in LSB) and centrifuged at 45 000 r.p.m. in a Beckman SW40 rotor for 90 min at 4°C. Gradients were fractionated using a pipette and the absorbance at 260 nm was measured for each fraction by UV spectrometry.
cDNA synthesis
The polysomal fractions from each sample were pooled together and the RNAs from each sample were isolated using Trizol Reagent (Invitrogen, CA) and reverse transcribed to cDNA using oligo(dT) primer and SuperScript II reverse transcriptase (Invitrogen, CA) using the protocol provided by the manufacturer for cDNA synthesis.
GeneCalling analysis
Quantitative expression analysis (QEA) and GeneCalling analysis were performed essentially as previously outlined (19). These experiments were performed in triplicate with each experiment also having triplicate samples. Furthermore, the GeneCalling chemistry was repeated three times for each sample. The average expression level for a given gene fragment was compared. The level of sensitivity of these experiments was 1.5- to 2-fold with P = 0.01. Briefly, double-stranded cDNAs were synthesized from poly(A)+ RNA isolated from steady-state mRNA and polysome mRNA (Fig. 1). The cDNAs were then subdivided into 53 identical pools with 50 pg cDNA in each well. Each pool was digested with a distinct pair of restriction enzymes. The resulting fragments were ligated to complementary adapters, one labeled with biotin and the other labeled with fluorescein (FAM), and amplified by PCR. After affinity purification on streptavidin columns, the fragments were loaded onto a MegaBase 1000 96 capillary electrophoresis instrument (MegaBase, Amersham) and separated. PCR fragments separated by size were quantitated by measuring the fluorescence intensity of the 5′-end FAM label on the PCR products. The digestion profile from the MG-63 control and MG-63 cells treated with IL-1α were compared to identify differentially expressed gene fragments. All fragment traces were performed in triplicate. The electrophoresis profiles were processed using a Java-based, Internet-ready software suite, GeneScape. Linkage of a differentially expressed cDNA fragment to a gene was made through knowledge of the restriction enzymes used to generate the two asymmetric ends and the length of the fragment itself.
Figure 1.

Schematic diagram of polysomal sample preparation and quantitative expression analysis (GeneCalling). Details are described briefly in Materials and Methods (20).
Gene confirmation via oligodeoxynucleotide poisoning
To confirm the restriction fragments for a particular gene, an unlabeled oligodeoxynucleotide designed to correspond to one end of the restriction fragment was added in excess to the original reaction and was re-amplified for an additional 15 cycles (19). This reaction was then electrophoresed and compared to a control reaction re-amplified without the unlabeled oligodeoxynucleotide to evaluate the selective diminution of the peak of interest.
Western immunoblot analysis
MG-63 cells were harvested and processed as described (3). Equal amounts of protein (100 µg) from MG-63 cells were resolved by SDS–PAGE on 12.5% gels by the method of Laemmli (22). Proteins were probed with rabbit anti-CAML polyclonal antibody (1:4000 dilution), mouse anti-β-actin monoclonal antibody (1:5000 dilution) and mouse anti-PP-2A antibody (1:1000 dilution), followed by incubation with a horseradish peroxidase-conjugated secondary antibody (1:1000 dilution) (Bio-Rad, CA). Proteins were visualized with a chemiluminescence detection system using the Super Signal substrate (Pierce, IL).
Real-time RT–QPCR analysis
Real-time RT–QPCR analysis was performed on the experimental mRNAs to confirm the results obtained by the GeneCalling analysis. The PCR primers and probes (Synthegen LLC, Houston, TX) for PP-2A, CAML and GAPDH were as follows: PP2A-Fprimer, 5′-GTCAAGAG CCTCTGCGAGAA-3′; PP2A-Fprobe, FAM-5′-TTACCGT GAACGCATCACCATTCTT-3′-TAMRA; PP2A-Rprimer, 5′- GGGGAACTTCTTGTAGGCGAT-3′; CAML-Fprimer, 5′-AGCTGCTCATGAACTCGGAA-3′; CAML-Fprobe, FAM-5′-CCCTCAGCGTTCCTTCCGTTT-3′-TAMRA; CAML-Rprimer, 5′-CACCCTGCTGGTCAGTTGTT-3′; GAPDH-Fprimer, 5′-AAAGTGGATATTGTTGCCATCA-3′; GAPDH-Probe, FAM-5′-CCCCTTCATTGACCTCAACTACATGG-3′-TAMRA; GAPDH-Rprimer, 5′-GGTGGAATCATATTGG AACATG-3′.
RT–QPCR was performed on an ABI 7900HT instrument under the following conditions: 48°C, 30 min of reverse transcription; 95°C, 10 min; 95°C, 15 s; 60°C, 1 min. The reaction was performed for up to 40 cycles.
RESULTS AND DISCUSSION
In this study, we used human osteosarcoma cell line MG-63 as a model system to study gene regulation after pro-inflammatory cytokine IL-1α treatment. Systematic study of gene regulation using this model may provide new biological understanding of the relationship between inflammatory response and bone diseases such as osteopenia. It is known that children with inflammatory bowel disease are at risk of developing osteopenia. The aggressive inflammatory response present in the gut during inflammatory bowel disease produces many pro-inflammatory cytokines (2), which might further lead to inhibition of normal mineralization, thereby contributing to osteopenia.
An open platform gene expression technology (GeneCalling) was applied to analyze gene expression profiles from steady-state mRNAs and polysome-associated mRNAs in serum starved MG-63 cells and MG-63 cells induced with the cytokine IL-1α. The cDNA samples were then analyzed using the GeneCalling technology described in Figure 1. To ensure reproducibility, the GeneCalling study was performed on triplicate samples for both control MG-63 cells and MG-63 cells treated with IL-1α. To achieve appropriate gene coverage, typically 50–100 different restriction enzyme pairs were used per study. The amplified sample was analyzed by capillary gel electrophoresis and each cDNA species was represented by one or multiple fragments of precisely defined size. Using a sophisticated, Web-based, database-linked bioinformatics system, GeneScape™, the relative abundance of each fragment, and thereby the mRNA it was derived from, were determined and gene identity was assigned to the fragments representing genes previously known. In addition, this analysis platform also allowed the discovery of unknown gene products through the isolation and characterization of novel gene fragments.
Polysomal mRNA was isolated from total cell mRNA by sucrose density sedimentation centrifugation on 0.5–1.5 M sucrose gradients. The optical density (OD) profile of sucrose gradients is shown in Figure 2. The sucrose gradients were loaded with either cell extracts from untreated MG-63 cells or IL-1α treated MG-63 cells. The presence of cycloheximide, a protein synthesis inhibitor, in the cell lysis buffer locks the mRNA/polyribosome complex, which facilitates polysome isolation. In each gradient the top fractions with high OD values represent rRNAs associated with the 40S, 60S and 80S subunits, along with free mRNAs. Fractions lower in the gradient, with lesser ODs, contain the polysomal fractions with actively translated mRNAs. The greater overall OD values in the treated samples were simply due to more material loaded onto the sucrose gradient. The difference in mRNA amounts will not affect the final GeneCalling results because the mRNA is converted to cDNA, the cDNA samples are then divided into equal amounts for each restriction digestion and normalized for PCR amplification and GeneCalling analysis.
Figure 2.

Polysome distribution of cellular mRNAs (n = 3). Polysomal distribution of MG-63 control cells and cells treated with IL-1α for 6 h. Absorbance profiles at 254 nm of the collected sucrose gradients are shown. Fractions 1–7 represent free mRNA and monosomes; fractions 8–13 contain the polysomes.
For expression analysis, fractions 8–13 containing polysomes were pooled and the mRNA isolated and converted to cDNA for expression analysis. The amount of cDNAs used for the GeneCalling study was normalized.
Expression analysis by GeneCalling of IL-1α-treated MG-63 cells versus untreated control samples yielded a total of 1709 differentially expressed gene fragments (out of a total of 13 672 gene fragments) for polysomal analysis using a total of 53 restriction enzyme pairs. The total mRNA samples revealed 1581 differentially expressed gene fragments (out of a total of 63 240 gene fragments) using the same 53 restriction enzyme pairs (2-fold, P < 0.01). The data represent a dramatic difference in the percentage of differentially expressed genes. For the polysomal samples 12.5% of the monitored genes were differentially expressed (cut-off 2-fold), whereas for the total mRNA samples the difference was only 2.5%. The average redundancy for gene fragments per gene is approximately 3, which means that there are nearly 569 genes differentially regulated via polysomal analysis and 527 genes differentially regulated in steady-state mRNA samples. The proportionally higher number of differentially expressed mRNAs in the polysomal pool presumably reflects the exclusion of non-translating mRNAs from this subpopulation. This is supported by studies of quiescent cells stimulated to re-enter the cell cycle, which produced a high percentage global increase in protein synthesis within the first few hours after activation (23). The increase in protein synthesis is due to the recruitment of stored mRNA to form polysomal complex. In fact, studies have shown that as much as 80% of the under-translated mRNAs were shifted in polysomes during the initial 6 h after mitogenic activation (24).
Instead of presenting the entire gene list from this study, one set of genes that regulate the cell cycle is shown in Figure 3. The differentially regulated genes identified by GeneCalling were visualized via Spotfire software (Spotfire Inc., Cambridge, MA). There were 116 cell cycle-related genes that were differentially regulated. Large percentages of genes (54%) were closely correlated at both the steady-state and actively translated polysome levels. However, nearly 39% of genes from the isolated polysome-associated mRNA fraction are regulated at the active translational stage. This portion of the differentially regulated genes would have been missed if only steady-state transcript profiling had been performed. Some of the genes discovered here are potential candidates for involvement in translational regulation. Although the steady-state mRNA levels of the remaining genes (7%) were differentially regulated, they had not transitioned to the actively translated stage during the given time frame.
Figure 3.

GeneCalling analysis of cell cycle-related genes with Spotfire software. The fold changes (P < 0.01, fold changes > 2) in the mean values (n = 3) of these genes in steady-state GeneCalling from control MG-63 cells and MG-63 cells treated with IL-1α were compared with the mean values (n = 3) of the corresponding genes in actively translated GeneCalling analysis. Both actively translated and steady-state samples were compared. Job22012, actively translated GeneCalling analysis; Job22075, steady-state mRNA GeneCalling analysis.
These genes that may be translationally regulated are the main focus of this study. Data from the two GeneCalling analyses (total cellular mRNA and polysomal mRNA) were compared using the GeneScape™ Job Array analytical program. Sets of genes (Table 1) were identified as potentially regulated at the translational level. The genes listed in Table 1 were chosen based on the significance of gene regulation (>2-fold, P < 0.01), their roles in the inflammatory response and previously known translationally regulated genes for confirmation of the technology. The fold difference in gene expression was based on the FAM-labeled PCR restriction enzyme digested fragments quantitated by fluorescence intensity. For each restriction enzyme pair in each sample set a composite trace is calculated by compiling all the individual sample replicates. The traces of the experimental set versus those of the controls are normalized via a scaling algorithm. The scaled traces are then compared on a point-by-point basis to define areas of amplitude difference that meet the minimum pre-specified threshold for a significant difference. Comparing the signature fragment peak intensity versus the control sample traces generates the fold difference.
Table 1. Translationally regulated genes in IL-1α treated MG-63 cells (partial list).
| Gene | n-fold expression | Function |
|---|---|---|
| Ribosomal S6 kinase | 22 | Cell signaling |
| Phosphatase 2A | 10 | Cell signaling |
| SIM ribosomal protein S18 | 9 | Cell signaling |
| eIF4GII | 4 | Cell signaling |
| Calcium modulating cyclophilin ligand (CAML)a,b | –4 | Cell signaling |
| Phenylalanine-tRNA synthetase | –12 | Protein synthesis |
| Translation initiation factor 4Ba | –9 | Protein synthesis |
| Translation initiation factor 4AII (eIF4A-II)a | –4 | Protein synthesis |
| Elongation factor-1βa | –2 | Protein synthesis |
| SIM ribosomal protein L8 | –4 | Protein synthesis |
| Ribosome protein S4 (RPS4X)a | –2 | Protein synthesis |
| Inhibitor of apoptosis protein 1 | 20 | Apoptosis |
| CDC42-binding protein kinase β | 16 | Cell cycle control |
| Diff6 | 9 | Cell cycle control |
| CDC7 | 5 | Cell cycle control |
| ATP synthase | –6 | Metabolism |
| Dihydrofolate reductase | –6 | Metabolism |
| Acyl-CoA oxidase | –5 | Metabolism |
| Farnesyl pyrophosphate synthetase | –4 | Metabolism |
| Ribonucleotide reductase | –4 | Metabolism |
| Macrophage inflammatory protein-2β (MIP2β)a | 7 | Inflammation |
| Tumor necrosis factor-inducible proteina | 3 | Unknown |
aThese genes were confirmed in a poisoning experiment.
bThis gene was confirmed in a western immunoblot analysis.
The differentially regulated genes in Table 1 were grouped by their cellular functions, such as translational control and protein synthesis, cell cycle control, signal transduction and metabolism. One example is ribosomal protein S4, which has been described in the literature as being translationally down-regulated on IL-α exposure (25). Among the confirmed genes, ribosomal protein S4, which was down-regulated 2-fold, is a known example of an RNA-binding protein (26). Macrophage inflammatory protein-2β was induced 7-fold by IL-α exposure and this up-regulation was regulated at the translational level. Macrophage inflammatory protein-2β is a gene involved in the inflammatory response (27). Platelet endothelial cell adhesion molecule 1 (PECAM-1), an important gene involved in cellular adhesion (28), was also induced by IL-1α treatment. It has been shown that PECAM-1 mediates leukocyte trafficking to the site of inflammation by facilitating their squeezing through the borders between endothelial cells that line post-capillary venules at that site (29). PECAM-1 could also be a critical cell adhesion molecule that mediates binding of osteoblast cells to the extracellular matrix in vivo.
Ribosomal S6 kinase is a gene that plays an important role in regulating translation by controlling the biosynthesis of translational components that make up the protein synthetic apparatus (30). Other known translational regulated genes are thymidylate synthase (31), p53 (32) and PP-2A (33). The expression of PP-2A was identical in MG-63 control cells and cells treated with IL-1α based upon the steady-state level of mRNA expression (Fig. 4A). In contrast, the PP-2A expression level was significantly up-regulated by nearly 10-fold after IL-1α exposure based upon isolated actively translated polysomal mRNAs (Fig. 4B). RT–QPCR analysis was performed on mRNA samples isolated from control MG-63 cells and MG-63 cells treated with IL-1α to confirm the GeneCalling results. The RT–QPCR results correlated well with the GeneCalling results (Fig. 5A). To further verify that the differential regulation of PP-2A expression in actively translated mRNA fractions equates to a corresponding change in protein level, western immunoblot analysis was performed on total cellular extracts from both control MG-63 cells and MG-63 cells exposed to IL-1α. The protein level of PP-2A was up-regulated by nearly 8-fold after IL-1α treatment (Fig. 5B). These results suggest that PP-2A is regulated, at least in part, at the translational level. It has been shown that in the mouse fibroblast cell line NIH 3T3, the catalytic subunit of PP-2A is subject to a potent autoregulatory mechanism that adjusts PP-2A protein to constant levels. This control is exerted at the translational level and does not involve regulation of transcription or RNA processing (34). Protein phosphatase 2A is involved in MAP kinase signal transduction pathways. It has been suggested that PP-2A plays an important role in the response to cytokines such as IL-6 during acute phase responses and inflammation (35). The data in this study also suggest that IL-1α may regulate PP-2A at the translational level as part of the signaling event in MG-63 cells.
Figure 4.

Up-regulation of human PP-2A expression by IL-1α treatment. (A) Trace replication of QEA electrophoresis output for PP-2A from total mRNA of MG-63 control cells (Set B) and cells treated with IL-1α (Set A). (B) Trace replication of QEA electrophoresis output for PP-2A from polysomal isolated mRNA of MG-63 control cells (Set B) and cells treated with IL-1α (Set A). Red line at peak position 307.6 indicates the gene fragment corresponding to PP-2A.
Figure 5.

(A) RT–QPCR analysis of PP-2A expression in MG-63 cells. The average CT values for PP-2A were first normalized against the housekeeping gene GAPDH and converted to a percentage for relative expression (n = 3). (B) Western immunoblot analysis of PP-2A in MG-63 cells. Cytosolic extracts from MG-63 cells (lane 1) and MG-63 cells treated with IL-1α (lane 2) were prepared. PP-2A protein was detected using an anti-PP-2A mouse monoclonal antibody. Filtered membranes were then reprobed with an anti-β-actin monoclonal antibody to control for loading and integrity of protein.
Another group of genes identified were involved in cell cycle control and apoptosis. Some of them are inhibitors of apoptotic proteins, such as apoptosis protein 1; others are cyclin G1, CDC7 and CDC42-binding protein β. Studies have shown that the small GTPase CDC42 was activated by the inflammatory cytokines TNF-α and IL-1 (36). Interestingly, CDC42, a Rho family GTPase, has been implicated in several signal transduction pathways, including organization of the actin cytoskeleton, activation of the c-Jun N-terminal MAP kinase (JNK) and stimulation of the nuclear transcription factor κB (NFκB) (37). The ability of inflammatory cytokines to activate both the JNK MAP kinase and NFκB pathways is well established and has been proposed to account for the majority of their biological functions. Our results show that the regulation of CDC42-binding protein β, at least in part, is at the translational level during IL-1α treatment in MG-63 cells. It is possible that MG-63 cells utilize this acute translational regulation mechanism to up-regulate the CDC42-binding protein β level in response to IL-1α exposure to regulate the CDC42 signaling pathway.
It is also interesting to point out that inhibitor of apoptosis protein 1 is acutely up-regulated by 20-fold at the translational level by IL-1α treatment. It has been shown that in Drosophila, the cell death pathway activated by the JNK-mediated pathway can be blocked by Drosophila inhibitor of apoptosis protein 1 (38). It is well understood that inhibitor of apoptosis protein family proteins suppress cell death through direct inhibition of caspases (39). It is possible that inhibitor of apoptosis protein 1 blocks both caspase-dependent and caspase-independent cell death pathways by blocking both the caspases and JNK signaling. Perhaps it is necessary for the up-regulation of inhibitor of apoptosis protein 1 to prevent apoptosis by the activated JNK pathway with IL-1α in order for MG-63 cells to differentiate to the osteoblast-like phenotype. This result also provides the molecular basis for identifying cis- and trans-acting elements that may regulate inhibitor of apoptosis protein 1 expression at some level of translational regulation.
Finally, a list of potential translationally regulated genes was identified as being involved in cellular metabolism. One of the best examples is the dihydrofolate reductase gene, which has been well studied as a gene controlled by translational autoregulation (40,41). Dihydrofolate reductase is one of the main targets for anticancer therapy. Dihydrofolate reductase protein interacts with its own mRNA by direct binding to the coding region of the mRNA, thereby down-regulating its protein synthesis. Another known translationally regulated target is ribonucleotide reductase, a key enzyme involved in synthesis of dNTPs, which was shown to be translationally regulated via eIF4E (42). The down-regulation of these S phase enzymes could be critical for cell differentiation processes. These results, taken together, provide a strong validation of the polysome GeneCalling technology to discover translationally regulated genes in MG-63 cells during cytokine IL-1α exposure.
Figure 6 shows representative QEA traces for translation initiation factor 4B. The total mRNA expression level for translation initiation factor 4B showed no difference based upon steady-state mRNA GeneCalling studies (Fig. 6A). However, the level of actively translated forms of translation initiation factor 4B was significantly down-regulated by 9-fold in MG-63 cells treated with IL-1α compared with control MG-63 cells (Fig. 6B). Translation initiation factor 4B plays a critical role in regulating global translation initiation (43). This may explain the large percentage of genes translationally regulated via IL-1α. The results further confirm the power of this technology to study translational regulation.
Figure 6.
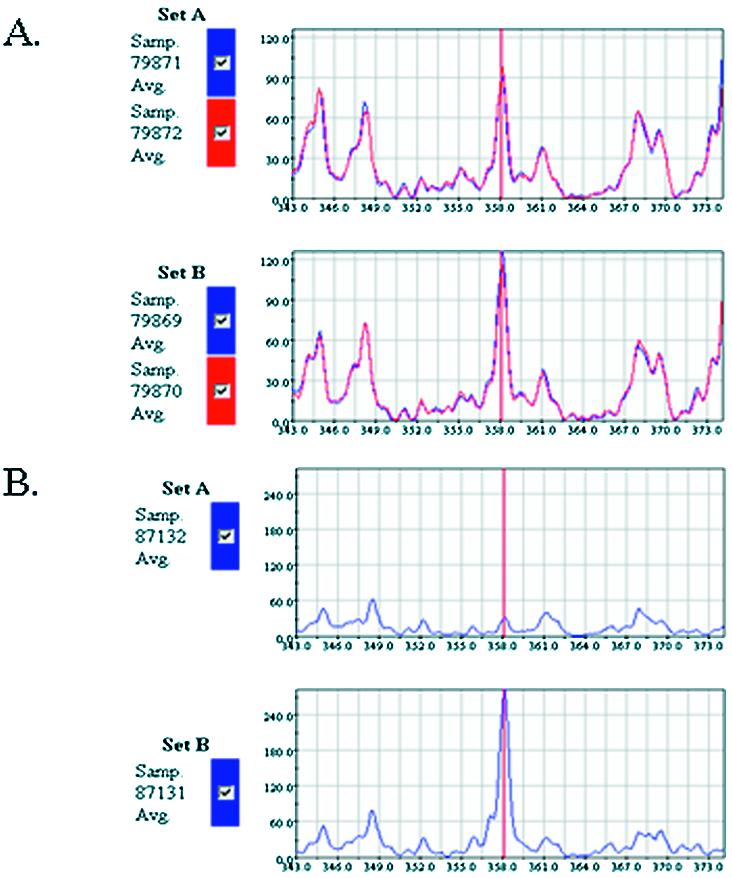
(A) Trace replication (n = 3) of QEA electrophoresis output for translation initiation factor 4B from steady-state mRNA of MG-63 cells (Set B) and cells treated with IL-1α (Set A). (B) Poisoned QEA electrophoresis output from isolated polysome mRNA of MG-63 cells (Set B) and cells treated with IL-1α (Set A). Red line at peak position 358.0 indicates gene fragment corresponding to translation initiation factor 4B.
One of the genes listed in Table 1, CAML, a gene confirmed by oligo poisoning, was translationally regulated in MG-63 cells treated with IL-1α. CAML was originally described as a cyclophilin B-binding protein whose overexpression in T cells causes a rise in intracellular calcium, thus activating transcription factors responsible for the early immune response (44). CAML is an endoplasmic reticulum membrane bound protein oriented towards the cytosol (44). Holloway and Bram recently showed that CAML functions as a regulator to control Ca2+ storage (45). The steady-state level of CAML mRNA in both control MG-63 cells and MG-63 cells treated with IL-1α showed no difference. However, in the polysome, isolated, actively translated mRNA in MG-63 cells treated with IL-1α was down-regulated by nearly 4-fold. These results were confirmed by RT–QPCR analysis (Fig. 7A). The immunoblot analysis of the CAML protein also confirmed that the protein level of CAML in MG-63 cells treated with IL-1α was indeed down-regulated nearly 4-fold (Fig. 7B). This result may provide a novel regulatory pathway for CAML expression and an acute response to intracellular calcium level change. Recent studies have shown that the CAML interactor (TACI) plays a critical role in T cell activation and collagen-induced arthritis in mice (46). In fact, it was suggested that inhibition of these ligands might have therapeutic benefits for autoimmune diseases, such as rheumatoid arthritis, which involves both B and T cells.
Figure 7.

(A) RT–QPCR analysis of CAML expression in MG-63 cells. CT values for CAML were first normalized against housekeeping gene GAPDH and converted to a percentage for relative expression. (B) Western immunoblot analysis of CAML in MG-63 cells. Cytosolic extracts from MG-63 cells (lane 2) and MG-63 cells treated with IL-1α (lane 1) were prepared. CAML protein was detected by immunoblot analysis using an anti-CAML polyclonal antibody. Filtered membranes were then reprobed with an anti-β-actin monoclonal antibody to control for loading and integrity of protein.
By comparing the GeneCalling results from steady-state mRNAs and isolated polysome mRNAs at any given time point, one can identify genes that are transcriptionally regulated, translationally regulated or both. This analysis provides lead candidates for discovering novel regulatory mechanisms. This approach provides a snapshot of a high throughput, open platform for comprehensive gene expression analysis at any single or multiple time point. In addition, one can identify potential drug targets by targeting these key regulatory steps of gene expression. Taken together, this study suggests that by isolating actively translated mRNAs from polysomes and comparing them with the steady-state mRNA expression profile, one can identify translationally regulated genes which could be missed by measuring only steady-state total mRNA levels.
CONCLUSIONS
Using MG-63 cells as a model system, actively translated mRNAs were isolated via polysome collection and subsequently analyzed using a high throughput, open platform expression analysis technology, GeneCalling. This technology provides a better estimation of actual protein level than just using steady-state mRNA expression analysis. It is one step away from direct protein expression quantitation. In addition, by comparing the steady-state and actively translated mRNA levels, one can identify genes that are controlled at multiple points in the gene expression cascade. This approach provides an open platform, comprehensive gene regulation analysis in a high throughput manner. As a result of this study, a number of novel and previously known translationally regulated genes have been identified in MG-63 cells treated with the inflammation cytokine IL-1α. These results strongly suggest that cytokine IL-1α mediates the cellular inflammation response not only through transcriptional and post-transcriptional regulation but also translational regulation through a number of critical genes that responded to acute exposure to IL-1α. The results presented here demonstrate the utility of using Polysomal GeneCalling to identify genes regulated at the translational level. In addition, by comparing GeneCalling results from both total steady-state RNA samples and polysome-derived samples, a comprehensive, panoramic overview of gene regulation can be obtained.
Acknowledgments
ACKNOWLEDGEMENTS
The authors thank Dr Richard J. Bram for providing rabbit anti-CAML polyclonal antibody, and Dr Michael McKenna at CuraGen Corp. and Professor Richard Flavell and Dr Binfeng Lu at the Department of Immunology of Yale University for helpful comments on the manuscript.
REFERENCES
- 1.Silvennoinen J.A., Karttunen,T.J., Niemela,S.E., Manelius,J.J. et al. (1995) A controlled study of bone mineral density in patients with inflammatory bowel disease. Gut, 37, 71–76. [DOI] [PMC free article] [PubMed] [Google Scholar]
- 2.Priante G., Bordin,L, Musacchio,E., Clari,G. et al. (2002) Fatty acids and cytokine mRNA expression in human osteoblastic cells: a specific effect of arachidonic acid. Clin. Sci., 102, 403–409. [PubMed] [Google Scholar]
- 3.Birch M.A. and Skerry,T.M. (1999) Differential regulation of syndecan expression by osteosarcoma cell lines in response to cytokines but not osteotropic hormones. Bone, 24, 571–578. [DOI] [PubMed] [Google Scholar]
- 4.Yayon A.M., Klagsbrun,M., Esko,J.D., Leder,P. et al. (1991) Cell surface heparin-like molecules are required for binding of basic fibroblast growth factor. Cell, 64, 841–848. [DOI] [PubMed] [Google Scholar]
- 5.Billiau A., Edy,V.G., Heremans,H., Van Damme,J., Desmyter,J. et al. (1977) Human interferon: mass production in a newly established cell line, MG-63. Antimicrobial Agents Chemother., 12, 11–15. [DOI] [PMC free article] [PubMed] [Google Scholar]
- 6.Stein G.S., Kian,J.B., Stein,J.L., Van Wijnen,A.J. et al. (1996) Transcriptional control of osteoblast growth and differentiation. Physiol. Rev., 76, 593–629. [DOI] [PubMed] [Google Scholar]
- 7.Panagakos F.S., Hinojosa,L.P. and Kumar,S. (1994) Formation and mineralization of extra-cellular matrix secreted by an immortal human osteoblastic cell line: modulation by tumor necrosis factor-alpha. Inflammation, 18, 267–283. [DOI] [PubMed] [Google Scholar]
- 8.Schena M., Shalon,D., Heller,R., Chai,A., Brown,P.O. and Davis,R.W. (1996) Parallel human genome analysis: microarray-based expression monitoring of 1000 genes. Proc. Natl Acad. Sci. USA, 93, 10614–10619. [DOI] [PMC free article] [PubMed] [Google Scholar]
- 9.Zhang L., Zhou,W., Velculescu,V.E., Kern,S.E., Hruban,R.H., Hamilton,S.R., Vogelstein,B. and Kinzler,K.W. (1997) Gene expression profiles in normal and cancer cells. Science, 276, 1268–1272. [DOI] [PubMed] [Google Scholar]
- 10.Cho R.J., Campbell,M.J., Winzeler,E.A., Steinmetz,L., Conway,A., Wodicka,L., Wolfsberg,T.G., Gabrielian,A.E., Landsman,D. and Lockhart,D.J. (1998) A genome-wide transcriptional analysis of the mitotic cell cycle. Mol. Cell, 2, 65–73. [DOI] [PubMed] [Google Scholar]
- 11.Mikulits W., Berengere,P., Habermann,B., Beug,H., Garcia-Sanz,J.A. and Mullner,E.W. (2000) Isolation of translationally controlled mRNAs by differential screening. FASEB J., 14, 1641–1652. [DOI] [PubMed] [Google Scholar]
- 12.Derrigo M., Cestelli,A., Savettieri,G. and Di Liegro,I. (2000) RNA–protein interactions in the control of stability and localization of messenger RNA. Int. J. Mol. Med., 5, 111–123. [PubMed] [Google Scholar]
- 13.Sheikh M.S. and Fornace,A.J.,Jr (1999) Regulation of translation initiation following stress. Oncogene, 18, 6121–6128. [DOI] [PubMed] [Google Scholar]
- 14.Hershey J., Mathews,M.B. and Sonenberg,N.S. (1996) Origins and targets of translational control. In Translational Control. Cold Spring Harbor Laboratory Press, Cold Spring Harbor, NY, Vol. 30, pp. 1–29. [Google Scholar]
- 15.Zong Q., Schummer,M., Hood,L. and Morris,D.R. (1999) Messenger RNA translation state: the second dimension of high-throughput expression screening. Proc. Natl Acad. Sci. USA, 96, 10632–10636. [DOI] [PMC free article] [PubMed] [Google Scholar]
- 16.Johannes G., Carter,M.S., Eisen,M.B., Brown,P.O. and Sarnow,P. (1999) Identification of eukaryotic mRNAs that are translated at reduced cap binding complex eIF4F concentrations using a cDNA microarray. Proc. Natl Acad. Sci. USA, 96, 13118–13123. [DOI] [PMC free article] [PubMed] [Google Scholar]
- 17.Sachs A.B., Sarnow,P. and Hentze,M.W. (1997) Starting at the beginning, middle and end: translation initiation in eukaryotes. Cell, 89, 831–838. [DOI] [PubMed] [Google Scholar]
- 18.Chu E., Grem,J.L., Johnston,P.G. and Allegra,C.J. (1996) New concepts for the development and use of antifolates. Stem Cells, 14, 41–46. [DOI] [PubMed] [Google Scholar]
- 19.Shimkets R.A., Lowe,D.G., Tsu-Ning Tai,J., Sehl,P., Jin,H. et al. (1999) Gene expression analysis by transcript profiling coupled to a gene database query. Nat. Biotechnol., 17, 798–803. [DOI] [PubMed] [Google Scholar]
- 20.Rogers J.T., Leiter,L.M., McPhee,J., Cahill,C.M., Zhan,S.S. et al. (1999) Translation of the alzheimer amyloid precursor protein mRNA is up-regulated by interleukin-1 through 5′-untranslated region sequences. J. Biol. Chem., 274, 6421–6431. [DOI] [PubMed] [Google Scholar]
- 21.Rousseau D., Kaspar,R., Rosenwald,I., Gehrke,L. and Sonenberg,N. (1996) Translation initiation of ornithine decarboxylase and nucleocytoplasmic transport of cyclin D1 mRNA are increased in cells overexpressing eukaryotic initiation factor 4E. Proc. Natl Acad. Sci. USA, 93, 1065–1070. [DOI] [PMC free article] [PubMed] [Google Scholar]
- 22.Laemmli U.K. (1970) Cleavage of structural proteins during the assembly of the head of bacteriophage T4. Nature, 227, 680–685. [DOI] [PubMed] [Google Scholar]
- 23.Morris D.R. (1995) Growth control of translation in mammalian cells. Prog. Nucleic Acid Res. Mol. Biol., 51, 339–363. [DOI] [PubMed] [Google Scholar]
- 24.Rudland P.S., Weil,S. and Hunter,A.R. (1975) Changes in RNA metabolism and accumulation of presumptive messenger RNA during transition from the growing to the quiescent state of cultured mouse fibroblasts. J. Mol. Biol., 96, 745–766. [DOI] [PubMed] [Google Scholar]
- 25.Spedding G. and Draper,D.E. (1993) Allosteric mechanism for translational repression in the Escherichia coli alpha operon. Proc. Natl Acad. Sci. USA, 90, 4399–4403. [DOI] [PMC free article] [PubMed] [Google Scholar]
- 26.Tang C.K. and Draper,D.E. (1990) Evidence for allosteric coupling between the ribosome and repressor binding sites of a translationally regulated mRNA. Biochemistry, 29, 4434–4439. [DOI] [PubMed] [Google Scholar]
- 27.McDonald P.P., Fadok,V.A., Bratton,D. and Henson,P.M. (1999) Transcriptional and translational regulation of inflammatory mediator production by endogenous TGF-beta in macrophages that have ingested apoptotic cells. J. Immunol., 163, 6164–6172. [PubMed] [Google Scholar]
- 28.Gaugler M.H., Squiban,C., Claraz,M., Schweitzer,K., Weksler,B., Gourmelon,P. and Van der Meeren,A. (1998) Characterization of the response of human bone marrow endothelial cells to in vitro irradiation. Br. J. Haematol., 103, 980–989. [DOI] [PubMed] [Google Scholar]
- 29.Mamdouh Z., Chen,X., Pierini,L.M., Maxfield,F.R. et al. (2003) Targeted recycling of PECAM from endothelial surface-connected compartments during diapedesis. Nature, 421, 748–753. [DOI] [PubMed] [Google Scholar]
- 30.Dufner A. and Thomas,G. (1999) Ribosomal S6 kinase signaling and the control of translation. Exp. Cell Res., 253, 100–109. [DOI] [PubMed] [Google Scholar]
- 31.Chu E., Koeller,D.M., Casey,J.L., Drake,J.C., Chabner,B.A. et al. (1991) Autoregulation of human thymidylate synthase messenger RNA translation by thymidylate synthase. Proc. Natl Acad. Sci. USA, 88, 8977–8981. [DOI] [PMC free article] [PubMed] [Google Scholar]
- 32.Ju J., Pedersen-Lane,J., Maley,F. and Chu,E. (1999) Regulation of p53 expression by thymidylate synthase. Proc. Natl Acad. Sci. USA, 96, 3769–3774. [DOI] [PMC free article] [PubMed] [Google Scholar]
- 33.Baharians Z. and Schonthal,A.H. (1998) Autoregulation of protein phosphatase type 2A expression. J. Biol. Chem., 273, 19019–19024. [DOI] [PubMed] [Google Scholar]
- 34.Choi I., Lee,M.J., Kim,E.J., Kang,H.S. and Pyun,K.H. (1998) Roles of protein phosphatase 2A in IL-6 signal transduction in Hep3B cells. Immunol. Lett., 61, 103–107. [DOI] [PubMed] [Google Scholar]
- 35.Nazian S.J., Brewer,L.D. and Ness,G.C. (1991) Pituitary regulation of the expression of the farnesyl pyrophosphate synthetase gene in the testes of the sexually maturing rat. J. Androl., 12, 264–272. [PubMed] [Google Scholar]
- 36.Puls A., Eliopoulos,A.G., Nobes,C.D., Bridges,T., Young,L.S. and Hall,A. (1999) Activation of the small GTPase Cdc42 by the inflammatory cytokines TNF(alpha) and IL-1 and by the Epstein-Barr virus transforming protein LMP1. J. Cell Sci., 112, 2983–2992. [DOI] [PubMed] [Google Scholar]
- 37.Moncrieff C.L., Bailey,M.E.S., Morrison,N. and Johnson,K.J. (1999) Cloning and chromosomal localization of human cdc-42 binding protein kinase beta. Genomics, 57, 297–300. [DOI] [PubMed] [Google Scholar]
- 38.Igaki T., Kanda,H., Yamamato-Goto,Y., Kanuka,H. et al. (2002) Eiger, a TNF superfamily ligand that triggers the Drophila JNK pathway. EMBO J., 21, 3009–3018. [DOI] [PMC free article] [PubMed] [Google Scholar]
- 39.Deveraux Q.L. and Reed,J.C. (1999) IAP family proteins—suppressors of apoptosis. Genes Dev., 13, 239–252. [DOI] [PubMed] [Google Scholar]
- 40.Chu E., Takimoto,C.H., Voeller,D., Grem,J.L. and Allegra,C.J. (1993) Specific binding of human dihydrofolate reductase protein to dihydrofolate reductase messenger RNA in vitro. Biochemistry, 32, 4756–4760. [DOI] [PubMed] [Google Scholar]
- 41.Ercikan-Abali E.A., Banerjee,D., Waltham,M.C., Skacel,N., Scotto,K.W. and Bertino,J.R. (1997) Dihydrofolate reductase protein inhibits its own translation by binding to dihydrofolate reductase mRNA sequences within the coding region. Biochemistry, 36, 12317–12322. [DOI] [PubMed] [Google Scholar]
- 42.Abid M.R., Li,Y., Anthony,C. and De Benedetti,A. (1999) Translational regulation of ribonucleotide reductase by eukaryotic initiation factor 4E links protein synthesis to the control of DNA replication. J. Biol. Chem., 274, 35991–35998. [DOI] [PubMed] [Google Scholar]
- 43.Gingras A.C., Raught,B. and Sonenberg,N. (2001) Regulation of translation initiation by FRAP/mTOR. Genes Dev., 15, 807–826. [DOI] [PubMed] [Google Scholar]
- 44.Holloway M.P. and Bram,R.J. (1996) A hydrophobic domain of Ca2+-modulating cyclophilin ligand modulates calcium influx signaling in T lymphocytes. J. Biol. Chem., 271, 8549–8552. [DOI] [PubMed] [Google Scholar]
- 45.Holloway M.P. and Bram,R.J. (1998) Co-localization of calcium-modulating cyclophilin ligand with intracellular calcium pools. J. Biol. Chem., 273, 16346–16350. [DOI] [PubMed] [Google Scholar]
- 46.Wang H., Marsters,S.A., Baker,T., Chan,B. et al. (2001) TACI-ligand interactions are required for T cells activation and collagen-induced arthritis in mice. Nature Immunol., 2, 632–637. [DOI] [PubMed] [Google Scholar]