Abstract
In spite of the fact that cdk inhibiting drugs are also potent transcriptional inhibitors, we discover that p57 (Kip2, CDKN1C) is significantly upregulated by three small molecule cdk inhibitors, including BMS-387032 (SNS-032). Herein, several lines of evidence demonstrate that p57 upregulation by BMS-387032 is transcriptional and is mediated by stabilization of the E2F1 protein and direct binding of E2F1 to the p57 promoter. Treatment of MDA-MB-231 breast cancer cells with BMS-387032 led to a rapid increase in the E2F1 protein, while the E2F1 mRNA and many E2F-regulated transcripts were repressed. The stabilization of the E2F1 protein by BMS-387032 was accompanied by significant increases in the p57 mRNA and protein. This increase was dependent on E2F1 since it did not occur in an E2F1-deficient cell line. Activation of p57 by E2F1 appears direct since an E2F1-estrogen receptor fusion protein activated endogenous p57 promoter in response to hydroxytamoxifen treatment, even in the presence of cycloheximide. Luciferase constructs driven by the p57 promoter verify that upregulation of p57 mRNA by BMS-387032 is transcriptional and dependent on E2F binding sites in the promoter. Expression of exogenous p57 significantly decreased the fraction of cells in S phase demonstrating that the induction of p57 by BMS-387032 could contribute to drug-induced growth arrest. Furthermore, p57-deficient MDA-MB-231 cell lines are significantly more sensitive to BMS-387032-induced apoptosis than controls, which demonstrates that activation of p57 in this context serves as a survival pathway limiting the cytotoxic effect of this drug. The results presented in this manuscript demonstrate that small molecule cdk inhibitors transcriptionally activate p57 dependent upon E2F1 and that this activation in turn serves to limit E2F1s death-inducing activity.
Keywords: CDK, CDKN1C, Cip, Kip, E2F, BMS-387032, SNS-032, apoptosis
Introduction
A family of enzymes known as the cyclin dependent kinases (cdks) governs the mammalian cell cycle (Meyerson et al., 1992). The activities of the cdks are subjected to positive regulation by association with cyclins and by negative regulation by two families of inhibitory proteins. The CDKN1 family contains three members A, B and C, which are more commonly referred to as p21 CIP1(Harper et al., 1993)/WAF1(el-Deiry et al., 1993), p27 KIP1 (Polyak et al., 1994; Toyoshima & Hunter, 1994) and p57 KIP2 (Lee et al., 1995; Matsuoka et al., 1995). The second family of cdk inhibitors are the smaller CDKN2 proteins (p15, p16, p18 and p19) which are more commonly known as the INK4A family (Sherr & Roberts, 1999). The G1/S phase transition is associated with the accumulation of cyclin D-dependent kinases 4 and 6 and cyclin E-cdk2 activities that sequentially direct the phosphorylation of members of the Rb pocket proteins, including p105, p107 and p130 (Sherr, 1994). Phosphorylation of the pocket proteins leads to a release of E2F transcriptional activity at the G1/S boundary. The resulting increase in E2F activity transcriptionally induces a number of genes (DeGregori et al., 1995; Leone et al., 1999; Nevins, 2001) leading to the entry into S phase (Johnson et al., 1993). Cyclin A-cdk2 and cyclin B-cdk1 activities orchestrate the S phase and G2/M transitions, respectively (Pines, 1991). Once cells are in S phase, E2F activity is no longer necessary and the subsequent rise in cyclin A/cdk2 activity (induced by in part by E2Fs) leads to downregulation of E2F1, 2 and 3 (other E2Fs lack cyclin A binding domain) and the cessation of S phase. This downregulation of E2F activity by cyclin A is required for orderly S phase progression and in its absence, apoptosis occurs (Chen et al., 1999; Kowalik et al., 1995). Therefore, E2F activity is positively regulated by cdks4 and 6 in G0/G1 and is negatively regulated by cyclin A/cdk2 in S phase.
The role of cdks is not limited to the control of cell cycle as the name might imply. The cdk 7-containing CAK complex is a component of the multi-subunit transcription factor TFIIH, which phosphorylates the serine 5 of the heptapeptide repeat of RNA polymerase II large subunit promoting transcription initiation, promoter clearance and recruitment of the capping enzyme. Cdk 9 forms a complex with cyclin T, which preferentially phosphorylates ser 2 of the heptapeptide repeat of RNA polymerase II large subunit promoting transcription elongation and recruitment of the 3’ RNA processing activities. Thus, small molecule cdk inhibitor drugs that aim to regulate cell cycle also inhibit general transcription (Lam et al., 2001) and it is likely that the rapid loss of survival genes having unstable mRNAs may contribute to apoptosis (Shapiro, 2006). Although general transcription is inhibited by small molecule cdk inhibitors, a small number of transcripts are found to be upregulated by cdk inhibitors including c-myc (Lu et al., 2004). C-myc also happens to be the first E2F-regulated cellular gene ever identified (Hiebert et al., 1989).
Although, all cyclin-cdk activities may not be absolutely required for cell cycle progression (Geng et al., 2003; Ortega et al., 2003; Tetsu & McCormick, 2003), genetic evidence strongly supports the idea that upregulation of cdks and the subsequent disruption of Rb/E2F complexes generally represent oncogenic events (Benson et al., 2005; Cress & Nevins, 1996; Shapiro, 2004), whereas kinase inhibitory molecules represent tumor suppressor activities (Jackson et al., 2002; Jackson et al., 2003). As such, this pathway is potentially an excellent target for the development of anticancer drugs (Bayes et al., 2004; Benson et al., 2005; Blagden & de Bono, 2005; Caponigro et al., 2005; Dai & Grant, 2004; Jackson et al., 2002; Jackson et al., 2003; Kamath et al., 2005; Ma et al., 2004; Misra et al., 2004; Senderowicz, 2003a; Senderowicz, 2003b; Shapiro, 2004), and thus, a number of such drugs have been examined in clinical trials for a variety of cancers (Benson et al., 2005; Messmann et al., 2003; Shapiro, 2004; Shapiro et al., 2001; Tan et al., 2002; Zhai et al., 2003; Zhai et al., 2002). Even in the event that these drugs do not turn out to be universal anticancer drugs it is possible that understanding their functional targets may provide a means to predict which patients will respond to a given cdk inhibitor. Likewise, the clinical utility of small molecule cdk inhibitors may not be restricted to cancer since there is also growing evidence that the E2F pathway plays roles outside the G1/S transition and contribute significantly to development and other physiological processes including the regulation of blood pressure (Funke-Kaiser et al., 2003), response to stroke (Osuga et al., 2000) and adipogenesis (Fajas et al., 2002; Sarruf et al., 2005). As an interesting example, E2F1 (Fajas et al., 2002) and cyclin D3 (Sarruf et al., 2005) knockout mice are resistant to diet-induced obesity.
In past work we have found that the E2F1 protein is potently upregulated by treatment with several small molecule cdk inhibitors and that ablation of E2F1 by either RNAi or by use of cells from E2F1-null mice provides resistance to cell death induced by these drugs (Ma et al., 2003a). Presumably, this upregulation of E2F1 activity was the result of inhibition of the cyclin A/cdk2 complex that ordinarily leads to E2F1 targeting for degradation (Jiang et al., 2003; Ma et al., 2003a; Ma et al., 2004; Matranga & Shapiro, 2002). In contrast, these drugs repress E2F4, which is not subjected to control by cyclin A/cdk2, and E2F4 ablation significantly increases cell death induced by cdk inhibitors (Ma et al., 2004). In the current work, we have further examined the effects of cdk inhibitors on the regulation of additional cell cycle genes. Consistent, with the inhibition of cdks, most cell cycle regulated genes examined were silenced after treatment with BMS-387032. Surprisingly, we find one exception to this rule, p57 Kip2. A number of lines of evidence demonstrate that this induction of p57 is transcriptional and is mediated by E2F1. Furthermore, data suggest that upregulation of p57 following BMS-387032 treatment primarily represents a feedback pathway that limits cell death. These finding suggest that cdk inhibitors can transcriptionally activate certain cellular targets in spite of the fact that they are general transcriptional inhibitors.
Materials and Methods
Cell lines and plasmids
All cell lines were obtained from the ATCC. H1299 (wt Rb, mut p53, and wt p16) cells were cultured in Dulbecco's Modified Eagle's Media (DMEM) supplemented with 5% fetal bovine serum. H1299 derivatives lacking E2F1 (Ma et al., 2003a; Ma et al., 2004) and expressing a HA-ER-E2F1 fusion protein (Ma et al., 2003b; Wang et al., 2005) have been characterized previously. MCF-7 (wt Rb, p53, and mut p16), MDA-MB-231 (wt Rb, mut p53, and mut p16) and T98G (wt Rb, p53, and mut p16) cells were grown in DMEM with 10% fetal bovine serum. The human p57 promoter luciferase reporters (Alheim et al., 2003) were a kind gift from Dr. Okret (Karolinska Institute). The pBB14 expression vector for membrane GFP (Brideau et al., 1998; Kalejta et al., 1999) was a kind gift from Dr. Enquist (Princeton). An expression vector for p57 (pCMVp57, CAT# TC127869) was obtained from Origene Technologies. Previously used E2F plasmids include: pBSU6-E2F1-RNAi (Ma et al., 2003a; Ma et al., 2004), pcDNA3-HA-E2F1 (Ma et al., 2003b), pcDNA3-E2F2, 4 and 5 (Flores et al., 1998; Ma et al., 2003b), pcDNA3-myc-E2F3A and 3B (He & Cress, 2002; Ma et al., 2003b), and pcDNA3-E2F 6 (Ma et al., 2003b). The E2F1 promoter-driven luciferase reporter, pGL2-E2F1, was previously described (Johnson et al., 1994). The National Cancer Institute Cancer Therapy Evaluation Program provided flavopiridol; Bristol-Myers Squib provided BMS-387032, and roscovitine was purchased from Sigma. All drug treatments were performed as previously described (Ma et al., 2004) and unless otherwise noted BMS-387032 treatment was 500 nM.
Knockdown of p57 in MDA-MB-231 cells
Eight p57 shRNAi expression plasmids from The RNAi Consortium or TRC (TRCN0000039678, TRCN0000039679, TRCN0000039680, TRCN0000039681, TRCN0000039682, TRCN0000010484, TRCN0000010485, and TRCN0000010846) were obtained from Open Biosystems. The two most efficient (TRCN -39678 and -10486) were identified by co-transfection into H1299 cells with pCMV-p57 followed by Western blotting to measure expression levels of p57 (p60 were transfected with 2 μg of pCMV-p57 and 8 μg RNAi or empty vector, pSMC2). To establish stable knockdown lines, MDA-MB-231 cells (with relatively high endogenous p57) were transfected with TRCN -39678 and -10486 separately using Lipofectamine-Plus. Forty-eight hours after transfection, cells were split sparsely and grown in 1 μg/μl puromycin for three weeks. Puromycin-resistant colonies were expanded and relative p57 levels were determined by Western blotting. Four cell lines with low p57 protein were chosen for the further experiments. 231-p57RNAi-9 and 231-p57RNAi-11 were generated with TRCN -10486 and 231-p57RNAi-A and 231-p57RNAi-E were from TRCN -39678. Relative growth rates of cell lines were determined by plating 4 X 10⁴ cells per 24-well plate and counting total cells harvested by trypsin daily from duplicate wells.
Cell cycle analysis of transfected cells
Cell cycle was assayed by flow cytometry. Cells in 10-cm plates were co-transfected with 5 μg of pBB14 and 15μg of pCMV-p57, or pcDNA3 as control, using the calcium phosphate method. Forty-eight hours after transfection, floating cells were collected and adherent cells were dislodged using AccutaseTM to preserve surface markers. Cells were pooled, pelleted, resuspended in PBS and fixed with ice-cold 70% ethanol (>4h). Fixed cells were pelleted, resuspended, washed, and cell pellets were resuspended directly in PBS containing 0.25-mg/ml RNase A and 50-μg/ml propidium iodide (PI). Ten thousand GFP positive cells were gated for cell cycle and sub-G1 DNA content analysis using Becton-Dickinson FACScan instrument and Cell Quest software.
Apoptosis measurements
Apoptosis was assayed using Pharmingen APO-BRDU Kit without modification. Following treatment, cells were trypsinized and resuspended in PBS. Cells were counted and 1–2 x 10⁶ cells were fixed in 1% paraformaldehyde in PBS on ice, pelleted, washed twice in PBS, and fixed with ice-cold 70% ethanol overnight. The next day cells were pelleted, resuspended, and washed with wash buffer. Pelleted cells were resuspended with reaction buffer, TdT enzyme, and br-dUTP for one hour at 37° C. Cells were subsequently rinsed with 1.0 ml of rinse buffer and resuspended with fluorescein labeled Anti-BrdU in the dark for 30 min at room temperature. Propidium iodide and RNase are added and incubated for 30 min. 1 x 10⁴ cells per experimental condition were analyzed for fluorescence on a Becton-Dickinson FACScan using Cell Quest software. All experiments measuring apoptosis were performed at least three times will similar results and one representative experiment is shown in the figures.
Transfections and Viruses
Transfections for luciferase assay were performed using calcium phosphate with various DNAs totaling 2 μg of DNA per well in a 12-well dish. In general, transfections included 100 ng of expression plasmid (pCMV-based vectors), 1.5 μg of reporter firefly luciferase plasmid (pGL3-p57), 300 ng of renilla luciferase plasmid (pRL-TK, Promega), and carrier DNA (sheared salmon sperm DNA) to equal 2μg total DNA in each transfection. Cells were harvested 48h after transfection and luciferase assays were performed using the Dual-Luciferase Reporter Assay System following the manufacturer’s protocol (Promega, Madison, WI). In some cases, transfected cells were treated with 500 nM BMS-386032 for 24 hrs prior to harvest. To control for transfection efficiency, firefly luciferase values were normalized to the values for renilla luciferase. Experiments were done in triplicate, and the average relative activity and standard error determined.
Dr. Matthew Stewart (University of Illinois at Urbana-Champaign) provided Adp57 virus (Stewart et al., 2004). Dr. Haura (Moffitt Cancer Center) provided Ad-GFP, an adenoviral vector expressing the green fluorescent protein (GFP), which was used as a negative control. AdT-E2F1, an adenovirus expressing GFP and E2F1, was generated using the AdEasy system (Quantum Biotechnologies). Briefly, a HindIII/Xba I restriction fragment of pcDNA3-E2F1 (corresponding to an untagged hE2F1 cDNA) was cloned into the Hin dIII and Xba I sites of the pAdTrack shuttle vector. This vector was linearized (Pme I) and recombined into the AdEasy-1 viral vector by cotransfection and kanaymycin selection in recA+ bacterial strain, BJ5183. Restriction mapping identified appropriate recombinant colonies. Correct DNAs were amplified in DH5α cells (recA-), linearized with Pac I, and transfected into HEK 293 cells. Virus production was monitored at early stages by GFP expression and by overexpression of E2F1 as measured by western blots and electrophoretic mobility shift assays (not shown). High titer virus stocks were generated by three passages beyond the transfection stage. For AdT-E2F1 and Ad-GFP experiments viral titers were determined on 293 cells using plaque assay (Ma et al., 2002). GFP expression by the AdT-E2F1 and Ad-GFP viruses was verified by fluorescent microscopy. For Ad-p57 (no GFP) and Ad-GFP experiments we utilized an Adeno-X Rapid Titer Kit (BD Biosciences 631028) to equalize virus infections. Western blots verified viral expression of E2F1 or p57 and absence of E1A expression (to ensure non-recombination). Unless otherwise noted viral infections were performed using a multiplicity of infection (MOI) of ten viruses per cell.
RNase protection assays (RPAs)
Total RNA was isolated from 5 × 10⁶ cells using RNAeasy mini kit (Qiagen). Radiolabeled RPA robes were generated using the Riboquant multi-probe template HCC-2 (Cat#556160) from PharMingen. Briefly, the multi-probe templates were synthesized by in vitro transcription with incorporation of 32P-UTP and purified on Quick Spin RNA columns (Roche). Labeled probe (1 × 10⁶ cpm) was hybridized with 10 μg of total RNA through a temperature gradient of 90°C to 56°C over a 16h period. RNase digestion at 37°C for 1h removed unprotected probe. Protected RNA fragments were separated on a 5% polyacrylamide-urea gel and detected by autoradiography.
Western Blotting Analysis
Cells were washed twice in phosphate-buffered saline and resuspended in lysis buffer containing 50 mM Tris-HCl, pH 8.0, 250 mM NaCl, 5 mM EDTA, and 2% Nonidet P-40, supplemented with protease inhibitors (5 μg/ml each antipain, aprotinin, leupeptin, and soybean trypsin inhibitor and 0.5 μg/ml pepstatin) and 0.5 mM PMSF. Protein concentrations were determined by the Bradford assay (Bio-Rad). Western blots were performed as previously described (Ma et al., 2003a; Ma et al., 2004; Ma et al., 2003b) using an E1A monoclonal antibody (Pharmingen, 14161A), an E2F1 monoclonal (sc-251, Santa Cruz), a human p57 polyclonal (sc-1040, Santa Cruz), a mouse p57 polyclonal (sc-8298, Santa Cruz), a cdk4 monoclonal (Pharmingen, 68791A) a cyclin A monclonal (provided by Dr. Jack Pledger, Moffitt Cancer Center) or an actin monoclonal antibody (A5441, Sigma). Three monoclonal antibodies , 8WG16, H5 and H14, against the RNA Polymerase II large subunit were also utilized and were supplied by Covance Research Products. Antibody 8WG16 recognizes the RNA Pol II C-terminal heptapeptide repeat regardless of modification. Antibodies H5 and H14 recognize RNA Pol II C-terminal heptapeptide repeat phosphorylated at Ser 2 (by Cdk 9) and Ser 5 (by Cdk7), respectively, and reflect transcriptionally active RNA Polymerase II. Cell lysates were normalized for total protein content (50 μg) and subjected to SDS-PAGE. Detection of proteins was accomplished using horseradish-peroxidase-conjugated secondary antibodies and enhanced chemiluminescence (ECL) purchased from Amersham.
RESULTS
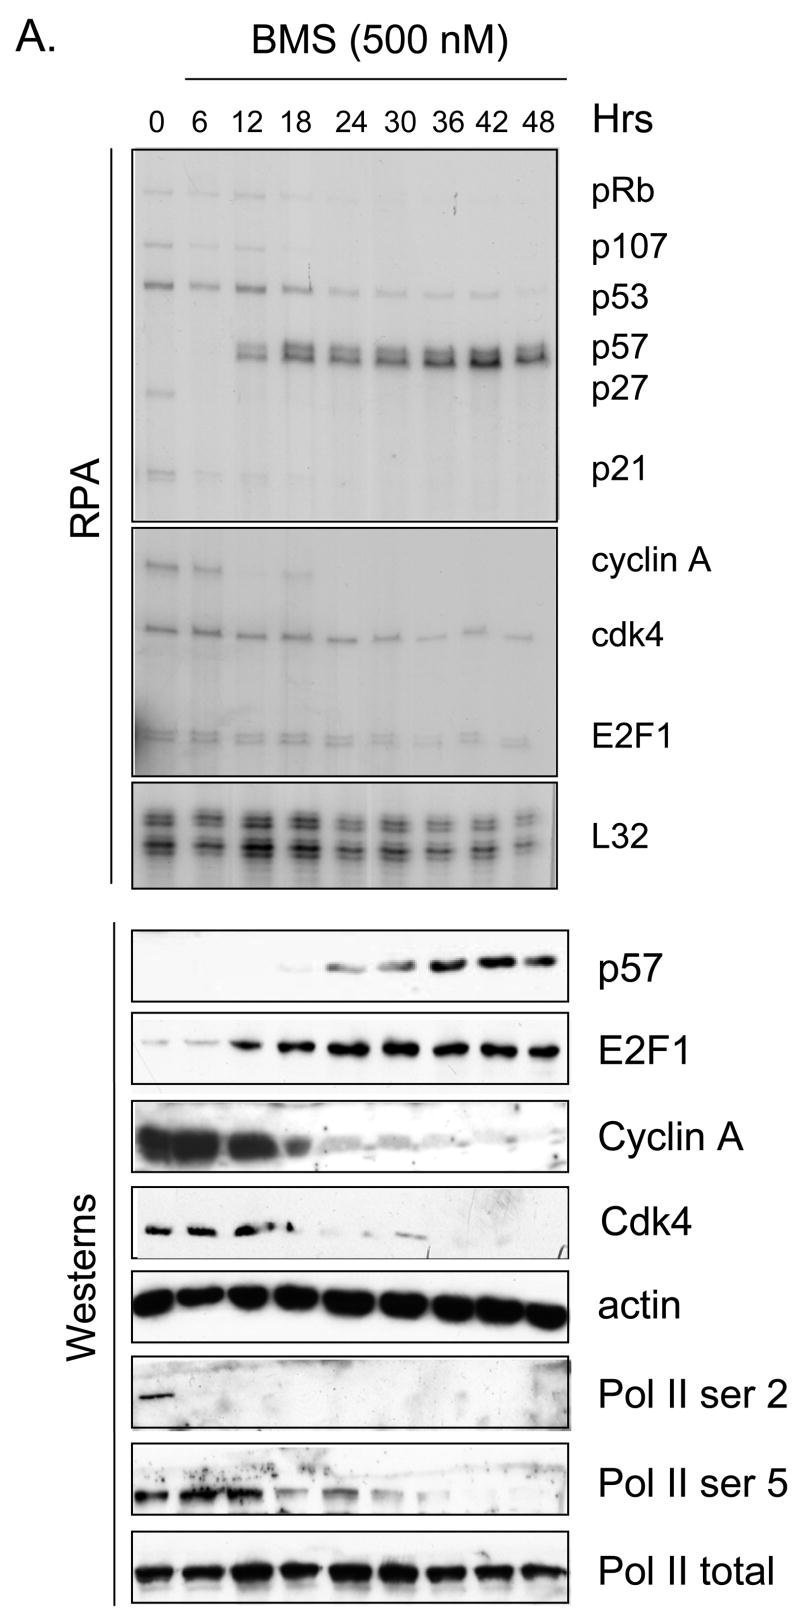
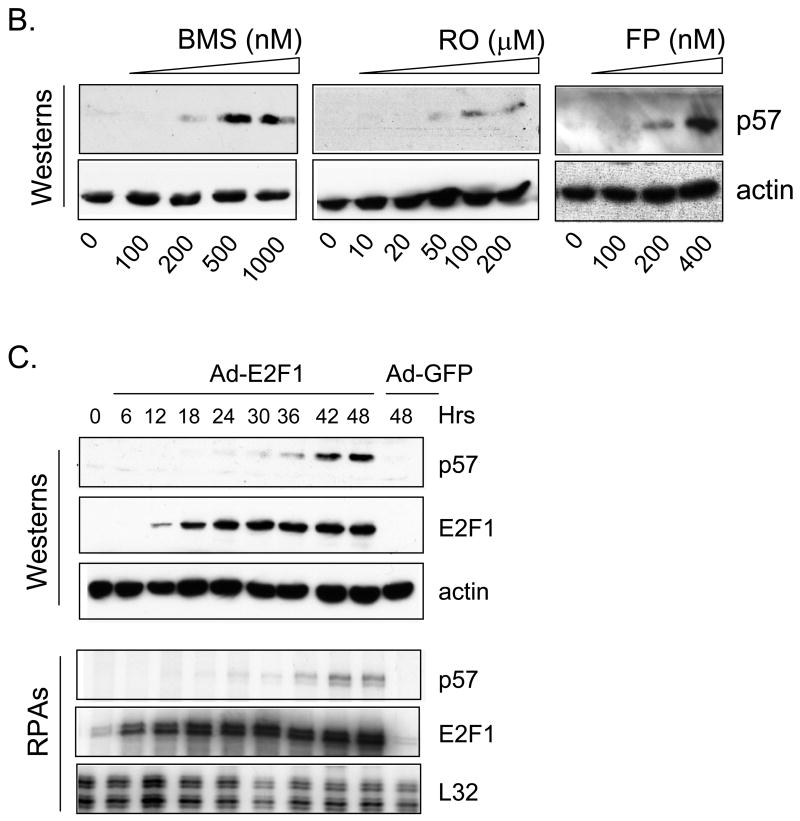
In previous work we demonstrated that small molecule cdk inhibitors led to an increase in cellular E2F1 protein (Ma et al., 2003a) and a decrease in E2F4 (Ma et al., 2004). Given the fact that these compounds are also potent inhibitors of transcription we were interested to determine if known cdk inhibitors could activate any E2F1-regulated genes, in spite of their general inhibition of transcription. Toward this end we performed RNase protection assays (RPAs) on various cell lines treated with various cdk inhibitor schedules. Data in Fig. 1A highlights an example in which the breast cancer cell line MDA-MB-231 was treated with 500 nM BMS-387032 and an RPA was used to measure expression of potential E2F1-regulated genes as a course of time. Consistent with cdk inhibition, most of the potential E2F regulated transcripts, Rb (Shan et al., 1994), p107 (Zhu et al., 1995), p21 (Hiyama et al., 1997), p27 (Wang et al., 2005) and cyclin A (Schulze et al., 1995), were silenced in spite of a great increase in the amount of E2F1 protein. The p53 and cdk4 mRNAs, which happen to be present in the kits used, but are not E2F1-regulated, were also diminished by BMS-387032 treatment. The E2F1 mRNA, which is tightly autoregulated (Johnson et al., 1994), was diminished by BMS-387032 treatment indicating that it was unable to activate its own transcription. However, there was one notable exception to the general rule - the p57 mRNA was potently activated by BMS-387032 treatment coincident with the induction of E2F1 protein at 12–18 hrs post-treatment. Fig. 1A reveals that the induction of the p57 mRNA in turn leads to a significant increase in the p57 protein by 24 hrs. Fig 1B reveals that roscovitine and flavopiridol share this activity with BMS-387032. This activation of p57 mRNA occurs in spite of the fact that 500 nM BMS-387032 completely blocked the phosphorylation of Ser 2 and Ser 5 of the RNA Polymerase II C-terminal domain (Pol II CTD) as evidenced by western blots using phosphopeptide-specific antibodies (Fig 1A, bottom) presumably inhibiting most RNA Pol II-driven transcription.
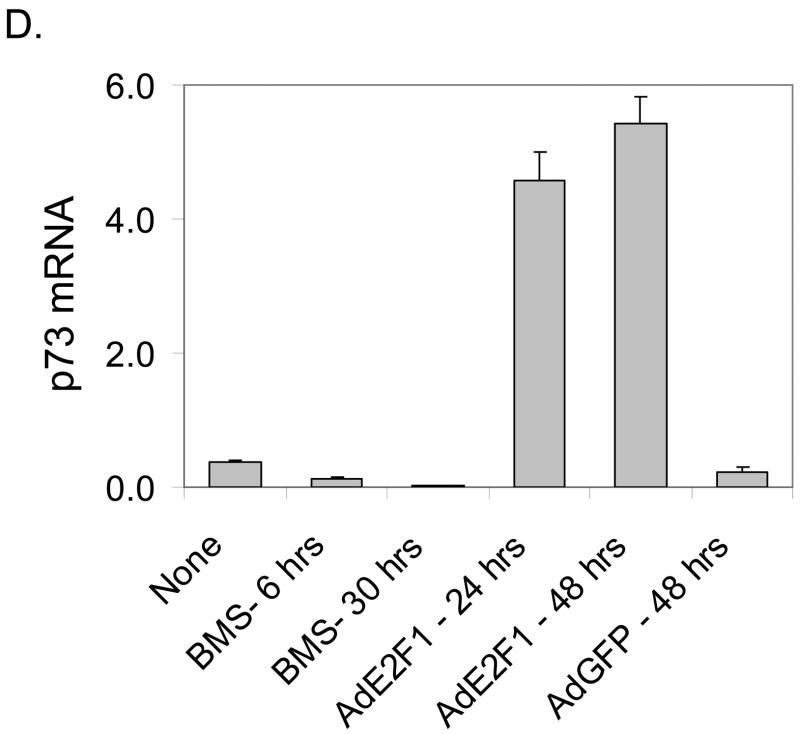
Figure 1. BMS-387032 induces expression of p57 mRNA while repressing all other transcripts.
A. MDA-MB-231 cells were treated with BMS-387032 (500 nM). Extracts of treated cells were prepared at the indicated times and subjected to either RPA or Western blot using the indicated probes/antibodies. L32 (RPA) and actin (Westerns) serve as loading controls. B. MDA-MB-231 cells were treated with either BMS-387032 (BMS), roscovitine (RO) or flavopiridol (FP) at the indicated concentrations for 48 hrs and Westerns and RPAs performed. Drug concentrations were chosen to have similar effects on cell growth and survival based on a previous comparison (Ma et al., 2004). C. MDA-MB-231 cells were infected (MOI 10) with an E2F1-expressing adenovirus or a control GFP-expressing virus for the indicated times and Westerns and RPAs performed. D. Representative RNA samples from panels A and C were subjected to RealTime PCR (Applied BioSystems Assay on Demand) analysis to measure p73 levels following BMS-387032 and Ad E2F1 treatments. Data indicate that BMS-387032 represses p73 as it does the majority of E2F1-regulate genes.
Unlike p21 and p27, p57 expression has not previously been linked to E2F regulation and so it was important to determine if E2F family members could indeed regulate p57 expression. To test this, MDA-MB-231 cells were infected with an E2F1-expressing adenovirus and the expression of E2F1 and p57 mRNAs and proteins were measured as a function of time. Fig. 1C reveals that the p57 mRNA and protein are both induced within 24 hrs of Ad-E2F1 infection. Previous work has shown that p21 Cip (Gartel et al., 1998; Gartel et al., 2000) and p27 Kip1 (Wang et al., 2005) can be transcriptionally activated by E2F1 via direct promoter interaction. The data in Fig. 1 A-C would be consistent with a model in which the stabilization of the E2F1 protein by BMS-387032 leads to the activation of the p57 promoter either directly or indirectly. One possible indirect mechanism would involve p73, which has been shown to activate the p57 expression by an unexplored mechanism (Balint et al., 2002; Merlo et al., 2005) and which has also been shown to be transcriptionally activated by E2F1 in an independent study (Irwin et al., 2000; Stiewe & Putzer, 2000). To determine if p73 might play a role in BMS-387032 induction of p57, we utilized quantitative PCR to measure the amount of p73 mRNA following BMS-387032 treatment or treatment with an E2F1 adenovirus as a positive control. Fig. 1D makes it apparent that p73 mRNA is readily induced by the E2F1 virus, but not by BMS-387032. Thus, E2F1-mediated upregulation of p73 cannot account for the induction of p57 by BMS-387032.
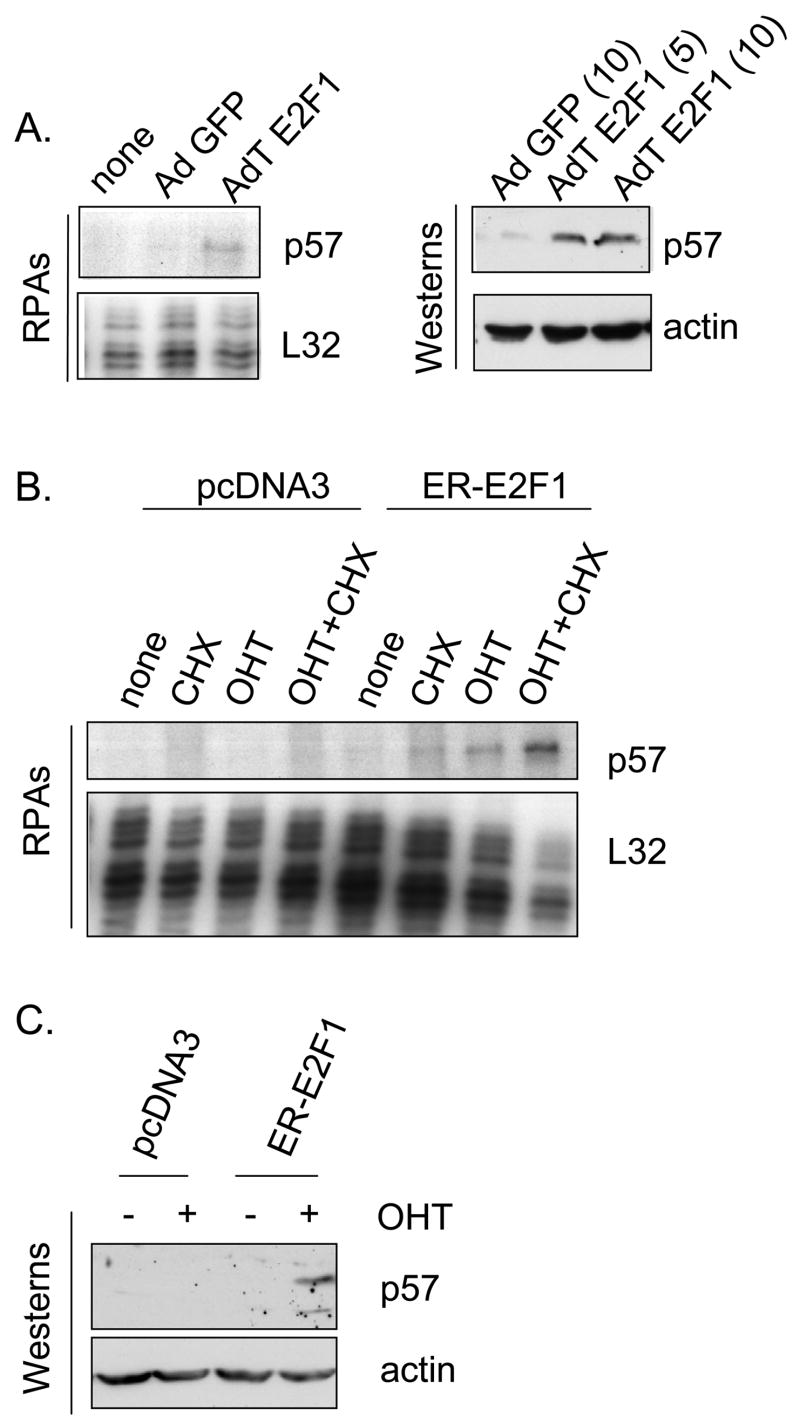
To rule out the possibility that E2F1 might activate the p57 promoter by an indirect mechanism, we turned to a series of previously described H1299 derivatives (Ma et al., 2003a; Ma et al., 2004; Ma et al., 2003b) having various proficiencies and deficiencies in E2F1 expression. Parental H1299 cells express relatively low levels of endogenous p57, however Fig. 2A reveals that infection with an AdE2F1-expressing adenovirus results in significant induction of the p57 mRNA and protein, as it does in MDA-MB-321 cells. To determine if activation of p57 by E2F1 could be direct, we utilized an H1299 cell line derivative (Ma et al., 2003b) that constitutively expresses an estrogen receptor-E2F1 fusion protein (ER-E2F1) (Vigo et al., 1999). In the absence of ligand, the ER-E2F1 fusion protein is excluded from the nucleus. However, upon addition of hydroxytamoxifen (OHT) the fusion protein rapidly enters the nucleus and induces transcription of E2F1 target genes (Vigo et al., 1999) without a requirement for new protein synthesis. The ER-E2F1 fusion cell line and a control line (derived to G418 resistance with empty pcDNA3) were treated with dimethysulfoxide solvent only (DMSO), with cycloheximide (CHX) alone, OHT alone or a combination of both CHX and OHT. Following 24h of treatment p57 message levels were measured by RPA. Fig. 2B reveals that the p57 mRNA levels increased in the presence of OHT alone and increased dramatically in the presence of both OHT and cycloheximide. Since numerous genes, are stabilized in the presence of cycloheximide (Lau & Nathans, 1987), the observed effects of cycloheximide alone or in combination with OHT are not unusual. These results suggest that the induction of the p57 mRNA is a direct effect of the ER-E2F1 fusion protein and does not involve synthesis of another protein that is regulated by E2F1, such as p73. Protein expression of p57 was also measured by western blot. In Fig. 2C, 48h after drug treatment, the p57 protein was also induced in the presence of OHT reflecting the increase in mRNA. Levels of p57 mRNA and protein did not change in response to OHT in the control cell line, as expected. These results demonstrate that p57 is a direct target of E2F1. To determine if the upregulation of p57 by BMS-387032 was dependent on E2F1 we treated an E2F1-deficient H1299 cell line (Ma et al., 2004) with BMS-387032 and examined p57 mRNA levels by RPA. The results, shown in the right panel of Fig. 3A, reveal that deficiency of E2F1 ablates upregulation of p57 following BMS-387032 treatment. Although the p57 protein is very difficult to detect in H1299 cells, Western analysis revealed a similar effect on p57 protein levels (Fig. 3B).
Figure 2. E2F1 upregulation of the p57 promoter is direct.
A. H1299 cells were infected with the indicated adenoviral expression vectors at a MOI of 10 (based upon plaque assay), or as specifically indicated. Forty-eight hrs after infection extracts were harvested and subjected to RPA or Western. B. H1299 control cells or a derivative expressing ER-E2F1 was subjected to OHT (4-hydroxytamoxifen, 300 nM) added to medium to induce ER-E2F1 nuclear accumulation. Cycloheximide (CHX) was used at a final concentration of 10 μg/ml to inhibit new protein synthesis. Cells were harvested after 24 hrs and p57 mRNA evaluated by RPA as described above. C. Same as in B, except a Western blot was performed following OHT treatments. The lower p57 band may represent an alternatively spliced p57 mRNA (Lee et al., 1995). Cycloheximide-treated cells were not including in panel C since p57 protein could not accumulate in its presence.
Figure 3. BMS-387032 activates the endogenous p57 mRNA and protein dependent upon E2F1.
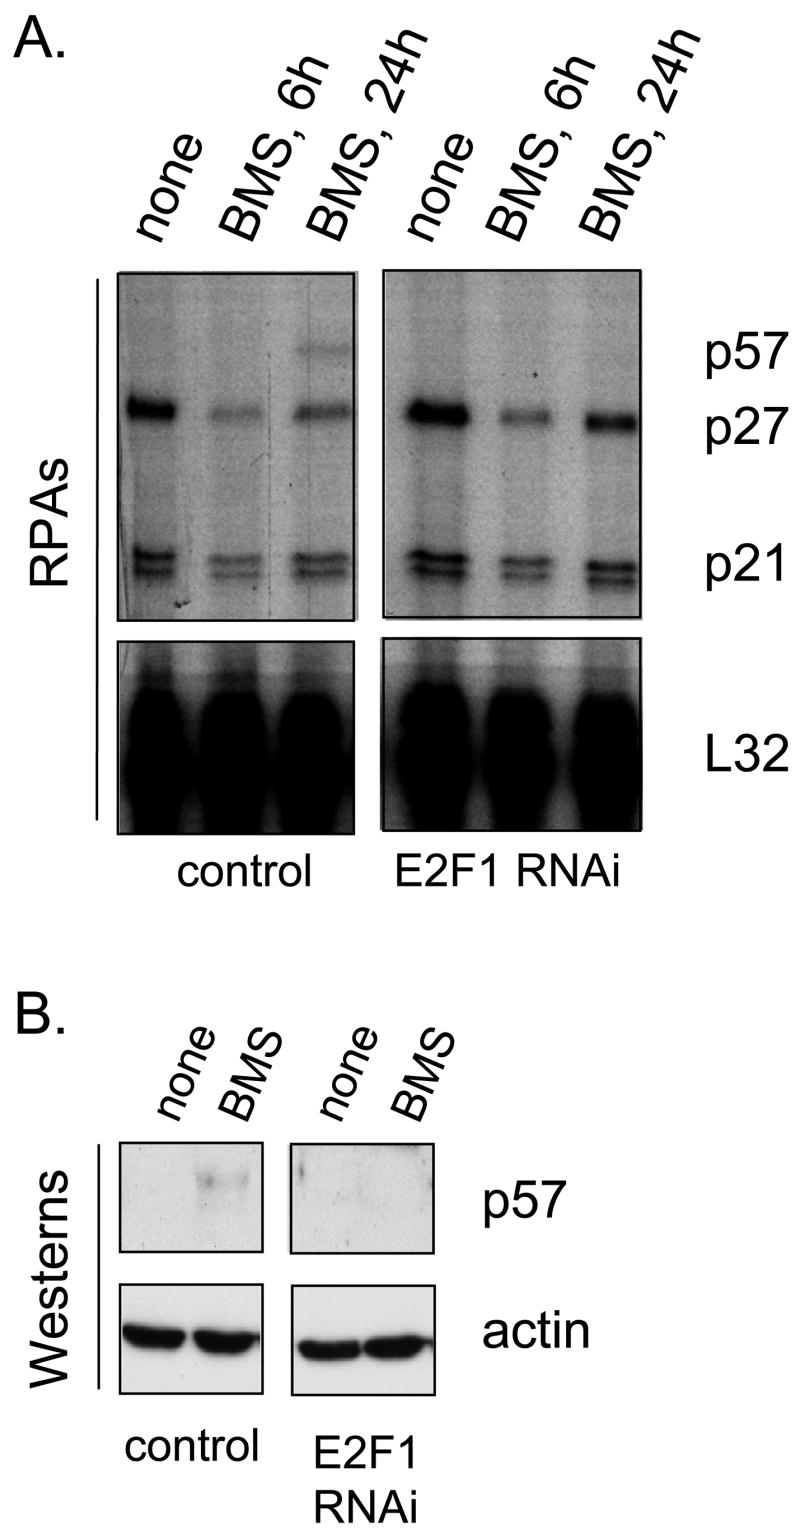
H1299 cells (left) or H1299 cells deficient in E2F1 (right) were treated with BMS-387032 (500 nM). These cell lines were previously derived and characterized (Ma et al., 2003a; Ma et al., 2004). At the indicated times after drug treatment RNA was harvested and RPAs (A) or Westerns (B) performed.
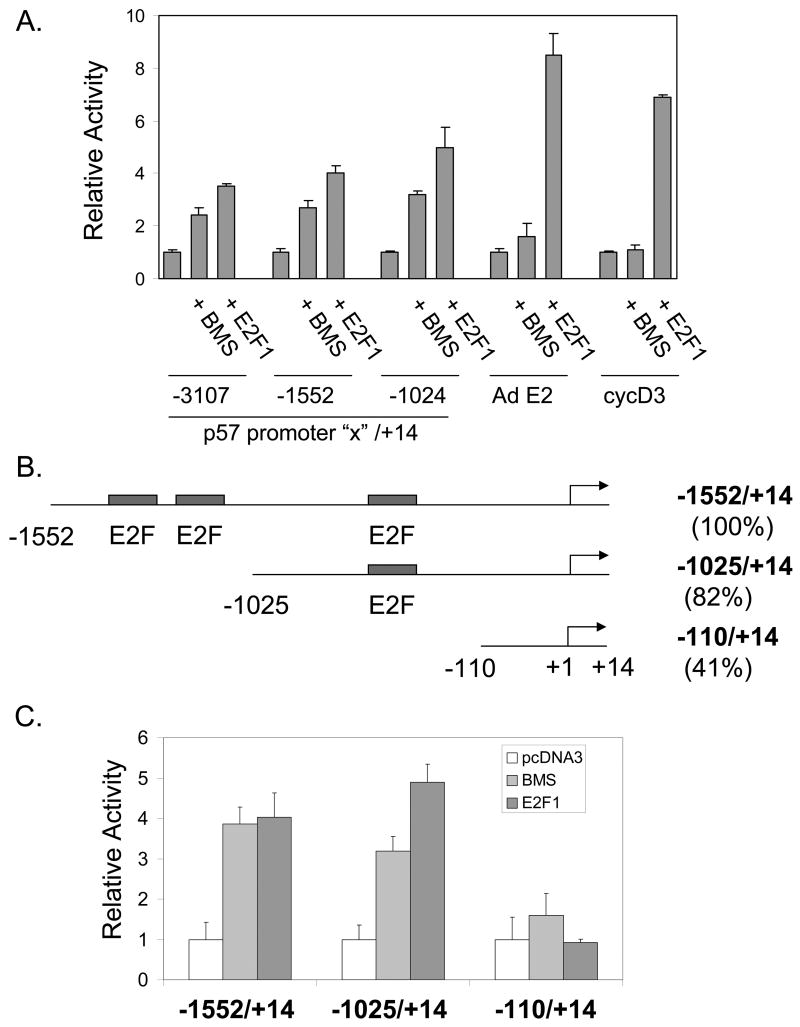
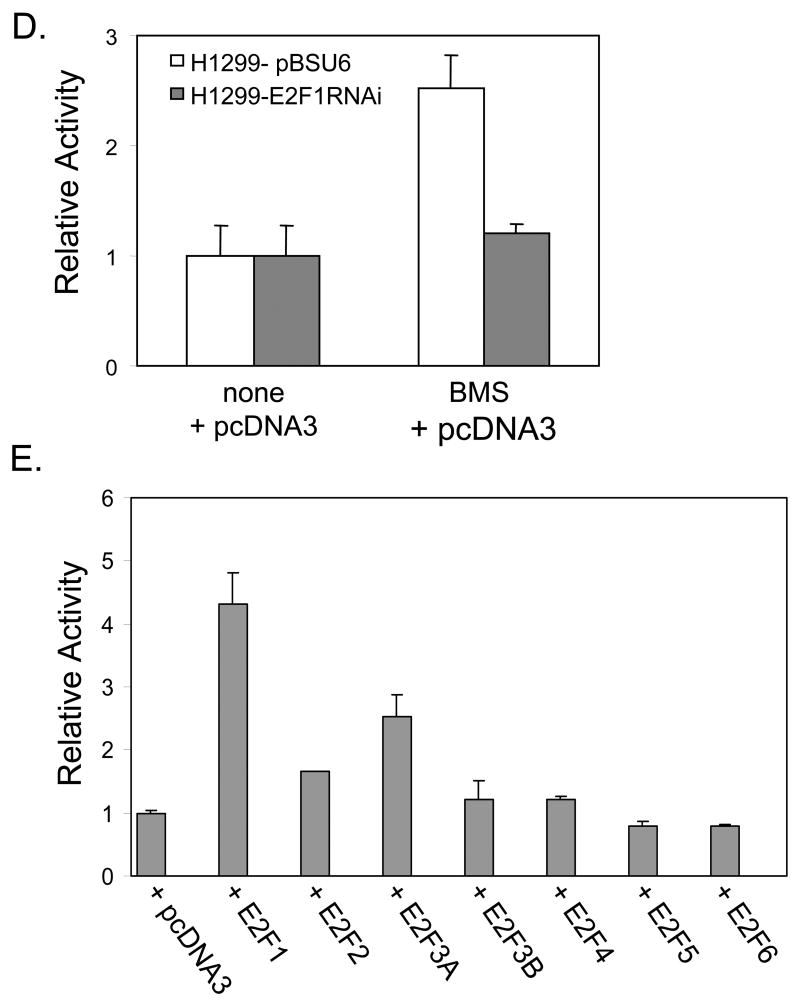
To better understand the mechanism by which BMS-387032 leads to upregulation of p57 we transfected H1299 cells with a series of reporter vectors driven by the three different subclones of the previously defined human p57 promoter (Alheim et al., 2003). The data (Fig. 4A) reveal that each p57 promoter reporter was activated by BMS-387032 or by E2F1. In contrast, two typical E2F regulated genes, the adenovirus E2 promoter (for which E2F is named (Kovesdi et al., 1987)) and the cyclin D3 promoter (Ma et al., 2003b), were not significantly activated by BMS-387032, as expected. Examination of the sequence of the p57 promoter revealed three potential binding sites for E2F1 (Fig. 4B). To determine if the BMS-387032 induction of the p57 promoter was dependent upon E2F binding sites a novel construct was generated p57 –110/+15 that lacks all three potential E2F binding sequences. This construct retains 42% of the basal activity of the -1552/+14 promoter, but it does not respond to BMS-387032 or E2F1 (Fig. 4C). To determine if the activation of the p57 promoter was indeed dependent on E2F1 we compared the BMS-387032 response of the −1025/+14 construct in H1299 cells and in H1299 derivates deficient in E2F1. The data (Fig. 4D) reveal that activation of the p57 reporter by BMS-387032 depends upon E2F1, reflecting the same behavior as the endogenous mRNA. In Fig. 4E, a series of E2F family expression vectors are compared for the ability to activate the −1025/+14 promoter. E2F1 appears to be by far the most potent inducer of p57, which is consistent with the E2F1 dependence observed in RNAi experiments. The other E2Fs may induce p57 indirectly by activation of endogenous E2F1 (Johnson et al., 1994).
Figure 4. BMS-387032 activates the cloned p57 promoter dependent upon E2F1.
A. H1299 cells were transfected in triplicate with the indicated promoter-reporter vectors, with (+ E2F1) or without an E2F1 expression vector, as indicated. Twenty-four hours following transfection cells were treated with 500 nM BMS-387032 (+ BMS) or not. Cells were harvested 48 hrs after transfection for determination of luciferase levels. The 5’-end of each p57 promoter constructs is indicate and the 3’ boundary for each is at +14, as indicated. B. This schematic indicates three potential E2F1 binding cites in the p57 promoter (not to scale). Relative basal activities (setting −1552/+14 to 100%) are indicated. C. Constructs described in B were transfected into H1299 cells with or without BMS-387032 or E2F1, as in A. To allow comparison of relative response each reporter is normalized to its own basal activity. D. H1299 cells or E2F1-deficient derivate cells were transfected/treated, as indicated, revealing that BMS-387032 cannot activate the p57 promoter in absence of E2F1. E. H1299 cells were transfected as in A with a series of E2F family expression vectors, as indicated (Cress et al., 1993; Cress & Nevins, 1994).
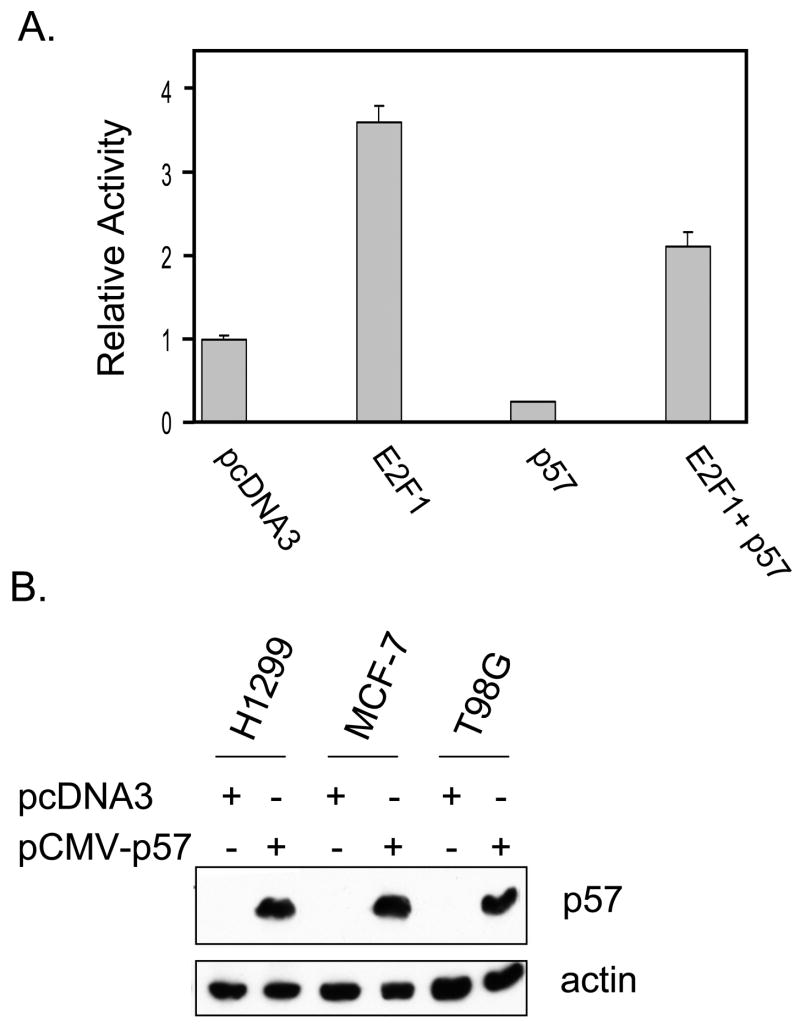
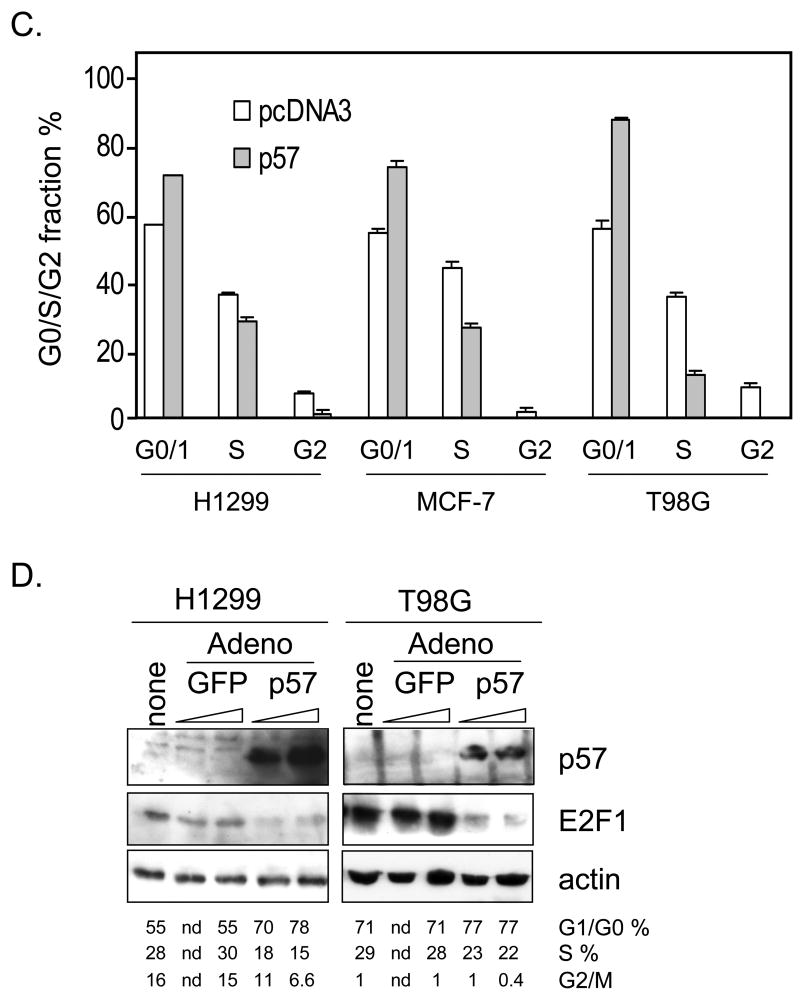
Having defined p57 as a BMS-387032 target it was important to establish potential biological importance. As a cdk inhibitor p57 overexpression is known to contribute to a reduction in E2F-driven transcription and to a reduction in cycle cell progression (Tsugu et al., 2000). To test this possibility a p57 expression vector was co-transfected together with E2F1 and the E2F1 promoter/reporter, which is tightly autoregulated by the cdk/Rb/E2F pathway (Johnson, 1995; Johnson et al., 1994). The results in Fig. 5A reveal that E2F1 potently activates its own promoter and that this activation is diminished by coexpression of p57. Exogenous p57 also reduces baseline expression of the E2F1 promoter indicating that p57 exerts control of the endogenous cdk/Rb/E2F pathway. Inhibition of E2F-driven transcription would be expected to reduce progression into S phase. To test this, asynchronous H1299, MCF-7 and T98G cells were transfected with a p57 expression vector, pCMV-p57, along with a surface GFP expression vector (pBB14) to mark transfected cells. Expression of exogenous p57 is evident in Western blots of transfected cells (see Fig. 5B). Fig. 5C reveals that p57 expression reduced the number of T98G cells in S phase by more than half, which is consistent with the known ability of these cells to growth arrest (Canhoto et al., 2000). Likewise, p57 expression reduced the number of MCF-7 S phase cells by approximately one-third. Reduction of H1299 cells in S phase was modest, but differences were statistically significant. In each cell line, there was near absence of cells with a G2/M DNA content following transfection with p57, indicating a strong effect of p57 on either entry into or exit from G2/M. Furthermore, in each line the reduction of cells in S and G2/M was matched by a corresponding increase in cells in G0/G1. Though p57 has been implicated as mediator of p73-induced apoptosis (Gonzalez et al., 2005) and shown to have pro-apoptotic effects in staurosporine-induced apoptosis in HeLa cells (Samuelsson et al., 2002), we saw no evidence that ectopic p57 expression induces apoptosis in the cell lines examined. Fig. 5A reveals that p57 is a very potent inhibitor of E2F1-driven transcription in a luciferase reporter. To determine if the same were true of endogenous E2F-regulated gene we obtained an adenoviral expression vector for mouse p57 (Stewart et al., 2004) from Dr. Matthew Stewart (University of Illinois at Urbana-Champaign). H1299 and T98G cells were infected with the Ad-p57 virus or with a control GFP-expressing adenovirus. Fig. 5D reveals that the viral vector expresses abundant p57 and that ectopic p57 significantly diminishes the number of cells in S phase. Furthermore, the p57 virus significantly inhibits E2F1 expression. These results clearly support the idea that p57 can negatively regulate E2F1 as it blocks cell cycle progression.
Figure 5. Exogenous p57 represses E2F1-driven transcription and reduces S phase cells.
A. H1299 cell were transfected with pGL2-E2F1 together with an empty vector (pcDNA3), E2F1 or p57 expression vectors as indicated. B. Asynchronous H1299, MCF-7 and T98G cells were co-transfected with pBB14 and pCMV-p57 or pcDNA3, as control, and expression of p57 was verified by Western blotting. C. Forty-eight hrs following transfection cells cycle status of GFP-positive cells was determined by PI staining. D. H1299 and T98G cells were infected with adenoviruses expressing either GFP or mouse p57. “None” indicates no virus. The ramp indicates increasing viral MOIs of 100 and 500 (based upon the Adeno-X Rapid Titer Kit). Western blots and cell cycle analysis were performed after 48 hrs. p57 induced changes in G1/G0 and S phase are statistically significant (Pα 0.05).
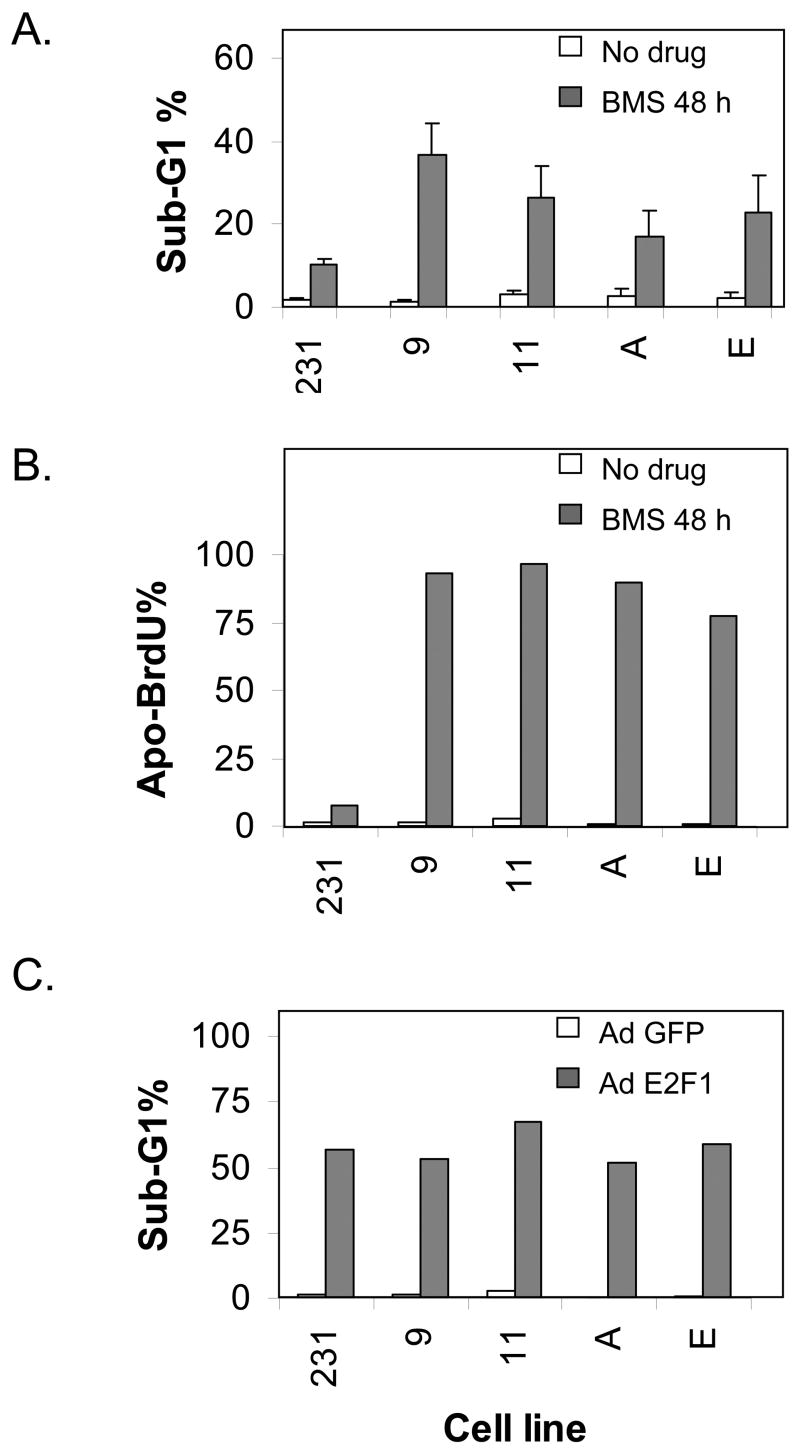
As an alternative method to investigate the biological role of p57 induction by BMS-387032 we used an RNA inhibitor approach to develop several stable MDA-MB-231 derivative cell lines that express diminished levels of p57. To accomplish this eight p57 small hairpin inhibitory RNA expression plasmids were obtained from The RNAi Consortium. The two most effective repressors of p57 expression in transient assays were then used to create stable p57-deficient cell lines. Four of these lines with lowest p57 protein were chosen for the further experiments. Two of these four, 231-p57RNAi-9 and 231-p57RNAi-11, were generated with shRNAi-10486. The other two lines, 231-p57RNAi-A and 231-p57RNAi-E, were generated using shRNAi-39678. Fig. 6A demonstrates that all four p57-knockdown cell lines express significantly less p57 than the parental cell line both before and after treatment with BMS-387032. E2F1 levels, before and after BMS-387032 treatment, are not detectably affected by p57 deficiency. Likewise, Fig. 6B demonstrates that p57 deficiency has only a modest affect on growth rate or saturation density suggesting that endogenous p57 is not a major determinant of the growth rate or survival of the cells under investigation in the absence of drug treatment. To determine if p57 deficiency would affect cellular response to BMS-387032, cells were treated with the drug and cell cycle properties and apoptosis was measured by FACS. Panel A of Fig. 7 demonstrates that the sub-G1 DNA content of treated cells was significantly greater in all four p57-deficient lines than control cells indicating a significant increase in apoptosis. In fact, the sub-G1 content observed in the p57-deficient cells was so high that it made the determination of cell cycle phases unreliable. To confirm that the sub-G1 DNA observed in p57 deficient cells was due to apoptosis TUNEL-staining using an Apo-BrdU kit (PharMingen) that is a more direct and sensitive measure of apoptosis were also performed, as shown in Fig. 7B. As a positive control the parental cell line and the four derivative lines were infected with an E2F1-expressing adenovirus. Fig. 7C demonstrates that the four cell lines do not differ from controls regarding sensitivity to E2F1-induced death. This indicates that the control cell line is not unexpectedly resistant to apoptosis. Taken together the results demonstrate that up regulation of p57 following drug treatment has a strong antiapoptotic effect.
Figure 6. Construction of four p57-deficient MDA-MB-231 cell lines.
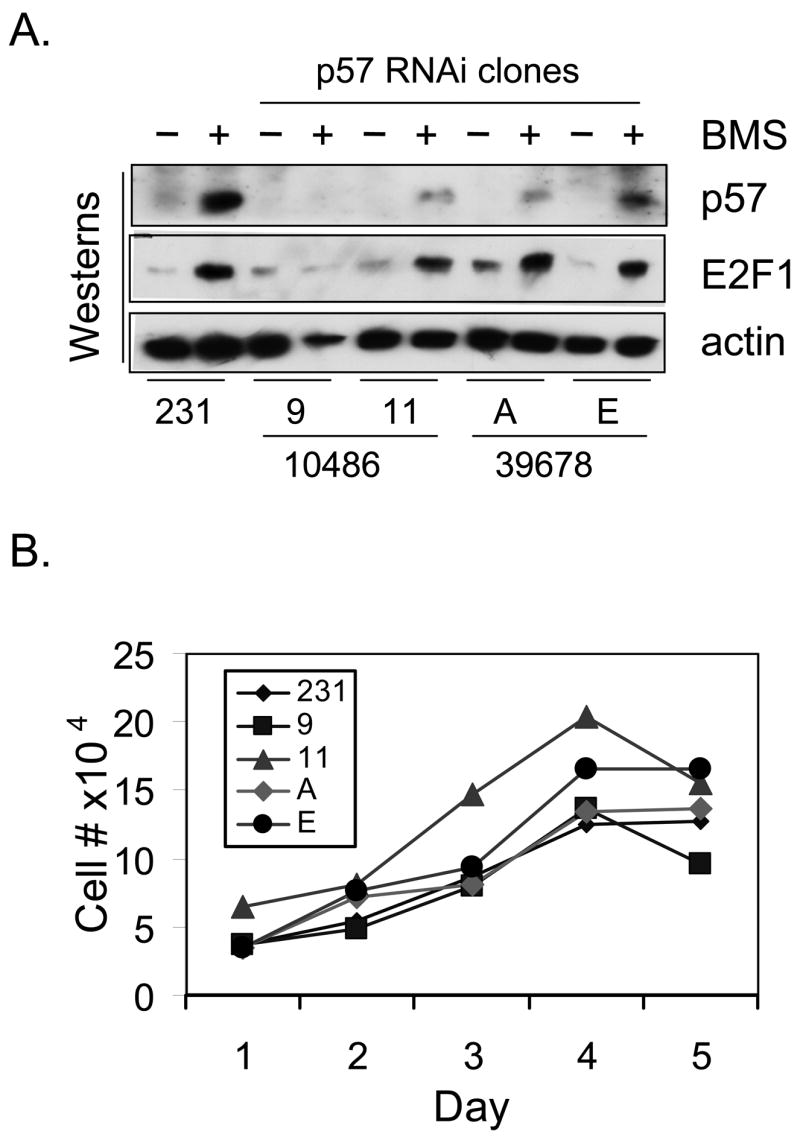
A. MDA-MB-231 cells and four p57-deficient derivatives 9, 11, A and E were treated with BMS-387032 for 48 hrs. Cell extracts were subjected to western blots using p57, E2F1 and actin antibodies as indicated. The fourth lane appears under loaded, and this is due to the large amount of cell death in this treatment. B. The growth rates of MDA-MB-231 cells and four p57-deficient derivatives were determined. Fourty thousand cells per were plated in 24-well plates in ten wells on day 0. Two wells were harvested by trypsin, collected and counted each day. Plotted numbers represent the average.
Figure 7. Small hairpin RNAi-mediated reduction in p57 levels increases sensitivity to BMS-387032.
A. Parental MDA-MB-231 cells and p57-deficient derivatives were treated with BMS-387032 for 48 hrs at which time cells were stained with PI and subjected to flow analysis in triplicate. B. Same as A except apoptosis was measured following staining with an APO-BrdU kit. C. Same as A, except cells were infected with either a control GFP-expressing adenovirus or an AdT-E2F1 to induce apoptosis.
DISCUSSION
We find that BMS-387032 activates the p57 promoter in an E2F1-dependent manner. Flavopiridol and roscovitine do so also, though we have primarily shown results with BMS-397032 since it is the most potent (in this regard) and it is the least studied of the three compounds. All three drugs induce E2F1 levels and repress levels of E2F4 (Ma et al., 2004). Furthermore, all three drugs are found to inhibit general transcription by RNA Polymerase II due to the inhibition of cdks involved in RNA polymerase II C-terminal domain phosphorylation (Camphausen et al., 2004; Chao & Price, 2001; Lu et al., 2004; MacCallum et al., 2005; Nuwayhid et al., 2006). BMS-397032 is a particularly potent inhibitor of CDK9-mediated phosphorylation of Ser2 in the RNA Polymerase II C-terminal domain with an IC50 of 20 nM. We cannot explain at this point why the p57 promoter is immune to the general inhibition by cdk inhibitors, however, it is clear from previous microarray studies that other E2F-regulated promoters (such as c-Myc) share this property (Lu et al., 2004). Future work will address this issue.
Most work on the transcriptional regulation of p57 has focused on its inactivation by promoter hypermethylation and it appears that silencing of p57 expression by promoter methylation occurs in a number of human cancers (Kikuchi et al., 2002; Shen et al., 2003; Shin et al., 2000). Nonetheless, a small number of papers have identified potential transcriptional regulators of p57. For example, the oncogenic fusion protein EWS-FLI-1 (generated by translocation) has been shown to repress p57 transcription (Dauphinot et al., 2001). However, the p57 promoter is unaffected by expression of WT FLI-1 and the fusion protein is unable to bind putative ETS binding sites in the promoter (Dauphinot et al., 2001). As another example, p73β has been found to greatly increase the expression of p57 mRNA, however there are no consensus binding sites for p73 in the p57 promoter. Furthermore, p73β expression has no effect on a p57 promoter-driven reporter and does not affect p57 mRNA stability (Balint et al., 2002). Thus, the mechanisms by which EWS-FLI-1 and p73β regulate p57 transcription appear indirect and remain obscure. BMS-387032 does not activate p73 in any of the cell lines that we have examined. In contrast to EWS-FLI-1 and p73β, the glucocorticoid receptor has been shown to directly activate the p57 promoter via a glucocorticoid response element approximately 5 kilobases upstream of the transcriptional start site (Alheim et al., 2003; Samuelsson et al., 1999). In the current work, we have shown that E2F1 is a direct and potent regulator of the p57 promoter and that E2F1 is necessary for BMS-387032 to induce p57 mRNA. Since E2F1 is known to activate transcription of the p73β promoter (Irwin et al., 2000), it is possible that p73 contributes to E2F1 upregulation of p57 (Balint et al., 2002). However, p73 does not appear necessary for E2F1-mediated regulation of p57 since a preexisting ER-E2F1 fusion protein can induce the endogenous p57 promoter even in the presence of cycloheximide, upon the addition of OHT.
Considered together with other recent work, the results presented herein indicate that all three members of the CDKN1 family are direct E2F1 targets (Gartel et al., 1998; Gartel et al., 2000; Wang et al., 2005). We consider three likely pathways to account for the functional relevance of p57 induction by E2F1. The first proposes that p57 induction contributes to E2F1-induced apoptosis. This model emerges from recent work (by others) that has shown that p73β-induced apoptosis involves p57 induction and that it can be blocked by RNAis targeting p57 (Gonzalez et al., 2005). Likewise, it has been shown that ectopic p57 sensitizes HeLa cells to staurosporine-induced cell death (Samuelsson et al., 2002). This model is not supported by our work since we did not see evidence that p57 overexpression resulted in significant apoptosis in the cell lines examined (not shown). Furthermore, our p57 RNAi results suggest that p57 is antiapoptotic. These results are not necessarily contradictory since, it is possible that p57 is necessary for p73-induced apoptosis, which we have not examined.
A second possibility is that p57 may play an important role in mitotic exit and reentry into G1. It has been shown that p57 mRNA is induced at the M-G1 transition and that functional knockdown of p57 gene expression by small interfering RNAs alters mitotic progression, yielding an increase of ana-telophase cells, the accumulation of late mitotic figures and the appearance of abnormalities in the subsequent interphase (Merlo et al., 2005). E2F1 has been found to regulate a number of genes that are thought to have specific mitotic roles (Ishida et al., 2001; Ma et al., 2002). Perhaps p57 represents one of a number of E2F1 cell cycle targets that mediates an effect on M-G1. In our experiments, we clearly detect a reduction of G2/M cells upon overexpression of p57. Future work will examine whether p57 mediates an essential role for E2F in mitosis.
A third model, which does not necessarily exclude the others, focuses on the known function of p57 as an inhibitor of E2F1-driven transcription. In this model, we would propose that E2F1 induction of p57 serves as a negative feedback loop that restrains excessive E2F1 activity. Our results clearly provide strong support this model--in that--overexpression of p57 restrains E2F1-driven transcription and results in reduced S phase fraction. More importantly our results demonstrate that p57-deficient cells are greatly sensitized to BMS-387032-induced cell death clearly supporting the hypothesis that this pathway serves as a negative feedback loop to promote survival.
The relevant targets of p57, in cells treated with BMS-387038, remains an open question. Since the cdks should largely be inhibited by the drug itself, it seems unlikely that inhibition of cdks is the primarily mechanism by which p57 promotes cell survival. Based on the literature we would propose that p57 may inhibit E2F1-driven transcription in a manner that does not require cdk inhibition. This model is not novel since a cdk/Rb-independent mechanism of E2F feedback has been well described for p21 (Delavaine & La Thangue, 1999). It was shown as early as 1996 that p21 could inhibit an E2F-driven promoter and that it could be found stably associated with E2F complexes, which at the time was presumed to involve a complex including E2F/Rb/cyclin/cdk2 with the association with E2F mediated by the cyclin/cdk2 bridge (Afshari et al., 1996). It has been shown that GST-p21 can bind to E2F1 and Dp1, and that p21 can inhibit transcription of a Gal4-E2F fusion in reporter assays in vivo and in a general transcription assay in vitro (Delavaine & La Thangue, 1999). A notable deficiency of this early work is that there was no examination of endogenous complexes, however a recent study has used chromatin immunoprecipitations assays to demonstrate that p21 is associated with the Wnt4 promoter (Devgan et al., 2005). Future work will address how p57 represses E2F1-driven transcription and BMS-387032-induced apoptosis.
Acknowledgments
The authors thank Dr. Jack Pledger, Scott Freeman and Jose Rodriguez for scientific input. We also acknowledge Gabriela Wright and Monica Dickinson for performing many experiments. In addition, we thank numerous colleagues for gifts of essential reagents and materials (see Methods and Materials). This work was supported by funds from the National Cancer Institute (CA90489-01, W.D.C.) and by the Molecular Biology, Flow Cytometry, Analytical Microscopy, and the Molecular Imaging Core Facilities of the Moffitt Research Institute.
References
- Afshari CA, Nichols MA, Xiong Y, Mudryj M. Cell Growth Differ. 1996;7:979–88. [PubMed] [Google Scholar]
- Alheim K, Corness J, Samuelsson MK, Bladh LG, Murata T, Nilsson T, Okret S. J Mol Endocrinol. 2003;30:359–68. doi: 10.1677/jme.0.0300359. [DOI] [PubMed] [Google Scholar]
- Balint E, Phillips AC, Kozlov S, Stewart CL, Vousden KH. Proc Natl Acad Sci U S A. 2002;99:3529–34. doi: 10.1073/pnas.062491899. [DOI] [PMC free article] [PubMed] [Google Scholar]
- Bayes M, Rabasseda X, Prous JR. Methods Find Exp Clin Pharmacol. 2004;26:639–63. [PubMed] [Google Scholar]
- Benson C, Kaye S, Workman P, Garrett M, Walton M, de Bono J. Br J Cancer. 2005;92:7–12. doi: 10.1038/sj.bjc.6602229. [DOI] [PMC free article] [PubMed] [Google Scholar]
- Blagden S, de Bono J. Curr Drug Targets. 2005;6:325–35. doi: 10.2174/1389450053765824. [DOI] [PubMed] [Google Scholar]
- Brideau AD, Banfield BW, Enquist LW. J Virol. 1998;72:4560–70. doi: 10.1128/jvi.72.6.4560-4570.1998. [DOI] [PMC free article] [PubMed] [Google Scholar]
- Camphausen K, Brady KJ, Burgan WE, Cerra MA, Russell JS, Bull EE, Tofilon PJ. Mol Cancer Ther. 2004;3:409–16. [PubMed] [Google Scholar]
- Canhoto AJ, Chestukhin A, Litovchick L, DeCaprio JA. Oncogene. 2000;19:5116–22. doi: 10.1038/sj.onc.1203893. [DOI] [PubMed] [Google Scholar]
- Caponigro F, Basile M, de Rosa V, Normanno N. Anticancer Drugs. 2005;16:211–21. doi: 10.1097/00001813-200502000-00014. [DOI] [PubMed] [Google Scholar]
- Chao SH, Price DH. J Biol Chem. 2001;276:31793–9. doi: 10.1074/jbc.M102306200. [DOI] [PubMed] [Google Scholar]
- Chen YN, Sharma SK, Ramsey TM, Jiang L, Martin MS, Baker K, Adams PD, Bair KW, Kaelin WG., Jr Proc Natl Acad Sci U S A. 1999;96:4325–9. doi: 10.1073/pnas.96.8.4325. [DOI] [PMC free article] [PubMed] [Google Scholar]
- Cress WD, Johnson DG, Nevins JR. Mol Cell Biol. 1993;13:6314–25. doi: 10.1128/mcb.13.10.6314. [DOI] [PMC free article] [PubMed] [Google Scholar]
- Cress WD, Nevins JR. J Virol. 1994;68:4213–9. doi: 10.1128/jvi.68.7.4213-4219.1994. [DOI] [PMC free article] [PubMed] [Google Scholar]
- Cress WD, Nevins JR. Curr Top Microbiol Immunol. 1996;208:63–78. doi: 10.1007/978-3-642-79910-5_3. [DOI] [PubMed] [Google Scholar]
- Dai Y, Grant S. Curr Oncol Rep. 2004;6:123–30. doi: 10.1007/s11912-004-0024-3. [DOI] [PubMed] [Google Scholar]
- Dauphinot L, De Oliveira C, Melot T, Sevenet N, Thomas V, Weissman BE, Delattre O. Oncogene. 2001;20:3258–65. doi: 10.1038/sj.onc.1204437. [DOI] [PubMed] [Google Scholar]
- DeGregori J, Kowalik T, Nevins JR. Mol Cell Biol. 1995;15:4215–24. doi: 10.1128/mcb.15.8.4215. [DOI] [PMC free article] [PubMed] [Google Scholar]
- Delavaine L, La Thangue NB. Oncogene. 1999;18:5381–92. doi: 10.1038/sj.onc.1202923. [DOI] [PubMed] [Google Scholar]
- Devgan V, Mammucari C, Millar SE, Brisken C, Dotto GP. Genes Dev. 2005;19:1485–95. doi: 10.1101/gad.341405. [DOI] [PMC free article] [PubMed] [Google Scholar]
- el-Deiry WS, Tokino T, Velculescu VE, Levy DB, Parsons R, Trent JM, Lin D, Mercer WE, Kinzler KW, Vogelstein B. Cell. 1993;75:817–25. doi: 10.1016/0092-8674(93)90500-p. [DOI] [PubMed] [Google Scholar]
- Fajas L, Landsberg RL, Huss-Garcia Y, Sardet C, Lees JA, Auwerx J. Dev Cell. 2002;3:39–49. doi: 10.1016/s1534-5807(02)00190-9. [DOI] [PubMed] [Google Scholar]
- Flores AM, Kassatly RF, Cress WD. Oncogene. 1998;16:1289–98. doi: 10.1038/sj.onc.1201633. [DOI] [PubMed] [Google Scholar]
- Funke-Kaiser H, Reichenberger F, Kopke K, Herrmann SM, Pfeifer J, Orzechowski HD, Zidek W, Paul M, Brand E. Hum Mol Genet. 2003;12:423–33. doi: 10.1093/hmg/ddg040. [DOI] [PubMed] [Google Scholar]
- Gartel AL, Goufman E, Tevosian SG, Shih H, Yee AS, Tyner AL. Oncogene. 1998;17:3463–9. doi: 10.1038/sj.onc.1202240. [DOI] [PubMed] [Google Scholar]
- Gartel AL, Najmabadi F, Goufman E, Tyner AL. Oncogene. 2000;19:961–4. doi: 10.1038/sj.onc.1203411. [DOI] [PubMed] [Google Scholar]
- Geng Y, Yu Q, Sicinska E, Das M, Schneider JE, Bhattacharya S, Rideout WM, Bronson RT, Gardner H, Sicinski P. Cell. 2003;114:431–43. doi: 10.1016/s0092-8674(03)00645-7. [DOI] [PubMed] [Google Scholar]
- Gonzalez S, Perez-Perez MM, Hernando E, Serrano M, Cordon-Cardo C. Cancer Res. 2005;65:2186–92. doi: 10.1158/0008-5472.CAN-04-3047. [DOI] [PubMed] [Google Scholar]
- Harper JW, Adami GR, Wei N, Keyomarsi K, Elledge SJ. Cell. 1993;75:805–16. doi: 10.1016/0092-8674(93)90499-g. [DOI] [PubMed] [Google Scholar]
- He Y, Cress WD. J Biol Chem. 2002;277:23493–9. doi: 10.1074/jbc.M202629200. [DOI] [PubMed] [Google Scholar]
- Hiebert SW, Lipp M, Nevins JR. Proc Natl Acad Sci U S A. 1989;86:3594–8. doi: 10.1073/pnas.86.10.3594. [DOI] [PMC free article] [PubMed] [Google Scholar]
- Hiyama H, Iavarone A, LaBaer J, Reeves SA. Oncogene. 1997;14:2533–42. doi: 10.1038/sj.onc.1201080. [DOI] [PubMed] [Google Scholar]
- Irwin M, Marin MC, Phillips AC, Seelan RS, Smith DI, Liu W, Flores ER, Tsai KY, Jacks T, Vousden KH, Kaelin WG., Jr Nature. 2000;407:645–8. doi: 10.1038/35036614. [DOI] [PubMed] [Google Scholar]
- Ishida S, Huang E, Zuzan H, Spang R, Leone G, West M, Nevins JR. Mol Cell Biol. 2001;21:4684–99. doi: 10.1128/MCB.21.14.4684-4699.2001. [DOI] [PMC free article] [PubMed] [Google Scholar]
- Jackson RJ, Adnane J, Coppola D, Cantor A, Sebti SM, Pledger WJ. Oncogene. 2002;21:8486–97. doi: 10.1038/sj.onc.1205946. [DOI] [PubMed] [Google Scholar]
- Jackson RJ, Engelman RW, Coppola D, Cantor AB, Wharton W, Pledger WJ. Cancer Res. 2003;63:3021–5. [PubMed] [Google Scholar]
- Jiang J, Matranga CB, Cai D, Latham VM, Jr, Zhang X, Lowell AM, Martelli F, Shapiro GI. Cancer Res. 2003;63:7410–22. [PubMed] [Google Scholar]
- Johnson DG. Oncogene. 1995;11:1685–92. [PubMed] [Google Scholar]
- Johnson DG, Ohtani K, Nevins JR. Genes Dev. 1994;8:1514–25. doi: 10.1101/gad.8.13.1514. [DOI] [PubMed] [Google Scholar]
- Johnson DG, Schwarz JK, Cress WD, Nevins JR. Nature. 1993;365:349–52. doi: 10.1038/365349a0. [DOI] [PubMed] [Google Scholar]
- Kalejta RF, Brideau AD, Banfield BW, Beavis AJ. Exp Cell Res. 1999;248:322–8. doi: 10.1006/excr.1999.4427. [DOI] [PubMed] [Google Scholar]
- Kamath AV, Chong S, Chang M, Marathe PH. Cancer Chemother Pharmacol. 2005;55:110–6. doi: 10.1007/s00280-004-0873-3. [DOI] [PubMed] [Google Scholar]
- Kikuchi T, Toyota M, Itoh F, Suzuki H, Obata T, Yamamoto H, Kakiuchi H, Kusano M, Issa JP, Tokino T, Imai K. Oncogene. 2002;21:2741–9. doi: 10.1038/sj.onc.1205376. [DOI] [PubMed] [Google Scholar]
- Kovesdi I, Reichel R, Nevins JR. Proc Natl Acad Sci U S A. 1987;84:2180–4. doi: 10.1073/pnas.84.8.2180. [DOI] [PMC free article] [PubMed] [Google Scholar]
- Kowalik TF, DeGregori J, Schwarz JK, Nevins JR. J Virol. 1995;69:2491–500. doi: 10.1128/jvi.69.4.2491-2500.1995. [DOI] [PMC free article] [PubMed] [Google Scholar]
- Lam LT, Pickeral OK, Peng AC, Rosenwald A, Hurt EM, Giltnane JM, Averett LM, Zhao H, Davis RE, Sathyamoorthy M, Wahl LM, Harris ED, Mikovits JA, Monks AP, Hollingshead MG, Sausville EA, Staudt LM. Genome Biol. 2001;2:RESEARCH0041. doi: 10.1186/gb-2001-2-10-research0041. [DOI] [PMC free article] [PubMed] [Google Scholar]
- Lau LF, Nathans D. Proc Natl Acad Sci U S A. 1987;84:1182–6. doi: 10.1073/pnas.84.5.1182. [DOI] [PMC free article] [PubMed] [Google Scholar]
- Lee MH, Reynisdottir I, Massague J. Genes Dev. 1995;9:639–49. doi: 10.1101/gad.9.6.639. [DOI] [PubMed] [Google Scholar]
- Leone G, DeGregori J, Jakoi L, Cook JG, Nevins JR. Proc Natl Acad Sci U S A. 1999;96:6626–31. doi: 10.1073/pnas.96.12.6626. [DOI] [PMC free article] [PubMed] [Google Scholar]
- Lu X, Burgan WE, Cerra MA, Chuang EY, Tsai MH, Tofilon PJ, Camphausen K. Mol Cancer Ther. 2004;3:861–72. [PubMed] [Google Scholar]
- Ma Y, Cress WD, Haura EB. Mol Cancer Ther. 2003a;2:73–81. [PubMed] [Google Scholar]
- Ma Y, Croxton R, Moorer RL, Jr, Cress WD. Arch Biochem Biophys. 2002;399:212–24. doi: 10.1006/abbi.2002.2761. [DOI] [PubMed] [Google Scholar]
- Ma Y, Freeman SN, Cress WD. Cancer Biol Ther. 2004;3:1262–1269. doi: 10.4161/cbt.3.12.1239. [DOI] [PubMed] [Google Scholar]
- Ma Y, Yuan J, Huang M, Jove R, Cress WD. J Biol Chem. 2003b;278:16770–6. doi: 10.1074/jbc.M212702200. [DOI] [PubMed] [Google Scholar]
- MacCallum DE, Melville J, Frame S, Watt K, Anderson S, Gianella-Borradori A, Lane DP, Green SR. Cancer Res. 2005;65:5399–407. doi: 10.1158/0008-5472.CAN-05-0233. [DOI] [PubMed] [Google Scholar]
- Matranga CB, Shapiro GI. Cancer Res. 2002;62:1707–17. [PubMed] [Google Scholar]
- Matsuoka S, Edwards MC, Bai C, Parker S, Zhang P, Baldini A, Harper JW, Elledge SJ. Genes Dev. 1995;9:650–62. doi: 10.1101/gad.9.6.650. [DOI] [PubMed] [Google Scholar]
- Merlo P, Fulco M, Costanzo A, Mangiacasale R, Strano S, Blandino G, Taya Y, Lavia P, Levrero M. J Biol Chem. 2005;280:30354–60. doi: 10.1074/jbc.M500635200. [DOI] [PubMed] [Google Scholar]
- Messmann RA, Ullmann CD, Lahusen T, Kalehua A, Wasfy J, Melillo G, Ding I, Headlee D, Figg WD, Sausville EA, Senderowicz AM. Clin Cancer Res. 2003;9:562–70. [PubMed] [Google Scholar]
- Meyerson M, Enders GH, Wu CL, Su LK, Gorka C, Nelson C, Harlow E, Tsai LH. Embo J. 1992;11:2909–17. doi: 10.1002/j.1460-2075.1992.tb05360.x. [DOI] [PMC free article] [PubMed] [Google Scholar]
- Misra RN, Xiao HY, Kim KS, Lu S, Han WC, Barbosa SA, Hunt JT, Rawlins DB, Shan W, Ahmed SZ, Qian L, Chen BC, Zhao R, Bednarz MS, Kellar KA, Mulheron JG, Batorsky R, Roongta U, Kamath A, Marathe P, Ranadive SA, Sack JS, Tokarski JS, Pavletich NP, Lee FY, Webster KR, Kimball SD. J Med Chem. 2004;47:1719–28. doi: 10.1021/jm0305568. [DOI] [PubMed] [Google Scholar]
- Nevins JR. Hum Mol Genet. 2001;10:699–703. doi: 10.1093/hmg/10.7.699. [DOI] [PubMed] [Google Scholar]
- Nuwayhid SJ, Hyde JF, Aleshin A, Walker DH, Arkin MR. Proc Amer Assoc Cancer Res. 2006;47:2079. [Google Scholar]
- Ortega S, Prieto I, Odajima J, Martin A, Dubus P, Sotillo R, Barbero JL, Malumbres M, Barbacid M. Nat Genet. 2003;35:25–31. doi: 10.1038/ng1232. [DOI] [PubMed] [Google Scholar]
- Osuga H, Osuga S, Wang F, Fetni R, Hogan MJ, Slack RS, Hakim AM, Ikeda JE, Park DS. Proc Natl Acad Sci U S A. 2000;97:10254–9. doi: 10.1073/pnas.170144197. [DOI] [PMC free article] [PubMed] [Google Scholar]
- Pines J. Cell Growth Differ. 1991;2:305–10. [PubMed] [Google Scholar]
- Polyak K, Lee MH, Erdjument-Bromage H, Koff A, Roberts JM, Tempst P, Massague J. Cell. 1994;78:59–66. doi: 10.1016/0092-8674(94)90572-x. [DOI] [PubMed] [Google Scholar]
- Samuelsson MK, Pazirandeh A, Davani B, Okret S. Mol Endocrinol. 1999;13:1811–22. doi: 10.1210/mend.13.11.0379. [DOI] [PubMed] [Google Scholar]
- Samuelsson MK, Pazirandeh A, Okret S. Biochem Biophys Res Commun. 2002;296:702–9. doi: 10.1016/s0006-291x(02)00912-9. [DOI] [PubMed] [Google Scholar]
- Sarruf DA, Iankova I, Abella A, Assou S, Miard S, Fajas L. Mol Cell Biol. 2005;25:9985–95. doi: 10.1128/MCB.25.22.9985-9995.2005. [DOI] [PMC free article] [PubMed] [Google Scholar]
- Schulze A, Zerfass K, Spitkovsky D, Middendorp S, Berges J, Helin K, Jansen-Durr P, Henglein B. Proc Natl Acad Sci U S A. 1995;92:11264–8. doi: 10.1073/pnas.92.24.11264. [DOI] [PMC free article] [PubMed] [Google Scholar]
- Senderowicz AM. Cancer Biol Ther. 2003a;2:S84–95. [PubMed] [Google Scholar]
- Senderowicz AM. Oncogene. 2003b;22:6609–20. doi: 10.1038/sj.onc.1206954. [DOI] [PubMed] [Google Scholar]
- Shan B, Chang CY, Jones D, Lee WH. Mol Cell Biol. 1994;14:299–309. doi: 10.1128/mcb.14.1.299. [DOI] [PMC free article] [PubMed] [Google Scholar]
- Shapiro GI. Clin Cancer Res. 2004;10:4270s–4275s. doi: 10.1158/1078-0432.CCR-040020. [DOI] [PubMed] [Google Scholar]
- Shapiro GI. J Clin Oncology. 2006;24:1770–83. doi: 10.1200/JCO.2005.03.7689. [DOI] [PubMed] [Google Scholar]
- Shapiro GI, Supko JG, Patterson A, Lynch C, Lucca J, Zacarola PF, Muzikansky A, Wright JJ, Lynch TJ, Jr, Rollins BJ. Clin Cancer Res. 2001;7:1590–9. [PubMed] [Google Scholar]
- Shen L, Toyota M, Kondo Y, Obata T, Daniel S, Pierce S, Imai K, Kantarjian HM, Issa JP, Garcia-Manero G. Blood. 2003;101:4131–6. doi: 10.1182/blood-2002-08-2466. [DOI] [PubMed] [Google Scholar]
- Sherr CJ. Cell. 1994;79:551–5. doi: 10.1016/0092-8674(94)90540-1. [DOI] [PubMed] [Google Scholar]
- Sherr CJ, Roberts JM. Genes Dev. 1999;13:1501–12. doi: 10.1101/gad.13.12.1501. [DOI] [PubMed] [Google Scholar]
- Shin JY, Kim HS, Park J, Park JB, Lee JY. Cancer Res. 2000;60:262–5. [PubMed] [Google Scholar]
- Stewart MC, Kadlcek RM, Robbins PD, MacLeod JN, Ballock RT. J Bone Miner Res. 2004;19:123–32. doi: 10.1359/JBMR.0301209. [DOI] [PubMed] [Google Scholar]
- Stiewe T, Putzer BM. Nat Genet. 2000;26:464–9. doi: 10.1038/82617. [DOI] [PubMed] [Google Scholar]
- Tan AR, Headlee D, Messmann R, Sausville EA, Arbuck SG, Murgo AJ, Melillo G, Zhai S, Figg WD, Swain SM, Senderowicz AM. J Clin Oncol. 2002;20:4074–82. doi: 10.1200/JCO.2002.01.043. [DOI] [PubMed] [Google Scholar]
- Tetsu O, McCormick F. Cancer Cell. 2003;3:233–45. doi: 10.1016/s1535-6108(03)00053-9. [DOI] [PubMed] [Google Scholar]
- Toyoshima H, Hunter T. Cell. 1994;78:67–74. doi: 10.1016/0092-8674(94)90573-8. [DOI] [PubMed] [Google Scholar]
- Tsugu A, Sakai K, Dirks PB, Jung S, Weksberg R, Fei YL, Mondal S, Ivanchuk S, Ackerley C, Hamel PA, Rutka JT. Am J Pathol. 2000;157:919–32. doi: 10.1016/S0002-9440(10)64605-6. [DOI] [PMC free article] [PubMed] [Google Scholar]
- Vigo E, Muller H, Prosperini E, Hateboer G, Cartwright P, Moroni MC, Helin K. Mol Cell Biol. 1999;19:6379–95. doi: 10.1128/mcb.19.9.6379. [DOI] [PMC free article] [PubMed] [Google Scholar]
- Wang C, Hou X, Mohapatra S, Ma Y, Cress WD, Pledger WJ, Chen J. J Biol Chem. 2005;280:12339–43. doi: 10.1074/jbc.C400536200. [DOI] [PubMed] [Google Scholar]
- Zhai S, Sausville EA, Senderowicz AM, Ando Y, Headlee D, Messmann RA, Arbuck S, Murgo AJ, Melillo G, Fuse E, Figg WD. Anticancer Drugs. 2003;14:125–35. doi: 10.1097/00001813-200302000-00006. [DOI] [PubMed] [Google Scholar]
- Zhai S, Senderowicz AM, Sausville EA, Figg WD. Ann Pharmacother. 2002;36:905–11. doi: 10.1345/aph.1A162. [DOI] [PubMed] [Google Scholar]
- Zhu L, Xie E, Chang LS. Mol Cell Biol. 1995;15:3552–62. doi: 10.1128/mcb.15.7.3552. [DOI] [PMC free article] [PubMed] [Google Scholar]


