

Abstract
Background
Earlier prospective studies have identified insulin action and secretion as predictors of T2DM in populations with normal glucose tolerance (NGT) and impaired glucose tolerance (IGT) (2-h OGTT < 7.8 and 7.8-11 mmol/L, respectively). Fasting plasma glucose (FPG), an additional and recently modified (normal <5.6 mmol/L) diagnostic criterion is associated with insulin secretion. We wanted to establish whether insulin secretion persists as an independent predictor of T2DM in individuals with no clinical evidence of impaired glucose regulation based on FPG and 2-h plasma glucose concentrations.
Methods
Insulin action (M, euglycemic-hyperinsulinemic clamp), insulin secretion (acute insulin response (AIR), IVGTT), and adiposity (%Fat, DXA or densitometry) were compared at baseline in 358 Pima Indians (232M/126F, 18-44 years old) with normal glucose regulation of whom 61 (35M/26F) developed diabetes (DIAB) during a median follow-up time of 7.6 years.
Results
In proportional-hazard analysis, % Fat (HR = 1.52, p = 0.03), M (HR = 0.51, p = 0.04) and AIR (HR = 0.64, p = 0.003) predicted the development of diabetes after adjustment for age and sex. In regression analysis adjusting for age, sex, %Fat and M at baseline, the non-diabetic group (NON-DM) had a higher AIR (p = 0.0002) than the DIAB group; the positive association of AIR with adiposity observed in the NON-DM group was absent in the DIAB group. Cumulative incidence rates (12y) for diabetes were highest (48%) in subjects with both M and AIR below the population median and lowest (11%) in subjects with both M and AIR above the population median.
Conclusion
AIR can predict diabetes prior to the current clinical indicators of impaired glucose regulation. Published in 2006 by John Wiley & Sons, Ltd.
Keywords: type 2 diabetes, insulin action, insulin secretion, obesity
Introduction
Both insulin resistance (IR) and inadequate insulin secretion are required for the development of type 2 diabetes [1,2]. In Pima Indians, a population with a high prevalence of type 2 diabetes [3], measures of insulin action and insulin secretion are independent predictors of diabetes in subjects with normal glucose tolerance (NGT) and impaired glucose tolerance (IGT) [4,5]. Longitudinal analyses in this population have described a progressive, independent deterioration in both variables at each stage of progression from NGT to IGT and IGT to diabetes [6]. Prospective [7-10] and longitudinal [10-12] analyses in other populations have verified these findings.
In 1997, an additional diagnostic category based on fasting plasma glucose (FPG) - impaired fasting glucose (IFG) - was added by the American Diabetes Association (ADA) [13] and was initially defined as a FPG of 6.1-6.9 mmol/L. The importance of including the FPG status along with glucose tolerance status in assessing one’s risk for developing T2DM is supported by an earlier cross-sectional study on Pima Indians where subcategories of impaired glucose homeostasis (i.e. isolated IFG, isolated IGT and IFG/IGT) appear to have different underlying metabolic abnormalities. Specifically, lower insulin secretion and higher basal hepatic glucose production are more related to isolated IFG than IGT and those with IFG ± IGT have higher fasting insulin concentrations [14]. Thus individuals with either isolated IFG or isolated IGT might represent distinct phenotypes with different natural histories for developing diabetes [12,15].
The definition of IFG was recently modified to a lower threshold of 5.6 mmol/L, since individuals with a fasting glucose between 5.6 and 6.1 mmol/L were found to have a greater risk for developing diabetes and its complications than individuals with a fasting glucose below 5.6 mmol/L [16]. As new evidence suggests [17], even lower fasting glucose concentrations can predict T2DM. The question of whether the underlying pathophysiology in these individuals remains identifiable is important in planning and implementing preventive strategies [18,19]. Although IR can be present for many years prior to development of T2DM, most individuals with IR never develop the disease [2]. However, since IFG has been shown to be related to insulin secretion rather than to IR, it would be important to know whether differences in the acute insulin response (AIR) exist prior to development of impaired fasting as well as 2-h glucose concentrations.
Specifically, while the first phase or AIR is ‘lost’ near or above a FPG of 6.1 mmol/L [13], whether this measure remains as a predictor of diabetes in individuals with a FPG < 5.6 mmol/L is not known. Therefore, the aim of this study was to determine whether insulin secretion (measured as AIR) can serve as a predictor of T2DM, independent of insulin action, in high-risk individuals while they still have not only NGT, but also normal FPG concentrations.
Materials and methods
Subjects and study design
This study includes 358 (232M/126F) subjects with a mean (±SD) age of 26 ± 6 years. All subjects are full-blooded Native Americans and at least 50% Pima (or closely related Tohono O’Odham) Indians. All potentially eligible volunteers from the Gila River Indian Community were invited to participate in an ongoing study (1982-present) of the metabolic determinants of type 2 diabetes as previously described [4]. All participants were healthy according to physical exam and routine laboratory tests. Inclusion in this specific data analysis required documented presence of normal glucose regulation according to 2003 ADA [16] diagnostic criteria (fasting and 2-h plasma glucose concentrations from an oral glucose tolerance test were <5.6 and <7.8 mmol/L, respectively) during their first visit to the NIH in-patient Clinical Research Unit (CRU) in Phoenix, AZ. None of the subjects took medication known to affect glucose or insulin metabolism for at least 1 month before baseline measurements. After giving written informed consent, subjects were admitted to the CRU where they were fed a weight-maintaining diet (50% of calories from carbohydrate, 30% from fat, and 20% from protein) and abstained from strenuous exercise. After at least 3 days on the diet, a series of tests was conducted to assess body composition and body fat distribution, glucose tolerance, insulin action, insulin secretion, and basal endogenous glucose output (EGO). Subjects were asked to return every 1-2 years either to the CRU in Phoenix, AZ or to the NIH Clinic in Sacaton, AZ for oral glucose tolerance tests (OGTT). All individuals who initially qualified for this data analysis had documentation of at least one follow-up OGTT in one of the NIH facilities. Diabetes was diagnosed by 2003 ADA criteria [16] or by documented clinical diagnosis confirmed in the medical record. The study was approved by the Institutional Review Board of the National Institute of Diabetes and Digestive and Kidney Diseases (NIDDK) and by the Tribal Council of the Gila River Indian Community.
Anthropometric measurements
Body composition was estimated by underwater weighing with simultaneous determination of residual lung volume by helium dilution [20] or by total body dual energy X-ray absorptiometry (DPX-L; Lunar Radiation, Madison, WI) [21]. Percent body fat, fat mass, and fat-free mass were calculated; measurements using the two different methods were made comparable using a previously derived conversion equation [22]. Waist and thigh circumferences were measured at the umbilicus and the gluteal fold in the supine and standing positions, respectively; the waist-to-thigh ratio was calculated as an index of body fat distribution [23].
Oral glucose tolerance test
After a 12-h overnight fast, glucose tolerance was determined by a 75-g OGTT with measurement of fasting, 30 min, and 2-h glucose and insulin concentrations and classified according to the 2003 ADA diagnostic criteria [16].
Intravenous glucose tolerance test
Insulin secretion was measured in response to a 25-g intravenous glucose bolus injected over 3 min [24,25]. The AIR to intravenous glucose was calculated as the average incremental plasma insulin concentration from the 3rd to the 5th min after the glucose bolus [25].
Two-step hyperinsulinemic-euglycemic glucose clamp
Insulin action was assessed at physiologic and supra-physiologic insulin concentrations during a 2-step hyperinsulinemic, euglycemic glucose clamp, as previously described [4,26]. In brief, after an overnight fast, a primed, continuous intravenous insulin infusion was administered for 100 min at a rate of 40 mU/m2 body surface area per min (low dose), followed by a second 100-min infusion rate at 400 mU/m2 body surface area per min (high dose). These infusions achieved steady-state plasma insulin concentrations of 876 ± 354 pmol/L and 15 582 ± 7800 pmol/L (mean ± SD), respectively. Plasma glucose concentrations were maintained at approximately 5.5 mmol/L, with a variable infusion of a 20% dextrose solution. As described previously [4,26], the rate of total insulin-stimulated glucose disposal (M) was calculated for the last 40 min of the low-dose and high-dose insulin infusions, and corrected for steady-state insulin plasma concentrations and EGO (EGO assumed to be 0 during the high dose). EGO was determined at baseline (120 min) and during the low-dose insulin infusion using a primed (30 μCi), continuous (0.3 μCi/ min) 3-3H-glucose infusion [4,26]. Suppression of EGO at the end of the low-dose insulin infusion was calculated as percentage of change from baseline. All measurements derived from the glucose clamp were normalized to estimated metabolic body size (EMBS, or fat-free mass +17.7 kg) [27].
Analytic procedures
Plasma glucose concentrations were determined by the glucose oxidase method (Beckman Instruments, Fullerton, CA) and plasma insulin concentrations by the Herbert modification [28] of the method of Yalow and Berson [29] or by an automated analyser (ICN Radiochemicals Inc, Costa Mesa, CA). Insulin assays were validated for comparable values.
Statistical analysis
Statistical analyses were performed using the programs of the SAS Institute Inc. (Cary, NC). For all analyses, plasma glucose and insulin variables and M and AIR were log-transformed to approximate a normal distribution. Subjects were identified as either non-diabetic (NON-DM) during follow-up or having developed diabetes (DIAB) during follow-up. General linear regression models were used to compare group relationships between percent body fat and metabolic characteristics at baseline after adjusting for age and sex. Risk factors for the development of diabetes were estimated by multivariate proportional-hazard analysis [30] adjusting for age and sex. To facilitate comparisons, criterion variables were standardized to mean = 0 and SD = 1. The cumulative incidence of diabetes over time was estimated by the Kaplan-Meier method [30] for those above and below the median for M-low and AIR. Follow-up time was truncated at 12 years to preserve proportionality of the models. The significance level was set at p < 0.05.
Results
Among the 358 subjects (232M/126F) who were followed, 297 (197M/100F) subjects remained NON-DM and 61 (35M/26F) DIAB as defined by 2003 ADA criteria [18] after a mean follow-up of 7.8 years (median, 7.6 years; range, 0.7-20.6 years). Age at baseline and follow-up time were not different between the groups. Among the 297 NON-DM subjects, 214 remained normal glucose regulation, 40 developed IFG with NGT, 33 developed IGT with normal fasting glucose, and 10 developed both IFG and IGT at the last follow-up visit either to the NIH in-patient CRC or out-patient NIH Clinic.
Subject characteristics (Table 1)
Table 1.
Subject characteristics at baseline and relative hazard ratios for diabetes (n = 358)
| Variable | Means ± SD (Range) | HR (95% CI)* | p |
|---|---|---|---|
| A. Descriptive | - | - | - |
| Age (years) | 26.4 ± 6.0 (18.0-44.2) | 0.82 (0.61, 1.11) | 0.20 |
| Weight (kg) | 90.7 ± 21.1 (45.5-181.1) | 1.53 (1.21, 1.93) | 0.0004 |
| Height (cm) | 167 ± 8 (148-191) | 1.27 (0.89, 1.82) | 0.19 |
| Body fat (%) | 31 ± 8 (9-50) | 1.80 (1.29, 2.51) | 0.0006 |
| Waist circ (cm) | 105 ± 17 (66-152) | 1.54 (1.20, 1.97) | 0.0007 |
| B. Metabolic | - | - | - |
| OGTT glucose (mmol/L) | - | - | - |
| Fasting | 4.8 ± 0.4 (3.1-5.5) | 1.23 (0.91, 1.67) | 0.17 |
| 30 min | 7.7 ± 1.4 (4.4-12.5) | 1.38 (1.07, 1.77) | 0.01 |
| 2 h | 6.0 ± 1.1 (2.8-7.7) | 1.62 (1.20, 2.20) | 0.002 |
| OGTT insulin (pmol/L) | - | - | - |
| Fasting | 222 ± 114 (30-744) | 1.45 (1.17, 1.78) | 0.0006 |
| 30 min | 1506 ± 996 (198-7320) | 1.02 (0.82, 1.27) | 0.86 |
| 2 h | 894 ± 714 (102-5430) | 1.27 (1.04, 1.56) | 0.02 |
| Insulin secretion (IVGTT) | - | - | - |
| AIR (pmol/L) | 1584 ± 1008 (204-7518) | 0.85 (0.66, 1.08) | 0.18 |
| Insulin action (Clamp) | - | - | - |
| (mg glucose/kg EMBS/min) | - | - | - |
| EGO | 1.89 0.24 (1.30-2.85) | 1.16 (0.91, 1.47) | 0.24 |
| % suppression EGO (M-low) | 84 ± 17 (22-100) | 0.69 (0.55, 0.88) | 0.002 |
| M-low (876)† | 3.22 ± 1.28 (1.34-11.4) | 0.43 (0.27, 0.67) | 0.0002 |
| M-hi (15 582)† | 9.22 ± 2.09 (4.34-16.9) | 0.63 (0.49, 0.82) | 0.0005 |
Insulin and glucose values were log-transformed (log10) for statistical analyses.
HR = hazard ratios (95% confidence intervals) for diabetes; Variables standardized to mean = 0, SD = 1; adjusted for age, sex.
Steady-state plasma insulin concentrations during low (M-low) and high (M-hi) insulin infusion periods.
Unadjusted means ± SD and ranges at baseline for physical and metabolic characteristics of the study cohort are presented. Separately, after adjustment for age, sex and follow-up time, each anthropometric measurement (except for height) was a predictor of diabetes with percent body fat having the highest relative hazard ratio (HR = 1.8, p = 0.0006).
For metabolic characteristics measured during the OGTT, intravenous glucose tolerance test (IVGTT), and hyperinsulinemic-euglycemic clamp, plasma fasting and 2-h insulin and 30-min and 2-h glucose concentrations of the OGTT, and measures of whole body (M-low, M-hi) and hepatic (% EGO suppression) insulin sensitivity were individual predictors of type 2 diabetes. When these variables were adjusted for percent body fat, fasting and 2-h plasma insulin concentrations were no longer predictors and AIR was a predictor (HR = 0.71, p = 0.01). The results for the other variables were unchanged (data not shown).
Predictors of diabetes (Table 2)
Table 2.
Predictors of diabetes: standardized hazard ratios (HR)
| Model 1 |
Model 2: fasting insulin added |
||||
|---|---|---|---|---|---|
| Variable* | HR (95% CI) | p | Variable* | HR (95% CI) | p |
| Age | 0.76 (0.6, 1.0) | 0.06 | Age | 0.76 (0.6, 1.0) | 0.06 |
| Sex | 0.71 (0.4, 1.4) | 0.31 | Sex | 0.72 (0.4, 1.4) | 0.31 |
| Pfat | 1.52 (1.0, 2.22) | 0.03 | Pfat | 1.39 (0.9, 2.1) | 0.11 |
| AIR | 0.64 (0.5, 0.9) | 0.0003 | AIR | 0.61 (0.5, 0.8) | 0.002 |
| M-low | 0.51 (0.3, 0.98) | 0.04 | M-low | 0.53 (0.3, 1.0) | 0.05 |
| M-hi | 0.80 (0.6, 1.2) | 0.23 | M-hi | 0.87 (0.6, 1.3) | 0.48 |
| EGO | 1.20 (0.9, 1.6) | 0.17 | EGO | 1.18 (0.9, 1.5) | 0.20 |
| % supp EGO | 0.93 (0.7, 1.2) | 0.63 | % supp EGO | 0.94 (0.7, 1.3) | 0.68 |
| Fx insulin | 1.24 (0.9, 1.7) | 0.16 | |||
Standardized variable = ((individual value - variable mean)/SD of variable), for variables other than sex. Sex coded as 1 = male; 2 = female.
When age, sex, percent body fat and the metabolic variables for EGO, insulin action (M-low, M-high, % EGO suppression) and secretion (AIR) were included together in a proportional-hazard regression model (Model 1), M-low (HR = 0.51, p = 0.04), AIR (HR = 0.64, p = 0.003) and percent body fat (HR = 1.52, p = 0.03) were independent predictors for diabetes. When fasting plasma insulin concentration was added to the model, percent body fat was no longer an independent predictor for diabetes (Model 2), whereas adding either plasma 2-h insulin or 30-min or 2-h plasma glucose concentrations during the OGTT and/or deleting EGO, M-high and % EGO suppression did not alter the initial results (data not shown). Regardless of any regression model, FPG concentration was not a predictor of T2DM in this cohort.
Group comparisons (NON-DM vs DIAB) of relationships between predictor variables at baseline (Figure 1)
Figure 1.
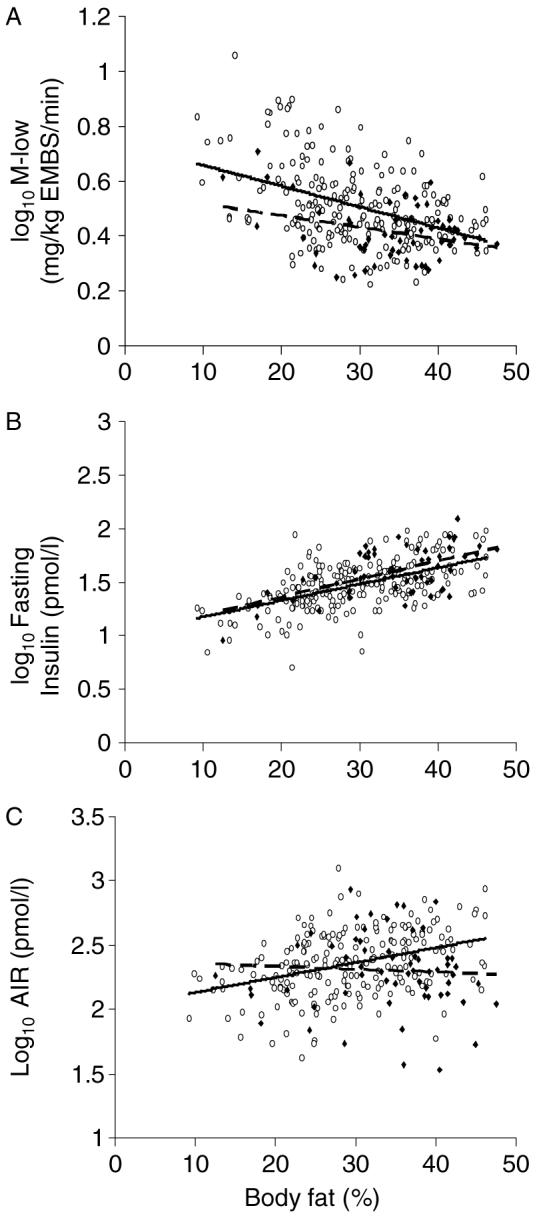
Group comparisons (NON-DM = open circles, solid line; DIAB = closed diamonds, dashed line) of the baseline relationships between percent body fat and: A) M-low (mg/kg EMBS/min), B) fasting plasma insulin concentration (pmol/L), and C) AIR (pmol/L). M-low, AIR and fasting plasma insulin values are log-transformed and adjusted for age and sex
In regression analysis, relationships between percent body fat and fasting plasma insulin concentration, M-low, and AIR at baseline were compared between the NON-DM and DIAB groups, after adjustment for age and sex. As expected, percent body fat was negatively associated with M-low in both groups (Figure 1(A)). However, for a given percent body fat, the NON-DM group had a higher M-low (β = 0.050, p = 0.006) than those subjects who were subsequently DIAB. Furthermore, while there was a similar relationship between percent body fat and fasting plasma insulin concentrations in both groups (Figure 1(B)), the relationship between percent body fat and AIR was significant in the NON-DM group (β = 0.014, p < 0.0001) and was non-significant in the DIAB group (β = 0.007, p = 0.33); these slopes were also different from each other (Group × Percent body fat interaction: β = -0.011, p = 0.02) (Figure 1(C)).
Cumulative incidence rates (Figure 2)
Figure 2.
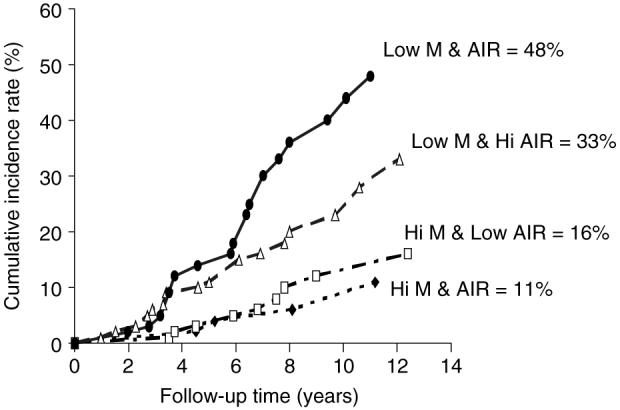
Cumulative incidence rates by 12 years for subjects who at baseline had either: (1) both M-low and AIR above the population median (closed diamond, n = 71); (2) M-low above and AIR below the population median (open square, n = 108); (3) M-low below and AIR above the population median (open triangle, n = 107), or (4) both M-low and AIR below the population median (closed circle, n = 72). Statistical differences between progression rates for group 1 versus 2, 3, or 4 p < 0.0001; group 2 versus 3 or 4 p < 0.0001; group 3 versus 4 p = 0.22
Subjects were stratified into four groups according to whether their M-low and AIR values were above or below the subject population median at baseline; 12-year cumulative incidence rates for diabetes were calculated for each group. Of those who developed T2DM in this cohort, 85% had developed the disease within 12 years of follow-up time. Those with both M-low and AIR below the median had the highest incidence rates (48%), while those with both M-low and AIR above the median had the lowest incidence rates (11%) (Figure 2).
Discussion
Insulin secretion (AIR) is an early predictor of diabetes, independent of insulin action (M-low) and adiposity (percent body fat), in a group of Pima Indians with no clinical evidence of impaired glucose regulation. At baseline, the DIAB group had lower insulin sensitivity and a lower AIR for a given degree of adiposity than the NON-DM group. The positive association between AIR and adiposity in the NON-DM group was absent in the DIAB group. Those individuals with an M-low value above the population median had lower rates of development, regardless of AIR status.
Although Pima Indians have a high prevalence of diabetes [3], the pathophysiological processes responsible for its development in this population are not unique. Therefore, these results are likely to be applicable to other populations as well. Indeed, earlier prospective [4,5] and longitudinal [6] analyses in Pima Indians, as well as in other populations [8,9], have demonstrated the independent contributions of declining insulin action (M) and insulin secretion (AIR) in the pathophysiology of diabetes. However, these studies categorized individuals based solely on the glucose tolerance status defined by the 2-h glucose concentration during an OGTT and some studies combined both NGT and IGT individuals in identifying predictors of diabetes.
Since then, IFG, defined as a fasting glucose between either 5.6 or 6.1 mmol/L to 6.9 mmol/L has been identified as another important variable in predicting the development of diabetes [31]. Additional cross-sectional analyses in Pima Indians [14] and longitudinal analyses primarily in Caucasians [12,15] identified different underlying metabolic abnormalities depending on whether one had isolated IFG or IGT. Therefore, earlier studies which categorized subjects based solely on glucose tolerance (2-h glucose levels during an OGTT) might have confounded results by including individuals with isolated IFG in the NGT category or isolated IGT with normal FPG. Thus, in the past M and AIR were identified as predictors of T2DM among individuals with a wider range of fasting and/or 2-h plasma glucose levels than the present study where it is confirmed that differences in these parameters are present in hi-risk individuals within a narrower range of normal FPG levels (<5.6 mmol/L). In fact, AIR, but not FPG, predicted T2DM in this current cohort. It is interesting to note that FPG could independently predict T2DM if we included additional subjects from our database using the 1997 criteria for FPG (<6.1 mmol/L). It is also noted that while M and AIR are significant independent predictors regardless of which FPG level is used (<5.6 or <6.1 mmol/L), with the more stringent level, the HR for AIR becomes a relatively ‘stronger’ predictor while the HR for M is not as strong when comparing proportional-hazard models for each of these two different populations (data not shown).
Adiposity was also identified as a predictor of diabetes. Although adiposity is closely associated with IR and is generally accepted as a major contributor to its development [26,27], in the current cohort, adiposity was a predictor independent of insulin sensitivity. This result could be due to variability in the measurement of insulin sensitivity itself with the euglycemic clamp. Also, the impact of adiposity on insulin action may not be completely accounted for in the measurement of M-low, M-high or % suppression EGO. When fasting plasma insulin concentration is added to the proportional hazards model, percent fat is no longer an independent predictor. While this may be due to an association between adiposity and fasting plasma concentration, fasting insulinemia may represent additional aspects of insulin physiology that are not directly measured during the euglycemic clamp [32].
Indeed, as recently reviewed by Ferrannini et al. [33], pancreatic hypersecretion and impaired clearance of insulin are inherent characteristics of obesity. While the mechanism(s) responsible for the associations between adiposity and insulin action and secretion are still unknown [10], variables such as visceral or hepatic fat distribution [34], adipocyte size [35], or secretion of various adipokines that either increase (e.g. adiponectin) or attenuate (e.g. TNF-α) insulin sensitivity [36,37] are metabolic characteristics of adiposity that might contribute to aspects of insulin action and insulin secretion that are not measured directly by the clamp and IVGTT procedures, respectively. Indeed, previous work in our laboratories has identified both adipocyte size [35] and fasting plasma adiponectin levels [38] as independent predictors of diabetes.
Group differences at baseline in the associations between percent body fat and AIR suggest that the relationship between adiposity and insulin secretion is not straightforward. Specifically, adiposity was associated with AIR in the NON-DM group but not in the DIAB group. A diminished first phase insulin response with increasing adiposity in the DIAB group may simply reflect a chronic, relative hyperinsulinemia that results in a lower ‘ready reserve’ of secretory granules in the pancreatic beta cells [32]. An alternative hypothesis is that some metabolic characteristic of adipose tissue in the DIAB group might attenuate the first phase insulin response. Finally, this ‘disconnect’ may represent a polymorphism of some common genetic locus for both adiposity and AIR.
Inadequate pancreatic beta cell function, whether due to an inherent functional defect or limited beta cell mass, is an essential factor in the development of diabetes, independent of both IR and adiposity [4,5]. This metabolic characteristic has a significant heritable component given that impaired insulin secretion (AIR) has been documented in subjects with NGT who are first degree relatives of individuals with diabetes [39-41]. In Pima Indians, AIR was identified as a highly familial trait (heritability = 0.70 at 10 min) after controlling for percent body fat and insulin action [42]. Identifying genetic loci for insulin secretory function or beta cell mass would greatly enhance our understanding of this relationship and improve our ability to detect those individuals with the highest risk of developing diabetes, especially at an early age.
While the most common strategy for preventing diabetes thus far has been to improve insulin sensitivity (and thereby lessen beta cell demand), as documented in various intervention studies in pre-diabetic individuals [18,19], recent strategies to directly improve insulin secretion may be useful in certain high-risk individuals. While newer diabetes treatments now focus on different mechanisms to improve insulin secretion, it remains to be determined whether this same strategy is also effective for preventing diabetes. These data indicate that this may be possible since an insulin secretory defect is present and can be detected, even prior to any clinical evidence of impaired glucose regulation using the most current and rigorous standards.
In summary, insulin secretion can independently predict the development of diabetes, independent of insulin action and adiposity, even in conditions of apparent normal glucose regulation. Although IR is an important risk factor in the development of diabetes, the evaluation of first phase insulin response, in those with both normal fasting glucose and glucose tolerance, may be useful for identifying which obese, insulin resistant individuals will be more likely to develop the disease and thus benefit the most from early intervention therapies.
Acknowledgements
We thank the members and leaders of the Gila River Indian Community, whose continuing cooperation has made this study possible. We also gratefully acknowledge the nurses and staff of the CRU for their invaluable contributions.
This research was supported by the Intramural Research Program of the NIH, NIDDK.
Footnotes
This article is a U.S. Government work and is in the public domain in the USA.
References
- 1.DeFronzo RA. Lilly lecture 1987: the triumvirate: β-cell, muscle, liver: a collusion responsible for NIDDM. Diabetes. 1988;37:667–687. doi: 10.2337/diab.37.6.667. [DOI] [PubMed] [Google Scholar]
- 2.Bogardus C. Metabolic abnormalities in the development of non-insulin dependent diabetes mellitus. In: LeRoith D, Taylor SI, Olewski JM, editors. Diabetes Mellitus. Lippincot-Raven; Philadelphia: 1996. pp. 459–467. [Google Scholar]
- 3.Knowler WC, Pettitt DJ, Saad MF, Bennett PH. Diabetes mellitus in the Pima Indians: incidence risk factors and pathogenesis. Diabetes Metab Rev. 1990;6:1–27. doi: 10.1002/dmr.5610060101. [DOI] [PubMed] [Google Scholar]
- 4.Lillioja S, Mott DM, Spraul M, et al. Insulin resistance and insulin secretory dysfunction as pre-cursors of non-insulin dependent diabetes mellitus: prospective studies in Pima Indians. N Engl J Med. 1993;329:1988–1992. doi: 10.1056/NEJM199312303292703. [DOI] [PubMed] [Google Scholar]
- 5.Weyer C, Tataranni PA, Bogardus C, Pratley RE. Insulin resistance and insulin secretory dysfunction are independent predictors of worsening of glucose tolerance during each stage of type 2 diabetes development. Diabetes Care. 2001;24:89–94. doi: 10.2337/diacare.24.1.89. [DOI] [PubMed] [Google Scholar]
- 6.Weyer C, Bogardus C, Mott DM, Pratley RE. The natural history of insulin secretory dysfunction and insulin resistance in the pathogenesis of type 2 diabetes. J Clin Invest. 1999;104:787–794. doi: 10.1172/JCI7231. [DOI] [PMC free article] [PubMed] [Google Scholar]
- 7.Skarfors ET, Selinus KI, Lithell HO. Risk factors for developing non-insulin dependent diabetes: a 10 year follow up of men in Uppsala. BMJ. 1991;303:755–760. doi: 10.1136/bmj.303.6805.755. [DOI] [PMC free article] [PubMed] [Google Scholar]
- 8.Martin BC, Warram JH, Krolewski AS, Bergman RN, Soeldner JS, Kahn CR. Role of glucose and insulin resistance in development of type 2 diabetes mellitus: results of a 25-year follow-up study. Lancet. 1992;340:925–929. doi: 10.1016/0140-6736(92)92814-v. [DOI] [PubMed] [Google Scholar]
- 9.Haffner SM, Miettinen H, Gaskill SP, Stern MP. Decreased insulin secretion and increased insulin resistance are independently related to the 7-year risk of NIDDM in Mexican-Americans. Diabetes. 1995;44:1386–1391. doi: 10.2337/diab.44.12.1386. [DOI] [PubMed] [Google Scholar]
- 10.Lyssenko V, Almgren P, Anevski D, et al. Botnia Study Group Predictors of and longitudinal changes in insulin sensitivity and secretion preceding onset of type 2 diabetes. Diabetes. 2005;54:166–174. doi: 10.2337/diabetes.54.1.166. [DOI] [PubMed] [Google Scholar]
- 11.deVegt F, Dekker JM, Jager A, et al. Relation of impaired fasting and postload glucose with incident type 2 diabetes in a Dutch population: the Hoorn Study. JAMA. 2001;285:2109–2113. doi: 10.1001/jama.285.16.2109. [DOI] [PubMed] [Google Scholar]
- 12.Meigs JB, Muller DC, Nathan DM, Blake DR, Andres R. The natural history of progression from normal glucose tolerance to type 2 diabetes in the Baltimore Longitudinal Study of Aging. Diabetes. 2003;52:1475–1484. doi: 10.2337/diabetes.52.6.1475. [DOI] [PubMed] [Google Scholar]
- 13.The Expert Committee on the Diagnosis and Classification of Diabetes Mellitus Report of the expert committee on the diagnosis and classification of diabetes mellitus. Diabetes Care. 1997;20:1183–1197. doi: 10.2337/diacare.20.7.1183. [DOI] [PubMed] [Google Scholar]
- 14.Weyer C, Bogardus C, Pratley RE. Metabolic characteristics of individuals with impaired fasting glucose and/or impaired glucose tolerance. Diabetes. 1999;48:2197–2203. doi: 10.2337/diabetes.48.11.2197. [DOI] [PubMed] [Google Scholar]
- 15.Davies MJ, Raymond NT, Day JL, Hales CN, Burden AC. Impaired glucose tolerance and the fasting hyperglycaemia have different characteristics. Diabet Med. 2000;17:433–440. doi: 10.1046/j.1464-5491.2000.00246.x. [DOI] [PubMed] [Google Scholar]
- 16.Expert Committee on the Diagnosis and Classification of Diabetes Mellitus Follow-up report on the diagnosis of diabetes mellitus. Diabetes Care. 2003;26:3160–3167. doi: 10.2337/diacare.26.11.3160. [DOI] [PubMed] [Google Scholar]
- 17.Tirosh A, Shai I, Tekes-Manova D, et al. Israeli Diabetes Research Group Normal fasting plasma glucose levels and type 2 diabetes in young men. N Engl J Med. 2005;353:1454–1462. doi: 10.1056/NEJMoa050080. [DOI] [PubMed] [Google Scholar]
- 18.Tuomilehto J, Lindstrom J, Eriksson JG, et al. Prevention of type 2 diabetes mellitus by changes in lifestyle among subjects with impaired glucose tolerance. N Engl J Med. 2001;344:1343–1350. doi: 10.1056/NEJM200105033441801. [DOI] [PubMed] [Google Scholar]
- 19.Diabetes Prevention Program Research Group Reduction in the incidence of type 2 diabetes with lifestyle intervention or metformin. N Engl J Med. 2002;346:393–403. doi: 10.1056/NEJMoa012512. [DOI] [PMC free article] [PubMed] [Google Scholar]
- 20.Goldman RF, Buskirk ER. A method for underwater weighing and the determination of body density. In: Brozek J, Herschel A, editors. Techniques for Measuring Body Composition. National Academy of Sciences; Washington, DC: 1961. pp. 78–106. [Google Scholar]
- 21.Mazess RB, Barden HS, Bisek JP, Hanson J. Dual-energy x-ray absorptiometry for total-body and regional bone-mineral content and soft-tissue composition. Am J Clin Nutr. 1995;62:730–734. doi: 10.1093/ajcn/51.6.1106. [DOI] [PubMed] [Google Scholar]
- 22.Tataranni PA, Ravussin E. Use of dual-energy x-ray absorptiometry in obese individuals. Am J Clin Nutr. 1995;62:730–734. doi: 10.1093/ajcn/62.4.730. [DOI] [PubMed] [Google Scholar]
- 23.Tataranni PA, Larson DE, Ravussin E. Body fat distribution and energy metabolism in obese men and women. J Am Coll Nutr. 1994;13:569–574. doi: 10.1080/07315724.1994.10718449. [DOI] [PubMed] [Google Scholar]
- 24.Chen M, Porte D., Jr The effect of rate and dose of glucose infusion on the acute insulin response in man. J Clin Endocrinol Metab. 1976;42:1168–1175. doi: 10.1210/jcem-42-6-1168. [DOI] [PubMed] [Google Scholar]
- 25.Schwartz MW, Boyko EJ, Kahn SE, Ravussin E, Bogardus C. Reduced insulin secretion: an independent predictor of body weight gain. J Clin Endocrinol Metab. 1995;80:1571–1576. doi: 10.1210/jcem.80.5.7745002. [DOI] [PubMed] [Google Scholar]
- 26.Bogardus C, Lillioja S, Mott D, Reavon JR, Kashiwagi A, Foley JE. Relationship between obesity and maximal stimulated glucose uptake in vivo and in vitro in Pima Indians. J Clin Invest. 1984;78:1568–1578. doi: 10.1172/JCI111274. [DOI] [PMC free article] [PubMed] [Google Scholar]
- 27.Lillioja S, Bogardus C. Obesity and insulin resistance: lessons learned from the Pima Indians. Diabetes Metab Rev. 1988;4:517–540. doi: 10.1002/dmr.5610040508. [DOI] [PubMed] [Google Scholar]
- 28.Herbert Y, Lau K, Gottlieb CW, Bleicher SJ. Coated charcoal immunoassay of insulin. J Clin Endocrinol Metab. 1965;25:1375–1385. doi: 10.1210/jcem-25-10-1375. [DOI] [PubMed] [Google Scholar]
- 29.Yalow RS, Berson SA. Immunoassay of endogenous plasma insulin in man. J Clin Invest. 1960;39:1157–1167. doi: 10.1172/JCI104130. [DOI] [PMC free article] [PubMed] [Google Scholar]
- 30.SUGI supplemental user’s guide, version. 5th edn SAS; Cary, NC: 1986. pp. 437–466. [Google Scholar]
- 31.Edelstein SL, Knowler WC, Bain RP, et al. Predictors of progression from impaired glucose tolerance to NIDDM: an analysis of six prospective studies. Diabetes. 1997;46:701–710. doi: 10.2337/diab.46.4.701. [DOI] [PMC free article] [PubMed] [Google Scholar]
- 32.Weyer C, Hanson RL, Tataranni PA, Bogardus C, Pratley RE. A high fasting plasma insulin concentration predicts type 2 diabetes independent of insulin resistance. Evidence for a pathogenic role of relative hyperinsulinemia. Diabetes. 2000;49:2094–2101. doi: 10.2337/diabetes.49.12.2094. [DOI] [PubMed] [Google Scholar]
- 33.Ferannini E, Camastra S, Gastaldelli A, et al. β-cell function in obesity: effects of weight loss. Diabetes. 2004;53(Suppl 3):526–533. doi: 10.2337/diabetes.53.suppl_3.s26. [DOI] [PubMed] [Google Scholar]
- 34.Kelley DE, McKolanis TM, Hegazi RA, Kuller LH, Kalhan SC. Fatty liver in type 2 diabetes mellitus: relation to regional adiposity, fatty acids,, and insulin resistance. Am J Physiol Endocrinol Metab. 2003;285:906–916. doi: 10.1152/ajpendo.00117.2003. [DOI] [PubMed] [Google Scholar]
- 35.Weyer C, Foley JE, Bogardus C, Tataranni PA, Pratley RE. Enlarged subcutaneous abdominal adipocyte size, but not obesity itself, predicts type II diabetes independent of insulin resistance. Diabetologia. 2000;43:1498–1506. doi: 10.1007/s001250051560. [DOI] [PubMed] [Google Scholar]
- 36.Matsuzawa Y, Funahashi T, Nakamura T. Molecular mechanism of metabolic syndrome X: contribution of adipocytokines - adipocyte-derived bioactive substances. Ann N Y Acad Sci. 1999;892:146–154. doi: 10.1111/j.1749-6632.1999.tb07793.x. [DOI] [PubMed] [Google Scholar]
- 37.Weyer C, Funahashi T, Tanaka S, et al. Hypoadiponectinemia in obesity and type 2 diabetes: close association with insulin resistance and hyperinsulinemia. J Clin Endocrinol Metab. 2001;86:1930–1935. doi: 10.1210/jcem.86.5.7463. [DOI] [PubMed] [Google Scholar]
- 38.Lindsay RS, Funahashi T, Hanson RL, et al. Adiponectin and development of type 2 diabetes in the Pima Indian population. Lancet. 2002;360:57–58. doi: 10.1016/S0140-6736(02)09335-2. [DOI] [PubMed] [Google Scholar]
- 39.O’Rahilly SP, Rudenski AS, Burnett MA, et al. Beta-cell dysfunction, rather than insulin insensitivity, is the primary defect in familial type 2 diabetes. Lancet. 1986;2:360–364. doi: 10.1016/s0140-6736(86)90052-8. [DOI] [PubMed] [Google Scholar]
- 40.Pimenta W, Korytkowski M, Mitrakou A, et al. Pancreatic beta-cell dysfunction as the primary genetic lesion in NIDDM. Evidence from studies in normal glucose-tolerant individuals with a first-degree NIDDM relative. JAMA. 1995;273:1855–1861. [PubMed] [Google Scholar]
- 41.Gautier JF, Wilson C, Weyer C, et al. Low acute insulin secretory responses in adult offspring of people with early onset type 2 diabetes. Diabetes. 2001;50:1828–1833. doi: 10.2337/diabetes.50.8.1828. [DOI] [PubMed] [Google Scholar]
- 42.Sakul H, Pratley R, Cardon L, Ravussin E, Mott D, Bogardus C. Familiarity of physical and metabolic characteristics that predict the development of non-insulin-dependent diabetes mellitus in Pima Indians. Am J Hum Genet. 1997;60:651–656. [PMC free article] [PubMed] [Google Scholar]