

Abstract
Oxidative stress, ubiquitination defects and mitochondrial dysfunction are commonly associated with neurodegeneration. Mice lacking mahogunin ring finger-1 (MGRN1) or attractin (ATRN) develop age-dependent spongiform neurodegeneration through an unknown mechanism. It has been suggested that they act in a common pathway. As MGRN1 is an E3 ubiquitin ligase, proteomic analysis of Mgrn1 mutant and control brains was performed to explore the hypothesis that loss of MGRN1 causes neurodegeneration via accumulation of its substrates. Many mitochondrial proteins were reduced in Mgrn1 mutants. Subsequent assays confirmed significantly reduced mitochondrial complex IV expression and activity as well as increased oxidative stress in mutant brains. Mitochondrial dysfunction was obvious many months before onset of vacuolation, implicating this as a causative factor. Compatible with the hypothesis that ATRN and MGRN1 act in the same pathway, mitochondrial dysfunction and increased oxidative stress were also observed in the brains of Atrn mutants. Our results suggest that the study of Mgrn1 and Atrn mutant mice will provide insight into a causative molecular mechanism common to many neurodegenerative disorders.
Keywords: Mahogunin Ring Finger-1, Attractin, neurodegeneration, ubiquitination, mitochondria, cytochrome c oxidase, oxidative stress, proteomics
1. Introduction
Neurodegeneration underlies a number of devastating neurologic disorders including Parkinson's disease (PD), Alzheimer's disease (AD) and polyglutamine diseases, including Huntington's disease (HD) and spinocerebellar ataxias (SCAs). The molecular mechanisms that underlie these disorders are not well understood, although common themes include protein misfolding and aggregation, oxidative and nitrosative stress and mitochondrial dysfunction. Protein accumulation and/or aggregation within neurons is a common feature of many neurodegenerative diseases, including Lewy bodies in PD and other dementia disorders, polyglutamine-containing inclusion bodies in HD and SCAs, and neurofibrillary tangles and amyloid plaques in AD [4,39]. Aggregation and inclusion bodies are thought to lead to neuronal loss, suggesting a role for the ubiquitin- proteasome system (UPS) in maintaining neuronal survival through protein quality control. Mutations in genes encoding components of the UPS have been shown to underlie some cases of AD [40] and PD [19,34]. Although these cases are relatively rare, the more common sporadic forms are also associated with aberrant accumulation of ubiquitinated proteins [21]. One of the key roles of the UPS is elimination of oxidatively damaged, short-lived, or misfolded proteins [5,12]. The brain is highly susceptible to oxidative damage as it contains low levels of antioxidant enzymes but high levels of easily oxidized substrates [10]. Oxidative damage is thought to increase with aging and several studies have implicated mitochondrial dysfunction and/or oxidative stress in the progression of normal aging and the pathogenesis of most neurodegenerative diseases [reviewed in 23]. Mitochondrial dysfunction can affect UPS function through its combined effects on adenosine triphosphate (ATP) and reactive oxygen species (ROS) levels [8,30]. UPS function requires ATP-dependent activation of ubiquitin, while ROS can damage and destabilize proteins, requiring their degradation by the proteasome. Excessive oxidative stress may overwhelm the UPS and result in the aggregation of ubiquitinated proteins. Mitochondrial dysfunction can also affect neuronal function and viability indirectly via impaired intracellular calcium buffering and permeabilization of the outer mitochondrial membrane, which leads to release of cell death-inducing proteins [13,37].
Animal models are a valuable resource for dissecting the molecular basis of neurodegenerative disease. Genetic models provide an important opportunity to study pre-symptomatic changes in the brains of animals that one knows will eventually be affected, allowing one to distinguish between causative mechanisms and secondary changes. Mutations in mouse Mgrn1 were first reported for their effect on pigmentation [20]. Mice homozygous for a null allele (Mgrn1md-nc) also develop progressive, widespread spongy degeneration of the CNS [16]. Mgrn1 encodes a protein with a C3HC4 RING-finger domain that is over 90% identical between mice and humans and has E3 ubiquitin ligase activity [16,18]. The dark-fur pigmentation phenotype of Mgrn1 mutants suggests a defect in pigment-type switching, where signaling through the G-protein coupled melanocortin 1 receptor (MC1R) regulates whether melanocytes synthesize black or yellow pigment. Mice lacking the type I transmembrane protein attractin (ATRN) also have dark fur and develop spongiform neurodegeneration [15]. Classical genetic crosses place ATRN and MGRN1 at the same position in the pigment-type switching pathway [28]. While MGRN1 and ATRN homologs are present in invertebrates, homologs of the melanocortin signaling pathway with which ATRN and MGRN1 are thought to interact are not. This has led to the suggestion that ATRN and MGRN1 act in the same signaling pathway [14].
We hypothesize that spongiform neurodegeneration in Mgrn1 null mutant mice results from neurotoxic accumulation of MGRN1 substrates. In this study, we identified protein expression changes associated with loss of MGRN1 using two-dimensional gel electrophoresis (2-DGE) followed by mass spectrometry (MS). Although our initial goal was to identify MGRN1 targets by virtue of their accumulation in the brains of Mgrn1 null mutant mice, a significant portion of the proteins identified were reduced and implicated in mitochondrial metabolism. Functional and expression assays confirmed mitochondrial dysfunction and elevated oxidative stress in the brains of Mgrn1 mutant mice. Brain ATP levels were also significantly reduced and there was a global reduction in protein ubiquitination, possibly due to an effect of ATP levels on ubiquitin activation. Mitochondrial dysfunction and elevated oxidative stress were also observed in the brains of Atrn mutant mice. In both mutants, mitochondrial dysfunction was detected prior to the onset of histopathological changes in the CNS, suggesting that this is a primary mechanism of neuronal death. The observation of similar defects in AD, PD and HD patients and several mouse models of neurodegeneration suggests this may be a pathogenic mechanism common to many neurodegenerative conditions.
2. Materials and methods
2.1. Mice
C3H/HeJ, 129S1/SvImJ and Atrnmg-3J mice were originally obtained from the Jackson Laboratory (Bar Harbor, ME, USA) and have been maintained by brother–sister inbreeding. Mgrn1md-nc mice were originally obtained from the Frozen Embryo and Sperm Archive at the Harwell Mammalian Genetics Unit (Harwell, UK) and have been maintained by brother-sister inbreeding, usually of heterozygotes to homozygotes, for over 21 generations. Mice were maintained under standard conditions in the Transgenic Mouse Core Facility at Cornell University. For all studies, mutant and control mice were matched by sex and age.
2.2. Sequential extraction of brain samples
Three pairs of male 3-week-old and 3-, 6- and 12-month-old Mgrn1md-nc/md-nc mutant and sibling Mgrn1md-nc/+ control mice were sacrificed by CO2 inhalation. Brains were removed and proteins were extracted according to solubility with the ReadyPrep sequential extraction kit (BioRad, Hercules, CA) to increase the probability of detecting less abundant proteins. Briefly, whole brains were homogenized in 4 ml of buffer 1 (40 mM Tris, pH 7.4) and Complete Protease Inhibitor (Roche Diagnostics, Indianapolis, IN) in a Polytron homogenizer and incubated for 15 min on ice. All steps were carried out at 4°C unless otherwise noted. The homogenate was centrifuged at 15,000 × g for 15 min and supernatant (E1) collected. The pellet was washed twice with buffer 1, resuspended in 750 μl of buffer 2 (8 M urea, 4% CHAPS, 40 mM Tris, 0.2% Bio-Lyte 3/10 ampholytes, and 2 mM tributylphosphine), vortexed, incubated for 10 min at room temperature, then centrifuged at 15,000 × g for 30 min. Supernatant (E2) was collected. The pellet was washed once with buffer 2, resuspended in buffer 3 (5 M urea, 2 M thiourea, 2% CHAPS, 2% sulfobetaine 3–10, 40 mM Tris, 0.2% Bio-Lyte 3/10 ampholytes, and 2 mM tributylphosphine), vortexed, incubated for 10 min at room temperature, then centrifuged at 15,000 × g for 30 min. Supernatant (E3) was collected. Supernatent protein concentrations were determined using the Coomassie Plus Protein Assay (Pierce Biotechnology, Rockford, IL).
2.3. Two-dimensional gel electrophoresis and mass spectrometry
Isoelectrical focusing was carried out using the PROTEAN IEF Cell (BioRad). Samples from three mutant and three control mice were focused at the same time. For each extraction fraction, 50 μg of protein was loaded on 11-cm IPG strips (pH 4–7; Bio-Rad) in rehydration buffer (8.5 M urea, 4% CHAPS, 0.5% Bio-Lyte 3/10 ampholytes) with DeStreak reagent (Amersham Biosciences/GE Healthcare, Piscataway, NJ). IPG strips were actively rehydrated at 50V overnight and isoelectrically focused following a programmed increase in voltage (0-250V for 30 min, 250-8000V for 2 hours, followed by 8000V-35000VHr). IPG strips were then equilibrated in 2% dithiothreitol, 6 M urea, 2% SDS, 0.05 M Tris, pH 8.8, and 20% glycerol for 30 min and equilibrated again in the second buffer with 2.5% iodoacetamide, 6 M urea, 2% SDS, 0.05 M Tris, pH 8.8, and 20% glycerol for 30 min. Second dimension separation was performed on 12% precast SDS-polyacrylamide gels at 200 V using the Criterion Dodeca cell electrophoresis system (BioRad). Gels from three pairs of mutant and control samples from one extraction fraction were run together. Following electrophoresis, gels were stained with a modified silver staining protocol [42], scanned, and subjected to image analysis using Proteomweaver imaging software Version 2.1 (Definiens, Munich, Germany) and PDQuest software (BioRad). Protein spots that showed significant and consistent differences in intensity between Mgrn1 mutant and control samples were identified using Student's t-test. Following image analysis, proteins of interest were excised, subjected to in-gel trypsin digestion (Pierce) and analyzed by mass spectrometry using an ABI4700 Proteomics Analyzer MALDI-TOF/TOF mass spectrometer (Applied Biosystems, Foster City, CA) at the Cornell University Proteomics Core Facility. Mass spectra data were analyzed using the Mascot search engine (Matrix Science, London, UK) followed by a search against the Mus musculus data base with a peptide tolerance of 25 ppm. Protein identification was considered significant if the Mascot score was higher than that of a random match at p=0.05.
2.4. Brain mitochondrial assays
Mice were sacrificed by CO2 inhalation. Brains were rapidly dissected on ice and washed in ice-cold buffer (210 mM mannitol, 70 mM sucrose, 10 mM HEPES, 1 mM EDTA, 0.5 mM dithiothreitol) containing Complete Protease Inhibitor (Roche Diagnostics). Tissues were homogenized in 2 ml of ice-cold buffer with a Polytron homogenizer followed by centrifugation at 1,500 × g for 5 min at 4°C. Low-speed centrifugation was repeated once with the supernatant. The final supernatant fraction was collected and centrifuged at 12,000 × g for 10 min at 4°C to pellet mitochondria. The pellet was resuspended in 1 ml of ice-cold buffer and centrifuged again at 800 × g for 3 min at 4°C. The mitochondria-enriched supernatant was centrifuged at 10,000 × g for 5 min at 4°C to obtain a mitochondrial fraction, which was resuspended in 100 μl of ice-cold buffer without protease inhibitors and subjected to BCA Protein Assay (Pierce) to determine the protein concentration. Mitochondrial respiration was determined on samples containing equal amounts of protein using a platinum electrode with a 1-ml buffer chamber. An excess of 8 mM glutamate, 8 mM malate (complex I), or 4 mM succinate (complex II) was added as electron donor. State 3 respiration by complex I was measured after addition of a limiting amount of ADP (14 μM). State 4 respiration by complex I was measured after ADP depletion. After coupled respiration was determined, 400 nM carbonyl cyanide 4-(trifluoromethoxy) phenylhydrazone (FCCP) was added and respiration measured in the absence of a proton gradient. Data were analyzed by Student's t-test. Complex IV activity was determined in isolated mitochondria using the Cytochrome c Oxidase Assay Kit (Sigma-Aldrich, St. Louis, MO). Equal amounts of protein were assayed for each mitochondrial extract.
2.5. ATP assay
Frozen brain hemispheres of 1-month old mice were placed in 1.5 mL of ice-cold 10% perchloric acid and homogenized immediately using a TissueLyser (Qiagen, Valencia, CA). Homogenates were neutralized with 2.5 M potassium hydroxide and resulting precipitates removed by centrifugation. Supernatents were diluted 5-fold with Tris-EDTA. Protein concentrations were determined by BCA protein assay (Pierce) and ATP levels were assayed using the ATP Bioluminescent Assay kit (Sigma-Aldrich) on equal amounts of brain proteins. Emitted light measured using a luminometer. Samples were measured in triplicate. Statistical analysis was performed using Student's t-test.
2.6. Immunoblotting
Mice were sacrificed by CO2 inhalation, brains rapidly dissected. For 1-DGE, brains were homogenized in RIPA buffer (50 mM Tris, 150 mM NaCl, 1% v/v Triton X-100) with Complete Protease Inhibitor. For 2-DGE ubiquitin assay, proteins were extracted using ProteoExtract Complete Mammalian Proteome Extraction Kit (Calbiochem, San Diego, CA) with Complete Protease Inhibitor. Insoluble material was removed by centrifugation and protein concentrations determined by BCA Protein Assay. Proteins were separated by 1- or 2-DGE and transferred to Immobilon P membrane (Millipore, Billerica, MA) for immunoblotting against ubiquitin (NB300-130D, Novus Biologicals, Littleton, CO), Rodent Total OXPHOS Complexes Cocktail (MS604, Mitosciences, Eugene, OR), CAMK4 (610275, BD Biosciences, San Jose, CA) or BDNF (G146A, Promega, Madison, WI). Protein carbonyls were assayed on 20 μg of protein using the OxyBlot Kit (Millipore). Blots were stripped and blotted for GAPDH (AB9482, Abcam, Cambridge, MA) or porin (MSA03, MitoSciences) to verify protein loading. For quantification of 1-D blots, films were scanned on a Kodak Image Station 2000 (Eastman Kodak Company, Rochester, NY) and signal intensity was quantified using ImageJ software (http://rsb.info.nih.gov/ij/).
3. Results
3.1. Proteomic analysis of Mgrn1 mutant mouse brains
The identity of MGRN1 as an E3 ubiquitin ligase led to the hypothesis that spongiform neurodegeneration results from neurotoxic accumulation of MGRN1 substrates in Mgrn1 null mutant (Mgrn1md-nc) mice. To explore this hypothesis, we performed a proteomic study to characterize the consequences of loss of MGRN1 in the mouse brain using 2-DGE. We anticipated that potential MGRN1 targets could be identified by virtue of their overabundance in the brains of Mgrn1 mutant mice and that other protein changes would provide insight into the molecular mechanisms of neuronal death in these animals. In our colony, histological signs of vacuolation in Mgrn1md-nc homozygotes are first apparent at 6-7 months of age. Brain proteins from three pairs of Mgrn1md-nc/md-nc mutants and sibling controls (Mgrn1md-nc/+) were examined at 3 weeks and 3-, 6- and 12-months of age, providing brain protein expression profiles before and after the onset of spongiform degeneration in mutant mice. This allowed us to identify changes likely to reflect causative mechanisms of neurodegeneration as well as later, secondary changes that may contribute to progression of neuronal death. Proteins were extracted sequentially according to solubility: E1 (soluble, mostly cytoplasmic proteins), E2 (intermediate solubility, such as membrane-associated proteins), and E3 (less soluble, such as integral membrane proteins). Samples were focused by isoelectric point (pI) then separated by molecular mass. Reproducible 2-DGE patterns were achieved for samples within genotype, age and extraction-fraction categories. Protein spots that showed consistent, statistically significant differences (p<0.05) in intensity between mutant and control samples (within genotype, across multiple samples) were subject to MALDI-TOF/TOF MS. Approximately 54% of proteins analyzed were identified. Loss of MGRN1 resulted in distinct changes in the brain proteome (Figures 1 and 2, Table 1). Over half of the differentially expressed proteins identified are implicated in energy metabolism and mitochondrial respiration and all but one of these proteins were down-regulated in Mgrn1 mutants. Conversely, loss of MGRN1 led to increased expression of most other (non-mitochondrial) proteins identified in this study.
Figure 1.
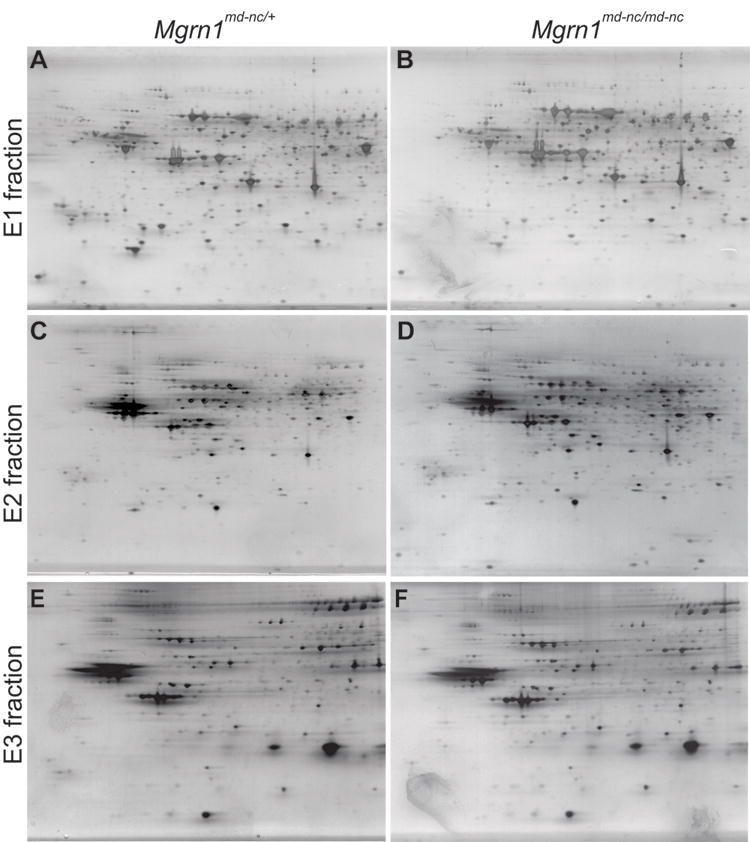
Representative 2-DGE images of E1-cytoplasmic (A,B), E2-membrane-associated (C,D) and E3-integral membrane (E,F) brain protein fractions from 3-month old male Mgrn1md-nc/md-nc mutants (A,C,E) and Mgrn1md-nc/+ sibling controls (B,D,F). Proteins were visualized using a modified silver staining protocol.
Figure 2.

Magnified views of representative areas of 2-D gels showing proteins differentially expressed in Mgrn1md-nc/md-nc mutant brains compared to Mgrn1md-nc/+ sibling controls.
Table 1.
MS identification of proteins with altered expression in the brains of Mgrn1 null mutant mice.
| Age | SW/Tr
Acca |
Protein name | Mean
changeb |
p-valuec | Function category | Fractiond |
|---|---|---|---|---|---|---|
| 3-week | Q9CWX2 | Complex I intermediate-associated protein 30, mitochondrial (NDUFAF1) | -1.45 | 0.040 | Mitochondrial | E1 |
| 3-month | Q9D051 | Pyruvate dehydrogenase E1 component subunit beta, mitochondrial (PDHB) | -1.63 | 0.031 | Mitochondrial | E1 |
| 3-month | P42125 | 3,2-trans-enoyl-CoA isomerase (DCI) | -1.39 | 0.040 | Mitochondrial | E1 |
| 3-month | P21237 | Integrin beta-1 precursor (ITGB1) | +1.57 | 0.023 | Membrane Receptor | E2 |
| 3-month | P21237 | Brain-derived neurotrophic factor precursor (BDNF) | -1.76 | 0.034 | Neurotrophic Factor | E2 |
| 3-month | P03921 | NADH-Ubiquinone oxidoreductase chain 5 (MTMD5) | +1.42 | 0.014 | Mitochondrial | E3 |
| 6-month | Q6NZB9 | Hydroxysteroid (11-beta) dehydrogenase 2 (HSD11B2) | -1.39 | 0.021 | Mitochondrial | E1 |
| 6-month | Q922H2 | Pyruvate dehydrogenase kinase, isoenzyme 3, mitochondrial (PDK3) | -1.65 | 0.018 | Mitochondrial | E1 |
| 6-month | P08414 | Calcium/calmodulin-dependent protein kinase IV (CAMK4) | +1.48 | 0.032 | Signal transduction | E2 |
| 6-month | Q9WVM8 | Kynurenine/alpha-aminoadipate aminotransferase, mitochondrial (AADAT) | -1.35 | 0.030 | Mitochondrial | E2 |
| 6-month | P28843 | Dipeptidyl peptidase IV (DPP4) | +1.32 | 0.045 | Membrane Enzyme | E3 |
| 12-month | P42208 | Septin-2 (SEPT2) | +1.45 | 0.025 | Cytoskeletal, GTP-binding | E1 |
| 12-month | P97427 | Dihydropyrimidinase-related protein 1 (CRMP1) | +1.39 | 0.042 | Signal transduction | E1 |
Swiss-prot/TrEmbl accession number
Negative number indicates reduced in Mgrn1 mutants relative to control, positive number indicates elevated in mutants
Student's t-test, p<0.05 significant
E1: soluble (cytosolic), E2: intermediate solubility (membrane-associated), E3: insoluble (integral membrane) proteins.
To test the hypothesis that proteins expressed at higher levels in mutant brains are targeted by MGRN1 for ubiquitin-mediated decay, we immunoblotted for ubiquitin following 2-DGE of whole brain protein extracts (Figure 3A-D). We expected that protein spots corresponding to MGRN1 targets would be ubiquitinated in samples from heterozygous and control brains but not in samples from Mgrn1 null mutant mice and that we could identify these proteins by MS. To our surprise, there appeared to be a dose-dependent, global reduction of ubiquitinated proteins associated with loss of MGRN1, with a slight reduction in ubiquitin staining in heterozygotes and a stronger reduction Mgrn1 null mutants relative to wild-type samples (Figure 3B-D). This effect of loss of MGRN1 on protein ubiquitination was confirmed by immunoblotting 1-DGE separated brain proteins (Figure 3E) and quantifying the relative intensity of ubiquitin and GAPDH signals (Figure 3E). The overall level of ubiquitinated proteins was reduced by ∼50% in Mgrn1 null mutants and ∼30% in heterozygotes, relative to wild-type controls (Figure 3F).
Figure 3.
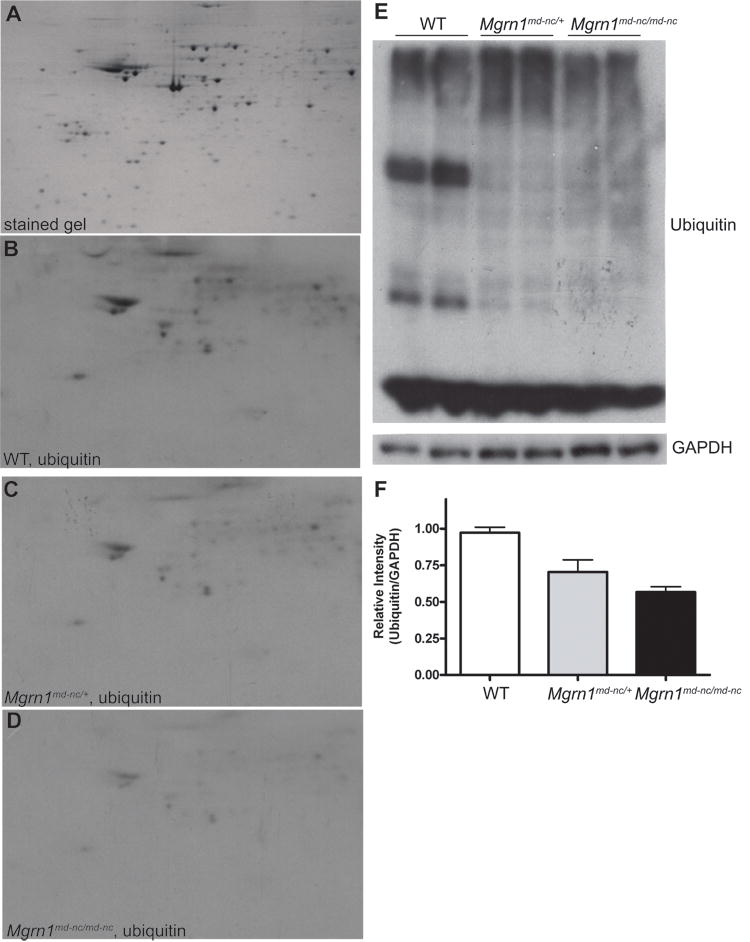
Dose-dependent, global reduction in ubiquitination associated with MGRN1-deficiency. (A) Representative 2-DG gel of complete brain proteome stained with colloidal Coomassie blue. (B-D) Western analysis of ubiquitin complete brain protein extracts from 6-month old wild-type (WT) (B), Mgrn1md-nc/+ (C) and Mgrn1md-n/md-nc (D) mice following 2-DGE. (E) 1-DGE analysis of ubiquitin levels in brain protein extracts from 6-month old wild-type (WT), Mgrn1md-nc/+ and Mgrn1md-n/md-nc mice. Blots were immunoblotted for ubiquitin, then stripped and immunoblotted for GAPDH as a control for protein loading. Signal intensity was quantified using ImageJ software and plotted as average ratio of ubiquitin signal/GAPDH signal by genotype (F) to quantify differences in protein ubiqutination. Ratios were normalized against WT.
3.2. Mgrn1 mutants exhibit mitochondrial dysfunction
The brain protein expression profile of Mgrn1 null mutant mice suggested the possibility of a mitochondrial deficiency and at least one mitochondrial protein was differentially expressed in 1-month old mice. We used western analysis to examine expression of mitochondrial proteins in brain extracts from 1-month old animals using a premixed cocktail of antibodies against proteins representing the 5 mitochondrial oxidative phosphorylation complexes and porin, as a loading control (Figure 4A). The most dramatic difference was in the complex IV cytochrome c oxidase I subunit (COXI), which was present at ∼20% of wild-type levels in mitochondria isolated from Mgrn1 null mutant brains (Figure 4B). The complex III and V subunits did not appear to be changed while the complex I and II subunits were slightly reduced (∼90% of wild-type) in mitochondria isolated from Mgrn1 null mutant brains. We also examined the metabolic capacity of mitochondria isolated from the brains of 1-month old Mgrn1md-nc/md-nc mutants, Mgrn1md-nc/+ siblings, and wild-type controls. A consistent trend of reduced state 3 respiration by complex I was observed in mitochondria isolated from the brains of Mgrn1md-nc null mutants (Figure 4C), although the difference relative to control samples was not statistically significant. State 4 respiration by complex I (Figure 4D), complex II (data not shown) and the respiratory control ratio (Figure 4E) were unchanged. Cytochrome c oxidase activity was significantly decreased (p<0.05) in 1-month old Mgrn1 null mutants (Figure 4F).
Figure 4.
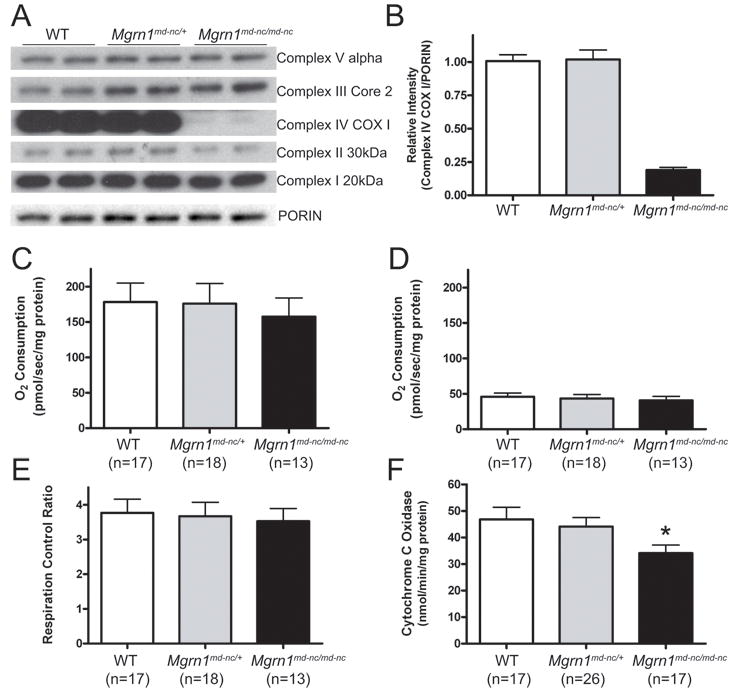
Reduced mitochondrial function in Mgrn1 mutant mice. (A) Western analysis of brain protein lysates from 1-month old wild-type (WT), Mgrn1md-nc/+ and Mgrn1md-n/md-nc mice for representative subunits from each of the five mitochondrial oxidative phosphorylation complexes showing slight reductions in complex I and II subunits and a strong reduction in complex IV subunit COXI. Porin is shown as mitochondrial protein loading control. (B) Quantification of COXI levels relative to porin. (C-E) In respiration assays, mitochondria isolated from Mgrn1 mutants trended toward reduced complex I-state 3 respiration (C) but not complex I-state 4 respiration (D) or respiratory control ratio (E). Cytochrome c oxidase activity (F) was significantly reduced in 1-month old Mgrn1 null mutants relative to heterozygotes and wild-type (WT) mice, indicating reduced capacity of Complex IV (*, p<0.05). Assays were performed in duplicate. Values represent means ± S.E.
3.3. Mitochondrial related phenotypes in MGRN1-deficient mice
Mitochondrial oxidative phosphorylation is the primary source of ATP in eukaryotic cells. We determined whether the mitochondrial defect in the brains of 1-month old Mgrn1 null mutant mice was associated with a reduction in ATP using a bioluminometric assay. ATP was significantly reduced in Mgrn1 null mutants relative to wild-type mice, while heterozygotes had intermediate levels that did not differ statistically from those of either wild-type or homozygous mutant mice (Figure 5). Mitochondrial dysfunction is also believed to increase oxidative stress. We examined whether the brains of Mgrn1 null mutant mice contained increased levels of oxidation products using Oxyblot analysis. At 6-months of age, the brains of Mgrn1 null mutants showed both higher levels and an altered pattern of protein carbonyls, a general marker of oxidative damage, relative to heterozygous littermates and wild-type mice (Figure 6). Interestingly, while proteins carbonyls were almost 4-fold higher in Mgrn1md-nc/md-nc than wild-type brains, they were also slightly elevated (∼1.5-fold over wild-type) in Mgrn1md-nc/+ brains.
Figure 5.
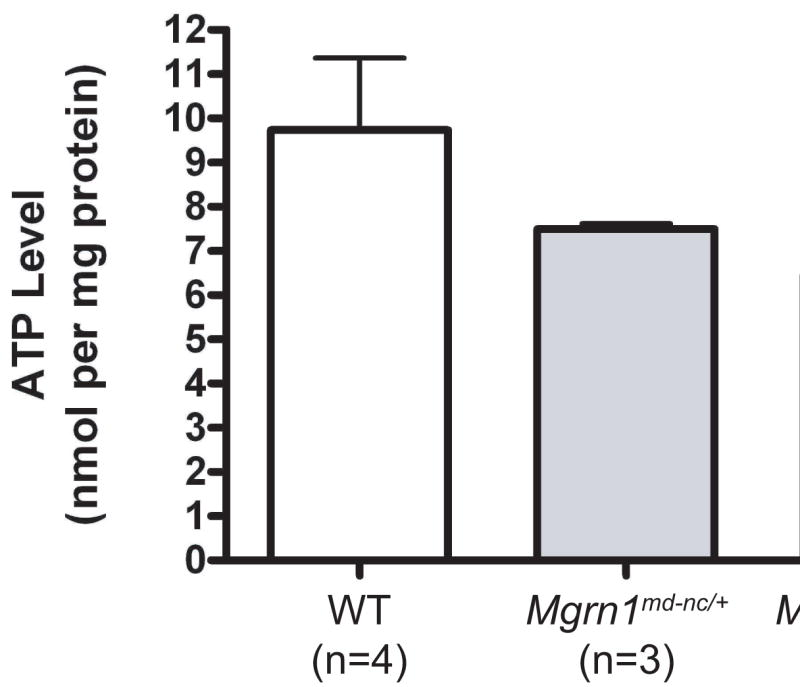
ATP levels were significantly reduced in the brains of 1-month old Mgrn1md-nc/md-nc mice (*, p<0.05). Heterozygotes had intermediate levels that were not statistically different from wild-type (WT) or homozygous mutant mice. Assays were performed in triplicate. Values represent means ± S.E.
Figure 6.
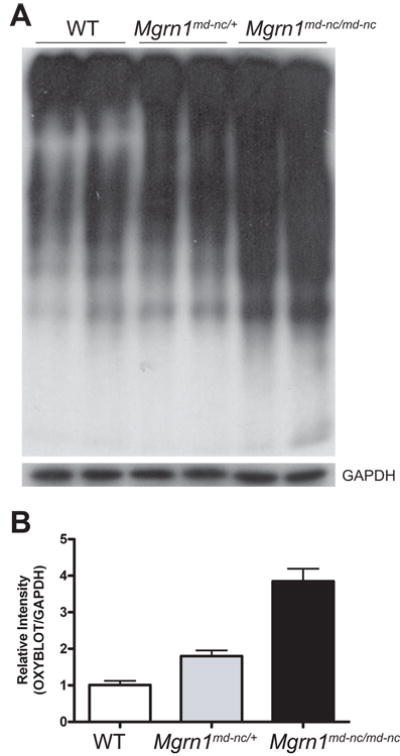
Elevated oxidative damage to brain proteins in Mgrn1 null mutants. (A) Oxyblot (top panel) assay of brain lysates from 6-month old mice revealed increased levels of protein carbonyls in Mgrn1md-nc/md-nc mutants relative to Mgrn1md-nc/+ siblings. Blots were stripped and blotted for GAPDH as loading control (bottom panel). Signal intensity was quantified using ImageJ software and plotted as average ratio of the Oxyblot signal/GAPDH signal by genotype (B) to quantify differences in oxidatively damaged proteins. Ratios were normalized against WT.
3.4 BDNF and CAMK4
BDNF was the only non-mitochondrial protein identified in this study that was less abundant in Mgrn1 null mutant brains (Table 1). As elevated BDNF has been shown to increase mitochondrial complex I but not complex II activity, it is possible that an effect of loss of MGRN1 on Bdnf expression underlies the mitochondrial dysfunction observed in Mgrn1 null mutants. A slight reduction was also observed by western analysis of brain protein extracts from 1- and 3-month old mice (Figure 7A and data not shown). One of the up-regulated proteins in Mgrn1 null mutant mice was CAMK4. Calcium influx into the cell through NMDA and voltage-gated calcium channels activates phosphorylation of the cAMP response element-binding protein (CREB transcription factor) by CAMK4, leading to activation of Bdnf transcription [26,35,36]. Thus, an increase in CAMK4 might reasonably be expected to increase Bdnf expression, yet we observed a reduction in BDNF in Mgrn1 null mutants. Western analysis confirmed the 2-DGE result that CAMK4 is elevated in the brains of 1-, 3- and 6-month old Mgrn1 null mutants relative to their heterozygous siblings (Figure 7B).
Figure 7.
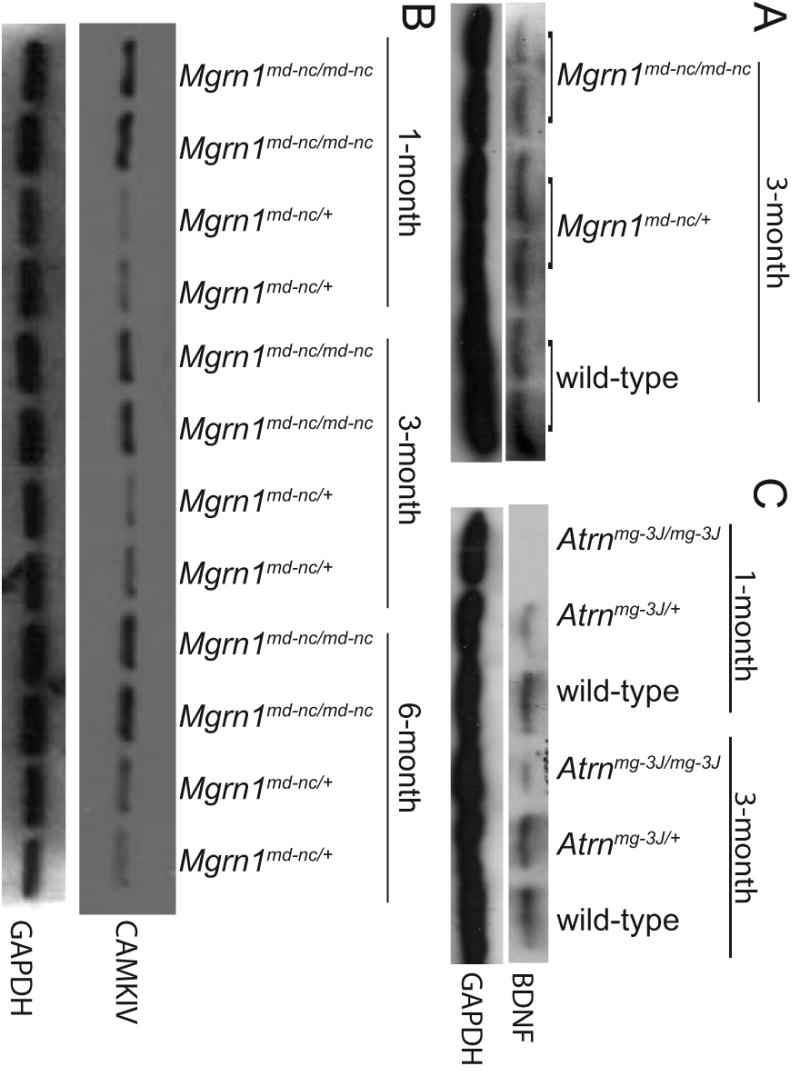
Western analysis confirmed that proBDNF was reduced (A) and CAMK4 elevated (B) in the brains of Mgrn1 null mutant mice. An even more striking reduction in proBDNF was observed in the brains of Atrn null mutants (C).
3.5. Mitochondrial dysfunction and energy-related defects in Atrn mutant mice
We tested the hypothesis that ATRN and MGRN1 are involved in the same signaling pathway by determining whether the mitochondrial phenotypes observed in Mgrn1 mutant mice were also present in Atrn mutant mice. We examined state 3 and state 4 respiration in mitochondria isolated from the brains of 1-month old Atrnmg-3J/mg-3J mutant and Atrnmg-3J/+ control mice. As was observed for Mgrn1 null mutants, state 3 respiration by complex I showed a consistent but not statistically significant trend toward being reduced in Atrn null mutants (Figure 8A), while state 4 respiration by complex I (Figure 8B), complex II activity (data not shown) and respiratory control ratio (Figure 8C) appeared normal. Cytochrome c oxidase activity was significantly reduced (Figure 8D) and Oxyblot analysis revealed elevated protein carbonyls in brain lysates from 3-month old Atrnmg-3J/mg-3J mutants relative to Atrnmg-3J/+ controls (Figure 9). Interestingly, the pattern of protein carbonylation in Atrn mutant brains was similar to that of Mgrn1 mutants. We also examined BDNF and CAMK4 expression in brain protein lysates from Atrnmg-3J mutant mutants. A strong reduction in BDNF was observed (Figure 7C), but loss of ATRN had no apparent effect on CAMK4 levels (data not shown).
Figure 8.
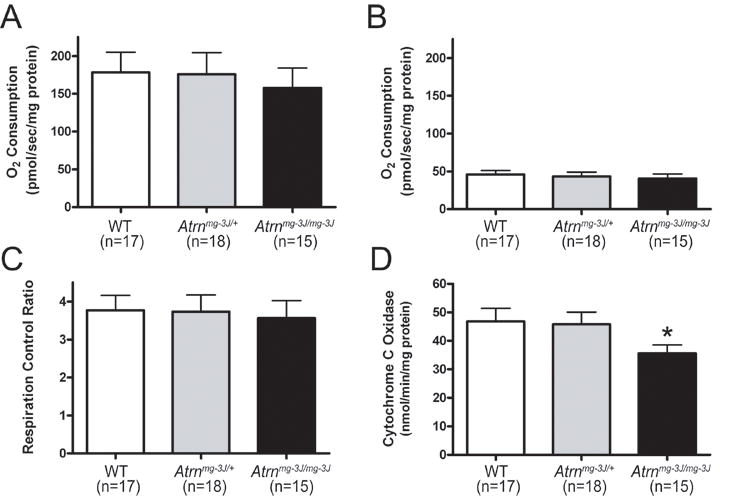
Reduced mitochondrial function in Atrn mutant mice. Atrn mutants trended toward reduced state 3 respiration (A) but not state 4 respiration by complex I (B) nor respiratory control ratio (C). Cytochrome c oxidase activity (D) was significantly reduced in Atrnmg-3J mutants relative to heterozygotes and wild-type (WT) controls indicating reduced capacity of Complex IV (*, p<0.05). Assays were performed in duplicate. Values represent means ± S.E.
Figure 9.
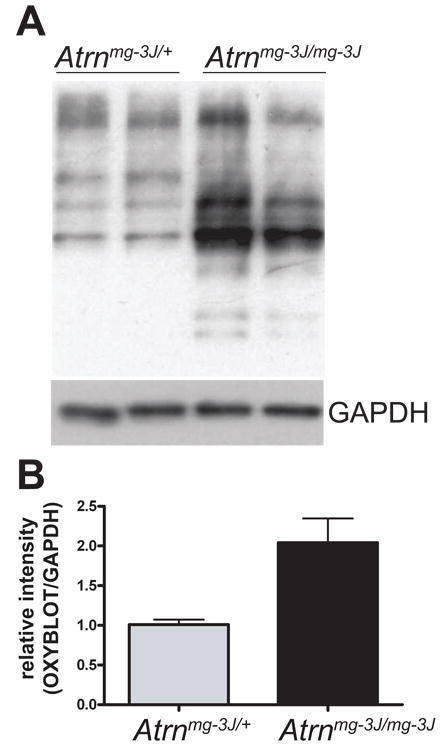
Brain proteins from Atrn null mutants show elevated oxidative damage. Oxyblot assay of brain lysates from 3-month old mice revealed increased levels of protein carbonyls in Atrnmg-3J/mg-3J mutants compared to Atrnmg-3J/+ siblings. Blots were stripped and blotted for GAPDH as loading control. Signal intensity was quantified using ImageJ software and plotted as average ratio of the Oxyblot signal/GAPDH signal by genotype (B) to quantify differences in oxidatively damaged proteins. Atrnmg-3J/mg-3J ratio was normalized against Atrnmg-3J/+.
4. Discussion
Advances in proteomic methods and availability of complete mouse genomic DNA sequence provide a valuable opportunity to study aging at the cellular level in a mammalian species. Although most neurodegenerative disorders are spontaneous, genetic models are useful for identifying underlying molecular mechanisms. They also provide the opportunity to distinguish causative mechanisms from secondary effects as one can study animals prior to the onset of clinical symptoms, knowing they are destined to be affected later in life. Mgrn1 null mutant mice develop spongiform neurodegeneration by 6-7 months of age. We performed 2-DGE of brain proteins extracted from mutant and control mice at 3 weeks and 3, 6 and 12 months of age. Proteins with mitochondrial roles were expressed at lower levels in Mgrn1 null mutant mice at all ages examined. Subsequent expression and functional studies confirmed that loss of MGRN1 leads to mitochondrial dysfunction in animals by 1-month of age, well before the onset of histologically-evident vacuolation. Complex IV (cytochrome c oxidase) was most severely affected, with a slight reduction also observed in complex I.
There is mounting evidence that mitochondrial dysfunction is causally-associated with aging and neurodegenerative disease. Several studies have shown that inhibitors of mitochondrial complex I can cause dopaminergic cell death and induce aggregation of α-synuclein-containing Lewy body-like inclusions [reviewed in 7]. Mitochondrial dysfunction and oxidative stress have been observed in PD, AD and HD patients as well as models of these diseases [reviewed in 1,3]. Sod2 null mutant mice, which are a model of endogenous mitochondrial oxidative stress, develop a profound spongiform encephalopathy within the frontal cortex and brain stem regions [27]. Loss-of-function mutations in cytochrome c oxidase subunit VIa in Drosophila resulted in similar phenotypes to those observed in Mgrn1 null mutant mice, namely age-dependent reduction in ATP levels and vacuolization of the brain [24]. The increased oxidative protein damage observed in the brains of in Mgrn1 and Atrn mutant mice suggests that the cumulative effects of oxidative stress that result from mitochondrial dysfunction contribute to neuronal death.
In addition to being a source of energy within cells, mitochondria are critical regulators of cell death via apoptosis or necrosis [reviewed in 2]. Interestingly, intracellular ATP levels appear to be a key determinant in deciding between apoptosis or necrosis. Many of the initial events required for apoptosis are also required for necrosis, but active ATP production is necessary for the final stages of apoptosis involving nuclear condensation and DNA degradation [11,22]. Thus, necrosis results when ATP is limiting. Necrosis is characterized by cytoplasmic vacuolation as well as pyknotic nuclei, breakdown of plasma membranes and induction of inflammatory responses. Given that ATP levels are reduced in Mgrn1 mutant brains, the vacuoles that develop throughout the CNS of these mice could represent necrotic cell death.
As most ATP is produced by oxidative phosphorylation in mitochondria, mitochondrial dysfunction is likely to underlie the reduced ATP levels detected in the brains of Mgrn1 null mutant mice. These observations also provide an explanation for the global reduction in ubiquitinated proteins observed in the brains of Mgrn1 mutant mice as ubiquitination requires ATP-dependent activation of ubiquitin [6]. A global reduction in ubiquitination could contribute to neuronal death via the accumulation and/or persistence of proteins normally targeted for proteasomal or lysosomal degradation. Ubiquitination is a key regulator of endocytic trafficking of a number of receptors, and disrupted trafficking could lead to altered signaling of multiple pathways important for neuronal function and survival. MGRN1 was recently reported to ubiquitinate TSG101, a component of endosomal sorting complex required for transport-I (ESCRT-I), leading to disrupted trafficking and signaling of the epidermal growth factor receptor in MGRN1-deficient cells [18]. It is likely that altered TSG101 function disrupts trafficking of additional receptors in MGRN1-deficient cells. Thus, loss of MGRN1 may have multiple direct and indirect effects on protein trafficking and function and it is likely that the neurodegeneration observed in Mgrn1 null mutant mice reflects these combined effects.
BDNF levels have also been associated with mitochondrial function. Addition of BDNF increased complex I but not complex II activity in isolated mitochondria and increased mitochondrial activity in rat cerebellar granule cells [25]. Thus, reduced BDNF might be expected to negatively impact mitochondrial function, particularly complex I activity. It is interesting that reduced BDNF has also been observed in patients with and/or animals models of neurodegenerative disorders [29,33,44,45], suggesting that this too may be a common contributing factor in neuronal cell death. Given that Bdnf expression is controlled in part by activation of CREB via CAMK4-dependent phosphorylation, the observation of increased CAMK4 in Mgrn1 mutant brains was unexpected. Elevated CAMK4 would normally increase Bdnf expression through activation of CREB. One possible explanation for this discrepancy is that the reduction in ATP in Mgrn1 mutant brains affects global phosphorylation as well as ubiquitination, leading to reduced CAMK4-dependent phosphorylation of CREB. Reduced CAMK4 activity could also contribute to mitochondrial dysfunction since expression of a constitutively active form of CAMK4 in skeletal muscle resulted in augmented mitochondrial biogenesis and DNA replication, including up-regulation of enzymes involved in electron transport [41].
Several other proteins (ITGB1, DPP4, SEPT2, CRMP1) were also up-regulated in the brains of Mgrn1 mutant mice. Further work is needed to determine whether they are targeted for ubiquitin-mediated degradation by MGRN1. It is interesting that proteomic analysis of parkin-deficient mice also identified a number of septin proteins [32]. Septins are ubiquitous, GTP-binding proteins that hetero-oligomerize to form filaments and are generally thought to act as molecular scaffolds for membrane- and cytoskeleton-binding proteins [reviewed in 38]. SEPT5 (CDC-rel) is ubiquitinated by parkin [43] and its over-expression in the substantia nigra of rats caused progressive loss of nigral dopaminergic neurons [9]. SEPT4 is found in Lewy bodies in PD and other synucleinopathies [17], raising the possibility that accumulation or aggregation of septins is another common feature of many neurodegenerative disorders.
The similarity in pigment-type switching and spongiform degeneration phenotypes of Mgrn1 and Atrn mutant mice has led to the suggestion that ATRN and MGRN1 act in the same pathway. The current study supports this hypothesis as young Mgrn1 and Atrn null mutant mice exhibited similar defects in mitochondrial function, increased oxidative damage to brain proteins and reduced levels of BDNF. Atrn over-expression has been reported to protect cultured neurons against toxicity induced by the mitochondrial complex I inhibitor 1-methyl-4-phenylpyridinium (MPP+) and the proteasome inhibitor lactacystin, while knock-down of Atrn expression makes those cells more vulnerable [31]. The reduced complex I activity and elevated oxidative stress we observed in the brains of Atrn mutant mice are consistent with those observations.
Although further work is needed to understand the mechanism by which loss of MGRN1 or ATRN leads to mitochondrial defects, this is the first phenotype identified in Atrn or Mgrn1 mutants that precedes the onset of spongiform pathology. This suggests that mitochondrial dysfunction is a causative mechanism of neurodegeneration. Mitochondria play a pivotal role in cellular homeostasis and disruption of their function has been associated with neurodegeneration through several different mechanisms (Figure 10). The relationship between mitochondrial dysfunction and neurodegeneration is complex, as many of the cellular processes affected by mitochondria can themselves influence mitochondrial biogenesis or function. As mitochondrial dysfunction is a common finding in most neurodegenerative diseases, further study of MGRN1 and ATRN will provide insight into a mechanism of neuronal death relevant to many disorders. Furthermore, our data indicates that there is a dose-dependent effect of loss of MGRN1 on mitochondrial function, ATP levels, global ubiquitination and oxidative damage to brain proteins. This raises the possibility that polymorphisms that reduce the amount or function of MGRN1 may act in conjunction with other environmental or genetic factors to influence susceptibility to a wide range of human neurodegenerative disorders.
Figure 10.
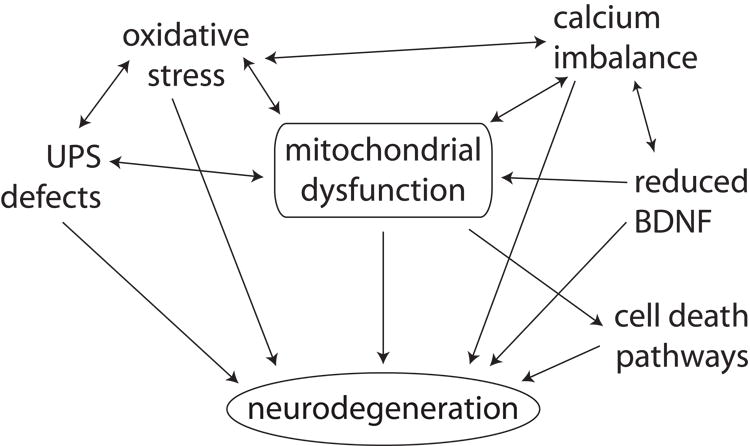
Mitochondrial dysfunction is associated with neurodegeneration through many mechanisms. It can directly trigger cell death pathways that culminate in neuronal apoptosis or necrosis, disrupt calcium homestasis, and cause UPS dysfunction and oxidative stress. Dissecting the role of mitochondrial dysfunction in neurodegeneration is complicated by the fact that many of these downstream effects can themselves contribute to mitochondrial defects.
Acknowledgments
We thank Jennifer Rohksar and Hongbin Yang for assistance establishing protein extraction protocols. The project described was supported by Grant Number R01AG022058 from the National Institute On Aging to T.M.G. The content is solely the responsibility of the authors and does not necessarily represent the official views of the National Institute On Aging or the National Institutes of Health.
Footnotes
Disclosure statement
The authors have no conflicts to report.
Publisher's Disclaimer: This is a PDF file of an unedited manuscript that has been accepted for publication. As a service to our customers we are providing this early version of the manuscript. The manuscript will undergo copyediting, typesetting, and review of the resulting proof before it is published in its final citable form. Please note that during the production process errors may be discovered which could affect the content, and all legal disclaimers that apply to the journal pertain.
References
- 1.Albers DS, Beal MF. Mitochondrial dysfunction and oxidative stress in aging and neurodegenerative disease. J Neural Transm. 2000;59(Suppl):133–54. doi: 10.1007/978-3-7091-6781-6_16. [DOI] [PubMed] [Google Scholar]
- 2.Armstrong JS. Mitochondrial membrane permeabilization: the sine qua non for cell death. Bioessays. 2006;28(3):253–60. doi: 10.1002/bies.20370. [DOI] [PubMed] [Google Scholar]
- 3.Beal MF. Mitochondria take center stage in aging and neurodegeneration. Ann Neurol. 2005;58(4):495–505. doi: 10.1002/ana.20624. [DOI] [PubMed] [Google Scholar]
- 4.Berke SJ, Paulson HL. Protein aggregation and the ubiquitin proteasome pathway: gaining the UPPer hand on neurodegeneration. Curr Opin Genet Dev. 2003;13(3):253–61. doi: 10.1016/s0959-437x(03)00053-4. [DOI] [PubMed] [Google Scholar]
- 5.Ciechanover A. Proteolysis: from the lysosome to ubiquitin and the proteasome. Nat Rev Mol Cell Biol. 2005;6(1):79–87. doi: 10.1038/nrm1552. [DOI] [PubMed] [Google Scholar]
- 6.Ciechanover A, Elias S, Heller H, Hershko A. “Covalent affinity” purification of ubiquitin-activating enzyme. J Biol Chem. 1982;257(5):2537–42. [PubMed] [Google Scholar]
- 7.Dawson TM, Dawson VL. Molecular pathways of neurodegeneration in Parkinson's disease. Science. 2003;302(5646):819–22. doi: 10.1126/science.1087753. [DOI] [PubMed] [Google Scholar]
- 8.Dean RT, Fu S, Stocker R, Davies MJ. Biochemistry and pathology of radical-mediated protein oxidation. Biochem J. 1997;324(Pt 1):1–18. doi: 10.1042/bj3240001. [DOI] [PMC free article] [PubMed] [Google Scholar]
- 9.Dong Z, Ferger B, Paterna JC, Vogel D, Furler S, Osinde M, Feldon J, Bueler H. Dopamine-dependent neurodegeneration in rats induced by viral vector-mediated overepxression of the parkin target protein, CDCrel-1. Proc Natl Acad Sci U S A. 2003;100:12438–43. doi: 10.1073/pnas.2132992100. [DOI] [PMC free article] [PubMed] [Google Scholar]
- 10.Dringen R, Gutterer JM, Hirrlinger J. Glutathione metabolism in brain metabolic interaction between astrocytes and neurons in the defense against reactive oxygen species. Eur J Biochem. 2000;267(16):4912–6. doi: 10.1046/j.1432-1327.2000.01597.x. [DOI] [PubMed] [Google Scholar]
- 11.Eguchi Y, Shimizu S, Tsujimoto Y. Intracellular ATP levels determine cell death fate by apoptosis or necrosis. Cancer Res. 1997;57(10):1835–40. [PubMed] [Google Scholar]
- 12.Goldberg AL. Protein degradation and protection against misfolded or damaged proteins. Nature. 2003;426(6968):895–9. doi: 10.1038/nature02263. [DOI] [PubMed] [Google Scholar]
- 13.Green DR, Reed JC. Mitochondria and apoptosis. Science. 1998;281(5381):1309–12. doi: 10.1126/science.281.5381.1309. [DOI] [PubMed] [Google Scholar]
- 14.He L, Eldridge AG, Jackson PK, Gunn TM, Barsh GS. Accessory proteins for melanocortin signaling: attractin and mahogunin. Ann N Y Acad Sci. 2003;994:288–98. doi: 10.1111/j.1749-6632.2003.tb03192.x. [DOI] [PubMed] [Google Scholar]
- 15.He L, Gunn TM, Bouley DM, Lu XY, Watson SJ, Schlossman SF, Duke-Cohan JS, Barsh GS. A biochemical function for attractin in agouti-induced pigmentation and obesity. Nat Genet. 2001;27(1):40–7. doi: 10.1038/83741. [DOI] [PubMed] [Google Scholar]
- 16.He L, Lu XY, Jolly AF, Eldridge AG, Watson SJ, Jackson PK, Barsh GS, Gunn TM. Spongiform degeneration in mahoganoid mutant mice. Science. 2003;299(5607):710–2. doi: 10.1126/science.1079694. [DOI] [PubMed] [Google Scholar]
- 17.Ihara M, Tomimoto H, Kitayama H, Morioka Y, Akiguchi I, Shibasaki H, Noda M, Kinoshita M. Association of the cytoskeletal GTP-binding protein Sept4/H5 with cytoplasmic inclusions found in Parkinson's disease and other synucleinopathies. The Journal of biological chemistry. 2003;278(26):24095–102. doi: 10.1074/jbc.M301352200. [DOI] [PubMed] [Google Scholar]
- 18.Kim BY, Olzmann JA, Barsh GS, Chin LS, Li L. Spongiform Neurodegeneration-associated E3 Ligase Mahogunin Ubiquitylates TSG101 and Regulates Endosomal Trafficking. Mol Biol Cell. 2007 doi: 10.1091/mbc.E06-09-0787. [DOI] [PMC free article] [PubMed] [Google Scholar]
- 19.Kitada T, Asakawa S, Hattori N, Matsumine H, Yamamura Y, Minoshima S, Yokochi M, Mizuno Y, Shimizu N. Mutations in the parkin gene cause autosomal recessive juvenile parkinsonism. Nature. 1998;392(6676):605–8. doi: 10.1038/33416. [DOI] [PubMed] [Google Scholar]
- 20.Lane PW. New mutants. Mouse News Letter. 1960;22:35. [Google Scholar]
- 21.Layfield R, Alban A, Mayer RJ, Lowe J. The ubiquitin protein catabolic disorders. Neuropathol Appl Neurobiol. 2001;27(3):171–9. doi: 10.1046/j.1365-2990.2001.00335.x. [DOI] [PubMed] [Google Scholar]
- 22.Leist M, Single B, Castoldi AF, Kuhnle S, Nicotera P. Intracellular adenosine triphosphate (ATP) concentration: a switch in the decision between apoptosis and necrosis. J Exp Med. 1997;185(8):1481–6. doi: 10.1084/jem.185.8.1481. [DOI] [PMC free article] [PubMed] [Google Scholar]
- 23.Lin MT, Beal MF. Mitochondrial dysfunction and oxidative stress in neurodegenerative diseases. Nature. 2006;443(7113):787–95. doi: 10.1038/nature05292. [DOI] [PubMed] [Google Scholar]
- 24.Liu W, Gnanasambandam R, Benjamin J, Kaur G, Getman PB, Siegel AJ, Shortridge RD, Singh S. Mutations in Cytochrome c Oxidase Subunit VIa Cause Neurodegeneration and Motor Dysfunction in Drosophila. Genetics. 2007;176(2):937–46. doi: 10.1534/genetics.107.071688. [DOI] [PMC free article] [PubMed] [Google Scholar]
- 25.Markham A, Cameron I, Franklin P, Spedding M. BDNF increases rat brain mitochondrial respiratory coupling at complex I, but not complex II. Eur J Neurosci. 2004;20(5):1189–96. doi: 10.1111/j.1460-9568.2004.03578.x. [DOI] [PubMed] [Google Scholar]
- 26.Matthews RP, Guthrie CR, Wailes LM, Zhao X, Means AR, McKnight GS. Calcium/calmodulin-dependent protein kinase types II and IV differentially regulate CREB-dependent gene expression. Mol Cell Biol. 1994;14(9):6107–16. doi: 10.1128/mcb.14.9.6107. [DOI] [PMC free article] [PubMed] [Google Scholar]
- 27.Melov S, Schneider JA, Day BJ, Hinerfeld D, Coskun P, Mirra SS, Crapo JD, Wallace DC. A novel neurological phenotype in mice lacking mitochondrial manganese superoxide dismutase. Nat Genet. 1998;18(2):159–63. doi: 10.1038/ng0298-159. [DOI] [PubMed] [Google Scholar]
- 28.Miller KA, Gunn TM, Carrasquillo MM, Lamoreux ML, Galbraith DB, Barsh GS. Genetic studies of the mouse mutations mahogany and mahoganoid. Genetics. 1997;146(4):1407–15. doi: 10.1093/genetics/146.4.1407. [DOI] [PMC free article] [PubMed] [Google Scholar]
- 29.Mogi M, Togari A, Kondo T, Mizuno Y, Komure O, Kuno S, Ichinose H, Nagatsu T. Brain-derived growth factor and nerve growth factor concentrations are decreased in the substantia nigra in Parkinson's disease. Neurosci Lett. 1999;270(1):45–8. doi: 10.1016/s0304-3940(99)00463-2. [DOI] [PubMed] [Google Scholar]
- 30.Nguyen VT, Bensaude O. Increased thermal aggregation of proteins in ATP-depleted mammalian cells. Eur J Biochem. 1994;220(1):239–46. doi: 10.1111/j.1432-1033.1994.tb18619.x. [DOI] [PubMed] [Google Scholar]
- 31.Paz J, Yao H, Lim HS, Lu XY, Zhang W. The neuroprotective role of attractin in neurodegeneration. Neurobiol Aging. 2006 doi: 10.1016/j.neurobiolaging.2006.06.014. [DOI] [PubMed] [Google Scholar]
- 32.Periquet M, Corti O, Jacquier S, Brice A. Proteomic analysis of parkin knockout mice: alterations in energy metabolism, protein handling and synaptic function. Journal of neurochemistry. 2005;95(5):1259–76. doi: 10.1111/j.1471-4159.2005.03442.x. [DOI] [PubMed] [Google Scholar]
- 33.Phillips HS, Hains JM, Armanini M, Laramee GR, Johnson SA, Winslow JW. BDNF mRNA is decreased in the hippocampus of individuals with Alzheimer's disease. Neuron. 1991;7(5):695–702. doi: 10.1016/0896-6273(91)90273-3. [DOI] [PubMed] [Google Scholar]
- 34.Schapira AH. Etiology of Parkinson's disease. Neurology. 2006;66(10) 4:S10–23. doi: 10.1212/wnl.66.10_suppl_4.s10. [DOI] [PubMed] [Google Scholar]
- 35.Shieh PB, Ghosh A. Molecular mechanisms underlying activity-dependent regulation of BDNF expression. J Neurobiol. 1999;41(1):127–34. [PubMed] [Google Scholar]
- 36.Shieh PB, Hu SC, Bobb K, Timmusk T, Ghosh A. Identification of a signaling pathway involved in calcium regulation of BDNF expression. Neuron. 1998;20(4):727–40. doi: 10.1016/s0896-6273(00)81011-9. [DOI] [PubMed] [Google Scholar]
- 37.Simpson PB, Russell JT. Role of mitochondrial Ca2+ regulation in neuronal and glial cell signalling. Brain Res Brain Res Rev. 1998;26(1):72–81. doi: 10.1016/s0165-0173(97)00056-8. [DOI] [PubMed] [Google Scholar]
- 38.Spiliotis ET, Nelson WJ. Here come the septins: novel polymers that coordinate intracellular functions and organization. J Cell Sci. 2006;119:4–10. doi: 10.1242/jcs.02746. [DOI] [PMC free article] [PubMed] [Google Scholar]
- 39.Tarlac V, Storey E. Role of proteolysis in polyglutamine disorders. J Neurosci Res. 2003;74(3):406–16. doi: 10.1002/jnr.10746. [DOI] [PubMed] [Google Scholar]
- 40.van Leeuwen FW, de Kleijn DP, van den Hurk HH, Neubauer A, Sonnemans MA, Sluijs JA, Koycu S, Ramdjielal RD, Salehi A, Martens GJ, Grosveld FG, Peter J, Burbach H, Hol EM. Frameshift mutants of beta amyloid precursor protein and ubiquitin-B in Alzheimer's and Down patients. Science. 1998;279(5348):242–7. doi: 10.1126/science.279.5348.242. [DOI] [PubMed] [Google Scholar]
- 41.Wu H, Kanatous SB, Thurmond FA, Gallardo T, Iosotani E, Bassel-Duby R, Williams RS. Regulation of mitochondrial biogenesis in skeletal muscle by CAMK. Science. 2002;296:349–52. doi: 10.1126/science.1071163. [DOI] [PubMed] [Google Scholar]
- 42.Yan JX, Wait R, Berkelman T, Harry RA, Westbrook JA, Wheeler CH, Dunn MJ. A modified silver staining protocol for visualization of proteins compatible with matrix-assisted laser desorption/ionizaton and electrospray ionization-mass spectrometry. Electrophoresis. 2000;21:3666–72. doi: 10.1002/1522-2683(200011)21:17<3666::AID-ELPS3666>3.0.CO;2-6. [DOI] [PubMed] [Google Scholar]
- 43.Zhang Y, Gao J, Chung KK, Huang H, Dawson VL, Dawson TM. Parkin functions as an E2-dependent ubiquitin- protein ligase and promotes the degradation of the synaptic vesicle-associated protein, CDCrel-1. Proceedings of the National Academy of Sciences of the United States of America. 2000;97(24):13354–9. doi: 10.1073/pnas.240347797. [DOI] [PMC free article] [PubMed] [Google Scholar]
- 44.Zuccato C, Ciammola A, Rigamonti D, Leavitt BR, Goffredo D, Conti L, MacDonald ME, Friedlander RM, Silani V, Hayden MR, Timmusk T, Sipione S, Cattaneo E. Loss of huntingtin-mediated BDNF gene transcription in Huntington's disease. Science. 2001;293(5529):493–8. doi: 10.1126/science.1059581. [DOI] [PubMed] [Google Scholar]
- 45.Zuccato C, Liber D, Ramos C, Tarditi A, Rigamonti D, Tartari M, Valenza M, Cattaneo E. Progressive loss of BDNF in a mouse model of Huntington's disease and rescue by BDNF delivery. Pharmacol Res. 2005;52(2):133–9. doi: 10.1016/j.phrs.2005.01.001. [DOI] [PubMed] [Google Scholar]