

Abstract
Previous studies of postnatal synaptic development in human frontal cortex have shown that synaptic density rises after birth, reaches a plateau in childhood and then decreases to adult levels by late adolescence. A similar pattern has been seen in nonhuman primate cortex. These earlier studies in human cortex are limited, however, by significant age gaps in study subjects at critical inflection points of the developmental curve. Additionally, it is unclear if synaptic development occurs in different patterns in different cortical layers in prefrontal cortex (PFC). The purpose of this study was to examine synaptic density in human PFC across development by measuring two synaptic marker proteins: synaptophysin (presynaptic), and postsynaptic density-95 (PSD-95; postsynaptic). Western blotting was used to assess the relative levels of synaptophysin and PSD-95 in dorsolateral PFC of 42 subjects, distributed in age from 18 weeks gestation to 25 years. In addition, synaptophysin immunoreactivity was examined in each layer of areas 9 and 46 of PFC in 24 subjects, ranging in age from 0.1 to 25 years. Synaptophysin levels slowly increased from birth until age 5 and then increased more rapidly to peak in late childhood around age 10. Synaptophysin subsequently decreased until the adult level was reached by mid-adolescence, around age 16. PSD-95 levels increased postnatally to reach a stable plateau by early childhood with a slight reduction in late adolescence and early adulthood. The pattern of synaptophysin immunoreactivity seen with immunohistochemistry was similar to the Western experiments but the changes across age were more subtle, with little change by layer within and across age. The developmental patterns exhibited by these synaptic marker proteins expand upon previous studies of developmental synaptic changes in human frontal cortex; synaptic density increases steadily from birth to late childhood, then decreases in early adolescence to reach adult levels by late adolescence.
Keywords: adolescence, development, human, synapses, pruning, synaptogenesis
The human brain has the most protracted period of development of any species, with neurodevelopment continuing well into early adulthood. Imaging studies have shown that in the human, the overall volume of the brain increases during childhood and adolescence (Giedd et al. 1999; Sowell et al. 2002; Gilmore et al. 2007). Specifically, the cortical gray matter volume, particularly the frontal and parietal regions, shows a volumetric decrease during this time period while white matter volume continues to increase (Giedd et al. 1999; Sowell et al. 2002). Developmental changes in gray matter volume are thought to be due to changes in the neuropil, which is composed of dendrites, axons and the synapses between them (Lewis 2000). Similarly, studies of cerebral glucose utilization reveal that glucose utilization rates are maximal in childhood and then decline in late childhood and early adolescence (Chugani 1998). These late developmental refinements coincide with the ability to perform higher cognitive tasks (Fuster 2002) and the coming “on line” of the frontal cortex (Goldman-Rakic 1987). Taken together, these studies suggest that cortical circuitry is being refined late in childhood and early adolescence to allow for the efficient processing necessary for adult cognition.
Previous postmortem studies have shown that synaptic density in cortical association areas increases after birth, peaking in early childhood and then exhibits late developmental reductions, or “pruning” in the human (Huttenlocher 1979; Huttenlocher and Dabholkar 1997) and the non-human primate (Rakic et al. 1986; Bourgeois et al. 1994), reaching adult levels in late adolescence or early adulthood. Similarly, the density of dendritic spines on cortical pyramidal neurons also declines by as much as 50% during this developmental period in non-human primates (Anderson et al. 1995). Because spines typically receive only one asymmetric synapse (DeFelipe and Farinas 1992; Harris and Kater 1994), the number of spines is a good approximation of the total number of excitatory synapses on a dendrite. The developmental regulation of synaptic density occurs primarily via pruning of the excitatory axospinous synapses (Bourgeois and Rakic 1993). Accordingly, it is the synapses onto spines that have been shown to be selectively eliminated after birth (Zecevic et al. 1989). In contrast, axodendritic synapse density does not change appreciably after birth and does not show this same dynamic pattern of development (Bourgeois et al. 1994).
Previous studies in the non-human primate suggest that synapses develop at the same rate in different cortical layers (Rakic et al. 1986; Bourgeois et al. 1994). In contrast, studies by Huttenlocher and Dabholkar (Huttenlocher and Dabholkar 1997) suggest that synaptogenesis occurs later in layers 2 and 3 than in layers 4-6 in the middle frontal gyrus of the human. These authors suggest that any potential laminar differences might be difficult to detect in the non-human primate because the non-human primate has a much more condensed period of synaptogenesis as compared to the human.
Synaptophysin is an integral membrane protein of small synaptic vesicles and is localized in all nervous tissue (Wiedenmann and Franke 1985; Navone et al. 1986). Immunoprecipitation (Floor and Feist 1989) and electron microscopic (Jahn et al. 1985; Navone et al. 1986; Hiscock et al. 2000) studies have localized synaptophysin to virtually all, or greater than 90%, of all vesicles. Synaptophysin immunoreactivity has been identified as a useful marker for synaptic density in many studies (Hamos et al. 1989; Masliah et al. 1990; Masliah et al. 1991; Masliah et al. 1991). In addition, synaptophysin levels have been shown to correlate with resting-state brain glucose utilization (Rocher et al. 2003). The function of this protein is still unknown but previous suggestions have included calcium binding (Rehm et al. 1986), channel formation (Sudhof et al. 1987; Thomas et al. 1988), exocytosis (Alder et al. 1992; Alder et al. 1992; Mullany and Lynch 1998), and synaptic vesicle recycling via endocytosis (Evans and Cousin 2005). Furthermore, synaptophysin has also been implicated in disorders of neurodevelopment such as schizophrenia. Evidence for reduced levels of synaptophysin in prefrontal cortex (PFC) in subjects with schizophrenia (Perrone-Bizzozero et al. 1996; Glantz and Lewis 1997; Honer et al. 1999; Karson et al. 1999) has provided important support for the hypothesis of schizophrenia as a disorder of synaptic connectivity (Lewis and Lieberman 2000).
Postsynaptic Density Protein 95 (PSD-95) is a protein localized to the postsynaptic density of asymmetric synapses (Hunt et al. 1996; Valtschanoff et al. 1999; Aoki et al. 2001). Most (greater than 60%) asymmetric synapses have been found to express PSD-95 (Aoki et al. 2001; Petersen et al. 2003). Antibodies to this protein have been used to examine a variety of disorders (Toro and Deakin 2005). The most important role of PSD-95 is to anchor and organize the NMDA receptor and other synaptic proteins in the postsynaptic density (Sheng and Pak 1999; Kim and Sheng 2004). Interactions between PSD-95 and the NMDA receptor in the postsynaptic density may be important for synaptic plasticity (Hata and Takei 1999).
Very few investigations have examined synaptic density changes in the developing human brain. The studies conducted to date indicate that synaptic pruning begins in human cortex sometime in early adulthood. However, these studies are limited by not having examined subjects across an age continuum (Levitt 2003). In particular, in his two influential papers (Huttenlocher 1979; Huttenlocher and Dabholkar 1997), Huttenlocher examined no subjects between ages 7 and 16 and 3 1/2 and 12, respectively, the very interval during which the bulk of synaptic elimination is thought to occur. These studies have utilized electron microscopy to count synapses. Electron microscopy can be very difficult to perform quantitatively in human brain given, in part, the requirement for a very short postmortem interval (PMI). Therefore, we sought to examine two synaptic markers via semi-quantitative Western blotting in the PFC from normal human subjects, evenly distributed in age between mid-gestation to early adulthood. In addition, we examined the immunohistochemical pattern of synaptophysin immunoreactivity on a layer-by-layer basis in the PFC from birth until early adulthood.
Experimental Procedures
Subjects
This study was approved by the Committee on the Protection of the Rights of Human Subjects at the University of North Carolina at Chapel Hill. Human brain tissue from the dorsolateral PFC was obtained from The Brain and Tissue Bank for Developmental Disorders at the University of Maryland (Baltimore MD) and consisted of 42 subjects, evenly distributed in age from 18 weeks gestation to 25.4 years (Table 1). Brains were divided into 7 groups based on age: fetal (18-19 weeks gestation; n = 6), Birth to 12 months (n = 4); 1 to 5 years (n = 6); 6 to 10 years (n = 6); 11 to 15 years (n = 9); 16 to 20 years (n = 4) and 21 to 25 years (n = 7) (Table 1). No subject had a known psychiatric or substance abuse disorder. Individuals died from a variety of causes, none of which were known central nervous system (CNS) disorders. Gross and microscopic examination by a neuropathologist revealed no evidence of CNS pathology. Tissue was assessed for pH values as previously described (Romanczyk et al. 2002). Tissue with a pH less than 5.8 was not used. Subjects with a pH of less than 5.8 that were excluded are not included in the 42 subjects used in this study and listed in Table 1.
Table 1. Demographic Information.
Characteristics of normal subjects. Means for the groups are bolded and are mean ± SD.
| Sample Number | Age† | PMI^ | Race | Gender | pH | Cause of Death |
|---|---|---|---|---|---|---|
| 1 | 18 wks GA | 1.0 | AA | M | 6.5 | Elective abortion |
| 2 | 18 wks GA | 1.0 | AA | F | 6.1 | Elective abortion |
| 3 | 19 wks GA | 1.0 | AA | F | 6.0 | Elective abortion |
| 4 | 19 wks GA | 1.0 | C | M | 6.0 | Elective abortion |
| 5 | 19 wks GA | 1.0 | AA | M | 6.2 | Elective abortion |
| 6 | 19 wks GA | 1.0 | AA | F | 6.0 | Elective abortion |
| Fetal (n=6) | 18.8 ± 0.5 wks GA | 1.0 ± 0.0 | 3/3 (M/F) | 6.1 ± 0.2 | ||
| 7 | 0.01 | 5.0 | AA | M | 6.3 | Heart defect |
| 8 | 0.05 | 9.0 | AA | M | 6.8 | asphyxia |
| 9* | 0.1 | 7.0 | C | M | 6.2 | Idiopathic pulmonary hemorrhage |
| 10 | 0.29 | 11.0 | C | F | 5.8 | Sudden infant death syndrome |
| Infant (n=4) | 0.1 ± 0.1 years | 8.0 ± 2.6 | 3/1 | 6.3 ± 0.4 | ||
| 11* | 1.7 | 10.0 | AA | M | 5.9 | Asthma |
| 12* | 2.2 | 21.0 | AA | F | 6.0 | Acute myocarditis |
| 13 | 2.8 | 12.0 | AA | F | 6.1 | Drowning |
| 14* | 3.3 | 11.0 | AA | F | 6.5 | Drowning |
| 15* | 4.7 | 17.0 | C | M | 5.8 | Drowning |
| 16* | 5.9 | 20.0 | C | F | 6.3 | Drowning |
| 1-5 (n=6) | 3.4 ± 1.6 years | 15.2 ± 4.8 | 2/4 | 6.1 ± 0.3 | ||
| 17 | 6.9 | 18.0 | C | M | 6.3 | MVA with multiple injuries |
| 18* | 8.0 | 5.0 | C | F | 6.4 | Cardiac arrhythmia |
| 19* | 8.1 | 20.0 | AA | F | 6.4 | MVA with multiple injuries |
| 20 | 8.6 | 20.0 | AA | F | 6.5 | Cardiac allograft rejection |
| 21 | 8.9 | 36.0 | C | M | 5.8 | Hypothermia and drowning |
| 22 | 9.1 | 20.0 | AA | F | 6.5 | asthma |
| 6-10 (n=6) | 8.3 ± 0.8 | 19.8 ± 9.8 | 2/4 | 6.3 ± 0.3 | ||
| 23 | 11.6 | 25.0 | C | M | 6.7 | MVA with multiple injuries |
| 24* | 11.7 | 19.0 | AA | M | 6.0 | Drowning |
| 25* | 12.5 | 22.0 | AA | M | 6.2 | Cardiac arrhythmia |
| 26 | 13.0 | 18.0 | C | F | 6.7 | Accident, multiple injuries |
| 27* | 13.3 | 28.0 | AA | M | 6.1 | Thermal injuries |
| 28* | 13.4 | 17.0 | AA | F | 6.8 | asthma |
| 29* | 13.7 | 18.0 | C | M | 6.3 | Struck by motor vehicle |
| 30* | 14.2 | 16.0 | C | M | 6.5 | Cardiac arrhythmia |
| 31* | 15.2 | 20.0 | C | M | 6.5 | Drowning |
| 11-15 (n=9) | 13.2 ± 1.1 | 20.3 ± | 7/2 | 6.4 ± 0.3 | ||
| 32* | 16.5 | 21.0 | AA | M | 6.0 | Cardiac arrhythmia |
| 33* | 17.2 | 14.0 | AA | M | 6.3 | Congenital heart defect |
| 34* | 18.4 | 16.0 | AA | F | 6.1 | asthma |
| 35* | 20.4 | 8.0 | C | M | 6.1 | Accidental gunshot wound to chest |
| 16-20 (n=4) | 18.1 ± 1.7 | 14.8 ± 5.4 | 3/1 | 6.1 ± 0.1 | ||
| 36* | 21.0 | 13.0 | AA | M | 6.2 | drowning |
| 37 | 21.5 | 22.0 | AA | F | 6.1 | asthma |
| 38* | 22.8 | 12.0 | AA | M | 5.8 | Cardiac arrhythmia |
| 39* | 23.0 | 8.0 | AA | M | 6.5 | cardiomyopathy |
| 40* | 23.3 | 21.0 | C | M | 6.3 | drowning |
| 41 | 25.0 | 8.0 | C | M | 6.2 | MVA with compressional asphyxia |
| 42 | 25.4 | 19.0 | AA | M | 6.4 | asthma |
| 21-25 (n=7) | 23.1 ± 1.6 | 14.7 ± 5.9 | 6/1 | 6.2± 0.2 |
Age is in years except for the fetal group where wks GA is weeks gestation.
PMI indicates postmortem interval in hours.
Subjects used for synaptophysin immunohistochemistry. AA, African-American; C, Caucasion; F, female; M, male; MVA, motor vehicle accident.
Western Blot Procedures
Homogenization of dorsolateral PFC tissue was performed as previously described (Jarskog et al. 2000) except the homogenization buffer used in this study was 50 mM Tris-HCl buffer (pH 7.4) with 0.6 M NaCl, 0.2% Triton X-100, 0.1 mM phenylmethylsulfonyl fluoride (PMSF), 1 mM benzamidine, and 0.1 mM benzethenium chloride. Total protein concentrations were determined using the BCA method (Pierce, Rockford IL). Western blotting experiments were performed as previously described (Jarskog et al. 2000). In brief, all 42 samples were run in triplicate in three separate Western blot experiments. Samples were separated on 10-well 10% (synaptophysin) or 4-12% (PSD-95) Tris-glycine polyacrylamide gels and equal amounts of protein (Synaptophysin: 1 μg; PSD-95: 35 ug) were boiled and loaded into gels. All gels were run with a molecular weight marker (Low-Range Rainbow Molecular Weight Marker or ECL DualVue Western Blotting Markers, Amersham Biosciences, Piscataway NJ). Separated proteins were transferred to polyvinylidiene difluoride (PVDF) membranes (Immobilon-P, Millipore MA) at 25V for 90 min and complete and uniform transfer was verified by staining membranes with Ponceau S. Non-specific protein binding was blocked with 5% milk in 0.1% Tween TBS. Membranes were incubated overnight at 4°C with a mouse monoclonal antibody to synaptophysin (1:2000; cat # S5768; Sigma-Aldrich, St. Louis MO) or a goat polyclonal antibody to PSD-95 (1:500; cat # sc-6926; Santa Cruz Biotechnology, Santa Cruz CA) in 5% milk. Membranes were then washed and incubated for 1 hr with a HRP-conjugated secondary antibody in 5% milk (Synaptophysin: 1:4000; PSD-95: 1:3000; ECL, Amersham Biosciences, Piscataway NJ). Membranes were washed and then immunoreactivity was visualized with a chemiluminescence detection method (ECL, Amersham Biosciences) and protein bands were detected on radiographic film (Hyperfilm ECL, Amersham Biosciences) after 1 minute exposure for all proteins. Optical densitometry was performed on each targeted band (Synaptophysin: 38 kDa; PSD-95: 95 kDa) using a computerized image analysis system (Bioquant, Nashville TN). Each band was normalized to a standard which consisted of a pooled homogenate of all of the brains which was also run on each blot. In addition, a standard curve of the pooled control sample was immunoblotted to ascertain that tissue samples fell within the linear portion of the densitometric curve (data not shown).
Immunohistochemistry
Slide-mounted fresh frozen tissue sections from subjects marked with an asterisk in Table 1 were used for immunohistochemical experiments, as previously described (Glantz and Lewis 1997). Three separate immunohistochemical experiments were performed for each of the subjects with one section from each subject included in each experiment. Adjacent sections stained with cresyl violet were used to define laminar and area boundaries. Control experiments involved replacing the primary antibody with normal mouse serum and processing the tissue as usual. No immunoreactivity was observed in this control experiment.
Immunohistochemical Image Analysis
Slide-mounted sections were randomly coded, scanned, and the images were imported into an image analysis software program (Bioquant, Nashville TN) to obtain light transmittance measurements of synaptophysin immunoreactivity. An adjacent Nissl section was used to determine the boundaries of PFC areas 9 and 46 and each layer within areas 9 and 46. Measurements in areas 9 and 46 were grouped together and will be referred to hereafter as PFC. Within PFC, regions of interest were drawn that extended for 5-10 mm across the whole cortical traverse and within each layer. Regions of interest varied in size because measurements were restricted to those portions of the PFC that were cut perpendicular to the pial surface and that were free of any discontinuities of the tissue. Thresholding of the areas to be analyzed was established by setting threshold with a blank slide in order to avoid analyzing the light transmittance of holes in the tissue. The average light transmittance (range of 0-255) was determined in 3 different regions of interest for each layer within the PFC on each section. The values from each region of interest were then averaged to produce a mean cortical and a mean white matter light transmittance value from each layer of each section of each subject. Because synaptophysin immunoreactivity was virtually absent in the white matter of all subjects, light transmittance measurements in the white matter were used to control for possible nonspecific differences between subjects. Adjusted optical density values were calculated from the mean light transmittance values according to the equation: adjusted optical density = log (light transmittance in white matter/light transmittance in cortex), as previously described (Glantz and Lewis 1997). The adjusted optical density values were then used for comparisons between the age groups. This method of optical density measurement analysis has previously been shown to reflect very well the pattern of synaptophysin immunoreactivity (Glantz and Lewis 1997).
Effect of PMI on synaptic protein levels
Male Sprague-Dawley rats (150-200 g, Charles River, Raleigh NC) were sacrificed and, in one group (n=6), frontal cortex was dissected and immediately frozen at -80°C. To approximate the human postmortem condition, heads of the other group (n=7) were kept at 25°C for 6 hrs and then at 4°C for 18 hrs, after which the frontal cortex was dissected out and frozen. All tissues were homogenized and sonicated, and Western blots of synaptophysin and PSD-95 were performed as described above.
Statistical Analyses
Brain samples were divided a priori into 7 groups based on age: fetal (18-19 weeks gestation ; n = 6), Birth to 12 months (n = 4); 1 to 5 years (n = 6); 6 to 10 years (n = 6); 11 to 15 years (n = 9); 16 to 20 years (n = 4) and 21 to 25 years (n = 7) (Table 1). Western blot and immunohistochemical data of synaptic marker proteins were analyzed by one-way analysis of variance (ANOVA) across age groups with significance set at α = 0.05, and post hoc Tukey’s multiple comparison tests were performed using two-tailed p values considered significant at α = 0.05 with GraphPad Prism Version 4.01 (GraphPad Software, San Diego, CA). In a secondary analysis of the Western blot data, each protein was regressed with age using linear and curvilinear models and adding PMI and pH as a covariate.
Results
Subject Comparisons
When subjects were grouped according to Table 1, subjects did not differ significantly with respect to pH (F6,35 = 1.323, P > 0.05). There were significant differences between the groups with respect to PMI (F6.35 = 9.704, P < 0.05). The groups that differed from each other were: fetal vs all groups except 0 - 12 mos; 0 - 12 mos vs 6-10 yrs and 11-15 yrs. We included PMI and pH in our statistical model in order to determine their potential impact on the main outcome variables.
Synaptophysin Western Blot
Synaptophysin immunoreactive bands in PFC were observed at the predicted molecular weight of 38 kDa (Figure 1A). Synaptophysin levels were significantly regulated across the age groups (ANOVA: F6,35 = 9.53, P < 0.0001). Synaptophysin was present but almost undetectable in fetal cortex. This undetectability was due to the small amount of protein loaded onto the gels as synaptophysin bands do appear in the fetal samples when more protein is loaded. Postnatally, levels increased slowly in the 0 - 12 month group, after which levels increased more rapidly to reach a peak in the 6-10 year age group (Figure 2). After age 10, levels of synaptophysin decreased until the adult level was reached at age 16. In post hoc analysis, a Tukey’s multiple comparison test demonstrated differences among the following age groups at the α = 0.05 level: fetal vs 0 - 12 months (mos), fetal vs 6-10 years (yrs), fetal vs 11-15 yrs, 0 - 12 mos vs 6-10 yrs, 0 - 12 mos vs 11-15 yrs, 1-5 yrs vs 6-10 yrs, 6-10 yrs vs 16-20 yrs and 6-10 yrs vs 21-25 yrs (Figure 2). The relationship between synaptophysin levels and age of each individual subject exhibited a curvilinear relationship (R2 = 0.4580, P < 0.0001). The relationship did not change when covarying for PMI and pH (R2 = 0.4941, P = 0.0054).
Figure 1.

A. Representative Western blot of synaptophysin expression in the PFC of human subjects across development. An equal amount of total protein was added to each lane. Synaptophysin immunoreactive bands migrated to 38 kDa. Lane 1 shows molecular weight markers. Lanes 2-8 contain samples 1 (age 18 wks gestational age), 9 (0.1 yrs), 13 (2.8 yrs), 22 (9.1 yrs), 31 (15.2 yrs), 34 (18.4 yrs) and 38 (22.8 yrs), respectively. B. Representative Western blot of PSD-95 expression in the PFC of subjects across development. An equal amount of total protein was added to each lane. PSD-95 immunoreactive bands migrated to 95 kDa. Lane 1 shows molecular weight markers. Lanes 2-8 contain samples 2 (age 18 wks gestational age), 10 (0.29 yrs), 13 (2.8 yrs), 20 (8.6 yrs), 31 (15.2 yrs), 32 (16.5 yrs), and 37 (21.5 yrs), respectively.
Figure 2.
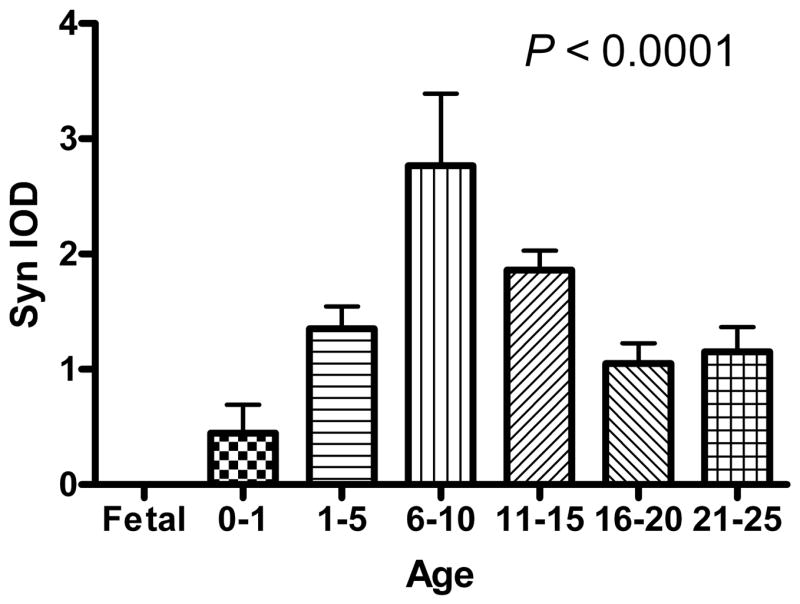
Mean (± S.D.) synaptophysin levels in the PFC of normal subjects as measured by integrated optical density (IOD) and separated into 7 age groups from mid-gestation until early adulthood. Synaptophysin demonstrates developmental regulation by ANOVA (F6,35 = 9.53, P < 0.0001).
PSD-95 Western Blot
PSD-95 immunoreactive bands in PFC were observed at the predicted molecular weight of 95 kDa (Figure 1B). A one-way ANOVA revealed a significant difference between the age groups (F6,35 = 3.20, P < 0.05). Levels of PSD-95 increased from birth, with a peak in early adolescence followed by a slight decline into early adulthood (Figure 3). In post hoc analysis, the following age groups differed by a Tukey’s multiple comparison test at the α = 0.05 level: fetal vs 11-15 yrs, and 0 - 12 mos vs 11-15 yrs. In a secondary analysis, levels of PSD-95 for each individual subject exhibited a linear relationship with age (R2 = 0.1154, P = 0.0277). When covarying for PMI and pH, this relationship was no longer significant (R2 = 0.2218, P = 0.0994).
Figure 3.

Mean (± S.D.) PSD-95 levels in the PFC of normal subjects as measured by integrated optical density (IOD) and separated into 7 age groups from mid-gestation until early adulthood. PSD-95 demonstrates developmental regulation by ANOVA (F6,35 = 3.20, P < 0.05).
Synaptophysin Immunohistochemistry
Because synaptophysin exhibited a very dynamic pattern on the Western blots across development and because synaptophysin is thought to be in virtually every synapse, we examined the pattern of synaptophysin immunoreactivity via immunohistochemistry on tissue sections. Synaptophysin immunoreactivity (IR) exhibited a punctate pattern throughout the cortical neuropil across all subjects (Figure 4, 5). Optical density of synaptophysin IR across all cortical layers was lowest in infancy and then increased rapidly to reach a plateau by the 6-10 yrs group (Figure 6). Although the optical density of synaptophysin IR appeared slightly lower in the young adult group compared to the pre-adolescent and adolescent groups, the immunohistochemical data did not show the markedly more dynamic changes in synaptophysin levels across age as observed in the Western blot experiment. Laminar assessment of synaptophysin IR showed a consistent pattern across all age groups. Levels of synaptophysin IR were highest in layer 1/2 and then slowly decreased through layer 6. Furthermore, layers 3, 4 and 5 appear to reflect most closely the overall changes in the levels of synaptophysin immunoreactivity across the entire cortical mantle (Figure 7).
Figure 4.
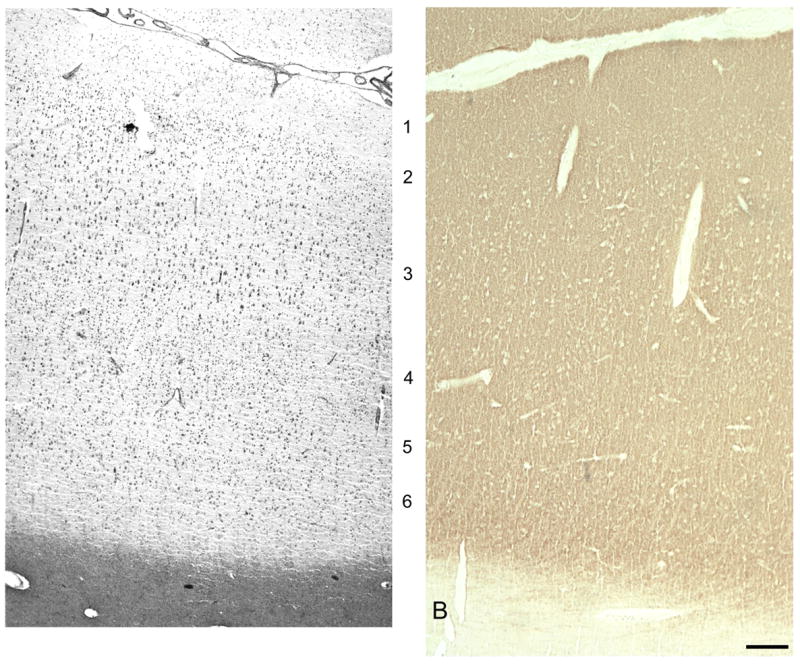
A. Brightfield photomicrograph montage from PFC area 46 of Nissl staining in a 20 μm section from a 14 year old subject. B. Brightfield photomicrograph from PFC area 46 of synaptophysin staining in a nearly adjacent 20 μm section from the same 14 year old subject. Calibration bar = 250 μm.
Figure 5.
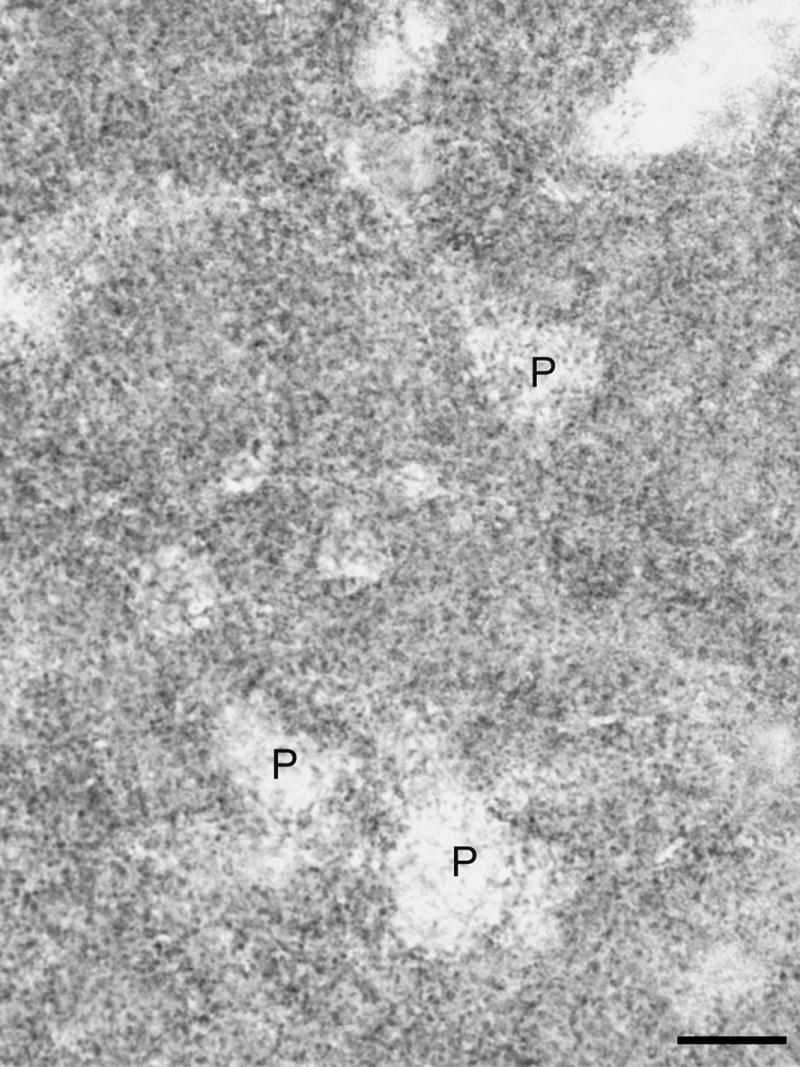
Brightfield photomicrograph from PFC area 46 of synaptophysin immunoreactivity in a 20 μm section from a 13.3 year old subject. P denotes pyramidal neurons which are outlined by synaptophysin immunoreactivity. Calibration bar = 20 μm.
Figure 6.

Mean (± S.D.) adjusted optical density (Adj OD) measures of synaptophysin immunoreactivity in 20 μm sections in the PFC of normal subjects as a function of age.
Figure 7.
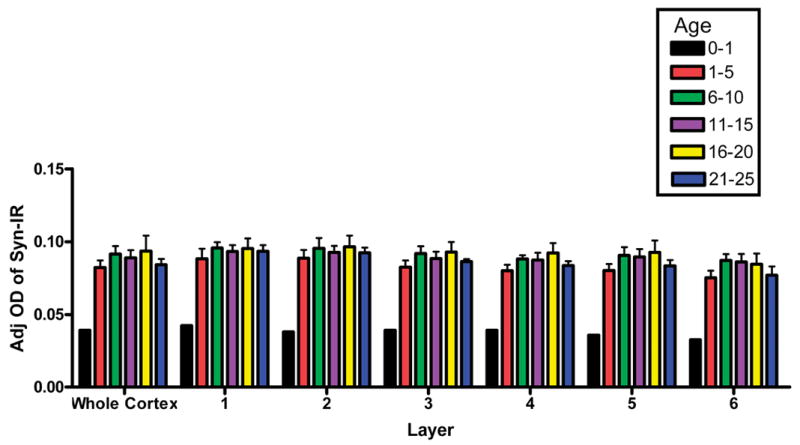
Mean adjusted optical density measures of synaptophysin levels in the PFC of normal subjects across age for the cortex as a whole and for each individual cortical layer.
Postmortem effects
In order to determine if PMI affected synaptophysin and PSD-95 levels, rodent brains subjected to a PMI of 0 or 24 hours were compared. In our model, synaptophysin levels were not affected by a 24 hour PMI (t = 0.92, P > 0.05) while PSD-95 levels decreased by 64.5% after a 24 hour PMI (t = 3.8, P < 0.05).
Discussion
The pattern of immunoreactivity on Western blots demonstrated by the synaptic marker synaptophysin in human PFC generally agrees with previous studies of developmental changes in synaptic density in the primate cerebral cortex (Huttenlocher 1979; Rakic et al. 1986; Zecevic et al. 1989; Bourgeois and Rakic 1993). The present data suggests robust synaptogenesis during early childhood, with synaptic density reaching a peak in late childhood, followed by the onset of synaptic elimination (a.k.a. synaptic pruning) around early adolescence, to reach adult levels by late adolescence. In his 1979 paper, Huttenlocher concluded that synaptic density peaked during the first year of life in the human and that after the age of 1 year, synaptic density persisted and declined until adolescence. However, our data show that synaptic density increases much later into childhood, from birth until late childhood (age 10) and then decreases throughout adolescence to reach the adult levels in the later teenage years. Our study therefore suggests that synaptic density increases progressively throughout childhood, instead of only during the first several years of life, as previously thought (Huttenlocher 1979). Synaptophysin content as shown by immunohistochemistry confirmed the increasing pattern of synaptic density in early childhood but it suggested a more stable pattern of immunoreactivity during adolescence and into adulthood. The individual layers of the PFC exhibited comparable levels of synaptophysin immunoreactivity, a pattern similar to that seen in a study of the human neocortex (Masliah et al. 1990), and which is consistent with previous studies which have shown that synaptic density is fairly equivalent across all layers (Zecevic et al. 1989). However, two other studies (Bourgeois et al. 1994; Huttenlocher and Dabholkar 1997) have shown that layers 2 and 3 have a higher synaptic density than layers 1 and 4-6. A more subtle pattern of immunoreactivity between layers seen here in the immunohistochemical experiments could be due to several factors including reduced sensitivity of immunohistochemistry compared to Western blot and the fact that immunohistochemistry is inherently a less quantitative technique. Also, sectioned PFC was only available from a subset of subjects included in the Western blot experiment (25 of 42 subjects). It is interesting that the levels of synaptophysin seen via Western blotting and immunohistochemistry were similar during early development when synaptogenesis is occurring while the levels of synaptophysin differed between the two experimental methodologies mainly in the late childhood and adolescent time periods. Western blotting involves grinding up the tissue and potentially allowing better access to the antigen by the antibody while the antibody may not be able to access the antigen as well with immunohistochemistry. This could reflect that synaptophysin levels are changing within synapses at a greater level after early childhood than can readily be detected via immunohistochemistry due to the spatial constraints of the visualization method.
PSD-95 levels also exhibited an increase from birth through late childhood by Western blot. However, unlike synaptophysin, PSD-95 levels do not exhibit a significant decrease in late adolescence. These results are similar to that seen in the mouse and rodent hippocampus and cortex with Western blotting (Sans et al. 2000) and electron microscopy (Liu et al. 2004). Because only about 60% of excitatory synapses express PSD-95 (Aoki et al. 2001), it is possible that those excitatory synapses which do not express PSD-95 are preferentially eliminated during adolescence. However, a recent study of cultured neurons overexpressing PSD-95 suggests that PSD-95 contributes to the synaptic maturation and stabilization of excitatory synapses (El-Husseini et al. 2000). Therefore, increased levels of PSD-95 in adolescence and adulthood may reflect intrasynaptic maturational/stability factors rather than a continued increase in synaptic number, considered further below.
The simplest explanation of these results is that they reflect the pattern of synaptic development across perinatal and postnatal cortical development. Because we see somewhat similar patterns (i.e., increasing levels) with both synapse-associated proteins, particularly during the first ten years of postnatal development, this data suggests that changes are due to a structure common to both proteins, most likely the synapse, during early and late childhood. However, there are other explanations that may also contribute to these results. The changes observed across development, especially during adolescence when the patterns diverge between the two proteins (synaptophysin decreasing and PSD-95 plateauing), may be due to specific developmental changes in each protein occurring independently of synaptic development. For example, if the synaptic concentration of PSD-95 increases with age, this could account for the absence of a significant reduction in late adolescence. Recent data has shown that PSD-95 diffuses rapidly between synapses and PSD-95 levels determine synaptic size and strength (Gray et al. 2006) In addition, PSD-95 is retained at synapses longer with increasing age (Gray et al. 2006). This data, taken together with our results, suggest that the pattern of PSD-95 that we observe during adolescence could reflect synapses becoming more stable and PSD-95 being retained longer by synapses. Alternatively, the number of synaptic vesicles per synapse and/or the size of the postsynaptic density may be changing across development to further explain the pattern of synaptophysin and PSD-95 immunoreactivity, respectively. A study by Nakamura et al. (Nakamura et al. 1999) found that early in postnatal development, the number of synaptic vesicles per synapse matures somewhat earlier than the number of synapses, suggesting that early levels of synaptophysin might reflect a greater density of synaptic vesicles per synapse than represent an accurate reflection of synapses. In addition, levels of synaptic proteins may in part reflect synaptic activity (Eastwood and Harrison 2001). In addition, the pattern of immunoreactivity exhibited by synaptophysin parallels the pattern observed for cerebral metabolism in human cerebral cortex from birth to late adolescence using positron emission tomography studies (Chugani 1998). This is to be expected, as glucose metabolism is thought to be an indirect measure of the number of synapses in the cortex and levels of synaptophysin have been shown to correlate with glucose metabolism (Rocher et al. 2003). Finally, the decrease in synapse density late in adolescence corresponds well with the increasing ability to perform certain prefrontal cortical-dependent tasks (Casey et al. 2000), consistent with the idea that normal synaptic pruning serves to improve the efficiency of synaptic connectivity.
A previous study in the human suggested that supragranular pyramidal neuron spine density, a measure of excitatory synapses, continues to decrease beyond age 20 and does not plateau at the adult level until much later in life, around age 40, at least in prefrontal area 10 and occipital area 18 (Jacobs et al. 1997). This would suggest that if we were to continue to examine synaptic marker levels in adults over age 25, their levels would continue to decrease until the plateau corresponding to adult levels is attained. Indeed, Masliah et al (Masliah et al. 1993) showed that synaptophysin levels did in fact continue to drop off slowly after age 40 and then decrease even more later in life.
Several potentially confounding variables in the current study were considered. First, each age group had a relatively small number of subjects which likely increased variability across groups and limited the statistical power of the study. Variability in synaptic number may particularly emerge in the pre-adolescent and adolescent groups given recent data indicating that IQ correlates with the trajectory of gray matter changes on MRI during adolescence (Shaw et al. 2006). While unavoidable in a postmortem analysis, the cross-sectional nature of the study limits the ability to label the findings as changes across age because of individual variability (see (Kraemer et al. 2000). The impact of postmortem stability was also considered. In rat cortex, previous studies have shown that synaptophysin and PSD-95 levels do not exhibit significant decreases with PMI less than 72 hours (Halim et al. 2003; Hilbig et al. 2004; Siew et al. 2004). In human cortex, synaptophysin levels appear to be fairly robust over PMIs of less than 84 hours (but see Vawter et al. 2002) (Honer et al. 1992; Eastwood et al. 1994; Eastwood et al. 1994; Vawter et al. 2002). These findings are consistent with our study of the postmortem stability of synaptophysin in rat cortex over 24 hours. However, in the human, PSD-95 showed a significant decrease in protein levels with postmortem intervals greater than 24 hours (Siew et al. 2004) as was also suggested by our PMI study in rat cortex. We included PMI in our statistical model and found that PMI did not influence synaptophysin levels, but did affect those of PSD-95, in the human.
The current study provides evidence from synaptophysin and PSD-95 in human PFC that robust synaptogenesis occurs during the first ten years of life. Subsequent reductions in synaptophysin indicate that a period of synaptic elimination occurs in adolescence, particularly during the 11-15 year age range, and continues until the twenties. This developmental pattern of synaptic maturation has been proposed to allow for recovery and/or adaptation of the normal brain (Webb et al. 2001) and for the maturation of cognitive function (Goldman-Rakic 1987). These data shed important light on neurodevelopmental disorders such as schizophrenia, in which the age of symptom onset overlaps with the age interval during which late developmental refinement of synaptic connectivity is occurring. In fact, the importance of altered synaptic elimination in the pathogenesis of schizophrenia has long been posited (Feinberg 1982-83) but until recently, data to support even normal developmental synaptic elimination has been scarce. Identifying the pattern of normal synaptic development of the human cortex is critical to a better understanding of the many diseases thought to be related to synaptic maldevelopment.
Acknowledgments
This study was supported by NIMH grants MH-069655 (LAG), MH-01752 (LFJ) and MH-64065 (JHG). We thank Hong Meng for technical assistance. The human tissue was kindly provided by the Brain and Tissue Bank for Developmental Disorders at the University of Maryland.
ABBREVIATIONS
- AA
African-American
- ANOVA
analysis of variance
- C
Caucasian
- CNS
central nervous system
- F
female
- GA
gestational age
- M
male
- PMI
postmortem interval
- PFC
prefrontal cortex
- PSD-95
postsynaptic density protein 95
- SD
standard deviation
- WKS
weeks
Footnotes
Previously presented at the meetings for the Society of Biological Psychiatry, May 2005 and the Society for Neuroscience, November 2005
Publisher's Disclaimer: This is a PDF file of an unedited manuscript that has been accepted for publication. As a service to our customers we are providing this early version of the manuscript. The manuscript will undergo copyediting, typesetting, and review of the resulting proof before it is published in its final citable form. Please note that during the production process errors may be discovered which could affect the content, and all legal disclaimers that apply to the journal pertain.
References
- Alder J, Lu B, Valtorta F, Greengard P, Poo M-m. Calcium-dependent transmitter secretion reconstituted in Xenopus oocytes: requirement for synaptophysin. Science. 1992;257:657–661. doi: 10.1126/science.1353905. [DOI] [PubMed] [Google Scholar]
- Alder J, Xie ZP, Valtorta F, Greengard P, Poo M-m. Antibodies to synaptophysin interfere with transmitter secretion at neuromuscular synapses. Neuron. 1992;9:759–768. doi: 10.1016/0896-6273(92)90038-f. [DOI] [PubMed] [Google Scholar]
- Anderson SA, Classey JD, Conde F, Lund JS, Lewis DA. Synchronous development of pyramidal neuron dendritic spines and parvalbumin-immunoreactive chandelier neuron axon terminals in layer III of monkey prefrontal cortex. Neuroscience. 1995;67(1):7–22. doi: 10.1016/0306-4522(95)00051-j. [DOI] [PubMed] [Google Scholar]
- Aoki C, Miko I, Oviedo H, Mikeladze-Dvali T, Alexandre L, Sweeney N, Bredt DS. Electron microscopic immunocytochemical detection of PSD-95, PSD-93, SAP-102, and SAP-97 at postsynaptic, presynaptic, and nonsynaptic sites of adult and neonatal rat visual cortex. Synapse. 2001;40(4):239–257. doi: 10.1002/syn.1047. [DOI] [PubMed] [Google Scholar]
- Bourgeois JP, Goldman-Rakic PS, Rakic P. Synaptogenesis in the prefrontal cortex of rhesus monkeys. Cereb Cortex. 1994;4:78–96. doi: 10.1093/cercor/4.1.78. [DOI] [PubMed] [Google Scholar]
- Bourgeois JP, Rakic P. Changes of synaptic density in the primary visual cortex of the macaque monkey from fetal to adult stage. J Neurosci. 1993;13(7):2801–2820. doi: 10.1523/JNEUROSCI.13-07-02801.1993. [DOI] [PMC free article] [PubMed] [Google Scholar]
- Casey BJ, Giedd JN, Thomas KM. Structural and functional brain development and its relation to cognitive development. Biol Psychiatry. 2000;54:241–257. doi: 10.1016/s0301-0511(00)00058-2. [DOI] [PubMed] [Google Scholar]
- Chugani HT. A critical period of brain development: studies of cerebral glucose utilization with PET. Prev Med. 1998;27:184–188. doi: 10.1006/pmed.1998.0274. [DOI] [PubMed] [Google Scholar]
- DeFelipe J, Farinas I. The pyramidal neuron of the cerebral cortex: morphological and chemical characteristics of the synaptic inputs. Prog Neurobiol. 1992;39:563–607. doi: 10.1016/0301-0082(92)90015-7. [DOI] [PubMed] [Google Scholar]
- Eastwood SL, Burnet PWJ, Harrison PJ. Striatal synaptophysin expression and haloperidol-induced synaptic plasticity. NeuroReport. 1994;5:677–680. doi: 10.1097/00001756-199402000-00004. [DOI] [PubMed] [Google Scholar]
- Eastwood SL, Burnet PWJ, McDonald B, Clinton J, Harrison PJ. Synaptophysin gene expression in human brain: a quantitative in situ hybridization and immunocytochemical study. Neuroscience. 1994;59(4):881–892. doi: 10.1016/0306-4522(94)90292-5. [DOI] [PubMed] [Google Scholar]
- Eastwood SL, Harrison PJ. Synaptic pathology in the anterior cingulate cortex in schizophrenia and mood disorders. A review and a Western blot study of synaptophysin, GAP-43 and the complexins. Brain Res Bull. 2001;55(5):569–578. doi: 10.1016/s0361-9230(01)00530-5. [DOI] [PubMed] [Google Scholar]
- El-Husseini AED, Schnell E, Chetkovich DM, Nicoll RA, Bredt DS. PSD-95 involvement in maturation of excitatory synapses. Science. 2000;290:1364–1368. [PubMed] [Google Scholar]
- Evans GJO, Cousin MA. Tyrosine phosphorylation of synaptophysin in synaptic vesicle recycling. Biochem Soc Trans. 2005;33(6):1350–1353. doi: 10.1042/BST20051350. [DOI] [PMC free article] [PubMed] [Google Scholar]
- Feinberg I. Schizophrenia: caused by a fault in programmed synaptic elimination during adolescence? J Psychiatr Res. 198283;17(4):319–334. doi: 10.1016/0022-3956(82)90038-3. [DOI] [PubMed] [Google Scholar]
- Floor E, Feist BE. Most synaptic vesicles isolated from rat brain carry three membrane proteins, SV2, synaptophysin, and p65. J Neurochem. 1989;52:1433–1437. doi: 10.1111/j.1471-4159.1989.tb09190.x. [DOI] [PubMed] [Google Scholar]
- Fuster JM. Frontal lobe and cognitive development. J Neurocytol. 2002;31:373–385. doi: 10.1023/a:1024190429920. [DOI] [PubMed] [Google Scholar]
- Giedd JN, Blumenthal J, Jeffries NO, Castellanos FX, Liu J, Zijdenbos A, Paus T, Evans AC, Rapoport JL. Brain development during childhood and adolescence: a longitudinal MRI study. Nat Neurosci. 1999;2(10):861–863. doi: 10.1038/13158. [DOI] [PubMed] [Google Scholar]
- Gilmore JH, Lin W, Prastawa MW, Looney CB, Vetsa YSK, Knickmeyer RC, Evans DD, Smith JK, Hamer RM, Lieberman JA, Gerig G. Regional gray matter growth, sexual dimorphism, and cerebral asymmetry in the neonatal brain. J Neurosci. 2007;27(6):1255–1260. doi: 10.1523/JNEUROSCI.3339-06.2007. [DOI] [PMC free article] [PubMed] [Google Scholar]
- Glantz LA, Lewis DA. Reduction of synaptophysin immunoreactivity in the prefrontal cortex of subjects with schizophrenia: regional and diagnostic specificity. Arch Gen Psychiatry. 1997;54:943–952. doi: 10.1001/archpsyc.1997.01830220065010. [DOI] [PubMed] [Google Scholar]
- Goldman-Rakic PS. Circuitry of primate prefrontal cortex and regulation of behavior by representational memory. In: Plum F, Mountcastle V, editors. Handbook of Physiology. Vol. 5. Bethesda: American Physiological Society; 1987. pp. 373–417. [Google Scholar]
- Gray NW, Weimer RM, Bureau I, Svoboda K. Rapid redistribution of synaptic PSD-95 in the neocortex in vivo. PLoS Biol. 2006;4(11):e370. doi: 10.1371/journal.pbio.0040370. [DOI] [PMC free article] [PubMed] [Google Scholar]
- Halim ND, Weickert CS, McClintock BW, Hyde TM, Weinberger DR, Kleinman JE, Lipska BK. Presynaptic proteins in the prefrontal cortex of patients with schizophrenia and rats with abnormal prefrontal development. Mol Psychiatry. 2003;8:797–810. doi: 10.1038/sj.mp.4001319. [DOI] [PubMed] [Google Scholar]
- Hamos JE, DeGennaro LJ, Drachman DA. Synaptic loss in Alzheimer’s disease and other dementias. Neurol. 1989;39:355–361. doi: 10.1212/wnl.39.3.355. [DOI] [PubMed] [Google Scholar]
- Harris KM, Kater SB. Dendritic spines: cellular specializations imparting both stability and flexibility to synaptic function. Annu Rev Neurosci. 1994;17:341–371. doi: 10.1146/annurev.ne.17.030194.002013. [DOI] [PubMed] [Google Scholar]
- Hata Y, Takei Y. Roles of postsynaptic density-95/synapse-associated protein 90 and its interacting proteins in the organization of synapses. Cell Mol Life Sci. 1999;56:461–472. doi: 10.1007/s000180050445. [DOI] [PMC free article] [PubMed] [Google Scholar]
- Hilbig H, Bidmon HJ, Oppermann OT, Remmerbach T. Influence of post-mortem delay and storage temperature on the immunohistochemical detection of antigens in the CNS of mice. Exp Toxicol Pathol. 2004;56(3):159–171. doi: 10.1016/j.etp.2004.08.002. [DOI] [PubMed] [Google Scholar]
- Hiscock JJ, Murphy S, Willoughby JO. Confocal microscopic estimation of GABAergic nerve terminals in the central nervous system. J Neurosci Methods. 2000;95:1–11. doi: 10.1016/s0165-0270(99)00163-6. [DOI] [PubMed] [Google Scholar]
- Honer WG, Falkai P, Chen C, Arango V, Mann JJ, Dwork AJ. Synaptic and plasticity-associated proteins in anterior frontal cortex in severe mental illness. Neuroscience. 1999;91:1247–1255. doi: 10.1016/s0306-4522(98)00679-4. [DOI] [PubMed] [Google Scholar]
- Honer WG, Kaufmann CA, Davies P. Characterization of a synaptic antigen of interest in neuropsychiatric illness. Biol Psychiatry. 1992;31:147–158. doi: 10.1016/0006-3223(92)90201-a. [DOI] [PubMed] [Google Scholar]
- Hunt CA, Schenker LJ, Kennedy MB. PSD-95 is associated with the postsynaptic density and not with the presynaptic membrane at forebrain synapses. J Neurosci. 1996;16(4):1380–1388. doi: 10.1523/JNEUROSCI.16-04-01380.1996. [DOI] [PMC free article] [PubMed] [Google Scholar]
- Huttenlocher PR. Synaptic density in human frontal cortex - developmental changes and effects of aging. Brain Res. 1979;163:195–205. doi: 10.1016/0006-8993(79)90349-4. [DOI] [PubMed] [Google Scholar]
- Huttenlocher PR, Dabholkar AS. Regional differences in synaptogenesis in human cerebral cortex. J Comp Neurol. 1997;387:167–178. doi: 10.1002/(sici)1096-9861(19971020)387:2<167::aid-cne1>3.0.co;2-z. [DOI] [PubMed] [Google Scholar]
- Jacobs B, Driscoll L, Schall M. Life-span dendritic and spine changes in areas 10 and 18 of human cortex: a quantitative golgi study. J Comp Neurol. 1997;386:661–680. [PubMed] [Google Scholar]
- Jahn R, Schiebler W, Ouimet C, Greengard P. A 38,000-dalton membrane protein (p38) present in synaptic vesicles. Proc Natl Acad Sci USA. 1985;82:4137–4141. doi: 10.1073/pnas.82.12.4137. [DOI] [PMC free article] [PubMed] [Google Scholar]
- Jarskog LF, Gilmore JH, Selinger ES, Lieberman JA. Cortical Bcl-2 protein expression and apoptotic regulation in schizophrenia. Biol Psychiatry. 2000;48:641–650. doi: 10.1016/s0006-3223(00)00988-4. [DOI] [PubMed] [Google Scholar]
- Karson CN, Mrak RE, Schluterman KO, Sturner WQ, Sheng JG, Griffin WST. Alterations in synaptic proteins and their encoding mRNAs in prefrontal cortex in schizophrenia: a possible neurochemical basis for ‘hypofrontality’. Mol Psychiatry. 1999;4:39–45. doi: 10.1038/sj.mp.4000459. [DOI] [PubMed] [Google Scholar]
- Kim E, Sheng M. PDZ domain proteins of synapses. Nat Rev Neurosci. 2004;5:771–781. doi: 10.1038/nrn1517. [DOI] [PubMed] [Google Scholar]
- Kraemer HC, Yesavage JA, Taylor JL, Kupfer D. How can we learn about developmental processes from cross-sectional studies, or can we? Am J Psychiatry. 2000;157(2):163–171. doi: 10.1176/appi.ajp.157.2.163. [DOI] [PubMed] [Google Scholar]
- Levitt P. Structural and functional maturation of the developing primate brain. J Pediatr. 2003;143:S35–S45. doi: 10.1067/s0022-3476(03)00400-1. [DOI] [PubMed] [Google Scholar]
- Lewis DA. The organization of cortical circuitry. In: Harrison PJ, Roberts GW, editors. The neuropathology of schizophrenia: progress and interpretation. Oxford, New York: Oxford University Press; 2000. pp. 235–256. [Google Scholar]
- Lewis DA, Lieberman JA. Catching up on schizophrenia: natural history and neurobiology. Neuron. 2000;28(2):325–334. doi: 10.1016/s0896-6273(00)00111-2. [DOI] [PubMed] [Google Scholar]
- Liu XB, Murray KD, Jones EG. Switching of NMDA receptor 2A and 2B subunits at thalamic and cortical synapses during early postnatal development. J Neurosci. 2004;24(40):8885–8895. doi: 10.1523/JNEUROSCI.2476-04.2004. [DOI] [PMC free article] [PubMed] [Google Scholar]
- Masliah E, Fagan AM, Terry RD, DeTeresa R, Mallory M, Gage FH. Reactive synaptogenesis assessed by synaptophysin immunoreactivity is associated with GAP-43 in the dentate gyrus of the adult rat. Exp Neurol. 1991;113:131–142. doi: 10.1016/0014-4886(91)90169-d. [DOI] [PubMed] [Google Scholar]
- Masliah E, Hansen L, Albright T, Mallory M, Terry RD. Immunoelectron microscopic study of synaptic pathology in Alzheimer’s disease. Acta Neuropathol. 1991;81:428–433. doi: 10.1007/BF00293464. [DOI] [PubMed] [Google Scholar]
- Masliah E, Mallory M, Hansen L, DeTeresa R, Terry RD. Quantitative synaptic alterations in the human neocortex during normal aging. Neurol. 1993;43:192–197. doi: 10.1212/wnl.43.1_part_1.192. [DOI] [PubMed] [Google Scholar]
- Masliah E, Terry RD, Alford M, DeTeresa R. Quantitative immunohistochemistry of synaptophysin in human neocortex: an alternative method to estimate density of presynaptic terminals in paraffin sections. J Histochem Cytochem. 1990;38:837–844. doi: 10.1177/38.6.2110586. [DOI] [PubMed] [Google Scholar]
- Mullany PM, Lynch MA. Evidence for a role for synaptophysin in expression of long-term potentiation in rat dentate gyrus. NeuroReport. 1998;9:2489–2494. doi: 10.1097/00001756-199808030-00012. [DOI] [PubMed] [Google Scholar]
- Nakamura H, Kobayashi S, Ohashi Y, Ando S. Age-changes of brain synapses and synaptic plasticity in response to an enriched environment. J Neurosci Res. 1999;56:307–315. doi: 10.1002/(SICI)1097-4547(19990501)56:3<307::AID-JNR10>3.0.CO;2-3. [DOI] [PubMed] [Google Scholar]
- Navone F, Jahn R, Gioia GD, Stukenbrok H, Greengard P, Camilli PD. Protein p38: an integral membrane protein specific for small vesicles of neurons and neuroendocrine cells. J Cell Biol. 1986;103(6):2511–2527. doi: 10.1083/jcb.103.6.2511. [DOI] [PMC free article] [PubMed] [Google Scholar]
- Perrone-Bizzozero NI, Sower AC, Bird ED, Benowitz LI, Ivins KJ, Neve RL. Levels of the growth-associated protein GAP-43 are selectively increased in association cortices in schizophrenia. Proc Natl Acad Sci USA. 1996;93:14182–14187. doi: 10.1073/pnas.93.24.14182. [DOI] [PMC free article] [PubMed] [Google Scholar]
- Petersen JD, Chen X, Vinade L, Dosemeci A, Lisman JE, Reese TS. Distribution of postsynaptic density (PSD)-95 and Ca2+/Calmodulin-dependent protein kinase II at the PSD. J Neurosci. 2003;23(35):11270–11278. doi: 10.1523/JNEUROSCI.23-35-11270.2003. [DOI] [PMC free article] [PubMed] [Google Scholar]
- Rakic P, Bourgeois JP, Eckenhoff MF, Zecevic N, Goldman-Rakic PS. Concurrent overproduction of synapses in diverse regions of the primate cerebral cortex. Science. 1986;232(4747):232–235. doi: 10.1126/science.3952506. [DOI] [PubMed] [Google Scholar]
- Rehm H, Wiedenmann B, Betz H. Molecular characterization of synaptophysin, a major calcium-binding protein of the synaptic vesicle membrane. EMBO J. 1986;5(3):535–541. doi: 10.1002/j.1460-2075.1986.tb04243.x. [DOI] [PMC free article] [PubMed] [Google Scholar]
- Rocher AB, Chapon F, Blaizot X, Baron JC, Chavois C. Resting-state brain glucose utilization as measured by PET is directly related to regional synaptophysin levels: a study in baboons. NeuroImage. 2003;20:1894–1898. doi: 10.1016/j.neuroimage.2003.07.002. [DOI] [PubMed] [Google Scholar]
- Romanczyk TB, Weickert CS, Webster MJ, Herman MM, Akil M, Kleinman JE. Alterations in trkB mRNA in the human prefrontal cortex throughout the lifespan. Eur J Neurosci. 2002;15:269–280. doi: 10.1046/j.0953-816x.2001.01858.x. [DOI] [PubMed] [Google Scholar]
- Sans N, Petralia RS, Wang YX, II, JB Hell JW, Wenthold RJ. A developmental change in NMDA receptor-associated proteins at hippocampal synapses. J Neurosci. 2000;20(3):1260–1271. doi: 10.1523/JNEUROSCI.20-03-01260.2000. [DOI] [PMC free article] [PubMed] [Google Scholar]
- Shaw P, Greenstein D, Lerch J, Clasen L, Lenroot R, Gogtay N, Evans A, Rapoport J, Giedd J. Intellectual ability and cortical development in children and adolescents. Nature. 2006;440(30):676–679. doi: 10.1038/nature04513. [DOI] [PubMed] [Google Scholar]
- Sheng M, Pak DT. Glutamate receptor anchoring proteins and the molecular organization of excitatory synapses. Ann NY Acad Sci. 1999;868:483–493. doi: 10.1111/j.1749-6632.1999.tb11317.x. [DOI] [PubMed] [Google Scholar]
- Siew LK, Love S, Dawbarn D, Wilcock GK, Allen SJ. Measurement of pre-and post-synaptic proteins in cerebral cortex: effects of post-mortem delay. J Neurosci Methods. 2004;139(2):153–159. doi: 10.1016/j.jneumeth.2004.04.020. [DOI] [PubMed] [Google Scholar]
- Sowell ER, Trauner DA, Gamst A, Jernigan TL. Development of cortical and subcortical brain structures in childhood and adolescence: a structural MRI study. Dev Med Child Neurol. 2002;44:4–16. doi: 10.1017/s0012162201001591. [DOI] [PubMed] [Google Scholar]
- Sudhof TC, Lottspeich F, Greengard P, Mehl E, Jahn R. A synaptic vesicle protein with a novel cytoplasmic domain and four transmembrane regions. Science. 1987;238:1142–1144. doi: 10.1126/science.3120313. [DOI] [PubMed] [Google Scholar]
- Thomas L, Hartung K, Langosch D, Rehm H, Bamberg E, Franke WW, Betz H. Identification of synaptophysin as a hexameric channel protein of the synaptic vesicle membrane. Science. 1988;242:1050–1053. doi: 10.1126/science.2461586. [DOI] [PubMed] [Google Scholar]
- Toro C, Deakin JFW. NMDA receptor subunit NR1 and postsynaptic protein PSD-95 in hippocampus and orbitofrontal cortex in schizophrenia and mood disorder. Schizophr Res. 2005 doi: 10.1016/j.schres.2005.07.003. In press. [DOI] [PubMed] [Google Scholar]
- Valtschanoff JG, Burette A, Wenthold RJ, Weinberg RJ. Expression of NR2 receptor subunit in rat somatic sensory cortex: synaptic distribution and colocalization with NR1 and PSD-95. J Comp Neurol. 1999;410:599–611. [PubMed] [Google Scholar]
- Vawter MP, Thatcher L, Usen N, Hyde TM, Kleinman JE, Freed WJ. Reduction of synapsin in the hippocampus of patients with bipolar disorder and schizophrenia. Mol Psychiatry. 2002;7(6):571–578. doi: 10.1038/sj.mp.4001158. [DOI] [PubMed] [Google Scholar]
- Webb SJ, Monk CS, Nelson CA. Mechanisms of postnatal neurobiological development: implications for human development. Dev Neuropsychol. 2001;19(2):147–171. doi: 10.1207/S15326942DN1902_2. [DOI] [PubMed] [Google Scholar]
- Wiedenmann B, Franke WW. Identification and localization of synaptophysin, an integral membrane glycoprotein of Mr 38,000 characteristic of presynaptic vesicles. Cell. 1985;41:1017–1028. doi: 10.1016/s0092-8674(85)80082-9. [DOI] [PubMed] [Google Scholar]
- Zecevic N, Bourgeois JP, Rakic P. Changes in synaptic density in motor cortex of rhesus monkey during fetal and postnatal life. Dev Brain Res. 1989;50:11–32. doi: 10.1016/0165-3806(89)90124-7. [DOI] [PubMed] [Google Scholar]