

Abstract
Genome-wide linkage and association analyses were conducted to identify genetic determinants of stuttering in a founder population in which 48 individuals affected with stuttering are connected in a single 232-person genealogy. A novel approach was devised to account for all necessary relationships to enable multipoint linkage analysis. Regions with nominal evidence for linkage were found on chromosomes 3 (P=0.013, 208.8 centiMorgans (cM)), 13 (P=0.012, 52.6 cM), and 15 (P=0.02, 100 cM). Regions with nominal evidence for association with stuttering that overlapped with a linkage signal are located on chromosomes 3 (P=0.0047, 195 cM), 9 (P=0.0067, 46.5 cM), and 13 (P=0.0055, 52.6 cM). We also conducted the first meta-analysis for stuttering using results from linkage studies in the Hutterites and The Illinois International Genetics of Stuttering Project and identified regions with nominal evidence for linkage on chromosomes 2 (P=0.013, 180–195 cM) and 5 (P=0.0051, 105–120 cM; P=0.015, 120–135 cM). None of the linkage signals detected in the Hutterite sample alone, or in the meta-analysis, meet genome-wide criteria for significance, although some of the stronger signals overlap linkage mapping signals previously reported for other speech and language disorders.
Keywords: Stuttering, Linkage, Association, Meta-analysis
Introduction
Developmental stuttering is a common disorder of speech disfluency that affects 5% of children with an average population prevalence of 1% (Craig, Hancock, Tran, Craig, & Peters, 2002; Felsenfeld, 2002). The overt symptomatology of the disorder is characterized by excessive repetitions of sounds, syllables, and monosyllabic words, as well as sound prolongations and complete blockages of the vocal tract. Any of these characteristics may be accompanied by physical tension or movements, especially in the head and neck areas (Conture & Kelly, 1991; Wingate, 1964). Young children are often first diagnosed between ages 2 and 5, when they begin forming sentences and connecting thoughts verbally, with a higher occurrence in males than females at a ratio of 2:1. Nearly 80% of these affected children recover naturally from stuttering within one to four years of onset (Andrews & Harris, 1964; Mansson, 2000; Yairi & Ambrose, 1999). More females recover than males, resulting in a more skewed male-to-female ratio of 4:1 in older children and adults (Bloodstein, 1995; Büchel & Sommer, 2004; Felsenfeld, 2002; Yairi & Ambrose, 1999).
Twin and family studies have indicated a strong genetic component to stuttering. Three twin studies showed considerably higher concordance levels of stuttering in monozygotic twins (20–90%) compared with dizygotic twins (3–19%) (Andrews, Morris-Yates, Howie, & Martin, 1991; Bloodstein, 1995; Felsenfeld et al., 2000; Howie, 1981). When the monozygotic and dizygotic twin correlations are used to model the additive genetic and environmental components, both Andrews et al. (1991) and Felsenfeld et al. (2000) concluded that approximately 70% of the phenotypic variance is due to additive genetic effects and approximately 30% to non-shared effects. Several studies have shown a higher incidence of stuttering in first degree relatives (20–74%) than in the general population (1.3–42%) (Kidd, Heimbuch, & Records, 1981; Yairi, Ambrose, & Cox, 1996). Both the concordance of stuttering among monozygotic twin pairs and the familial aggregation of stuttering are consistent with a genetic component to stuttering.
Several genetic models have been suggested for the inheritance of stuttering within families. Kidd, Kidd, and Records (1978) performed a segregation analysis in 511 families to identify the mode of inheritance that would account for the observed skewed sex ratio. They concluded that the model most consistent with the observed data was a sex-modified transmission model in which males and females have different genetic thresholds, with females requiring more susceptibility alleles than males to express a stuttering phenotype. This model was also proposed several years later in a study of a large Utah pedigree in which 38 individuals of a 269-member family stuttered (MacFarlane, Hanson, Walton, & Mellon, 1991). The sex-modified transmission of stuttering was consistent with both a multifactorial-polygenic model (many genes with small effect, as well as environmental components) and a single-locus genetic model (one gene with large effect, with numerous genes with small effects and environmental components) (Kidd, 1977). In 1993, Ambrose, Yairi, and Cox conducted a segregation analysis in 69 families in which at least one child stuttered and found that a single major genetic locus was the best explanation for the transmission of stuttering observed in these families, but that a polygenic-multifactorial model could not be rejected. Recently, Viswanath, Lee, and Chakraborty (2004) conducted a segregation analysis of 56 multigenerational pedigrees to assess if a major locus could account for the persistent stuttering observed in these families. They concluded that an autosomal dominant locus could explain the occurrence of stuttering in these pedigrees.
Unfortunately, determining that the pattern of transmission of a trait is consistent with a major locus affecting susceptibility to a trait does not mean that there necessarily is a single major gene or that it will be simple to identify the relevant genetic variation. In fact, finding genes that influence stuttering, or any complex trait, has proven far more challenging than mapping genes for simple, Mendelian disorders (Botstein & Risch, 2003). Among the challenges that have made these studies difficult are etiologic and genetic heterogeneity, complex genetic models with many contributing loci of varying effects, gene by gene interaction, and gene by environment interaction. (For a discussion of the challenges of mapping and identifying genetic loci for complex traits, see Risch, 2000).
The accumulated findings of a genetic component to stuttering justified a move from statistical genetics into biological genetics. Typically, the first phase in such research is linkage analysis aimed at identifying the chromosomal location of genes underlying the disorder in question. To this end, DNA is extracted from blood or saliva. Then, genetic markers are identified on every chromosome, or only chromosomes of interest. When a genetic marker is co-inherited with stuttering (“linkage”), the indication is that the gene contributing to stuttering is on the same chromosome as the genetic marker; in fact, very close to it. Two measures are obtained: (a) the distance of the chromosomal location of the genetic marker in centiMorgans (cM) from the end of the upper arms of a chromosome, and (b) the LOD (log of the odds score), which is a measure indicating the likelihood that two genetic loci are physically near enough to each other to be linked, or inherited together.
Tests of association compare allele frequency differences at genetic markers in affected and unaffected individuals. Association implies either the associated allele directly affects the phenotype or susceptibility to disease, or the associated allele is located sufficiently near, and is in linkage disequilibrium with, a susceptibility allele. That is, the susceptibility allele at the disease locus and an allele at the marker locus are found together on the same chromosome more often than expected based on their individual allele frequencies.
Four genome-wide linkage investigations in families have identified several chromosomal regions that might harbor susceptibility genes for stuttering. A study in 68 Caucasian families identified a region on chromosome 18 centered at D18S976 that was suggestive of linkage to stuttering, but was not genome-wide significant (NPL = 1.51; Non-Parametric Linkage (NPL)) (Shugart et al., 2004). Note that parametric linkage analyses require a genetic disease model to be specified to examine the evidence for linkage and a LOD greater than 3.0 for genome-wide significance. Non-parametric linkage analyses, on the other hand, do not require a genetic disease model to be determined to test for linkage of a phenotype to a genetic region. Evidence of linkage to chromosome 1 at the location of 1q21-1q22 (LOD = 2.27) was reported in a study of stuttering in a large Cameroon family (Levis, Ricci, Lukong, & Drayna, 2004). Genome-wide significance for linkage was found on chromosome 12q (NPLall = 4.61) using 44 inbred Pakistani families (Riaz et al., 2005). Most recently, the Illinois International Study of Stuttering Project identified possible regions increasing susceptibility for persistent stuttering on chromosomes 5 (LOD = 1.47), 13 (LOD = 1.72), and 15 (LOD = 1.98), and for ever stuttering on chromosomes 2 (LOD = 1.73), 7 (LOD = 1.69), and 9 (LOD = 2.28), in a genome-wide linkage study of 100 Caucasian families (Suresh et al., 2006). Unfortunately, there were no obvious overlap of chromosomal regions among the four studies in primary linkage analyses, a rather common outcome of linkage studies in many other complex disorders.
One approach to reducing the challenges inherent in mapping a complex trait such as stuttering is to focus on isolated populations (Lander & Schork, 1994; Neel, 1970; Ober & Cox, 1998; Wright, Carothers, & Pirastu, 1999). Isolated populations include those that have expanded for a relatively small number of generations from a limited, and often well-defined, number of founders (Kruglyak, 1999). The small number of founders increases the likelihood that genetic heterogeneity will be reduced, which may also reduce the complexity of genetic models even for complex traits, because such populations may be segregating for only a portion of the genetic variation affecting a given trait.
Our studies focus on the Hutterites, a religious isolate that left Europe in the late 1800s and settled in the northern United States. The Hutterites are ideal for genetic studies because of their large family sizes and communal lifestyle. The subjects included in this study are from 9 colonies in South Dakota. These individuals are related to each other within a 1,623-member, 13-generation pedigree traced back in time to 64 founders, some of whom may have been related (Abney, McPeek, & Ober, 2000). The small number of founders and the relatively rapid expansion of the population should enhance the power to map genes influencing susceptibility to a complex trait like stuttering. Although the Hutterites avoid close inbreeding, the relative isolation of the population has led to substantial relatedness among members of the group. The communal lifestyle, in which they are exposed to the same environmental conditions, eat the same food, work on the same farm, and attend the same schools and social events, etc., is expected to reduce the variability in the environmental factors that might affect risk of stuttering. This should, in turn, lead to additional improvement in the power to map susceptibility loci.
On the other hand, a disadvantage of using large inbred pedigrees in genetic studies is the lack of computationally feasible approaches that allow such pedigrees to be analyzed as single, complete families (Ober & Cox, 1998). Consequently, we separated the 1,623-member Hutterite pedigree into four smaller sub-pedigrees, but preserved the relationships between family members and maintained a level of relatedness within each sub-pedigree consistent with that of the population. To increase our power to detect susceptibility loci regardless of allele frequency and risk, we carried out both genome-wide linkage and association studies in the Hutterite population. We also conducted a meta-analysis of stuttering, including the Hutterites and an outbred Caucasian population used in the Suresh et al. (2006) study.
Materials and Methods
Study Population
The current study was conducted within a larger genetic investigation pertaining to various health conditions and disorders in the Hutterite communities of South Dakota. Information on stuttering in our defined population was gathered through personal interview with 350 individuals to establish phenotype for a variety of traits and disorders. During field trips to the Hutterite colonies, all individuals over the age of 14 were asked by direct interview whether they or any of their children have ever stuttered. This method for identifying individuals who stutter is similar to that used by Craig et al. (2002), where one member from each of their selected households was interviewed by telephone and asked about current or past stuttering of all members from that household. We are, therefore, comfortable with our assumption that individuals who identify themselves or family members as affected with stuttering have provided reliable information. We did not, however, look for, or document other speech and language disorders.
For the purpose of linkage analysis, false negatives, that is, classifying a person who stutters as a normal speaker, are not particularly important. This point should be appreciated regarding people who experienced short term stuttering from which they recovered in early ages but were not reported due to a lapse of the parents’ memory, parents being deceased, or being impossible to locate/contact. Some evidence for such under-reporting was discussed by Yairi & Ambrose (2005).
Linkage mapping with model-free methods compares the proportion of alleles shared among affected members of families to the proportion of allele sharing expected based simply on the genetic relationships among individuals. Thus, misclassifying some affected individuals as unaffected will not otherwise alter our results because these individuals will not be included in estimating the alleles shared among affected individuals in the linkage analysis. Some power may be lost. The possibility, however, that this type of error occurred is minimal in view of past experience of other investigators and our own careful interview.
Of the 1,623 individuals phenotyped for stuttering, 48 were reported as having ever stuttered. Of these, 36 were stuttering at the time of the study and 12 were reported to have recovered from stuttering. The 36/1,623 figure yields a prevalence of 2.2%, which is above the frequently reported <1% in the general population (Bloodstein, 1995; Craig et al., 2002). On the other hand, the ever stutter figure of 48/1,623 yields an incidence of 3%, which is below the often recognized 5% level (Andrews & Harris, 1964; Bloodstein, 1995; Mansson, 2000). The variability in the estimates for prevalence and incidence may simply reflect the challenges of making precise estimates in modest sized samples. It is also possible that the prevalence of stuttering is actually increased (and incidence decreased) in the Hutterites due to founder effects, attributable to one, or several, founders transmitting susceptibility alleles for persistent stuttering disproportionately represented in the sampled set of Hutterites. The lower than expected incidence (only 12 cases) may alternatively be a function of parents and other family members under-reporting cases of recovered stuttering, especially those that occurred in early childhood. This phenomenon has been observed and discussed by Yairi & Ambrose (2005) in their longitudinal study of early childhood stuttering.
For the 48 individuals classified as ever stuttered, DNA was unavailable for 8 individuals because they were too young (under age 6) to have blood drawn at the time of data collection. The remaining 40 individuals who stutter (30 current, 10 recovered) are related to each other in a 232-member minimal pedigree comprising 9 generations. A point of interest is that of the 10 individuals whom recovered from stuttering, 5 individuals have a first-degree relative with persistent stuttering (4 individuals with siblings and 1 individual’s mother). The remaining individuals who have recovered either do not report any members of their nuclear family whom have stuttered, or there is a sibling that has also recovered from stuttering. All individuals who currently stutter or had recovered from stuttering were included in our analyses in the phenotype of ever stuttering. Recent studies have suggested that there is a genetic liability to stuttering in general, as well as to recovering from stuttering (Ambrose, Cox, & Yairi, 1997; Suresh et al., 2006). Therefore, placing both those who were persistent in and recovered from stuttering within a single group of ever stuttered will allow the examination of the genetic susceptibility to stuttering. The average inbreeding coefficient among affected individuals is 0.0348 (SD = 0.0165), which is slightly higher than previously calculated for the overall Hutterite population (0.0327, SD = 0.016) (Ober et al., 1998). An inbreeding coefficient is the probability that both of an individual’s alleles at a locus are identical by descent because the parents are related to each other.
The male-to-female ratio of the 40 genotyped individuals who have ever stuttered is 1.5:1, which is consistent with some previous estimates of the sex ratio close to onset (1.6:1 in Kloth, Janssen, Kraaimaat, & Brutten, 1995; 1.65:1 in Mansson, 2000), although lower than others (2.1:1 in Yairi & Ambrose, 2005), and considerably lower than the 3 or 4 to 1 reported for adults (Bloodstein, 1995).
Genotyping and Error Checking
Currently, 1271 DNA markers have been genotyped in the Hutterites. Two genome screens have been completed by the Mammalian Genotyping Service of the National Heart, Lung and Blood Institute, using Marshfield screening sets 9 and 51. Marshfield screening sets are collections of microsatellite markers used for genotyping that were compiled by the Marshfield Clinic Research Foundation. This has yielded a map density of approximately one marker every 5 cM, denser than most genome screens with one marker every 10–15 cM. Several hundred single nucleotide polymorphisms (SNPs) have also been genotyped, primarily in genes related to asthma and cardiovascular disease (Bourgain et al., 2003; Ober, Tsalenko, Parry, & Cox, 2000; Newman et al., 2003). All marker orders and map distances for framework markers are based on the physical map created by deCode Genetics (http://www.decode.com).
Mendelian errors were detected using PedCheck (O’Connell & Weeks, 1998). SNPs were also checked for departures from Hardy-Weinberg equilibrium (Bourgain, Abney, Schneider, Ober, & McPeek, 2004), and those showing any deviation were excluded from these analyses. Hardy-Weinberg equilibrium requires that the allele frequencies at a genetic locus determine the genotype frequencies. If this is not the case, then the genotypes at the locus may contain genotyping errors.
Preservation of pedigree structure
To conduct multipoint linkage analysis, it was necessary to separate the 232- member minimal pedigree (the minimum number of members connecting all affected individuals in one pedigree) created by PEDHUNTER (Agarwala, Biesecker, Hopkins, Francomano, & Schaffer, 1998) into four smaller sub-pedigrees. These four smaller sub-pedigrees included 59, 61, 74, and 88 members and multiple inbreeding loops (Figure 1). To verify that all necessary information on genetic relationships among pedigree members was preserved, we used the PREST (Pedigree RElationship Statistical Test) software created by McPeek and Sun (2000) on each sub-pedigree. The program uses the data from genetic markers genotyped in each individual to assess the evidence for the specified relationship between each pair of individuals. If the relationship is not consistent with the genotype data, PREST provides a more likely, alternative relationship. We initially identified numerous relationship misspecifications that resulted from the formation of the minimal pedigree, a process that breaks inbreeding loops and removes non-essential members of the pedigree. After re-inserting the appropriate ancestors and re-creating some of the inbreeding loops, it was possible to correctly account for all relationships as well as the estimated level of inbreeding within each sub-pedigree.
Figure 1.
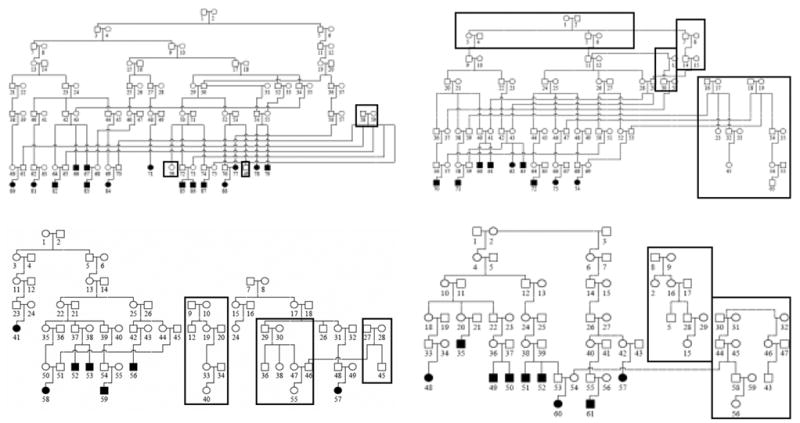
Sub-pedigrees constructed from the Hutterite genology. All individuals who have ever stuttered are in black. Individuals added to the sub-pedigrees after using PREST to account for the relatedness within each sub-pedigree are boxed.
Statistical Analyses
The program Simwalk2, version 2.86 (Lange & Lange, 2004; Sobel & Lange, 1996), was employed to conduct a genome-wide linkage analysis of the Hutterites. Recent studies have shown that when a dense map of SNPs is used in a linkage analysis, with missing parental genotypes, the results of linkage analyses may be falsely inflated due to the linkage disequilibrium between the markers (Schaid et al., 2004). Linkage disequilibrium occurs when a haplotype occurs more or less frequently then would be expected based on the allele frequencies. A haplotype is formed by one allele from the pair of alleles from 1 or more genetic markers. To prevent inflation in our results, especially in regions with a high-density of SNPs, we removed from the analysis 209 SNPs that were within 50 kilobases (kb) of another SNP. Although founder populations are hypothesized to have larger regions of linkage disequilibrium as compared to outbred populations, no published examination has been done to determine the extent of the increase of linkage disequilibrium within a founder population that is comparable to the small number of founders and rapid population growth observed in the Hutterites (Newman et al., 2003). Previous estimates of the average length of linkage disequilibrium within an outbred, Caucasian population is 44–60 kb (Gabriel et al., 2002; Riech et al., 2001), depending on the allele frequencies used in the study. Because the Hutterites are a Caucasian population, removing SNPs within 50kb of each other would remove most effects of any linkage disequilibrium present. Both the NPLall and NPLpairs statistics were used in our linkage analyses because of the information each utilize to determine the evidence for linkage in a region. NPLall assigns greater weight to allele sharing among larger numbers of affected individuals and is more powerful for additive and dominant models of transmission, whereas NPLpairs compares allele sharing between pairs of affected individuals and is more powerful for identifying recessive loci (Lange & Lange, 2004).
The transmission disequilibrium test (TDT) is traditionally used to assess association in the presence of linkage by determining whether the transmission of a particular allele from heterozygous parents deviates from the null expectation of 0.5. Due to the lack of independence between members in a single family, the TDT cannot be used as a test of association in the Hutterites, but can be used as a test of linkage (Génin, Todorov, & Clerget-Darpoux, 2002; Spielman & Ewens, 1996). We used GENEHUNTER (Kruglyak, Daly, Reeve-Daly, & Lander, 1996) to conduct a single-point TDT at all 1271 markers in 30 nuclear families from the 4 sub-pedigrees, as well as a two-point TDT, in which two consecutive markers are assessed for linkage.
To assess association in the Hutterites, the Family-Based Association Test (FBAT) was used because it takes into account larger family structures, missing parental data, and tests specific disease models (Horvath, Xu, & Laird, 2001). The FBAT was applied to all 1271 markers in the 4 sub-pedigrees. Because only transmissions from heterozygote parents contribute to the test statistic, we required any result to have at least 10 families with a heterozygote parent and a P < 0.01. We only tested an additive model of inheritance.
Finally, we conducted a meta-analysis of the only two Caucasian genome screens that have been conducted using the phenotype of ever-stuttered, including a study of 105 families with 316 individuals who stutter collected through the Illinois International Genetics of Stuttering Project (Suresh et al., 2006), as well the Hutterites. The genome was split into 228 bins of 15 cM in length. Each bin in a study was given the smallest P-value of a single marker located in that bin as determined by the evidence of linkage. The bins were then ranked within each study; the highest bin received a rank of 228, the next highest a rank of 227, and so on, with possible ties if P-values were identical between bins. Next, the Genome Search Meta-Analysis (GSMA) software calculated the evidence for linkage within each bin for both studies, with each study weighted by the square root of the number of affected individuals in that study (Levinson, Levinson, Segurado, & Lewis, 2003; Wise, Lanchbury, & Lewis, 1999).
We report point-wise P-values from our analyses. Because the analyses of the Hutterite pedigrees are quite time-consuming, even broken into the sub-pedigrees, it would be prohibitively time-consuming to estimate genome-wide significance of results through simulation.
Results
Genome-wide Linkage Mapping in the Hutterites
Results of genome-wide linkage mapping in the Hutterites varied with the statistic used for analysis. Although no linkage peaks met criteria for genome-wide significance (Lander & Kruglyak, 1995), several peaks provided nominal support for stuttering susceptibility loci. The NPLall statistic has more power to detect loci with a dominant mode of transmission, which several behavioral and biological genetic studies have implicated as the mode of inheritance at a single susceptibility locus for stuttering (Ambrose et al., 1993; Ambrose et al., 1997; Shugart et al., 2004; Viswanath et al., 2004). Six peaks located on four chromosomes had P < 0.05 using the NPLall statistic (Figures 2 & 3), the highest peak occurring on chromosome 13 at 52.6 cM (P = 0.012), at a marker ~2 cM from D13S788. The next two highest peaks were on chromosome 3 at 3q27 (P = 0.013 at D3S3054, 208.8 cM), and chromosome 9 (P = 0.037 at GATA187D09, 22.5 cM). The final three peaks occurred on chromosome 5 at GOLPH3 (P = 0.042, 52.6 cM), D5S1721 (P = 0.047, 113 cM), and D5S820 (P = 0.043, 161 cM).
Figure 2.
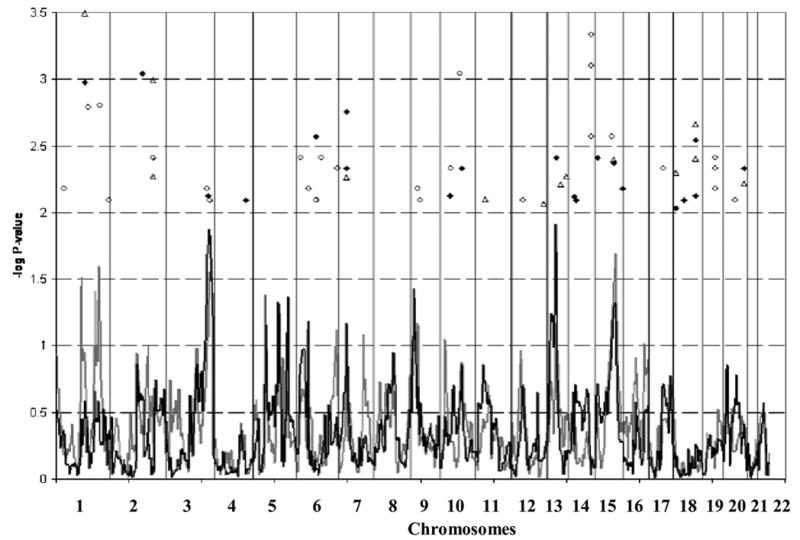
Genome-wide linkage and association results. NPLall (black line), NPLpairs (grey line), single-marker TDT (black diamonds), two-marker TDT (open circles), and FBAT results (open triangles). Markers with a P < 0.01 from the single-marker TDT, two-marker TDT, or FBAT are shown.
Figure 3.

Linkage and association results for chromosomes 1, 3, 5, 9, 13, and 15. NPLall (black line), NPLpairs (grey line), single-marker TDT (black diamonds), two-marker TDT (open circles), and FBAT results (open triangles). Markers with a P < 0.01 from the single-marker TDT, two-marker TDT, or FBAT are shown.
The NPLpairs statistic is more powerful at identifying recessive loci and therefore may be particularly relevant in our study of a large, inbred pedigree in which one could hypothesize that a recessive susceptibility locus for stuttering could be more easily detected. Four peaks on three chromosomes were identified with P < 0.05 using the NPLpairs statistic (Figures 2 & 3). The highest peak was on chromosome 15 at D15S652 (P = 0.02, 100 cM). The second and fourth highest peaks were both on chromosome 1 at D1S495 (P = 0.031, 124 cM) and IL10 (P = 0.025, 209 cM). The third highest peak coincided with one of the peaks detected using NPLall, at D3S3054 (P = 0.028). Because both NPLall and NPLpairs identified a peak at D3S3054, an additive locus is suggested since both statistics can detect additive loci.
The second method of detecting linkage was the TDT. Figure 2 shows 21 loci with point-wise P < 0.01. D2S1334 on 2q21 (148 cM) had the smallest P-value (0.00091, 0 alleles transmitted (TR): 11 alleles not transmitted (NT)). Three of the loci identified by the TDT were also identified by the linkage results using Simwalk2. Both D3S3054 and D15S655 (~8 cM from the linkage peak on chromosome 15) showed an over-transmission of one allele from heterozygous parents to affected offspring (P = 0.0082 and 7 TR: 0 NT, P = 0.0039 and 19 TR: 5 NT, respectively) (Figure 3). D13S788, located on chromosome 13 and with the highest NPLall peak, showed an under-transmission of one allele from heterozygous parents (P = 0.0043, 1 TR: 11 NT) to affected offspring (Figure 3). This observation is consistent with the possibility that there are several rarer susceptibility alleles on different haplotypes, with the resulting under-transmission of a common haplotype. Alternatively, such patterns may arise when it is an ancestral allele that increases risk of disease, and the newer derived allele reduces risk relative to the ancestral allele. (An ancestral allele can be traced back in time to distantly related organisms, and therefore can be found in other species, such as chimpanzees, mice, or fruit flies. The derived allele is a result of more recent mutation, and therefore will not be found in more distantly related organisms.)
We also observed several overlaps between the linkage peaks and two-marker TDT (Figures 2 & 3). Chromosome 1 (210 cM) showed a significant under-transmission (P = 0.0016, 0 TR: 10 NT), while the two-marker haplotype including D3S3054 and D3S2418 showed a significant over-transmission from parents (P = 0.0039, 7 TR: 0 NT), which is consistent with the over-transmission observed at D3S3054 in the single-marker TDT. Interestingly, the pair of loci with the smallest P-values was on chromosomes 10 and 14, where there was no evidence for linkage using either Simwalk2 or the TDT. The haplotype on chromosome 10 created at markers D10S1436 and D10S1432 showed an over-transmission (P = 0.00091, 11 TR: 0 NT, 92.2 cM). Two two-marker haplotypes created by SNPs at 98.6 cM on chromosome 14, had one haplotype showing an over-transmission (P = 0.000789, 14 TR: 1 NT) and the other an under-transmission from parents (P = 0.0027, 2 TR: 14 NT).
Genome-wide Association Analysis in the Hutterites
Results for the FBAT are shown in Figures 2 and 3. Twelve loci were identified, and 8 loci had both significant FBAT and TDT results. The most significant FBAT result was at D1S1675 (P = 0.00032, 137.78 cM), and overlapped with both a significant TDT and a small linkage peak. The other 7 loci with overlapping FBAT and TDT results are on chromosomes 2, 5, 7, 15, 18, and 20. The remaining 3 loci on chromosomes 11, 12, and 17 overlapped with small linkage peaks, which might indicate regions harboring susceptibility loci with small effect; however, none of these linkage peaks had even suggestive evidence of linkage.
Meta-analysis of Stuttering
Large sample sizes are needed to detect the multiple loci with small effects that are commonly believed to contribute to complex disorders. To achieve the required sample sizes, individual studies can be combined and tested through a meta-analysis of the individual studies’ results. Figure 4 shows the results from the meta-analysis of stuttering using the results from the linkage studies in the Hutterites and in 100 outbred Caucasian families (Suresh et al., 2006).
Figure 4.
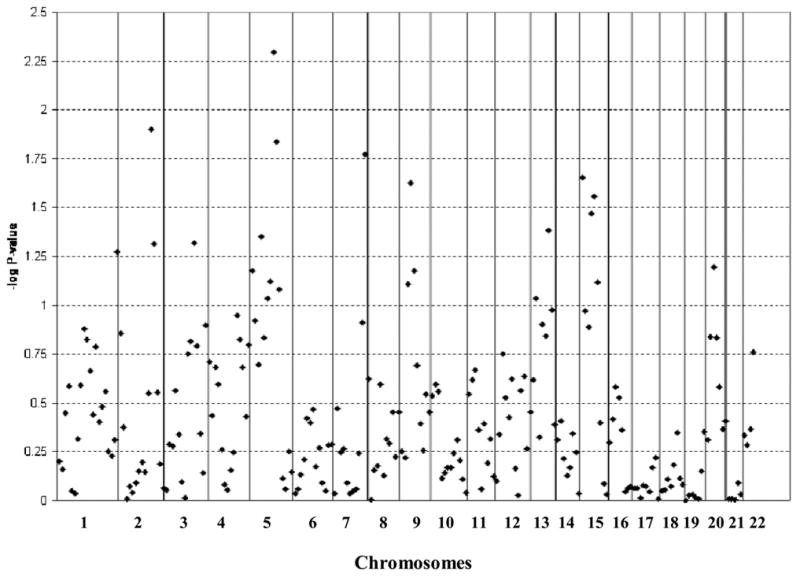
Meta-analysis for stuttering. The –log P-value for each bin from the meta-analysis of linkage results for the Hutterites and The Illinois International Genetics of Stuttering Project.
None of the loci in the meta-analysis reached genome-wide significance, but 12 bins on 7 chromosomes showed at least nominally significant evidence for linkage by having point-wise P≤0.05. Three bins on chromosome 5 (45–60 cM with P = 0.045, 105–120 cM with P = 0.0051, and 120–135 cM with P = 0.015) overlapped with the linkage signals at D5S1986 and D5S1721 in the Hutterites. Three bins on chromosome 15 also showed evidence for linkage, one spanning from the p-terminal region to 15 cM (P = 0.022), and two consecutive bins from 45 cM to 70 cM (P = 0.034 and P = 0.028, respectively). The linkage signal found near D15S652 in the Hutterites was not significant and was in the bin at 90 cM to 105 cM. Two bins on chromosome 2, spanning 180 cM to 210 cM, had P-values of 0.013 and 0.049. The other bins included one on chromosome 3 (P = 0.023, 135–150 cM), chromosome 7 (P = 0.017, 150–165 cM), chromosome 9 (P = 0.024, 45–60 cM), and chromosome 13 (P = 0.042, 75–90 cM). As is common with meta-analysis, the most significant regions for the individual studies are not the most significant in the meta-analysis, but rather it is the regions with some evidence for linkage in both studies that are the most significant.
Discussion
In this study, we focused on a founder population to help identify the genetic variation that increases susceptibility to stuttering. Large, inbred pedigrees can be very powerful for linkage mapping. However, when linkage analyses are so computationally challenging that pedigrees must be broken into smaller subunits for analysis, some loss of power inevitably occurs. We devised a novel approach to break the single genealogy into the largest sub-pedigrees on which multipoint linkage analysis could be conducted by using PREST to appropriately preserve the level of relatedness among family members, as well as the integrity of the genetic information. Whereas our method is likely to have reduced power relative to conducting analyses in the full genealogy, it has not been possible to conduct multipoint linkage analysis for a dichotomous trait (like stuttering) in the full genealogy even with likelihood estimation approaches. Our approach was intended to preserve as much of the genealogy as possible (to maximize power), while still allowing for computational feasibility in the multipoint linkage analysis.
A possible limitation of our study is that interviews were conducted by researchers not trained as speech pathologists. Such limitation, however, is probably minimal for the purpose of general identification. There is evidence for close agreement between laypeople and professionals in identifying people who stutter. For example, in a nationwide mail questionnaire survey of school teachers regarding speech disorders (White House Conference on Child Health and Protection, 1931) the prevalence of stuttering, as well as other speech disorders, was studied. To establish reliability, speech-language clinicians conducted direct individual screenings of 10,033 pupils in the public schools of Madison, WI. The negligible differences between the two methods concerning the prevalence of stuttering prompted the authors to conclude that “…differences between the Madison results and those shown by the questionnaire survey are probably not material” (p.337). More recent research has shown close agreement between parents’ and speech pathologists’ classification of an individual as someone who stutters. Yairi and Ambrose (2005, p. 184) reported that the mean parent ratings for stuttering were nearly identical to that of the clinician when a child was classified as either exhibiting stuttering or when a child was classified as exhibiting normal speech. Note that their scale required a distinction between normal and stuttering. Although personal interview by a lay individual is not a perfect method of diagnosing individuals who stutter, it does represents an improvement over telephone interviews employed by Criag et al. (2002). A key point is that studies carried out on the Hutterites are conducted by individuals given permission by the Hutterites to visit the colonies and who understand their way of life. In this respect, reliable data on diabetes and related quantitative phenotypes has been collected without an endocrinologist present, lung function without a pulmonary specialist, and stuttering without a speech pathologist.
Genome-wide linkage and association analyses did not identify any region with highly significant statistical support for harboring stuttering susceptibility loci. Overall, the most impressive result was on chromosome 13q21, which had the highest NPLall linkage peak, as well as suggestive evidence with TDT and FBAT analyses. This finding is intriguing because the same region was previously identified in linkage analyses with Specific Language Impairment (SLI) (Bartlett et al., 2002), autism (Bartlett et al., 2004), and Tourette’s syndrome (Merette et al., 2000). SLI is diagnosed early in childhood if an individual fails to develop normal language when other factors, such as trauma, a neurological disorder, or hearing difficulties, can be ruled out as the cause (Bartlett et al., 2002). Individuals affected with autism often have abnormal language development that varies with severity (Bartlett et al., 2004). The onset of Tourette’s syndrome begins in early childhood and affected individuals have chronic motor and vocal tics (Merette et al., 2000).
Other regions with nominally significant evidence for both linkage and association include chromosomes 1, 3, 5, and 15. The linkage and association peak on chromosome 1 at IL10 is 17 cM from a linkage peak previously identified in a genome-wide linkage study of stuttering in a large Cameroon family (Levis et al., 2004). The linkage peak on chromosome 5 at D5S1721 (113 cM) was also identified in The Illinois International Genetics of Stuttering Project, with an NPL > 2.0 at ~116 cM (Suresh et al., 2006). The remaining regions with both nominally significant evidence for linkage and association are unique to our studies of stuttering in the Hutterites.
It is of interest to note that the region containing the only gene identified to date in affecting a speech/language phenotype, FOXP2 at 7q31, was not implicated in our analyses in the Hutterites. FOXP2 on chromosome 7 has recently been implicated in severe speech and language disorder, diagnosed as severe difficulty in developing expressive and/or receptive language (Lai et al., 2000; Lai, Fisher, Hurst, Vargha-Khadem, & Monaco, 2001). The FOXP2 region has also been implicated in some studies of SLI (O’Brien, Zhang, Nishimura, Tomblin, & Murray, 2003), although other studies of SLI have been negative (Bartlett et al., 2002; SLI Consortium, 2002). There has also been little support for the FOXP2 region in linkage studies of other speech and language phenotypes, including autism (Newbury et al., 2002), schizophrenia (Sanjuan et al., 2005), and dyslexia (Kaminen et al., 2003).
We also conducted the first meta-analysis for stuttering, using the Hutterites and an outbred Caucasian sample collected by the Illinois International Genetics of Stuttering Project (Suresh et al., 2006). Our meta-analysis identified 12 broad regions on chromosomes 2, 3, 5, 7, 9, 13, and 15 that showed nominally significant evidence for linkage to stuttering. The region on chromosome 2 from 180 to 210 cM has previously been identified in a study of the delay of phrase-based speech in individuals affected with autism (Buxbaum et al., 2001). One of the regions on chromosome 15 (45–60 cM) is 5 cM from the DYX1 region implicated in dyslexia (Schulte-Körne et al., 1998), in which speech and language defects are sometimes present (Hallgren, 1950). All three regions on chromosome 5 (45–60 cM, 105–135 cM) were identified in the linkage analyses in the Hutterites. The remaining regions on chromosomes 3, 7, 9, 13, and 15 have not previously been identified in any genetic studies of speech or language phenotypes. Future studies will be focused primarily on regions with the strongest support in the collective studies (such as those on chromosome 2, 5 and 15), and on those with replicated sex-specific signals, such as those on chromosomes 7 and 21.
Our results do not find a single major locus contributing to stuttering, although this does not exclude the possibility that a single major locus that increases susceptibility exists. The results do suggest that stuttering is a polygenic disorder, in which several genes of varying effect may increase susceptibility to stuttering. The close proximity of several linkage signals to regions previously identified in other speech and language disorders (i.e. SLI, dyslexia, Tourette’s syndrome, and autism with phrased-speech delay) raises the possibility that many speech and language phenotypes may share at least some susceptibility loci in common, while there may be other genes that are unique to each disorder. It can be challenging to identify the genetic variation responsible for signals detected in linkage studies, but the identification and characterization of genes implicated in susceptibility to stuttering could have a profound impact on our understanding of the primary etiology of the disorder. A better understanding of the specific genetic risk factors may improve our ability to design epidemiological studies to identify and characterize non-genetic risk factors that contribute to the risk of stuttering. Moreover, as speech is a quintessentially human characteristic, genes implicated in stuttering will be irresistible targets for evolutionary genetic studies, such as those previously reported for FOXP2 (Enard et al., 2002). Although there are substantial challenges in pursuing genetic studies, the potential rewards are more than commensurate.
Acknowledgments
We would like to acknowledge the Hutterites for their participation in our studies. We would also like to acknowledge Harvey Dytch for constructing the minimal pedigree, Dr. M. Geoff Hayes for his helpful discussions, and the Mammalian Genotyping Center of the National Heart, Lung and Blood Institute. This work was supported by NIH grants DC04415, DK55889, and DK58026 to N.J.C., DC05210 to N.A. and E.Y., and HL56399 and HL66533 to C.O. J.K.W. was supported by an NIH training grant (GM07197).
Footnotes
Publisher's Disclaimer: This is a PDF file of an unedited manuscript that has been accepted for publication. As a service to our customers we are providing this early version of the manuscript. The manuscript will undergo copyediting, typesetting, and review of the resulting proof before it is published in its final citable form. Please note that during the production process errors may be discovered which could affect the content, and all legal disclaimers that apply to the journal pertain.
References
- Abney M, McPeek MS, Ober C. Estimation of variance components of quantitative traits in inbred populations. American Journal of Human Genetics. 2000;66:629–650. doi: 10.1086/302759. [DOI] [PMC free article] [PubMed] [Google Scholar]
- Agarwala R, Biesecker LG, Hopkins KA, Francomano CA, Schaffer AA. Software for constructing and verifying pedigrees within large genealogies and an application to the Old Order Amish of Lancaster County. Genome Research. 1998;8:211–221. doi: 10.1101/gr.8.3.211. [DOI] [PubMed] [Google Scholar]
- Ambrose NG, Yairi E, Cox N. Genetic aspects of early childhood stuttering. Journal of Speech and Hearing Research. 1993;36:701–706. doi: 10.1044/jshr.3604.701. [DOI] [PubMed] [Google Scholar]
- Ambrose NG, Cox NJ, Yairi E. The genetic basis of persistence and recovery in stuttering. Journal of Speech Language and Hearing Research. 1997;40:567–580. doi: 10.1044/jslhr.4003.567. [DOI] [PubMed] [Google Scholar]
- Andrews G, Harris M. The syndrome of stuttering. London: Wm. Heinemann Medical Books; 1964. [Google Scholar]
- Andrews G, Morris-Yates A, Howie P, Martin NG. Genetic factors in stuttering confirmed. Archives of General Psychiatry. 1991;48:1034–1035. doi: 10.1001/archpsyc.1991.01810350074012. [DOI] [PubMed] [Google Scholar]
- Bartlett CW, Flax JF, Logue MW, Vieland VJ, Bassett AS, Tallal P, et al. A major susceptibility locus for specific language impairment is located on 13q21. American Journal of Human Genetics. 2002;71:45–55. doi: 10.1086/341095. [DOI] [PMC free article] [PubMed] [Google Scholar]
- Bartlett CW, Flax JF, Logue MW, Smith BJ, Vieland VJ, Tallal P, et al. Examination of potential overlap in autism and language loci on chromosomes 2, 7, and 13 in two independent samples ascertained for specific language impairment. Human Heredity. 2004;57:10–20. doi: 10.1159/000077385. [DOI] [PMC free article] [PubMed] [Google Scholar]
- Bloodstein O. A handbook on stuttering. Chicago: National Easter Seal Society; 1995. [Google Scholar]
- Botstein D, Risch N. Discovering genotypes underlying human phenotypes: past successes for mendelian disease, future approaches for complex disease. Nature Genetics. 2003;33(Supplement):228–237. doi: 10.1038/ng1090. [DOI] [PubMed] [Google Scholar]
- Bourgain C, Hoffjan S, Nicolae R, Newman D, Steiner L, Walker K, et al. Novel case-control test in a founder population identifies P-selectin as an atopy-susceptibility locus. American Journal of Human Genetics. 2003;73:612–626. doi: 10.1086/378208. [DOI] [PMC free article] [PubMed] [Google Scholar]
- Bourgain C, Abney M, Schneider D, Ober C, McPeek MS. Testing for Hardy-Weinberg equilibrium in samples with related individuals. Genetics. 2004;168:2349–2361. doi: 10.1534/genetics.104.031617. [DOI] [PMC free article] [PubMed] [Google Scholar]
- Buchel C, Sommer M. What causes stuttering? PLoS Biology. 2004;2(2):E46. doi: 10.1371/journal.pbio.0020046. [DOI] [PMC free article] [PubMed] [Google Scholar]
- Buxbaum JD, Silverman JM, Smith CJ, Kilifarski M, Reichert J, Hollander E, et al. Evidence for a susceptibility gene for autism on chromosome 2 and for genetic heterogeneity. American Journal of Human Genetics. 2001;68:1514–1520. doi: 10.1086/320588. [DOI] [PMC free article] [PubMed] [Google Scholar]
- Conture EG, Kelly EM. Young stutterers' nonspeech behaviors during stuttering. Journal of Speech and Hearing Research. 1991;34:1041–1056. doi: 10.1044/jshr.3405.1041. [DOI] [PubMed] [Google Scholar]
- Craig A, Hancock K, Tran Y, Craig M, Peters K. Epidemiology of stuttering in the community across the entire life span. Journal of Speech Language and Hearing Research. 2002;45:1097–1105. doi: 10.1044/1092-4388(2002/088). [DOI] [PubMed] [Google Scholar]
- Drayna D, Kilshaw J, Kelly J. The sex ratio in familial persistent stuttering. American Journal of Human Genetics. 1999;65:1473–1475. doi: 10.1086/302625. [DOI] [PMC free article] [PubMed] [Google Scholar]
- Enard W, Przeworski M, Fisher SE, Lai CS, Wiebe V, Kitano T, et al. Molecular evolution of FOXP2, a gene involved in speech and language. Nature. 2002;418:869–872. doi: 10.1038/nature01025. [DOI] [PubMed] [Google Scholar]
- Felsenfeld S, Kirk KM, Zhu G, Statham DJ, Neale MC, Martin NG. A study of the genetic and environmental etiology of stuttering in a selected twin sample. Behavioral Genetics. 2000;30:359–366. doi: 10.1023/a:1002765620208. [DOI] [PubMed] [Google Scholar]
- Felsenfeld S. Finding susceptibility genes for developmental disorders of speech: the long and winding road. Journal of Communication Disorders. 2002;35:329–345. doi: 10.1016/s0021-9924(02)00088-6. [DOI] [PubMed] [Google Scholar]
- Gabriel SB, Schaffner SF, Nguyen H, Moore JM, Roy J, Blumenstiel B, et al. The structure of haplotype blocks in the human genome. Science. 2002;296:2225–2229. doi: 10.1126/science.1069424. [DOI] [PubMed] [Google Scholar]
- Genin E, Todorov AA, Clerget-Darpoux F. Properties of the transmission-disequilibrium test in the presence of inbreeding. Genetic Epidemiology. 2002;22:116–127. doi: 10.1002/gepi.0174. [DOI] [PubMed] [Google Scholar]
- Horvath S, Xu X, Laird NM. The family based association test method: strategies for studying general genotype--phenotype associations. European Journal of Human Genetics. 2001;9:301–306. doi: 10.1038/sj.ejhg.5200625. [DOI] [PubMed] [Google Scholar]
- Howie PM. Concordance for stuttering in monozygotic and dizygotic twin pairs. Jouranl of Speech and Hearing Research. 1981;24:317–321. doi: 10.1044/jshr.2403.317. [DOI] [PubMed] [Google Scholar]
- Kaminen N, Hannula-Jouppi K, Kestila M, Lahermo P, Muller K, Kaaranen M, et al. A genome scan for developmental dyslexia confirms linkage to chromosome 2p11 and suggests a new locus on 7q32. Journal of Medical Genetics. 2003;40:340–345. doi: 10.1136/jmg.40.5.340. [DOI] [PMC free article] [PubMed] [Google Scholar]
- Kidd KK. A genetic perspective on stuttering. Journal of Fluency Disorders. 1977;2:259–269. [Google Scholar]
- Kidd KK, Kidd JR, Records M. The possible causes of the sex ratio in stuttering and its implications. Journal of Fluency Disorders. 1978;3:13–23. [Google Scholar]
- Kidd KK, Heimbuch RC, Records MA. Vertical transmission of susceptibility to stuttering with sex-modified expression. Proceedings of the National Academy of Sciences U S A. 1981;78:606–610. doi: 10.1073/pnas.78.1.606. [DOI] [PMC free article] [PubMed] [Google Scholar]
- Kloth SAM, Janssen P, Kraaimaat FW, Brutten GJ. Speech-motor and linguistic skills of young suttterers prior to onset. Journal of Fluency Disorders. 1995;20:157–170. [Google Scholar]
- Kruglyak L, Daly MJ, Reeve-Daly MP, Lander ES. Parametric and nonparametric linkage analysis: a unified multipoint approach. American Journal of Human Genetics. 1996;58:1347–1363. [PMC free article] [PubMed] [Google Scholar]
- Kruglyak L. Prospects for whole-genome linkage disequilibrium mapping of common disease genes. Nature Genetics. 1999;22:139–144. doi: 10.1038/9642. [DOI] [PubMed] [Google Scholar]
- Lai CS, Fisher SE, Hurst JA, Levy ER, Hodgson S, Fox M, et al. The SPCH1 region on human 7q31: genomic characterization of the critical interval and localization of translocations associated with speech and language disorder. American Journal of Human Genetics. 2000;67:357–368. doi: 10.1086/303011. [DOI] [PMC free article] [PubMed] [Google Scholar]
- Lai CS, Fisher SE, Hurst JA, Vargha-Khadem F, Monaco AP. A forkhead-domain gene is mutated in a severe speech and language disorder. Nature. 2001;413:519–523. doi: 10.1038/35097076. [DOI] [PubMed] [Google Scholar]
- Lander E, Kruglyak L. Genetic dissection of complex traits: guidelines for interpreting and reporting linkage results. Nature Genetics. 1995;11:241–247. doi: 10.1038/ng1195-241. [DOI] [PubMed] [Google Scholar]
- Lander ES, Schork NJ. Genetic dissection of complex traits. Science. 1994;265:2037–2048. doi: 10.1126/science.8091226. [DOI] [PubMed] [Google Scholar]
- Lange EM, Lange K. Powerful allele sharing statistics for nonparametric linkage analysis. Human Heredity. 2004;57:49–58. doi: 10.1159/000077389. [DOI] [PubMed] [Google Scholar]
- Levinson DF, Levinson MD, Segurado R, Lewis CM. Genome scan meta-analysis of schizophrenia and bipolar disorder, part I: Methods and power analysis. American Journal of Human Genetics. 2003;73:17–33. doi: 10.1086/376548. [DOI] [PMC free article] [PubMed] [Google Scholar]
- Levis B, Ricci D, Lukong J, Drayna D. Genetic linkage studies in a large West African kindred. American Journal of Human Genetics. 2004;75:S2026. [Google Scholar]
- MacFarlane WB, Hanson M, Walton W, Mellon CD. Stuttering in five generations of a single family: A preliminary report including evidence supporting a sex-modified mode of transmission. Journal of Fluency Disorders. 1991;16:117–123. [Google Scholar]
- Mansson H. Childhood stuttering: Incidence and development. Journal of Fluency Disorders. 2000;25:47–57. [Google Scholar]
- McPeek MS, Sun L. Statistical tests for detection of misspecified relationships by use of genome-screen data. American Journal of Human Genetics. 2000;66:1076–1094. doi: 10.1086/302800. [DOI] [PMC free article] [PubMed] [Google Scholar]
- Merette C, Brassard A, Potvin A, Bouvier H, Rousseau F, Emond C, et al. Significant linkage for Tourette syndrome in a large French Canadian family. American Journal of Human Genetics. 2000;67:1008–1013. doi: 10.1086/303093. [DOI] [PMC free article] [PubMed] [Google Scholar]
- Neel JV. Lessons from a "primitive" people. Science. 1970;170:815–822. doi: 10.1126/science.170.3960.815. [DOI] [PubMed] [Google Scholar]
- Newbury DF, Bonora E, Lamb JA, Fisher SE, Lai CS, Baird G, et al. FOXP2 is not a major susceptibility gene for autism or specific language impairment. American Journal of Human Genetics. 2002;70:1318–1327. doi: 10.1086/339931. [DOI] [PMC free article] [PubMed] [Google Scholar]
- Newman DL, Abney M, Dytch H, Parry R, McPeek MS, Ober C. Major loci influencing serum triglyceride levels on 2q14 and 9p21 localized by homozygosity-by-descent mapping in a large Hutterite pedigree. Human Molecular Genetics. 2003;12:137–144. doi: 10.1093/hmg/ddg012. [DOI] [PubMed] [Google Scholar]
- O'Brien EK, Zhang X, Nishimura C, Tomblin JB, Murray JC. Association of specific language impairment (SLI) to the region of 7q31. American Journal of Human Genetics. 2003;72:1536–1543. doi: 10.1086/375403. [DOI] [PMC free article] [PubMed] [Google Scholar]
- O'Connell JR, Weeks DE. PedCheck: a program for identification of genotype incompatibilities in linkage analysis. American Journal of Human Genetics. 1998;63:259–266. doi: 10.1086/301904. [DOI] [PMC free article] [PubMed] [Google Scholar]
- Ober C, Cox NJ. The genetics of asthma. Mapping genes for complex traits in founder populations. Clinical & Experimental Allergy. 1998;28(Suppl 1):101–105. 108–110. doi: 10.1046/j.1365-2222.1998.0280s1101.x. [DOI] [PubMed] [Google Scholar]
- Ober C, Cox NJ, Abney M, Di Rienzo A, Lander ES, Changyaleket B, et al. Genome-wide search for asthma susceptibility loci in a founder population. The Collaborative Study on the Genetics of Asthma. Human Molecular Genetics. 1998;7:1393–1398. doi: 10.1093/hmg/7.9.1393. [DOI] [PubMed] [Google Scholar]
- Ober C, Tsalenko A, Parry R, Cox NJ. A second-generation genomewide screen for asthma-susceptibility alleles in a founder population. American Journal of Human Genetics. 2000;67:1154–1162. doi: 10.1016/s0002-9297(07)62946-2. [DOI] [PMC free article] [PubMed] [Google Scholar]
- Reich DE, Cargill M, Bolk S, Ireland J, Sabeti PC, Richter DJ, et al. Linkage disequilibrium in the human genome. Nature. 2001;411:199–204. doi: 10.1038/35075590. [DOI] [PubMed] [Google Scholar]
- Riaz N, Steinberg S, Ahmad J, Pluzhnikov A, Riazuddin S, Cox NJ, et al. Genomewide significant linkage to stuttering on chromosome 12. American Journal of Human Genetics. 2005;76:647–651. doi: 10.1086/429226. [DOI] [PMC free article] [PubMed] [Google Scholar]
- Risch NJ. Searching for genetic determinants in the new millennium. Nature. 2000;405:847–856. doi: 10.1038/35015718. [DOI] [PubMed] [Google Scholar]
- SLI Consortium. A genomewide scan identifies two novel loci involved in specific language impairment. American Journal of Human Genetics. 2002;70:384–398. doi: 10.1086/338649. [DOI] [PMC free article] [PubMed] [Google Scholar]
- Sanjuan J, Tolosa A, Gonzalez JC, Aguilar EJ, Molto MD, Najera C, et al. FOXP2 polymorphisms in patients with schizophrenia. Schizophrenia Research. 2005;73:253–256. doi: 10.1016/j.schres.2004.05.012. [DOI] [PubMed] [Google Scholar]
- Schaid DJ, Guenther JC, Christensen GB, Hebbring S, Rosenow C, Hilker CA, et al. Comparison of microsatellites versus single-nucleotide polymorphisms in a genome linkage screen for prostate cancer-susceptibility loci. American Journal of Human Genetics. 2004;75:948–965. doi: 10.1086/425870. [DOI] [PMC free article] [PubMed] [Google Scholar]
- Schulte-Korne G, Grimm T, Nothen MM, Muller-Myhsok B, Cichon S, Vogt IR, et al. Evidence for linkage of spelling disability to chromosome 15. American Journal of Human Genetics. 1998;63:279–282. doi: 10.1086/301919. [DOI] [PMC free article] [PubMed] [Google Scholar]
- Shugart YY, Mundorff J, Kilshaw J, Doheny K, Doan B, Wanyee J, et al. Results of a genome-wide linkage scan for stuttering. American Journal of Medical Genetics A. 2004;124:133–135. doi: 10.1002/ajmg.a.20347. [DOI] [PubMed] [Google Scholar]
- Sobel E, Lange K. Descent graphs in pedigree analysis: applications to haplotyping, location scores, and marker-sharing statistics. American Journal of Human Genetics. 1996;58:1323–1337. [PMC free article] [PubMed] [Google Scholar]
- Spielman RS, Ewens WJ. The TDT and other family-based tests for linkage disequilibrium and association. American Journal of Human Genetics. 1996;59:983–989. [PMC free article] [PubMed] [Google Scholar]
- Suresh R, Ambrose N, Roe C, Pluzhnikov A, Wittke-Thompson JK, Ng MC-Y, et al. New complexities in the genetics of stuttering: Significant sex-specific linkage signals. American Journal of Human Genetics. 2006;78:554–563. doi: 10.1086/501370. [DOI] [PMC free article] [PubMed] [Google Scholar]
- Viswanath N, Lee HS, Chakraborty R. Evidence for a major gene influence on persistent developmental stuttering. Human Biology. 2004;76(3):401–412. doi: 10.1353/hub.2004.0050. [DOI] [PubMed] [Google Scholar]
- White House Conference Committee Report on Child Health and Protection. Section III, Special Education: The Handicapped and the Gifted. New York: D. Appleton Century; 1931. [Google Scholar]
- Wingate ME. A Standard Definition of Stuttering. Journal of Speech and Hearing Disorders. 1964;29:484–489. doi: 10.1044/jshd.2904.484. [DOI] [PubMed] [Google Scholar]
- Wise LH, Lanchbury JS, Lewis CM. Meta-analysis of genome searches. Annals of Human Genetics. 1999;63 (Pt 3):263–272. doi: 10.1046/j.1469-1809.1999.6330263.x. [DOI] [PubMed] [Google Scholar]
- Wright AF, Carothers AD, Pirastu M. Population choice in mapping genes for complex diseases. Nature Genetics. 1999;23:397–404. doi: 10.1038/70501. [DOI] [PubMed] [Google Scholar]
- Yairi E, Ambrose N, Cox N. Genetics of stuttering: a critical review. Journal of Speech and Hearing Research. 1996;39:771–784. doi: 10.1044/jshr.3904.771. [DOI] [PubMed] [Google Scholar]
- Yairi E. Is the basis of stuttering genetic? ASHA. 1998;40:29–32. [PubMed] [Google Scholar]
- Yairi E, Ambrose NG. Early childhood stuttering I: persistency and recovery rates. Journal of Speech, Language, and Hearing Research. 1999;42:1097–1112. doi: 10.1044/jslhr.4205.1097. [DOI] [PubMed] [Google Scholar]
- Yairi E, Ambrose NG. Early Childhood Stuttering. Austin, TX: Pro-Ed, Inc; 2005. [Google Scholar]