

Abstract
Although segregation of both simultaneous and sequential speech items may be involved in the reception of speech in noisy environments, research on the latter is relatively sparse. Further, previous studies examining the ability of hearing-impaired listeners to form distinct auditory streams have produced mixed results. Finally, there is little work investigating streaming in cochlear implant recipients, who also have poor frequency resolution. The present study focused on the mechanisms involved in the segregation of vowel sequences and potential limitations to segregation associated with poor frequency resolution. An objective temporal-order paradigm was employed in which listeners reported the order of constituent vowels within a sequence. In Experiment 1, it was found that fundamental frequency based mechanisms contribute to segregation. In Experiment 2, reduced frequency tuning often associated with hearing impairment was simulated in normal-hearing listeners. In that experiment, it was found that spectral smearing of the vowels increased accurate identification of their order, presumably by reducing the tendency to form separate auditory streams. These experiments suggest that a reduction in spectral resolution may result in a reduced ability to form separate auditory streams, which may contribute to the difficulties of hearing-impaired listeners, and probably cochlear implant recipients as well, in multi-talker cocktail-party situations.
Keywords: Streaming, Vowel Sequences, Hearing Impairment, Spectral Smearing
1 Introduction
Bregman (1990) suggested that auditory scene analysis involves the ability to decompose a sound mixture into percepts corresponding to various acoustic sources. The mechanisms involved in this analysis have been described in the literature in terms of stream segregation. Following Bregman’s classification, two mechanisms are usually described: one related to simultaneous sounds, the other related to sequential sounds. Using these mechanisms, most people are able to focus on a single talker and understand what is being said despite the presence of competing signals. Unfortunately, this ability may be diminished in hearing-impaired (HI) listeners and cochlear-implant (CI) recipients.
It seems obvious that segregation of simultaneously-occurring sounds is involved in the ability to understand speech in noisy backgrounds. However, Mackersie et al. (2001) demonstrated a relationship between the speech reception threshold (SRT) and the fusion threshold (as defined by Rose and Moore, 1997) suggesting that the reception of speech in noise may also be related to segregation of sequentially-occurring sounds (streaming). In fact, the weak relationship found between the SRT and simultaneous segregation in HI listeners (Summers and Leek, 1998) raises the possibility that sequential segregation may be an even better predictor of speech in noise reception than simultaneous segregation.
Simultaneous segregation has been examined by a number of investigators using both non-speech and speech stimuli (for review, see de Cheveigné, 1999). In contrast, sequential segregation has primarily been investigated using pure or complex tones (for review, see Moore and Gockel, 2002). Thus, although both segregation mechanisms are potentially involved in the recognition of speech in noisy backgrounds, and despite the fact that both mechanisms are potentially impaired by reductions in frequency selectivity, empirical examinations of sequential segregation of speech are relatively sparse.
1.1 Segregation with reduced spectral cues
Although mixed, there is some evidence that listeners with HI have reduced stream segregation abilities. Grose and Hall (1996) employed a pair of tasks and found that listeners with cochlear hearing loss generally required a greater frequency separation for segregation of sequential pure tones. However, in contrast to this work and the theory of Hartmann and Johnson (1991), Rose and Moore (1997) found no consistent difference between ears of unilaterally-impaired listeners in the frequency difference required to segregate pure tones.
Recent work has also suggested that segregation may be impaired in CI users. Qin and Oxenham (2005) found that NH listeners exposed to speech-vocoder simulations of a CI were unable to benefit from fundamental frequency (F0) differences in concurrent-vowel identification. Carlyon et al. (2007) reported that CI users were unable to benefit from temporal pitch differences between channels to separate concurrent sounds. Cooper and Roberts (2007) employed pure-tone stimuli and also found little evidence of stream segregation in CI users. However, other investigators have observed that some users are able to perceptually segregate stimuli (e.g. Chatterjee et al., 2006). The importance of segregation in normal communication was highlighted by Hong and Turner (2006), who found that CI users who performed better on a streaming task also performed better on speech recognition in noise.
This possible reduction in segregation by HI and CI listeners could be related to reduced frequency specificity. Both Arehart et al. (1997) and Summers and Leek (1998) found that HI individuals benefited less from F0 differences across voices in concurrent vowel identification tasks. Similarly, Qin and Oxenham (2005) suggested that limited concurrent-vowel performance in their CI vocoder simulations was likely due to the limited spectral representation. However, Rose and Moore (2005) found large variability in the ratio between frequency discrimination in HI listeners and the frequency difference required to segregate pure tones. Thus, the effects of reduced frequency selectivity in the segregation of speech signals remain unclear.
Evidence from experiments involving flat-spectrum complex tones suggests more strongly that frequency tuning may play a role in segregation by showing that resolvability of harmonics is an important cue for segregation. Vliegen and Oxenham (1999), Vliegen et al. (1999), Grimault et al. (2000, 2001), Roberts et al. (2002) and Stainsby et al. (2004a, b) all employed complex tone sequences filtered to restricted spectral regions. For a given F0, harmonics were generally resolved in low-frequency conditions, and unresolved in high-frequency conditions (except in Roberts et al., 2002, where they were always unresolved). It was generally found that streaming was weakened, though not absent, when components were unresolved. Thus, the difficulties of HI listeners in cocktail party situations may potentially be related to a loss of resolvability that would impair streaming mechanisms.
However, the complex-tone stimuli used in these experiments differ substantially from speech. These stimuli were restricted in frequency, and components were generally either resolved or unresolved. In ecological situations, HI listeners may resolve the lower portions of the broadband signal, but not the higher portions, and this resolution may change over time as a result of F0 fluctuation. Also, these studies employed flat-spectrum complex tones lacking the formant structure that may affect streaming performance (e.g., Dorman et al., 1975; Singh, 1987; Bregman et al., 1990). Finally, speech may benefit from specific schema-driven mechanisms as suggested by Bregman (1990) and Remez et al. (1994).
1.2 Streaming with speech stimuli
Various acoustic cues can induce sequential segregation. For complex tone sequences (as a first approximation of speech), streaming seems to be influenced by two main factors: pitch and timbre (Bregman et al., 1990; Singh, 1987; Singh and Bregman, 1997). However, the timbre variations applied to the non-speech stimuli have involved elimination of harmonics or, at best, spectral shaping using a single formant. Thus, the influence of multi-formant timbre in streaming of speech is unclear.
There is limited work employing speech signals. Following many studies involving the perception of temporal order (Hirsh, 1959; Warren et al., 1969; Thomas et al., 1970; Lackner and Goldstein, 1974), Dorman et al. (1975) examined the influence of formant differences on streaming using four-item vowel sequences. The authors employed sequences of items having a constant F0 and found that the ability to perceive the items in the correct order was dependent upon the sequence being perceived as a single auditory stream (see also Bregman and Campbell, 1971). It was concluded that, in the absence of formant transitions, vowel sequences of constant pitch could induce stream segregation. Darwin and Bethell-Fox (1977) observed that streaming can also occur with formant transitions if abrupt discontinuities exist in the pitch contour.
More recently, Bregman et al. (1990) examined the relative importance of, and possible interaction between, streaming based on pitch and streaming based on a single formant (spectral peak). Sequences consisted of four complex tones (A, B, C, and D) that differed in F0 and/or frequency of the spectral peak. The sequences started with a looped pattern AB – – (where the symbol –represents a silent gap). After twenty repetitions, tones C and D were added to form the pattern ABCD. Subjects were then asked to judge on a five point scale (1 = hard, 5 = easy) how easily they could hear the standard pair AB in the pattern ABCD. Spectral peak positions and F0’s were manipulated independently. On some trials, the two tones comprising the standard were similar in F0; on such trials, F0 was the tested factor and spectral peak position the interfering factor. On other trials, the two tones in the standard were similar in spectral peak position; on such trials, spectral peak position was the tested factor and F0 the interfering factor. Fundamental frequencies ranged from 128 to 277 Hz, and spectral peak positions ranged from 1000 to 2161 Hz. If the tested factor was dominant for segregation, tones A and B should have been segregated from tones C and D and the task should have been judged easy by the subject. In this subjective measure of streaming, the authors concluded that spectral peak position affected streaming more strongly than F0. In a second experiment, the effect of spectral peak sharpness on streaming was evaluated. Triangularly-shaped peaks two octaves in width were employed. The height of the triangle (in relative dB) defined peak sharpness. It was found that broadening of the peak tended to weaken the streaming effect, further suggesting a relationship between tuning and streaming.
Nooteboom et al. (1978) may have provided the only systematic investigation of the effect of pitch on the segregation of sequences of vowels. The authors employed short sequences of nine synthesized vowels using the pattern /a u I a u I a u i/. The F0 alternated between 100 Hz and another fixed value between 100 and 280 Hz. It was found that, for realistic speech rates (from 3 to 10 vow/s), an F0 difference between approximately two and five semitones produced segregation. However, that early study had substantial limitations. First, because the sequences were brief (from 1 to 4 s) and presented only once, the streaming effect was not stabilized when the subjects issued their response (cf. Bregman, 1978). Second, a subjective measure of streaming was employed in which subjects simply reported hearing one or two voices. Finally, only two subjects were examined. As a consequence, streaming with vowel sequences deserves further examination, both under normal conditions, and under conditions of reduced frequency tuning.
1.3 Rationale
Although sequential segregation of speech sounds plays a potentially important role in the reception of speech in noise, it has not been well studied. Further, the influence of reduced frequency selectivity on this ability to form separate auditory streams is not well understood.
In the present experiments, streaming was observed through an objective method based on the perception of temporal order. Looped sequences of vowels were presented to subjects who were required to identify the correct order of occurrence. Accurate identification is assumed possible only if the items form a single auditory stream. Because attention in this task is directed against streaming, the observed segregation is only that which cannot be suppressed, generally referred as automatic or obligatory streaming. Obligatory streaming relates to primitive mechanisms that should be dependent upon presentation rate (van Noorden, 1975; Bregman, 1990). In Experiment 1, the role of presentation rate and F0 differences across vowels were investigated. In a second experiment, the influence of spectral smearing of speech sounds on the formation of separate auditory streams was assessed. These conditions provide information concerning the influence of broadened auditory tuning on the ability to segregate sequential speech signals.
2 Experiment 1: Intact vowel sequences
The purpose of this experiment was to examine the formation of separate auditory streams with sequential vowel stimuli using an objective method. Conditions in which pitch was held constant and items varied only in formant structure were employed, as were conditions in which alternate items had different F0 values. It is worth noting that, unlike previous studies involving complex tones, the present experiment required identification of constituent items, ensuring recognition of the speech at least at a phonemic level.
2.1 Subjects
Ten young NH listeners aged 20 to 27 years (mean 23.5) participated in this experiment. All were native speakers of French, and all had pure-tone audiometric thresholds below 15 dB HL at octave frequencies between 250 and 4000 Hz. All were paid an hourly wage for participation, and none had participated in similar experiments previously.
2.2 Stimuli
Six French vowels /a e I

 y / were generated using a cascade-resonance synthesizer (Klatt, 1980) at ten different fundamental frequencies (100, 110, 121, 134, 147, 162, 178, 196, 216, and 238 Hz). Durations of 135 and 175 ms were selected to be close to those associated with natural speech. Each vowel onset and offset was smoothed with a 10 ms cosine ramp. Vowels were chosen based on their extreme positions within the vowel space defined by the first and second formants. The center frequency and bandwidth values of formants are presented in Table 1. All vowels were adjusted to have the same RMS power.
Table 1.
Values of formant frequencies and bandwidths for French vowels adapted from Tessier (2001). Fi is the center frequency of the i-th formant in Hertz. The bandwidth Δ fi is given in Hertz, between braces. For all vowels, F4 = 3300 Hz (Δf4 = 250 Hz), F5 = 3850 Hz (Δf5 = 300 Hz), and F6 = 4900 Hz (Δf6 = 1000 Hz).
| Vowel | F1 (Δf1) | F2 (Δf2) | F3 (Δf3) |
|---|---|---|---|
| a | 750 (75) | 1344 (60) | 2510 (84) |
| e | 370 (55) | 1900 (74) | 2700 (100) |
| I | 250 (55) | 2000 (50) | 3000 (120) |
|
|
380 (53) | 850 (63) | 2460 (70) |
|
|
244 (60) | 750 (70) | 2000 (100) |
| y | 224 (74) | 1728 (80) | 2069 (83) |
The vowels were organized into sequences containing the six items (see Fig. 1). The F0 of successive items alternated, so that three items were at F0(1) and the alternate three were at F0(2). F0(1) was always 100 Hz, and F0(2) ranged up to 238 Hz and was constant for a given sequence. Half the sequences started with F0(1), and the other half started with F0(2). The sequences were presented in recycling fashion, so the number of different possible sequences was 6!/6, or 120. One hundred of the 120 possible permutations were randomly selected for inclusion. For each of the 10 F0 conditions at each presentation rate, 10 sequences were randomly selected (without replacement) that differed only in the order of the vowels. The order of items comprising each sequence was determined independently for the two presentation rates. The sequences were built by concatenating vowels with no silent gap, so that the steady state portions of the vowels were separated by the two 10 ms ramps. No additional fade-in was applied to the sequences. The 16 bit, 44.1 kHz sequences were generated with Matlab.
Fig. 1.
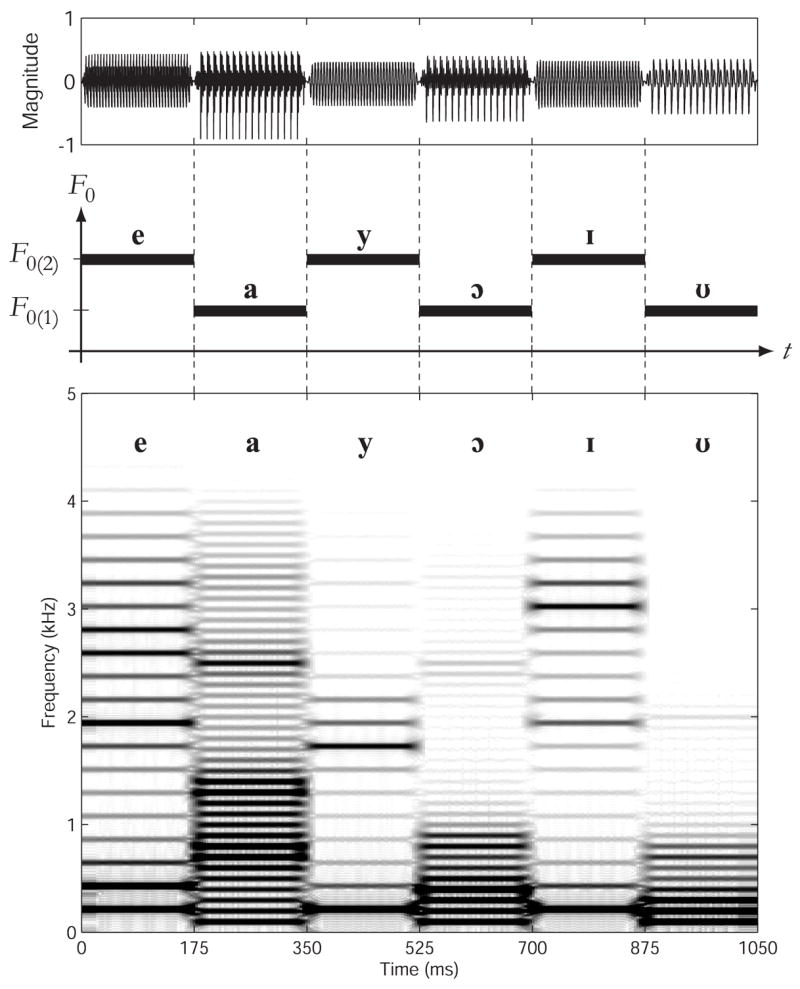
Upper panel: Waveform of a sequence (/e a y
I
/), F0(1)=100 Hz, F0(2)=216 Hz, where each vowel is 175 ms in duration. Middle panel: A schematic representation of the F0 pattern. Lower panel: Sonogram of the sequence.
2.3 Procedure
A preliminary identification task ensured that the individual vowels were easily identifiable. The six vowels were presented individually in random order at F0’s of 100, 110, 147 and 238 Hz, with 10 repetitions for a total of 240 presentations. Identification was found to be over 99% accurate.
In each of two subsequent sessions, subjects heard two blocks consisting of 100 sequences each. One block consisted of high-rate sequences (135 ms per vowel, 7.4 vowels per sec.) and one block consisted of low-rate sequences (175 ms per vowel, 5.7 vowels per sec.). Five subjects heard the high-rate block prior to the low-rate block, and the five remaining subjects heard the opposite order. Presentation order of sequences within block was randomized for each listener. The stimuli were presented diotically via a Digigram VxPocket 440 soundcard and Sennheiser HD-250 Linear II headphones in a double-walled sound booth. The level of the steady-state portions of the signal was calibrated to 85 dB SPL in an artificial ear (Larson Davis AEC101 and 824).
Each block began with presentation of the isolated vowels followed by presentation of two sample sequences with feedback. The subjects were then instructed to report the correct order of appearance of the six vowels in each sequence. This led to an across score that reflects the proportion of responses in which the six vowels were identified in the correct order, allowing circular permutations. When they judged this task impossible, subjects were instructed to report the order of the vowels within each stream one after the other. This led to a WITHIN score that reflects the proportion of responses in which the vowels comprising each F0 group were reported in the correct order, allowing circular permutations within each group. For example, for sequence /e a y
I
/, the response /e a y
I
/ would increase the across score, and the response /e y I a
/ or /a
e y I/ would increase the WITHIN score.
Subjects provided their response, starting with any vowel, using a computer mouse interface while listening to the repeating sequence. At the start of the auditory stimulus, the response screen displayed “Listen” for 5 s, then “Answer” and six columns each containing the six different vowels with radio buttons. The subject had to check one radio button in each column. When all buttons had been checked, a “Submit” button appeared. The stimuli stopped when the subject was satisfied with the response and clicked this button. The subject was locked-out from responding during the initial five seconds of exposure to each sequence to allow the streaming effect to stabilize (Bregman, 1978). No feedback was provided. Each session lasted approximately 35 minutes. All experimental paradigms were formally approved by a local ethics committee (CCPPRB Léon Bérard).
2.4 Results
The number of sequences identified in the correct order (across score) was tallied for each individual across the two blocks, in each F0 and rate condition, yielding a score that ranged between 0 and 20. Scores are expressed in percent, with 100% corresponding to a score of 20. The across score averaged across individuals is plotted as a function of F0(2) in Fig. 2 (left panel). Chance performance is 0.8%. As previously described in the literature, high scores can be interpreted as a tendency toward integration across the F0(1) and F0(2) items and a resistance to streaming. All subjects demonstrated decreasing scores with increasing F0 difference for both presentation-rate conditions. For small F0 differences, mean scores are approximately 50% accurate responses, whereas for an F0 difference larger than one octave, mean scores fall to about 10%. A two-way ANOVA 1 using F0 and presentation rate as repeated parameters indicated that the effect of F0 was significant [F (9, 81) = 21.14, p < 0.001] and that low-rate sequences were accurately identified more often than high presentation-rate sequences [F (1, 9) = 13.81, p < 0.01]. The interaction was also significant [F (9, 81) = 2.21, p < 0.05].
Fig. 2.
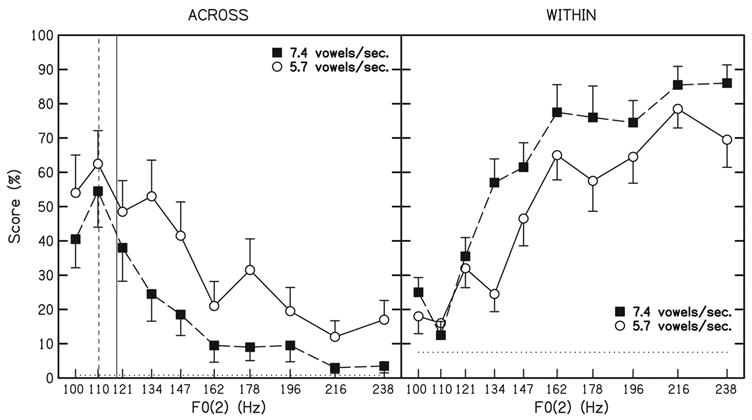
Left panel: Across scores (accurate identifications of the order of items in a six-vowel sequence) expressed in percent as a function of the fundamental frequency of alternate items. Filled squares (■) represent group mean scores for high speech-rate sequences (7.4 vowels/s). Open circles (○) represent group mean scores for low speech-rate sequences (5.7 vowels/s). Error bars represent standard deviations. Chance level is plotted with a horizontal dotted line. The vertical lines indicate the approximate locations at which subjects from Nooteboom et al. (1978) reported hearing a single voice (on the left side of the lines) or two voices (on the right side) for a speech-rate fixed at 7.4 vowels/s (dashed vertical line) or at 5.7 vowels/s (solid vertical line). Right panel: Within scores (accurate identifications of the order of vowels at each F0) expressed in percent as a function of the fundamental frequency of alternate items. The legend is the same as in the left panel. Chance level is plotted with a horizontal dotted line.
The number of sequences in which the vowels comprising each F0 group were reported in the correct order (within score) was also tallied for each individual across the two blocks, in each F0 and rate condition, yielding a score that ranged between 0 and 20 expressed in percent. The within score averaged across individuals is also plotted as a function of F0(2) in Fig. 2 (right panel). Chance level equals 7.5%. A two-way ANOVA 2 using F0 and presentation rate as repeated parameters indicated that the effect of F0 [F (9, 81) = 49.97, p < 0.0001] and presentation rate [F (1, 9) = 10.58, p < 0.01] were significant and interacted [F (9, 81) = 5.06, p < 0.0001].
2.5 Discussion
The expected strong effect of F0 was found. Analyzing the across scores, larger F0 differences led to more streaming, which made order judgments more difficult. No discrepancy in the pattern of scores was observed near the octave relation across alternate items. The fact that listeners remain good at judging the relative order of items sharing the same F0 (within score) at large F0 differences strengthens the argument that stream segregation is the key factor driving the decline in across performance as F0 difference increases. Streaming was presumably quite strong in the high-rate conditions over 162 Hz, in which F0 identification was especially poor and within F0 identification was especially good. This floor effect presumably contributed to the interaction. However, as detailed further, other factors might also contribute to this interaction.
Approximations of the thresholds from Nooteboom et al. (1978) are also shown in Fig. 2. The vertical lines correspond to the points at which the percept changed from a single voice to two voices. They correspond to an F0 difference for which the subjects in the current study accurately identified approximately 50% of the sequences presented. It is potentially interesting to note that the experimental paradigm used in Nooteboom et al. (1978), in which subjects reported the number of voices heard, may prevent a reliable estimation of streaming based on differences in item identity (formant structure) and not based on pitch differences because voices are often characterized by their pitches. It is possible that a sequence segregated on the basis of formant differences would have been reported as emanating from a single talker in Nooteboom et al. (1978).
The subjects were unable to accurately identify the order of items (they had low across scores) at high values of F0(2). In addition to illustrating the F0 effect, this shows that subjects were unable to develop strategies to overcome the streaming effect. In particular, as sequences were not faded in slowly over time, it might have been thought that subjects could benefit from exposure to the sequence before streaming developed. However, had any such strategy been successfully used, subjects should have been able to accurately identify the order of items at high values of F0(2).
The objective task employed likely directed attention away from segregation, as segregation tended to prevent accurate performance. Moreover, the mechanisms underlying segregation were sensitive to presentation rate. Because the temporal coherence boundary depends strongly on the tempo of the sequence, while the fission boundary is relatively independent of this parameter (van Noorden, 1975; Bregman, 1990), the strong effect of presentation rate in this experiment suggests that the paradigm provides a reliable estimation of temporal coherence, i.e. primitive segregation. When two speakers are speaking concurrently, it seems reasonable to assume that these utterances will not be entirely simultaneous. The primitive mechanisms of sequential segregation based on F0 may then contribute to the understanding of speech-in-speech.
Overall, the results from the current experiment compare well with early reports and indicate that differences in both pitch (F0) and timbre appear to impair the perception of temporal relationships between vowels within a sequence, and are potentially important factors leading to sequential segregation of speech. The current study provides advantages over previous work, by providing an estimate of the influence of F0 on streaming of vowel sequences using a larger number of subjects, an objective measurement of obligatory streaming, and a method that ensures that the stimuli are recognized as speech.
3 Experiment 2: Smeared vowels sequences (hearing-loss simulation)
The investigation of streaming in speech stimuli under conditions of reduced spectral cues is potentially important for understanding the difficulties encountered by HI (and CI) listeners in multi-talker cocktail party situations. If broadened auditory tuning and limited access to pitch and timbre cues produce less streaming, then the simulation of broadened auditory tuning in the current experiment should allow more accurate identification of items in the correct order, because the interfering effect of streaming is reduced. It is worth noting that, because any segregation deficit should lead to better performance in the current paradigm, the results cannot be attributed to intelligibility (vowel identification) impairment or to any increase in cognitive load resulting from the broadening of the stimuli.
The use of young NH subjects in the current experiment allows the elimination of many difficulties encountered when testing HI individuals. These listeners had homogeneous and sharp auditory tuning, and broadened tuning was simulated by spectral smearing of the acoustic stimuli (after Baer and Moore, 1993). This ensured similar cochlear resolution across subjects. Further, the use of NH subjects avoids effects of loudness recruitment and ensures preserved cochlear compression. Possible effects of advanced age are also eliminated. Moreover, the procedure reduces intersubject variability and strengthens the statistical power of the smearing effect by simulating the loss of cochlear resolution within instead of across individuals.
3.1 Subjects
Ten French-speaking listeners, aged 21 to 29 years (mean 23.9), participated. All had pure-tone thresholds of 15 dB HL or better at octave frequencies from 250 to 4000 Hz. None participated in Experiment 1 or had previously taken part in any other similar experiment.
3.2 Stimuli
The 100 sequences having the lowest perceptual distances (de Boer, 2000) 3 were selected from the 120 possible permutations. In an attempt to provide greater similarity in sequences comprising each condition, the sets were generated so that the mean perceptual distances for each F0 condition were similar. One set of sequences was constructed using the 175 ms vowels from Experiment 1, and a second set of sequences was created using spectrally-smeared vowels. The order of items within sequences comprising the Smeared and Intact conditions was identical.
The smeared vowels were generated by modifying the intact items using the algorithm of Baer and Moore (1993), with simulated auditory filters set to three times broader than normal. Although there is considerable variability in the relation between audiometric threshold and tuning, an auditory filter enlargement of three times normal would correspond to absolute thresholds from 30 to 60 dB higher than normal (Moore, 1998).
The technique of Baer and Moore (1993) involved first windowing the input signal using a Hamming window (8 ms) with an overlap (4 ms). For each time window, the spectrum was computed using a fast Fourier transform and smeared. The smearing process was performed by convolving the power spectrum with a smearing function. This smearing function was a bank of broadened, symmetrical, and normalized roex(p) filters (Patterson et al., 1982) simulating an impaired cochlea, multiplied by a bank of inverse normalized roex(p) filters simulating a normal cochlea. This evokes excitation patterns in a normal ear that resemble those that would be evoked in an impaired ear using unsmeared stimuli. Each smeared spectrum was then transformed to the time domain using an inverse fast Fourier transform. All time windows were then added using an overlap and add method to obtain the smeared output. The stimuli were processed using Matlab.
3.3 Procedure
The session began with an identification test on the smeared vowels at 100, 147, and 238 Hz. Each vowel was repeated five times in each F0 condition, resulting in a total of 90 presentations. Subjects repeated this test until identification of smeared vowels reached 94% accuracy (85/90). On average, the subjects needed 2.3 repetitions to reach this value. This identification test was then followed by two blocks of the streaming test as in Experiment 1. Each block was composed of 50 smeared and 50 intact sequences. Each sequence (each particular vowel order) appeared smeared in one block and intact in the other block. Half the subjects heard the smeared block first and the other half heard the intact block first, and presentation order of sequences within each block was randomized for each listener. The apparatus and other procedures were the same as those of Experiment 1.
3.4 Results
Group mean data are presented in Fig. 3. The results observed in this experiment for intact vowels are consistent with those of Experiment 1, including a starting point at approximately 55% accurate responses across F0s at F0(2) = 100 Hz, followed by a decrease in across scores to an asymptote around 10% accurate response. For eight of the ten subjects, across scores for smeared sequences were greater than (again, reflecting less streaming), or equal to, across scores for intact sequences over all F0 conditions. A two-way ANOVA 4 applied to the across scores involving F0 and smearing condition as repeated parameters revealed a significant effect of smearing [F (1, 9) = 5.46, p = 0.04] and F0 [F (9, 81) = 34.21, p < 0.001]. The interaction was not significant [F (9, 81) = 1.50, p = 0.16]. Finally, a contrast between the matched F0 conditions revealed higher scores in the Smeared condition [p = 0.016].
Fig. 3.
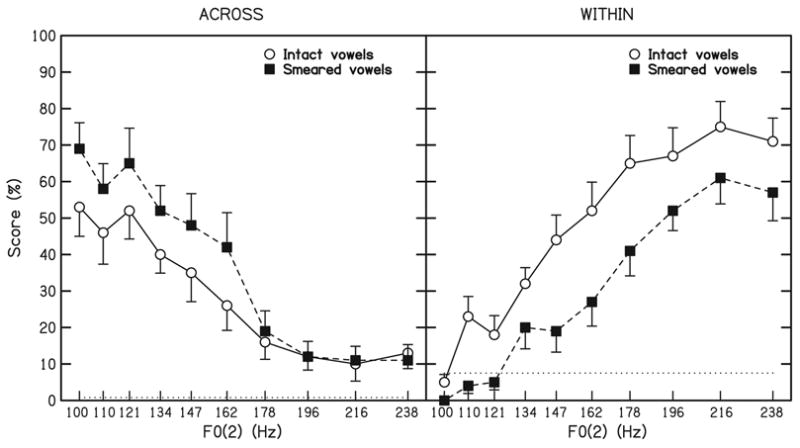
Left panel: Across scores (accurate identifications of the order of items in a six-vowel sequence) expressed in percent as a function of the fundamental frequency of alternate items. Results for sequences of spectrally-smeared vowels are plotted with filled symbols (■), and results for sequences of intact vowels are plotted with open symbols (○). Error bars represent standard deviations. Chance level is plotted with a horizontal dotted line. Right panel: Within scores (accurate identifications of the order of vowels at each F0) expressed in percent as a function of the fundamental frequency of alternate items. The legend is the same as in the left panel. Chance level is again plotted with a horizontal dotted line.
The within scores rose with increasing F0(2) in both the Intact and Smeared conditions. The results of an ANOVA 5 applied to the within scores were consistent with those for the across scores. The effect of smearing [F (1, 9) = 22.70, p < 0.005] and F0 [F (9, 81) = 50.44, p < 0.0001] were significant, but did not significantly interact [F (9, 81) = 1.48, p = 0.17].
3.5 Discussion
Identification of component order across F0s was more accurate in conditions in which the vowels were smeared, relative to the intact conditions. Because poorer order identification performance is an indication of segregation, it may be concluded that segregation was impaired by spectral smearing of the vowel stimuli that simulated a typical broadening of auditory filters associated with cochlear hearing loss. It is worth noting that even under smearing conditions in which vowels were more difficult to identify, subjects produced better sequence-order identification scores. Since identical orders of items were employed for sequences across conditions, spectral smearing is the likely cause of the observed differences in segregation performance. This interpretation is strengthened by the detrimental effect of smearing upon order identification within F0s (within scores).
4 General discussion
This study is directed toward clarifying the mechanisms that enable sequential streaming. Together, Experiments 1 and 2 showed that an F0 difference is a strong cue for sequential segregation. This is consistent with the literature involving both complex tones (e.g., Singh, 1987; Bregman et al., 1990; Moore and Gockel, 2002) and vowels (Darwin and Bethell-Fox, 1977; Nooteboom et al., 1978). In particular, the present study strengthens the results of Nooteboom et al. (1978).
The strong effect of F0 on segregation occurs despite the large timbre differences that exist across vowels. This suggests that this mechanism could also apply to everyday speech. Moreover, timbre is sometimes described in the literature as the strongest cue for streaming (Bregman, 1990; Bregman et al., 1990). It appears that timbre differences across vowels are not strong enough to lead to full sequential segregation, as the current task remains possible even with no formant transitions between vowels. This could be due to the presence of six formants instead of one in previous experiments aimed at determining the effect of timbre upon segregation. This suggests that single formant stimuli may not accurately represent segregation of speech. It is noteworthy that in ecological situations, formant transitions may hinder formant-based streaming, but pitch-based segregation still occurs (Darwin and Bethell-Fox, 1977).
In Experiment 1, average across scores were below 65% even in the most favorable conditions. One interpretation is that the order judgments were simply difficult and independent of streaming. However, this interpretation is not consistent with the results from Experiment 2 in which across scores at matched F0 condition were higher in the degraded (Smeared) condition than in the Intact condition. It is unlikely a degraded condition would lead to a better order judgment. This raises the alternative interpretation that order judgments were hindered by some streaming, even in the matched F0 conditions.
Support for this interpretation comes from Dorman et al. (1975) who found that vowel sequences with constant pitch and no formant transitions could be perceived as segregated. Indeed, the across scores in the lowest F0(2) conditions compare well to those found by Dorman et al. (about 60% correct) even if direct comparison between studies is difficult because of differences in the experimental paradigms.
Support for this interpretation also comes from a subsequent analysis in which a correlation was found between the perceptual distance between vowels (de Boer,2000) 3 and average across scores at F0(2) = 100 Hz: The greater the perceptual distance across the F0(1) and F0(2) items, the lower the score (i.e., greater tendency toward streaming). Correlations were r(8) = .79, p = 0.01 for the low rate and r(8) = .68, p = 0.03 for the high rate. Although it may be most pronounced in conditions in which F0 values were similar, streaming related to formant structure would tend to decrease across scores in all F0 conditions.
Additional support for some streaming in the absence of an F0 difference comes from Bregman et al. (1990) who attempted to determinate the relative importance to segregation of formant peak separation and F0 separation. To estimate the effect of peak differences for vowels in the current study, the vowel distance 3 in Barks was used. Mean vowel distance for a given sequence varied from 2.46 to 4.45 Barks. Such formant differences would correspond to peaks at 1471 and 1979 Hz relative to a peak at 1000 Hz in Bregman et al. Interpolating Bregman et al.’s data for those peak values in his Table 3, yields mean Clarity Scores of 7.2 and 8.8. This suggests that, for the entire range of vowel distances used in the current study, the sequences should have been segregated, making the main task very difficult. This result supports the idea that the approximately 50% errors in the matched-F0 conditions could be attributed to segregation based on the different vowel items having different formant structures. However, while Bregman et al. found almost no influence of F0 when considered as an interfering factor (Table 3), F0 had a large influence on segregation performance in the current study. This may be somewhat surprising given that the presentation rate of successive sounds is even faster in Bregman et al. (100 ms) than in the current study.
The discrepancy between the current results and those of Bregman et al. may be attributable to at least two sources. Perhaps the most probable involves methodological differences: Bregman et al. used a subjective judgment that encouraged perceptual segregation. In the current study, an objective measurement of streaming was employed that required fusion. The second possibility involves the use of vowels containing multiple formants in the current study compared to the single-formant stimuli employed by Bregman et al., and the fact that peak distance (in Bregman et al., 1990) may not be exactly comparable to perceptual vowel distance in the current study.
The effect of vowel distance may also explain in part the fact that across scores do not decrease monotonically. The randomly selected sequences in each F0(2) condition may differ in the ease with which order can be identified. This may contribute to the observed interaction between F0 and presentation rate in Experiment 1. In an effort to reduce variability across conditions, formant distance was controlled in Experiment 2.
In Experiment 2, it was shown that streaming was reduced when spectral resolution of the stimuli was reduced. As these mechanisms are probably involved in speech-in-speech understanding, it can be argued that they could contribute to the difficulty displayed by HI listeners in multi-talker environments. Given the strength of the F0 cue for segregation of voices in the current study, it may be assumed that CI users, who have F0 difference limens roughly one order of magnitude poorer than their NH counterparts (Rogers et al., 2006), will also experience considerable difficulty segregating voices in multi-talker environments. This assumption is supported by studies indicating relatively poor segregation abilities in CI users (e.g. Carlyon et al., 2007; Cooper and Roberts, 2007). It is noteworthy that the current paradigm yields better performance in degraded conditions. This paradigm could therefore prove useful for evaluating primitive segregation in HI listeners, as any increases in performance could not be attributed to cognitive impairment, language impairment or identification impairment.
In the smeared vowels, both harmonics and formants were degraded. However, since harmonics are spaced more closely than formants, smearing may be assumed to have a larger detrimental effect on the perception of harmonics than the perception of formants. This observation is consistent with the ability of subjects to accurately identify the smeared vowels. However, it is also true that component order judgments (across scores) were more accurate in the Smeared condition (i.e., streaming was reduced) when items all had the same F0. This result suggests that a broadening of the auditory filters by a factor of three also affects the perception of formants sufficiently to reduce formant-based segregation. This is consistent with the results of the second experiment of Bregman et al. (1990) in which a decrease in segregation accompanied an increase in formant bandwidth by a factor of three. Bregman et al. used peak magnitude to control sharpness, and a three times enlargement is equivalent to a decrease in peak magnitude from 24 to 8 dB. The current results indicate that degradation of spectral cues associated with broadened auditory tuning typical of cochlear hearing loss is sufficient to significantly disrupt streaming.
The real-world ability of HI individuals to understand speech in noisy environments likely involves a number of factors. Although audibility may be the primary concern, the processing of suprathreshold auditory signals is also not normal in these individuals. The loss of outer hair cell function causes a loss of compressive nonlinearity characteristic of NH and a corresponding abnormal growth of loudness (cf. Bacon, 2004). The loss of outer hair cell function is also responsible for broadened auditory tuning. Assuming that signals of interest are generally more spectrally limited than interfering noise, the classic power spectrum model of masking (Patterson and Moore, 1986), predicts that broad tuning will allow larger amounts of noise to enter a given auditory filter, thus reducing the signal to noise ratio at that frequency and disrupting performance.
The current results suggest another influence of broad tuning on auditory performance. It appears that smearing the spectral representation of sequentially-presented speech items reduces the ability to form separate auditory streams. This additional limitation associated with broadened tuning may add to other more well-established limitations to further limit the performance of HI listeners in noisy backgrounds.
Acknowledgments
This study was supported in part by a doctoral grant from the Région Rhône-Alpes (France), and supported by the audioprosthetic group Entendre. Additional support came from NIH/NIDCD Grant DC05795. The authors wish to thank J. P. L. Brokx for providing details on Nooteboom et al. (1978), Frédéric Berthommier, Christophe Micheyl and two anonymous reviewers for their helpful comments, and Mathieu Paquier and Samuel Garcia for technical assistance.
Footnotes
Portions of this work were presented in “Segregation of vowel sequences by normal-hearing and hearing-impaired listeners,” Paper presented at the XIIth International Symposium on Audiological Medicine, Lyon, France, March 2005.
Identical analysis performed on rationalized arcsine transformed across scores (RAU, Studebaker, 1985): F0 [F (9, 81) = 23.75, p < 0 001], presentation rate [F (1, 9) = 20.66, p < 0 01], interaction [F (9, 81) = 1.87, p = 0.07].
Identical analysis performed on RAU within scores: F0 [F (9, 81) = 46.76, p < 0.0001], presentation rate [F (1, 9) = 11.80, p < 0.01], interaction [F (9, 81) = 5.09, p < 0.0001].
For each sequence, the perceptual distance between vowels was calculated using formulas (2) through (5) presented in de Boer (2000). The distance between two vowels is the Euclidian distance in a two-dimensional space in which dimensions are first formant and effective second formant calculated as the weighted sum of the second to fourth formants. The perceptual distance for a given sequence was estimated as the sum of the distances that separate each contiguous pair of vowels.
Identical analysis on RAU across scores: Smearing [F (1, 9) = 4.90, p = 0.05], F0 [F (9, 81) = 38.60, p < 0.001], interaction [F (9, 81) = 1.69, p = 0.10].
Identical analysis on RAU within scores: Smearing [F (1, 9) = 26.56, p < 0.001], F0 [F (9, 81) = 62.03, p < 0.0001], interaction [F (9, 81) = 0.96, p = 0.48].
Publisher's Disclaimer: This is a PDF file of an unedited manuscript that has been accepted for publication. As a service to our customers we are providing this early version of the manuscript. The manuscript will undergo copyediting, typesetting, and review of the resulting proof before it is published in its final citable form. Please note that during the production process errors may be discovered which could affect the content, and all legal disclaimers that apply to the journal pertain.
References
- Arehart KH, King CA, McLean-Mudgett KS. Role of fundamental frequency differences in the perceptual separation of competing vowel sounds by listeners with normal hearing and listeners with hearing loss. J Speech Lang Hear Res. 1997;40:1434–1444. doi: 10.1044/jslhr.4006.1434. [DOI] [PubMed] [Google Scholar]
- Bacon SP. Compression: From Cochlea to Cochlear Implants. Springer-Verlag; New York: 2004. [Google Scholar]
- Baer T, Moore BCJ. Effects of spectral smearing on the intelligibility of sentences in noise. J Acoust Soc Am. 1993;94(3):1229–1241. doi: 10.1121/1.408640. [DOI] [PubMed] [Google Scholar]
- Bregman AS. Auditory streaming is cumulative. J Exp Psychol Hum Percept Perform. 1978;4(3):380–387. doi: 10.1037//0096-1523.4.3.380. [DOI] [PubMed] [Google Scholar]
- Bregman AS. Auditory Scene Analysis: The Perceptual Organization of sound. The MIT Press; Massachusetts, USA: 1990. [Google Scholar]
- Bregman AS, Campbell J. Primary auditory stream segregation and perception of order in rapid sequences of tones. J Exp Psychol. 1971;89(2):244–249. doi: 10.1037/h0031163. [DOI] [PubMed] [Google Scholar]
- Bregman AS, Liao C, Levitan R. Auditory grouping based on fundamental frequency and formant peak frequency. Can J Psychol. 1990;44(3):400–413. doi: 10.1037/h0084255. [DOI] [PubMed] [Google Scholar]
- Carlyon RP, Long CJ, Deeks JM, McKay CM. Concurrent sound segregation in electric and acoustic hearing. J Assoc Res Otolaryngol. 2007;8(1):119–133. doi: 10.1007/s10162-006-0068-1. [DOI] [PMC free article] [PubMed] [Google Scholar]
- Chatterjee M, Sarampalis A, Oba SI. Auditory stream segregation with cochlear implants: A preliminary report. Hear Res. 2006;222(1–2):100–107. doi: 10.1016/j.heares.2006.09.001. [DOI] [PMC free article] [PubMed] [Google Scholar]
- Cooper HR, Roberts B. Auditory stream segregation of tone sequences in cochlear implant listeners. Hear Res. 2007;225(1–2):11–24. doi: 10.1016/j.heares.2006.11.010. [DOI] [PubMed] [Google Scholar]
- Darwin CJ, Bethell-Fox CE. Pitch continuity and speech source attribution. J Exp Psychol Hum Percept Perform. 1977;3(4):665–672. [Google Scholar]
- de Boer B. Self-organization in vowel systems. J Phonetics. 2000;28(4):441–465. [Google Scholar]
- de Cheveigné A. Waveform interactions and the segregation of concurrent vowels. J Acoust Soc Am. 1999;106(5):2959–72. doi: 10.1121/1.428115. [DOI] [PubMed] [Google Scholar]
- Dorman MF, Cutting JE, Raphael LJ. Perception of temporal order in vowel sequences with and without formant transitions. J Exp Psychol Hum Percept Perform. 1975;104(2):147–153. [PubMed] [Google Scholar]
- Grimault N, Micheyl C, Carlyon RP, Arthaud P, Collet L. Influence of peripheral resolvability on the perceptual segregation of harmonic tones differing in fundamental frequency. J Acoust Soc Am. 2000;108(1):263–271. doi: 10.1121/1.429462. [DOI] [PubMed] [Google Scholar]
- Grimault N, Micheyl C, Carlyon RP, Arthaud P, Collet L. Perceptual auditory stream segregation of sequences of complex sounds in subjects with normal and impaired hearing. Br J Audiol. 2001;35(3):173–182. doi: 10.1080/00305364.2001.11745235. [DOI] [PubMed] [Google Scholar]
- Grose JH, Hall JW. Perceptual organization of sequential stimuli in listeners with cochlear hearing loss. J Speech Hear Res. 1996;39(6):1149–1158. doi: 10.1044/jshr.3906.1149. [DOI] [PubMed] [Google Scholar]
- Hartmann WM, Johnson D. Stream segregation and peripheral channeling. Music Percept. 1991;9(2):115–184. [Google Scholar]
- Hirsh IJ. Auditory perception of temporal order. J Acoust Soc Am. 1959;31(6):759–767. [Google Scholar]
- Hong RS, Turner CW. Pure-tone auditory stream segregation and speech perception in noise in cochlear implant recipients. J Acoust Soc Am. 2006;120(1):360–374. doi: 10.1121/1.2204450. [DOI] [PubMed] [Google Scholar]
- Klatt DH. Software for a cascade/parallel formant synthesizer. J Acoust Soc Am. 1980;67(3):971–995. [Google Scholar]
- Lackner JR, Goldstein LM. Primary auditory stream segregation of repeated consonant–vowel sequences. J Acoust Soc Am. 1974;56(5):1651–1652. doi: 10.1121/1.1903493. [DOI] [PubMed] [Google Scholar]
- Mackersie C, Prida T, Stiles D. The role of sequential stream segregation and frequency selectivity in the perception of simultaneous sentences by listeners with sensorineural hearing loss. J Speech Lang Hear Res. 2001;44(1):19–28. doi: 10.1044/1092-4388(2001/002). [DOI] [PubMed] [Google Scholar]
- Moore BCJ. Cochlear hearing loss. Whurr; London: 1998. [Google Scholar]
- Moore BCJ, Gockel H. Factors influencing sequential stream segregation. Acta Acustica united with Acustica. 2002;88(3):320–332. [Google Scholar]
- Nooteboom SG, Brokx JPL, de Rooij JJ. Contributions of prosody to speech perception. In: Levelt WJM, d’Arcais GBF, editors. Studies in the Perception of Language. Wiley and Sons; New-York, USA: 1978. pp. 75–107. [Google Scholar]
- Patterson RD, Moore BCJ. Auditory filters and excitation patterns as representations of frequency resolution. In: Moore BC, editor. Frequency Selectivity in Hearing. Academic Press; London: 1986. [Google Scholar]
- Patterson RD, Nimmo-Smith I, Weber DL, Milroy R. The deterioration of hearing with age: frequency selectivity, the critical ratio, the audiogram, and speech threshold. J Acoust Soc Am. 1982;72(6):1788–1803. doi: 10.1121/1.388652. [DOI] [PubMed] [Google Scholar]
- Qin MK, Oxenham AJ. Effects of envelope-vocoder processing on f0 discrimination and concurrent-vowel identification. Ear Hear. 2005;26(5):451–460. doi: 10.1097/01.aud.0000179689.79868.06. [DOI] [PubMed] [Google Scholar]
- Remez RE, Rubin PE, Berns SM, Pardo JS, Lang JM. On the perceptual organization of speech. Psychol Rev. 1994;101(1):129–156. doi: 10.1037/0033-295X.101.1.129. [DOI] [PubMed] [Google Scholar]
- Roberts B, Glasberg BR, Moore BCJ. Primitive stream segregation of tone sequences without differences in fundamental frequency or passband. J Acoust Soc Am. 2002;112(5):2074–2085. doi: 10.1121/1.1508784. [DOI] [PubMed] [Google Scholar]
- Rogers CF, Healy EW, Montgomery AA. Sensitivity to isolated and concurrent intensity and fundamental frequency increments by cochlear implant users under natural listening conditions. J Acoust Soc Am. 2006;119(4):2276–2287. doi: 10.1121/1.2167150. [DOI] [PubMed] [Google Scholar]
- Rose MM, Moore BCJ. Perceptual grouping of tone sequences by normally hearing and hearing-impaired listeners. J Acoust Soc Am. 1997;102(3):1768–1778. doi: 10.1121/1.420108. [DOI] [PubMed] [Google Scholar]
- Rose MM, Moore BCJ. The relationship between stream segregation and frequency discrimination in normally hearing and hearing-impaired subjects. Hear Res. 2005;204(1–2):16–28. doi: 10.1016/j.heares.2004.12.004. [DOI] [PubMed] [Google Scholar]
- Singh PG. Perceptual organization of complex-tone sequences: a trade-off between pitch and timbre? J Acoust Soc Am. 1987;82(3):886–899. doi: 10.1121/1.395287. [DOI] [PubMed] [Google Scholar]
- Singh PG, Bregman AS. The influence of different timbre attributes on the perceptual segregation of complex-tone sequences. J Acoust Soc Am. 1997;102(4):1943–1952. doi: 10.1121/1.419688. [DOI] [PubMed] [Google Scholar]
- Stainsby TH, Moore BCJ, Glasberg BR. Auditory streaming based on temporal structure in hearing-impaired listeners. Hear Res. 2004a;192(1–2):119–130. doi: 10.1016/j.heares.2004.02.003. [DOI] [PubMed] [Google Scholar]
- Stainsby TH, Moore BCJ, Medland PJ, Glasberg BR. Sequential streaming and effective level differences due to phase-spectrum manipulations. J Acoust Soc Am. 2004b;115(4):1665–1673. doi: 10.1121/1.1650288. [DOI] [PubMed] [Google Scholar]
- Studebaker GA. A ”rationalized” arcsine transform. J Speech Hear Res. 1985;28(3):455–462. doi: 10.1044/jshr.2803.455. [DOI] [PubMed] [Google Scholar]
- Summers V, Leek M. F0 processing and the separation of competing speech signals by listeners with normal hearing and with hearing loss. J Speech Lang Hear Res. 1998;41:1294–1306. doi: 10.1044/jslhr.4106.1294. [DOI] [PubMed] [Google Scholar]
- Tessier E. PhD thesis. Institut National Polytechnique de Grenoble; France: 2001. Étude de la variabilité de l’indice de localisation pour la caractérisation de sources de parole interférentes. [Google Scholar]
- Thomas IB, Hill PB, Carroll FS, Garcia B. Temporal order in the perception of vowels. J Acoust Soc Am. 1970;48(4):1010–1013. doi: 10.1121/1.1912221. [DOI] [PubMed] [Google Scholar]
- van Noorden LPAS. PhD thesis. Eindhoven University of Technology; 1975. Temporal coherence in the perception of tones sequences. [Google Scholar]
- Vliegen J, Moore BCJ, Oxenham AJ. The role of spectral and periodicity cues in auditory stream segregation, measured using a temporal discrimination task. J Acoust Soc Am. 1999;106(2):938–945. doi: 10.1121/1.427140. [DOI] [PubMed] [Google Scholar]
- Vliegen J, Oxenham AJ. Sequential stream segregation in the absence of spectral cues. J Acoust Soc Am. 1999;105(1):339–346. doi: 10.1121/1.424503. [DOI] [PubMed] [Google Scholar]
- Warren RM, Obusek CJ, Farmer RM, Warren RP. Auditory sequence : Confusion of patterns other than speech or music. Science. 1969;164:586–587. doi: 10.1126/science.164.3879.586. [DOI] [PubMed] [Google Scholar]