

Abstract
OBJECTIVE
Vitamin D has various actions in skeletal muscle. The purpose of this study was to compare lower limb muscle size and strength in hemodialysis (HD) patients being treated with 1,25-dihydroxyvitamin D (calcitriol) or a 1,25-dihydroxyvitamin D analog (paricalcitol) to HD patients who were receiving none.
DESIGN
This was a retrospective cross-sectional study.
SETTING
Outpatient hemodialysis centers.
PATIENTS
HD patients receiving calcitriol or paricalcitol (active vitamin D) for control of secondary hyperparathyroidism (VitD, n = 49) were compared to HD patients who were not (n = 30).
MAIN OUTCOME MEASURES
Cross-sectional areas (CSA) of thigh and tibialis anterior muscles by magnetic resonance imaging (MRI), and three measures of strength; three-repetition maximum (3RM) for knee extension (isotonic), peak torque of knee extensors (isokinetic), and maximal voluntary contraction (MVC) of the ankle dorsiflexor muscles (isometric).
RESULTS
There were no differences in age, weight, dialysis vintage, or intact parathyroid hormone levels between the groups, although serum albumin was higher in the VitD group (p <0.05). Patients in the VitD group had larger thigh muscle CSA (p < 0.05) and were stronger across all strength measures (p< 0.05) after controlling for age and gender (ANCOVA). When all analyses were subsequently adjusted for serum albumin concentration, only the difference in 3RM knee extension strength lost significance. There were no significant differences in any measurements between patients who received calcitriol or paricalcitol.
CONCLUSION
Treatment with active vitamin D was associated with greater muscle size and strength in this cohort of HD patients.
Keywords: active vitamin D, end-stage renal disease, skeletal muscle, strength
Introduction
Muscle wasting and weakness are common in patients with end-stage renal disease (ESRD) [1]. Progressive muscle weakness results in significant limitations to physical functioning [1], which leads to disability, loss of independence and diminished quality of life [2], all of which are associated with increased morbidity and mortality in the ESRD population [3]. Muscle wasting in ESRD has multiple causes including malnutrition, inflammation, uremia, and metabolic disturbances, and likely, vitamin D deficiency [4]. Secondary hyperparathyroidism (SHPT) develops in chronic kidney disease (CKD) and ESRD in response to disruptions in the homeostatic control of parathyroid hormone (PTH) secretion related to alterations in serum phosphorous, calcium (Ca2+), and declining 1,25 dihydroxyvitamin D (1,25 (OH)2D) levels, which occur with diminishing renal function. Although the molecular actions of vitamin D in skeletal muscle are well known, the current focus of vitamin D treatment in ESRD is the prevention and treatment of SHPT and its effects on bone metabolism and tissue calcification, as outlined in the current Kidney Disease Quality Outcomes Initiatives (K/DOQI) guidelines [5].
Vitamin D plays an essential role in muscle growth and development [6] and in regulating muscle contractility [7]. Numerous studies in animals and humans have demonstrated the effects of vitamin D deficiency on various aspects of muscle cell function [8-11]. Vitamin D deficiency is associated with decreased muscle size [12-14] and strength [15, 16], particularly of the large extensor and flexor muscles of the lower limbs [16], essential for functional mobility, and with reduced physical function and increased falls in the elderly [15]. There is evidence that these deficits can be improved by vitamin D supplementation [16].
A few studies have examined the effects of vitamin D treatment on muscle function in patients with ESRD [17-20]. Although collectively these studies provide evidence that treatment with vitamin D may have a positive effect on various aspects of muscle function in patients with ESRD, small sample size, poorly described study designs, and vague descriptions of clinical outcomes related to strength make it difficult to draw any firm conclusions or to generalize the results. The goal of this preliminary investigation was to determine whether vitamin D treatment for SHPT was associated with muscle size and strength or physical performance in patients receiving dialysis therapy.
Methods
Subjects and study design
Subjects in this cross-sectional study were initially recruited into the NEXT (Nandrolone and Exercise Trial) Study [21]. Briefly, men and women undergoing maintenance hemodialysis three times per week at the outpatient dialysis units at San Francisco General Hospital, the UCSF-Mount Zion Medical Center, and the San Francisco VA Medical Center were eligible to participate in the study. Inclusion criteria included adequate dialysis delivery with Kt/V ≥ 1.2 and good compliance with dialysis treatment (i.e., not missing more than two dialysis treatments in the month prior to enrollment). Patients were excluded if they had been on dialysis for less than three months; if they had reasons to be in a catabolic state (including HIV with opportunistic infection in the last three months, malignancy, or infection requiring intravenous antibiotics within two months prior to enrollment); were unable to give informed consent; were active intravenous drug users; or had contraindications to resistance exercise training such as myocardial infarction within six months, active angina, uncompensated congestive heart failure, or orthopedic or musculoskeletal limitations. Informed consent was obtained from all participants, and the study was approved by the Committee on Human Research at the University of California, San Francisco, and the Research & Development Committee of the San Francisco VA Medical Center.
Group Assignment
Subjects were categorized into two groups; those receiving either 1,25 (OH)2D (calcitriol), or an analog (paricalcitol) at the time of baseline assessment, and those who were not.
Clinical Measures
Laboratory results of interest were obtained from the most recent routine monthly laboratory tests from the dialysis units. Serum albumin was measured by dye-binding bromocresol green, except in 17 subjects from the San Francisco VA Medical Center where serum albumin is measured by bromocresol purple and corrected accordingly [22]. In addition, the most recent single-pool Kt/V values were obtained from the patients’ dialysis charts.
Muscle size
Measurement of muscle size was performed on a non-dialysis day. Thigh and tibialis anterior muscle size were measured using magnetic resonance imaging (MRI). Proton T1-weighted axial images of the thigh were acquired at 1.5T (Siemens, Magnetom Vision Systems) using the body coil for the thigh muscles and the extremity coil for the calf muscles (tibialis anterior). The right lower limb was studied except in cases where there was hardware or previous injury that appeared to distort the anatomy of the right limb (one subject). Subjects were studied in a supine position, and the grid for the transverse slices was centered at the midpoint between the kneecap and the femoral head for the thigh images and at the midpoint between kneecap and ankle for the calf images (tibialis anterior compartment). The image parameters were as follows: echo time of 14 ms, field of view equal to 210 mm2, matrix equal to 256 × 256, slice thickness of 8 mm, 15 slices. These parameters were selected to optimize differences in signal intensity between contractile (muscle) and noncontractile (e.g., fat) tissue. Before analysis, the 15 slices were arranged anatomically, and the single slice with the largest muscle area was selected for full analysis. A customized software program written in IDL (Research Systems, Inc., Boulder, CO) allowed for the separate quantification of contractile and noncontractile components of the muscle area as previously described [1]. Each image was analyzed three times, and the average quadriceps, hamstring, and tibialis anterior muscle cross-sectional areas were recorded.
Muscle Strength
Isotonic strength of the knee extensor muscles was measured using ankle weights. A three-repetition maximum (3RM) was determined as the maximum weight that could be lifted three times with good form. 3RM was used rather than 1RM because of concerns about tendon injuries in this population [23].
Isokinetic strength of the knee extensor and flexors was tested using a computerized dynamometer (Cybex Inc, Ronkonkoma, NY). Patients were positioned in the chair, and the knee joint was aligned with the axis of rotation of the dynamometer. Patients performed five maximal knee extension repetitions with the right lower limb at 90°/sec, and fifteen repetitions at both 120 and 180°/sec. The peak torque was recorded at each angular velocity for each limb.
Isometric maximum voluntary contraction (MVC) of the ankle dorsiflexor muscles (tibialis anterior) of the right lower limb was performed with patients in a seated position with the knee fixed at ~ 170° of extension and the foot positioned (ankle angle 120°) against a force transducer. The signal from the force transducer was amplified, converted to digital signal and displayed using Labview Software (National Instruments, Austin, TX). Three MVCs (3-5 sec each) were performed with two minutes rest between contractions. The greatest force from the three MVCs was recorded [1].
Physical Performance
Patients were timed to the nearest hundred of a second while walking 20 feet at their usual pace and as fast as possible. Subjects were also timed while walking up one flight of stairs, while rising from a chair five consecutive times without stopping, and during the timed up and go test, in which the subject rises from a chair, walks three meters, turns around walks back to the chair and sits down. All tests were performed twice, and the best time was recorded.
Physical activity
Physical activity was measured using three-dimensional accelerometers (TriTrac R3D; Professional Products, Inc., Madison, WI) worn for one week [24].
Self-Reported Functioning
Self-reported functioning was measured using the Physical Functioning (PF) score of the Medical Outcomes Study 36-Item Short Form health status questionnaire (SF-36) [25] and the adjusted activity score (AAS) of the Human Activity Profile (HAP) [26]. The questions that make up the PF scale of the SF-36 ask individuals to characterize their degree of limitation in performing 10 activities as not limited at all, limited a little, or limited a lot. The HAP consists of a list of 94 activities, and patients are asked to report whether they still do the activity, no longer do the activity, or never did the activity.
Statistical Analyses
Data are reported as the mean ± standard error of the mean, except for non-normally distributed data which are reported as the median, minimum and maximum. Clinical characteristics of patients receiving either calcitriol or paricalcitol were compared to those who were not receiving a vitamin D preparation by one-way analysis of variance (ANOVA) or Mann-Whitney U tests where appropriate. One-way analyses of covariance (ANCOVA) were used to test for differences between the two groups in muscle size, strength, tests of physical performance, and activity levels. Age and gender, both important determinants of muscle size and strength, were used as covariates. In addition, clinical characteristics found to be distributed unequally between groups, such as serum albumin concentration, diabetes mellitus, and peripheral vascular disease, were also considered as covariates to test for independent effects on the variables of interest. In order to compare the magnitude of the association of vitamin D receipt or non-receipt to the magnitude of the association of age, sex, and serum albumin on muscle size and strength, we also performed multivariable linear regression analysis with muscle size and strength as the outcome variables. Finally, to test whether there were any differences between the group of patients who were receiving calcitriol and the group receiving paricalcitol, ANCOVA was used to compare muscle size, strength, physical performance, physical activity and self-reported functioning; adjusting for age and/or gender as described above. Differences were considered statistically significant if the two-tailed p-value was less than 0.05. Analyses were performed using SPSS 12.0.2 (SPSS Inc., Chicago, IL).
Results
Subject Characteristics
Two hundred and seventy-eight hemodialysis patients were screened for the NEXT study, of which one hundred and sixty were found eligible, out of which seventy-nine men and women agreed to participate [21]. Of those, 49 were receiving intravenous doses of 1,25 (OH)2 vitamin D (calcitriol, n = 26, median dose; 3.0 mcg, min dose; 0.5 mcg – max dose; 9 mcg) or a 1,25 (OH)2 vitamin D analog (paricalcitol, n = 23, median dose; 9 mcg, min dose; 0.5 mcg – max dose; 42 mcg) one to three times weekly. The duration of treatment is not known. The remaining 30 subjects were receiving no vitamin D or vitamin D analog at the time of recruitment, although we have no information as to whether any of these subjects had received any form of active vitamin D at any point previous to recruitment. Subject clinical characteristics are shown in Table 1. There were no statistically significant differences in age, gender, ethnicity or race distribution, comorbidities, dialysis vintage or anthropometric measurements between the two groups. Although the differences were not significant, there were slightly more patients with diabetes in the group not receiving vitamin D and more patients with peripheral vascular disease in the group that was receiving treatment with vitamin D. All subjects dialyzed three times per week and subjects in both groups were well dialyzed [27]. There were no significant differences in standard blood chemistry values including intact PTH levels between the two groups (Table 1). Most subjects were adequately nourished, but the mean serum albumin level was lower (P = 0.04) in those patients who were not receiving any vitamin D (Table 1). As a result, serum albumin level was entered as a covariate in the analyses of the outcomes of interest. Because each subject did not undergo every test, results in tables are accompanied by the number of subjects in each group for whom data are available.
Table 1.
Clinical characteristics of two groups of hemodialysis patients: those receiving active vitamin D (1,25 (OH)2D and those not receiving any form of active vitamin D
| Characteristics | Receiving
1,25 (OH)2 D or analog (n = 49) |
Not Receiving
1,25 (OH)2 D or analog (n = 30) |
P
value |
||
|---|---|---|---|---|---|
| Age, years | 49 | 55 ± 1.8 | 30 | 56 ± 2.5 | 0.83 |
| Gender | 49 | 31 M (63%) / 18 F | 30 | 19 M (63%) / 11 F | 0.99 |
| Race/ethnicity n (%) | 49 | 30 | 0.59 | ||
| African American | 20 (60%) | 17 (58%) | |||
| Filipino | 7 (15%) | 3 (10%) | |||
| Asian | 7 (15%) | 3 (10%) | |||
| Hispanic | 4 (8%) | 5 (16%) | |||
| Caucasian | 1 (2%) | 2 (6%) | |||
| Body Weight kg | 49 | 75.5 ± 3.2 | 30 | 74.6 ± 3.4 | 0.85 |
| BMI, kg/m2 | 49 | 28 ± 1 | 30 | 26 ± 1 | 0.37 |
| Comorbid Conditions n (%) | 49 | 30 | |||
| Hypertension | 45 (93%) | 28 (93%) | 0.80 | ||
| Diabetes Mellitus | 21 (43%) | 18 (58%) | 0.14 | ||
| Coronary Artery Disease | 22 (45%) | 13 (43%) | 0.99 | ||
| Peripheral Vascular Disease | 8 (17%) | 2 (6%) | 0.21 | ||
| Dialysis Vintage, months** | 49 | 25 (3, 288) | 30 | 30 (4, 152) | 0.98 |
| Kt/V | 49 | 1.37 ± 0.04 | 29 | 1.46 ± 0.27 | 0.20 |
| Serum albumin, mg/dL | 49 | 4.00 ± 0.06 | 29 | 3.79 ± 0.09 | 0.04 |
| Hemoglobin g/dL | 49 | 11.9 ± 0.2 | 29 | 11.8 ± 0.3 | 0.95 |
| Serum urea nitrogen, mmol/L (mg/dL) | 49 | 21± 0.7 (59 ± 2.0) | 29 | 22 ± 1.2 (63 ± 3.5) | 0.29 |
| Serum creatinine, μmol/L (mg/dL) | 49 | 887.6 ± 37.7 (10.0 ± 0.4) | 28 | 936.1 ± 48.8 (10.6 ± 0.6) | 0.38 |
| Serum calcium, mmol/L (mg/dL) | 49 | 2.31 ± 0.02 (9.2 ± 0.09) | 29 | 2.27 ± 0.05 (9.1 ± 0.18) | 0.60 |
| Serum phosphorous, mmol/L(mg/dL), | 49 | 1.99 ± 0.11 (6.2 ± 0.3) | 29 | 1.81 ± 0.10 (5.6 ± 0.3) | 0.27 |
| Serum alkaline phosphatase, units/L | 48 | 134 ± 26 | 28 | 115 ± 12 | 0.66 |
| Intact parathyroid hormone, ng/L (pg/ml)** | 43 | 309 (56,1482) | 24 | 230 (37,1435) | 0.26 |
Laboratory results reported in SI units with conventional units in parentheses. Data presented as the mean ± SEM except ** which are reported as the median (minimum,maximum) because of non-normal distribution
Muscle Size
The results of MRI analyses of the thigh and tibialis anterior muscles are shown in Table 2. Both age (P = 0.003) and gender (P = 0.001) were significant predictors of thigh muscle size (Table 3). Nevertheless, total thigh muscle cross-sectional area was greater (P = 0.02) in the group of patients receiving active vitamin D (calcitriol or paricalcitol) after adjusting for both age and gender. There was no significant difference in the size of the tibialis anterior muscle in patients receiving active vitamin D after adjusting for age and gender. Adjustment for serum albumin concentration, diabetes mellitus, or peripheral vascular disease had no significant effect on either thigh or tibialis anterior muscle size.
Table 2.
Comparison of muscle size, strength, physical performance, physical activity, and self-reported physical functioning scores of two groups of hemodialysis patients: those receiving active vitamin D (1,25 (OH)2D or an analog) and those not receiving any form of active vitamin D
| Measure | Receiving1,25 (OH)2 vitamin D or analog (n = 49) | Not Receiving1,25 (OH)2 vitamin D or analog (n = 30) | P value | ||
|---|---|---|---|---|---|
| Muscle Size | |||||
| Thigh Muscle CSA cm2 | 37 | 106.5 ± 5.6 | 25 | 92.9 ± 3.8 | 0.02 |
| Tibialis Anterior Muscle CSA cm2 | 40 | 10.1 ± 0.38 | 26 | 9.1 ± 0.36 | 0.09 |
| Isotonic Strength | |||||
| 3RM Knee Extension lbs | 38 | 19 ± 1 | 26 | 14 ± 1 | 0.09 |
| Isokinetic Strength | |||||
| Knee Extension Peak Torque at 90°/sec N∙m | 43 | 44 ± 4 | 27 | 32 ± 3 | 0.02 |
| Knee Extension Peak Torque at 120°/sec N∙m | 43 | 40 ± 4 | 27 | 29 ± 4 | 0.04 |
| Knee Extension Peak Torque at 180°/sec N∙m | 43 | 28 ± 3 | 27 | 22 ± 2 | 0.11 |
| Isometric Strength | |||||
| Ankle Dorsiflexor MVC N | 31 | 200 ± 66 | 16 | 165 ± 12 | 0.03 |
| Physical Performance | |||||
| Normal Gait Speed cm/sec | 39 | 102.3 ± 4.9 | 22 | 97.3 ± 5.7 | 0.46 |
| Fast Gait Speed cm/sec | 37 | 138.0 ± 6.4 | 22 | 135.7 ± 8.5 | 0.92 |
| Stair Climb sec | 47 | 11.1 ± 1.1 | 24 | 9.1 ± 0.9 | 0.38 |
| Fast Stair Climb sec | 40 | 6.6 ± 0.6 | 22 | 6.1 ± 0.4 | 0.43 |
| Sit-to-Stand 5 times sec | 48 | 17.2 ± 1.4 | 29 | 16.0 ± 1.4 | 0.56 |
| Get-up-and-Go sec | 48 | 12.5 ± 1.3 | 28 | 13.5 ± 1.4 | 0.69 |
| Physical Activity | |||||
| Daily Activity: Accelerometry, arb. units | 38 | 61,907 ± 7,051 | 26 | 71,766 ± 16,461 | 0.54 |
| Self-Reported Functioning | |||||
| SF-36 PF Questionnaire | 43 | 53 ± 4 | 30 | 51 ± 5 | 0.83 |
| HAP Questionnaire AAS | 44 | 50 ± 3 | 30 | 40 ± 4 | 0.047 |
Data reported as mean ± SEM. Abbreviations: CSA, cross-sectional Area; 3RM, three-repetition maximum; MVC, maximal voluntary contraction; N·m, newton-meters; N, newtons; SF-36 PF; Medical Outcomes Study 36-Item Short Form health status questionnaire physical function score, HAP AAS; Human Activity Profile adjusted activity score
Table 3.
Independent predictors of thigh muscle size and strength by multivariate linear regression
| Multivariate Models | Independent Predictors | β | Adj.R2 | CI 95% | P Value | |
|---|---|---|---|---|---|---|
| Lower | Upper | |||||
| Thigh Muscle CSA | 0.38 | <0.0001 | ||||
| Gender | 27.3 | 14.94 | 39.66 | <0.0001 | ||
| Age, per 10 years | -7.8 | -1.24 | -0.30 | 0.001 | ||
| Vitamin D | 14.6 | 2.50 | 26.64 | 0.02 | ||
| Knee Extension 1RM | 0.28 | <0.0001 | ||||
| Gender | 6.9 | 3.19 | 10.67 | 0.000 | ||
| Albumin | 4.2 | 0.73 | 7.68 | 0.02 | ||
| Vitamin D | 3.0 | -0.56 | 6.75 | 0.09 | ||
| Peak Torque Knee Extensors 90°/sec | 0.33 | <0.0001 | ||||
| Gender | 19.6 | 10.05 | 29.23 | 0.000 | ||
| Age, per 10 years | -4.6 | - 0.80 | -0.12 | 0.009 | ||
| Vitamin D | 10. 9 | 1.59 | 20.19 | 0.022 | ||
| MVC Ankle Dorsiflexor Muscles | 0.21 | 0.004 | ||||
| Gender | 64.4 | 24.99 | 103.80 | 0.002 | ||
| Age, per 10 years | 8.6 | - 2.35 | 0.62 | 0.25 | ||
| Vitamin D | 36.9 | 1.97 | 71.82 | 0.03 | ||
Abbreviations: 1RM; one-repetition maximum, MVC; maximal voluntary contraction, PVD; peripheral vascular disease
Muscle Strength Measures
Patients receiving active vitamin D were stronger in nearly all strength measures compared to patients who were not receiving any form of vitamin D (Table 2). Further, the differences remained significant after adjusting for the effects of age and gender (Table 3). Patients receiving active vitamin D had greater mean strength of the knee extensors (P = 0.04) after adjusting for age (P = 0.05) and gender (P = 0.001). However, when serum albumin level (P = 0.02) was added to the ANCOVA model, both the effects of age (P = 0.06) and vitamin D group (P = 0.09) became non-significant (Table 3). Addition of diabetes mellitus or peripheral vascular disease did not substantively alter the results (data not shown).
In the case of isokinetic strength, patients receiving active vitamin D produced greater peak torque in knee extension (Table 2) at angular velocities of 90°/second (P = 0.02) and 120°/second (P = 0.04) after adjusting for age and gender (Table 3). There was no significant effect at 180°/second (P = 0.11) (Table 2). There was no effect of adjustment for serum albumin level, diabetes mellitus, or peripheral vascular disease on any measure of isokinetic strength.
Patients receiving active vitamin D produced greater isometric force during MVC of the ankle dorsiflexors (P = 0.03) (Table 2) after controlling for the effect of gender. There were no effects of adjustment for age or serum albumin on isometric strength of the ankle dorsiflexors (Table 3).
Physical Performance, Physical Activity, and Self-Reported Functioning Measures
There were no differences in any of the physical performance tests between patients who were receiving active vitamin D and those who were not (Table 2). Similarly, there were no significant differences in daily physical activity level measured by accelerometry, or differences in self reported functioning on the PF scale of the SF-36 (Table 2). However, self-reported functioning was reported to be modestly better on the AAS of the HAP questionnaire by subjects who were receiving active vitamin D (P = 0.05) compared to those who were not, after adjusting for age. There was no effect of either gender or serum albumin or selected comorbidities.
Multivariable Linear Regression
Examination of linear regression models including the same predictor variables selected in ANCOVA (Table X) shows that, in general, the magnitude of the vitamin D association is not as great as the effect of gender. However, the vitamin D association is comparable to or greater than that of serum albumin concentration or 10 years of age, depending on the specific strength or size variable.
Comparisons between Active Vitamin D Derivatives
To determine whether there was evidence for a differential effect of paricalcitol on muscle size or function, patients receiving paricalcitol were compared to those receiving calcitriol. There were no differences in thigh muscle CSA or tibialis anterior muscle CSA between patients who were receiving calcitriol or paricalcitol. Further there were no differences in any of the strength, physical performance, physical activity or self-reported functioning measures (Table 4)
Table 4.
Muscle size, strength, physical performance, physical activity, and self-reported physical functioning scores for patients receiving treatment with either 1,25 (OH)2D (calcitriol) or the analog paricalcitol
| Measure | Receiving calcitriol (n = 26) | Receiving paricalcitol (n = 23) | P value | ||
|---|---|---|---|---|---|
| Muscle Size | |||||
| Thigh Muscle CSA cm2 | 21 | 92.2 ± 5.7 | 16 | 119.3 ± 4 | 0.69 |
| Tibialis Anterior Muscle CSA cm2 | 25 | 9.7 ± 0.5 | 16 | 10.7 ± 0.6 | 0.88 |
| Isotonic Strength | |||||
| 3RM Knee Extension lbs | 17 | 18 ± 2 | 21 | 19 ± 2 | 0.49 |
| Isokinetic Strength | |||||
| Knee Extension Peak Torque at 90°/sec N·m | 22 | 40.09 ± 5.28 | 21 | 46.57 ± 5.78 | 0.27 |
| Knee Extension Peak Torque at 120°/sec N·m | 22 | 36.86 ± 5.45 | 21 | 40.90 ± 5.32 | 0.11 |
| Knee Extension Peak Torque at 180°/sec N·m | 22 | 26.18 ± 3.99 | 21 | 28.81 ± 4.15 | 0.16 |
| Isometric Strength | |||||
| Ankle Dorsiflexor MVC N | 16 | 195 ± 16 | 14 | 208 ± 20 | 0.68 |
| Physical Performance | |||||
| Normal Gait Speed cm/sec | 25 | 94.1 ± 7.6 | 23 | 108.3 ± 6.1 | 0.73 |
| Fast Gait Speed cm/sec | 24 | 127.4 ± 9.8 | 22 | 147.6 ± 8.0 | 0.96 |
| Stair Climb sec | 25 | 12.9 ± 1.8 | 22 | 10.0 ± 1.3 | 0.74 |
| Fast Stair Climb sec | 21 | 7.8 ± 1.0 | 18 | 5.2 ± 0.4 | 0.15 |
| Sit-to-Stand 5 times sec | 25 | 19.5 ± 2.1 | 23 | 15.1 ± 1.7 | 0.82 |
| Get-up-and-Go sec | 25 | 14.7 ± 2.3 | 23 | 10.4 ± 1.0 | 0.97 |
| Physical Activity | |||||
| Daily Activity: Accelerometry, arb. units | 21 | 55,872 ± 10,311 | 17 | 66,597 ± 9,751 | 0.92 |
| Self-Reported Functioning | |||||
| SF-36 PF Questionnaire | 22 | 45 ± 6 | 21 | 61 ± 6 | 0.16 |
| HAP Questionnaire | 24 | 56 ± 4 | 20 | 52 ± 5 | 0.70 |
Data are mean ± SEM. Abbreviations: CSA, cross-sectional Area; 3RM, three-repetition maximum; MVC, maximal voluntary contraction; N·m, Newton-meters; N, newtons; SF-36 PF; Medical Outcomes Study 36-Item Short Form health status questionnaire physical function score, HAP AAS; Human Activity Profile adjusted activity score
Discussion
The results of the present study suggest that hemodialysis patients who receive active vitamin D treatment (calcitriol or the analog paricalcitol) for the control of SHPT have larger muscle size and increased strength compared to similar patients on hemodialysis not receiving active vitamin D. Patients receiving active vitamin D were stronger across two different muscle groups and several types of strength measures including isotonic, isokinetic and isometric strength, and had larger thigh muscle cross-sectional area. This is not completely unexpected since vitamin D plays essential roles in regulating muscle contractility [7] and muscle growth [6]. Renal failure results in abnormalities in vitamin D metabolism due to the decline in proximal tubular production of 1α-hydroxylase. This results in marked declines in circulating levels of 1,25(OH)2D. Studies in humans show that vitamin D deficiency is associated with muscle weakness and atrophy [16, 28, 29]. At the cellular level, vitamin D deficiency impairs intracellular calcium kinetics and muscle cell contractility [8, 9], mitochondrial metabolism [10, 11] and protein synthesis [12, 13]. Treatment with vitamin D corrects these impairments [14, 30] as well as restoring strength and improving balance in vitamin D deficient humans [16, 29, 31]. Despite the fact that vitamin D deficiency is associated with muscle loss [12, 13] and weakness [16, 28, 29], which may contribute to the significant muscle atrophy, weakness, and widespread disability experienced by patients with ESRD, the current focus of vitamin D treatment for the control of SHPT, as outlined in the current K/DOQI guidelines [5], is on measuring its effects on bone metabolism and tissue calcification.
A few studies have examined the effects of vitamin D treatment on muscle and muscle function in patients with ESRD [17-20]. Although the sample sizes of these studies are quite small (n = 8 to 27), collectively they lend support to our observation that ESRD patients who receive treatment with active vitamin D for the treatment of SHPT have larger muscle size and greater strength. Other studies have examined the effects of vitamin D in muscle from a metabolic perspective. Skeletal muscle is the major site of insulin-stimulated glucose uptake and the primary tissue involved in insulin resistance. Insulin resistance is a common feature of ESRD, and an independent predictor of cardiovascular death in hemodialysis patients [32]. However, treatment with 1,25 dihydroxyvitamin D significantly improves insulin sensitivity in severely insulin resistant hemodialysis patients [33] and has been shown to be independently associated with reduced risks for cardiovascular [34] and all-cause death [35] in the hemodialysis population. Taken together, these studies suggest that vitamin D may have multiple effects in skeletal muscle, regulating processes that contribute to muscle anabolism, metabolism, and function, with far reaching effects on survival.
Although we hypothesized that patients who were receiving active vitamin D would have better physical performance due to the greater strength of the knee extensor and ankle dorsiflexor muscles, there were no significant differences between the two groups in any of the physical performance tests. This may be due to the large degree of inter-subject variability in the measurements. Low muscle strength is often associated with poorer physical function in the elderly [36], a population similar to the ESRD population with regard to comorbidity and disability rates. However, a large population-based study of performance-based measures of muscle function in the elderly revealed that subjective health and psychological factors explain a significantly larger proportion of the variability in the complex measures of gait speed and timed chair stands than direct measures of strength [37]. Further, in hemodialysis patients, there is evidence that at least one additional dialysis-related factor, dialysis adequacy (Kt/V), is also an important determinant of physical performance [38], and other factors such as fluid volume status, anemia, inflammation and chronic fatigue may have effects as well. So it is possible that variability due to these and other unmeasured subjective health and psychological factors prevented discrimination between the groups in the performance measures of the present study.
There are several limitations to this study. First, this was a retrospective cross-sectional analysis. From the available data we sought only to determine whether there were differences in thigh muscle size, strength, or in physical performance measures between patients who were receiving any dose of active vitamin D at the time of testing and those who were not. Therefore, a causal relationship cannot be established. Second, we do not know the specific reasons for the decisions to treat or not treat individual patients with vitamin D. We generally assume that these ESRD patients were being treated with active vitamin D for secondary hyperparathyroidism. However, PTH level is not the only determining factor for the decision to treat or not treat with active vitamin D. Calcium and phosphorous levels were similar between the groups, but nevertheless hypercalcemia and hyperphosphatemia are possible reasons for the non-use of active vitamin treatment. In addition, we have no information as to whether patients who were not receiving active vitamin D at the time of testing had previously received treatment, nor do we know the duration of active vitamin D treatment for any of the patients who were receiving treatment at the time of testing. Also, we did not measure circulating levels of 1,25(OH)2D, due in large part to the limitations of assays to accurately measure the levels of 1,25(OH)2D analogs. However, it is likely that most patients not receiving treatment with active vitamin D for SHPT were 1,25(OH)2D deficient. In general, serum levels of 1,25(OH)2D decrease as renal mass declines, with serum concentrations of 1,25(OH)2D reported to be positively correlated with GFR [39] and creatinine clearance [40-42]. Nevertheless, we acknowledge that variability in extrarenal 1,25(OH)2D production make it impossible to assume that 1,25(OH)2D deficiency is present in every ESRD patient not treated with active vitamin D. However, potential misclassifications from inclusion of patients recently treated with vitamin D derivatives and patients who may not be vitamin D deficient in the non-vitamin D-receiving group would tend to minimize rather than accentuate associations between active vitamin D treatment and muscle strength and size.
Although there are reports that other 1,25 (OH)2D analogs may have selectively different actions in cultured skeletal muscle cells there is no published information specific to the actions of paricalcitol in skeletal muscle. Nevertheless, we compared muscle size, muscle strength, and physical performance measures among patients who were receiving active vitamin D treatment, and found no significant differences between patients who were receiving calcitriol compared to those receiving paricalcitol. Though, we cannot rule out the possibility that paricalcitol could have selectively-altered actions in skeletal muscle, we had little statistical power to address this question in the present study.
Although the results of this study must be considered preliminary, the consistency of the relationship among active vitamin D treatment, muscle size and multiple measures of strength lends support to the association. While a causal relationship cannot be established based on our results, our observations have biological plausibility. Disability due to low physical functioning is widespread and contributes greatly to diminished quality of life in patients with ESRD. Treatment with active vitamin D was associated with greater muscle size and strength in this cohort of HD patients, suggesting that vitamin D may play a role in the preservation of muscle size and strength in this population.
Figure 1. Difference in Thigh Muscle Cross-sectional Area (CSA).
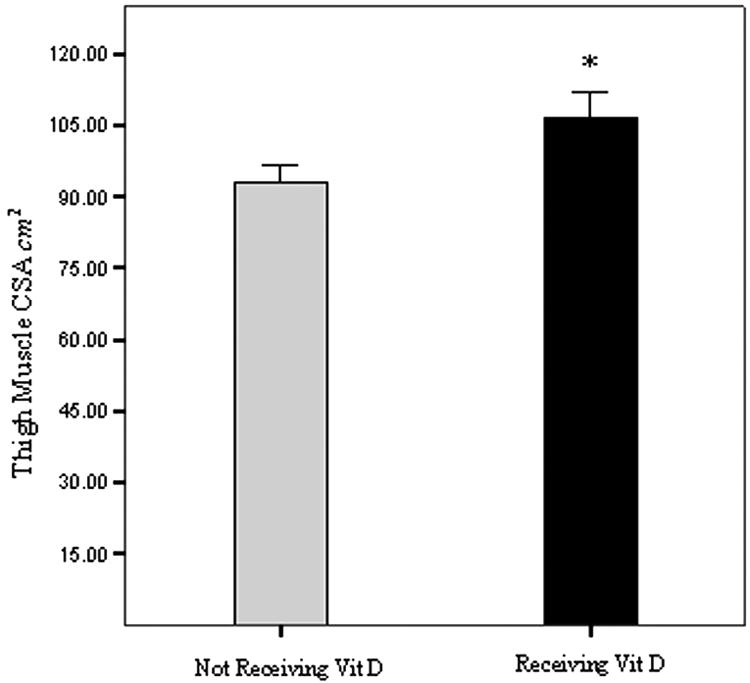
Bars represent thigh muscle CSA in cm2, measured by magnetic resonance imaging. Subjects were categorized into two groups; those receiving either 1,25 (OH)2D (calcitriol), or an analog (paricalcitol) (black bar), and those who were not (light bar) at the time of baseline assessment of the NEXT study [21]. Statistical significance is * P<0.05 by ANCOVA, after adjusting for age and gender. Error bars represent the SEM.
Figure 2. Differences in Isokinetic Strength of Knee Extensors.
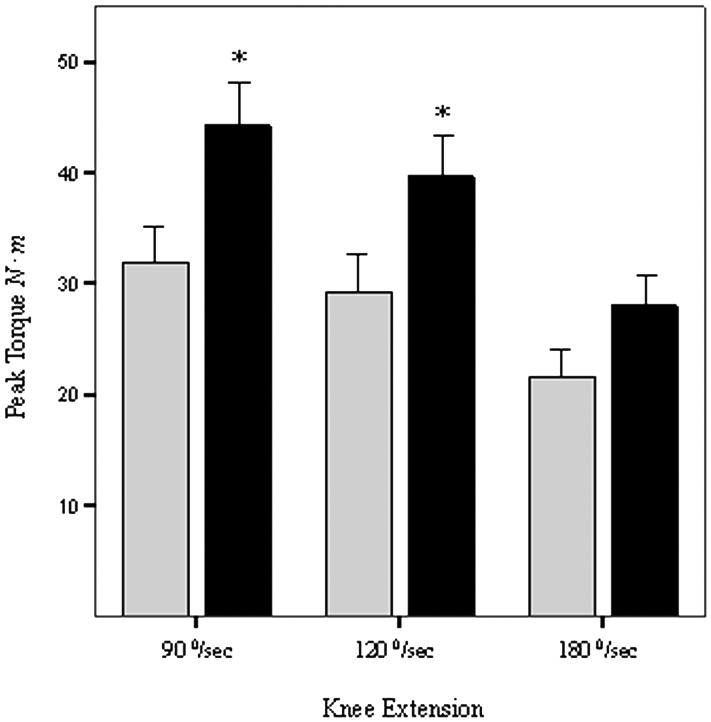
Bars represent peak torque at 90, 120, and 180°/sec knee extension angular velocities measured in Newton meters (N ∙ m) by computerized dynamometry (Cybex Inc, Ronkonkoma, NY). Subjects were categorized into two groups; those receiving either 1,25 (OH)2D (calcitriol), or an analog (paricalcitol) (black bars), and those who were not (light bars) at the time of baseline assessment of the NEXT study [21]. Statistical significance is * P<0.05 by ANCOVA, after adjusting for age and gender. Error bars represent the SEM.
Acknowledgments
We are grateful for the kind and valuable cooperation of the patient volunteers who made this study possible. We thank the staff of the SFVAMC, Mt Zion, and SFGH dialysis centers and the staff of the General Clinical Research Center at SFGH for their help. Results were presented, in part, at the American Society of Nephrology Meeting in St. Louis, MO in October, 2004. This project was supported by a grant from NIH/NIDDK (R01-DK56182)
Acknowledgment of Research Support: This project was supported by a grant from NIH/NIDDK (R01-DK56182). This work was done at the San Francisco VA Medical Center, 4150 Clement Street, San Francisco, 94221, and University of California, San Francisco
Footnotes
Publisher's Disclaimer: This is a PDF file of an unedited manuscript that has been accepted for publication. As a service to our customers we are providing this early version of the manuscript. The manuscript will undergo copyediting, typesetting, and review of the resulting proof before it is published in its final citable form. Please note that during the production process errors may be discovered which could affect the content, and all legal disclaimers that apply to the journal pertain.
References
- 1.Johansen KL, Shubert T, Doyle J, et al. Muscle atrophy in patients receiving hemodialysis: Effects on muscle strength, muscle quality, and physical function. Kidney Int. 2003;63:291–297. doi: 10.1046/j.1523-1755.2003.00704.x. [DOI] [PubMed] [Google Scholar]
- 2.Churchill DN, Torrance GW, Taylor DW, et al. Measurement of quality of life in end-stage renal disease: the time trade-off approach. Clin Invest Med. 1987;10:14–20. [PubMed] [Google Scholar]
- 3.DeOreo P. Hemodialysis patient-assessed functional status predicts continued survival, hospitalization and dialysis-attendance compliance. Am J Kidney Dis. 1997;30:204–212. doi: 10.1016/s0272-6386(97)90053-6. [DOI] [PubMed] [Google Scholar]
- 4.McElroy A, Silver M, Morrow L, Heafner BK. Proximal and distal muscle weakness in patients receiving hemodialysis for chronic uremia. Phys Ther. 1970;50:1467–1481. doi: 10.1093/ptj/50.10.1467. [DOI] [PubMed] [Google Scholar]
- 5.Eknoyan G, Levin A, Levin N. Bone metabolism and disease in chronic kidney disease. Am J Kidney Dis. 2003;42:1–201. [PubMed] [Google Scholar]
- 6.Endo I, Inoue D, Mitsui T, et al. Deletion of vitamin D receptor gene in mice results in abnormal skeletal muscle development with deregulated expression of myoregulatory transcription factors. Endocrinology. 2003;144:5138–5144. doi: 10.1210/en.2003-0502. [DOI] [PubMed] [Google Scholar]
- 7.Vasquez G, Boland R, De Boland A. Stimulation of Ca2+ release-activated Ca2+ channels as a potential mechanism involved in non-genomic 1,25(OH)2-vitamin D3-induced CA2+ entry in skeletal muscle cells. Biochem Biophys Res Commun. 1997;239:562–565. doi: 10.1006/bbrc.1997.7501. [DOI] [PubMed] [Google Scholar]
- 8.Curry OB, JF B, Francis MJO, Smith R. Calcium uptake by sarcoplasmic reticulum of muscle from vitamin D deficient rabbits. Nature. 1974;249:83–84. doi: 10.1038/249083a0. [DOI] [PubMed] [Google Scholar]
- 9.Rodman JS, Baker T. Changes in the kinetics of muscle contraction in vitamin-D depleted rats. Kidney Int. 1978;13:189–193. doi: 10.1038/ki.1978.28. [DOI] [PubMed] [Google Scholar]
- 10.Sjostrom M, Lorentzon R, Larsson SE, Holmlund D. The influence of 1,25-dihydroxycholecalciferol on the ultrastructural organization of skeletal muscle fibres. Morphometric analysis on vitamin D deficient growing rats. Med Biol. 1978;56:209–215. [PubMed] [Google Scholar]
- 11.Mukkerjee A, Zerwekk JE, Nicar MJ, Mac Coy K, Buja LM. Effect of chronic vitamin D deficiency on chick heart mitochondria. J Mol Cell Cardiol. 1981;13:171–183. doi: 10.1016/0022-2828(81)90214-5. [DOI] [PubMed] [Google Scholar]
- 12.Stroder J, Arensmeyer E. Actomyosin content of the skeletal muscles in experimental rickets. Klin Wochenschr. 1965;43:1201–1202. doi: 10.1007/BF01746181. [DOI] [PubMed] [Google Scholar]
- 13.Wassner SJ, Li JB, Sperduto A, Norman ME. Vitamin D deficiency, hypocalcemia, and increased skeletal muscle degradation in Rats. J Clin Invest. 1983;72:102–112. doi: 10.1172/JCI110947. [DOI] [PMC free article] [PubMed] [Google Scholar]
- 14.Harter HR, Birge SJ, Martin KJ, Klahr S, Karl IE. Effects of vitamin D metabolites on protein catabolism of muscle from uremic rats. Kidney Int. 1983;23:465–472. doi: 10.1038/ki.1983.43. [DOI] [PubMed] [Google Scholar]
- 15.Mowe M, Haug E, Bohmer T. Low serum calcidol concentration in older adults with reduced muscular function. J Am Geriatr Soc. 1999;47:220–226. doi: 10.1111/j.1532-5415.1999.tb04581.x. [DOI] [PubMed] [Google Scholar]
- 16.Glerup H, Mikkelsen K, Poulsen L, et al. Hypovitaminosis D myopathy without biochemical signs of osteomalacic bone involvement. Calcif Tissue Int. 2000;66:419–424. doi: 10.1007/s002230010085. [DOI] [PubMed] [Google Scholar]
- 17.Henderson RG, Ledingham JGG, Oliver DO, et al. Effects of 1,25-dihydroxycholecalciferol on calcium absorption, muscle weakness and bone disease in chronic renal failure. Lancet. 1974:379–384. doi: 10.1016/s0140-6736(74)93149-3. [DOI] [PubMed] [Google Scholar]
- 18.Wanic-Kossowska M, Grzegorzewska A, Plotast H, Bombicki K. Does calcitriol therapy improve muscle function in uremic patients? Perit Dial Int. 1996;16(Suppl 1):S305–S308. [PubMed] [Google Scholar]
- 19.Gomez-Fernandez P, Sanches Agudo L, Calatrava JM. Chronic kidney insufficiency and respiratory muscle function. Changes induced by treatment with 1,25(OH)2D3. Medical Clinics (Barc) 1990;94:204–207. [PubMed] [Google Scholar]
- 20.Bertoli M, Luisetto G, Arcuti V, Urso M. Uremic myopathy and calcitriol therapy in CAPD patients. ASAIO Trans. 1991;37:M397–398. [PubMed] [Google Scholar]
- 21.Johansen KL, Painter PL, Sakkas GK, et al. Effects of resistance training and nandrolone decanoate on body composition and muscle function among patients who receive hemodialysis: A randomized, controlled trial. J Am Soc Nephrol. 17:2307–2314. 2006. doi: 10.1681/ASN.2006010034. [DOI] [PubMed] [Google Scholar]
- 22.McGinley J, Payne R. Serum Albumin by dye-binding bromocresol green or bromocresol purple? The case for conservatism. Ann Clin Biochem. 1988;25:417–421. doi: 10.1177/000456328802500417. [DOI] [PubMed] [Google Scholar]
- 23.Jones N, Kjellstrand CM. Spontaneous tendon ruptures in patients on chronic dialysis. Am J Kidney Dis. 1996;28:861–866. doi: 10.1016/s0272-6386(96)90386-8. [DOI] [PubMed] [Google Scholar]
- 24.Johansen KL, Chertow GM, Ng A, et al. Physical activity levels in patients on hemodialysis and healthy sedentary controls. Kidney Int. 2000;57:2564–2570. doi: 10.1046/j.1523-1755.2000.00116.x. [DOI] [PubMed] [Google Scholar]
- 25.Ware J, Kosinski M, Keller SD. SF-36 Physical and Mental Health Summary Scales: a User’s Manual. Boston, MA: Health Insitute; 1994. [Google Scholar]
- 26.Fix A, Daughton D. Human Activity Profile (HAP) Manual. Odessa, FL: Psychological Assessment Resources Inc; 1986. [Google Scholar]
- 27.NKF-K/DOQI: Clinical practice guidelines for hemodialysis adequacy: update 2000. Am J Kidney Dis. 2001;37:S7–S64. doi: 10.1016/s0272-6386(01)70005-4. [DOI] [PubMed] [Google Scholar]
- 28.Bischoff HA, Stahelin HB, Urscheler N, et al. Muscle strength in the elderly: Its relation to vitamin D metabolites. Arch Phys Med Rehabil. 1999;80:54–58. doi: 10.1016/s0003-9993(99)90307-6. [DOI] [PubMed] [Google Scholar]
- 29.Verhaar HJJ, Samson MM, Jansen PAF, et al. Muscle strength, functional mobility and vitamin D in older women. Aging Clin Exper Res. 2000;12:455–460. doi: 10.1007/BF03339877. [DOI] [PubMed] [Google Scholar]
- 30.De Boland AR, Albornoz LE, Boland R. The effects of cholecalciferol in vivo on proteins and lipids of skeletal muscle from rachitic chicks. Calcif Tissue Int. 1983;35:798–805. doi: 10.1007/BF02405126. [DOI] [PubMed] [Google Scholar]
- 31.Young A, Brenton DP, Edwards RHT. Analysis of muscle weakness in osteomalacia. Clin Sci Mol Med. 1978;54:31. doi: 10.1042/cs0540463. [DOI] [PubMed] [Google Scholar]
- 32.Shinohara K, Shoji T, Emoto M, et al. Insulin Resistance as an Independent Predictor of Cardiovascular Mortality in Patients with End-Stage Renal Disease. J Am Soc Nephrol. 2002;13:1894–1900. doi: 10.1097/01.asn.0000019900.87535.43. [DOI] [PubMed] [Google Scholar]
- 33.Kautsky-Willer A, Pacini G, Barnas U, et al. Intravenous calcitriol normalizes insulin sensitivity in uremic patients. Kidney Int. 1995;47:200–206. doi: 10.1038/ki.1995.24. [DOI] [PubMed] [Google Scholar]
- 34.Shoji T, Shinohara K, Kimoto E, et al. Lower risk for cardiovascular mortality in oral 1{alpha}-hydroxy vitamin D3 users in a haemodialysis population. Nephrol Dial Transplant. 2004;19:179–184. doi: 10.1093/ndt/gfg513. [DOI] [PubMed] [Google Scholar]
- 35.Teng M, Wolf M, Ofsthun MN, et al. Activated Injectable Vitamin D and Hemodialysis Survival: A Historical Cohort Study. J Am Soc Nephrol. 2005;16:1115–1125. doi: 10.1681/ASN.2004070573. [DOI] [PubMed] [Google Scholar]
- 36.Visser M, Deeg DJH, Lips P, Harris TB, Lex MB. Skeletal muscle mass and muscle strength in relation to lower-extremity performance in older men and women. J Am Geriatr Soc. 2000;48:381–386. doi: 10.1111/j.1532-5415.2000.tb04694.x. [DOI] [PubMed] [Google Scholar]
- 37.Hirsch CH, Fried LP, Harris T, et al. Correlates of performance-based measures of muscle function in the elderly: the Cardiovascular Health Study. J Gerontol A Biol Sci Med Sci. 1997;52:M192–200. doi: 10.1093/gerona/52a.4.m192. [DOI] [PubMed] [Google Scholar]
- 38.Johansen KL, Chertow GM, da Silva M, Carey S, Painter PL. Determinants of physical performance in ambulatory patients on hemodialysis. Kidney Int. 2001;60:1586–1591. doi: 10.1046/j.1523-1755.2001.00972.x. [DOI] [PubMed] [Google Scholar]
- 39.St John A, Thomas MB, Davies CP, et al. Determinants of intact parathyroid hormone and free 1,25 dihydroxyvitamin D levels in mild and moderate renal failure. Nephron. 1992;61:422–427. doi: 10.1159/000186960. [DOI] [PubMed] [Google Scholar]
- 40.Pitts TO, Piraino BH, Mitro R, et al. Hyperparathyroidism and 1,25-dihydroxyvitamin D deficiency in mild, moderate and severe renal failure. J Clin Endocrinol Metab. 1988;67:876–881. doi: 10.1210/jcem-67-5-876. [DOI] [PubMed] [Google Scholar]
- 41.Koenig KG, Lindberg JS, Zerwekh JE, et al. Free and total 1,25-dihydroxyvitamin D levels in subjects with renal disease. Kidney Int. 1992;41:161–165. doi: 10.1038/ki.1992.22. [DOI] [PubMed] [Google Scholar]
- 42.Ishimura E, Nishizawa Y, Inaba M, et al. Serum levels of 1,25-dihydroxyvitamin D, 24,25-dihydroxyvitamin D, and 25-hydroxyvitamin D in nondialyzed patients with chronic renal failure. Kidney Int. 1999;55:1019–1027. doi: 10.1046/j.1523-1755.1999.0550031019.x. [DOI] [PubMed] [Google Scholar]