Abstract
Fumonisins (FNs) are ubiquitous contaminants of cereal grains. Fumonisin B1 (FB1) was linked to several animal and human diseases. To validate FB1 biomarkers for studying human disease risks, F344 rats were administered by gavage with either a single dose of 0, 10 or 25 mg FB1/kg body weight (BW) or repeated doses of 0, 1.0, or 2.5 mg FB1/kg BW/day for 5 weeks. FB1 excretion and FB1-induced metabolic alterations of sphingolipids in rat urine, feces, and serum were assessed. Dose-dependent urinary and fecal excretion of free FB1 was found in both single-dose- and repeat-dose-treated rats. In the single-dose study, urinary sphinganine (Sa) to sphingosine (So) ratio (Sa/So) reached a maximum at day 7 for the high-dose group and at day 5 for the low-dose group, whereas serum Sa/So showed only marginal changes. In the repeat-dose study, urinary Sa/So was persistently elevated at 2 weeks, while serum Sa/So was unchanged. Time-course changes of sphinganine 1-phosphate (SaP) and sphingosine 1-phosphate (SoP) were also examined. Although serum Sa/So and SaP/SoP ratios showed no signs of time- or dose-dependent changes, a 10-fold increase in urinary SaP/SoP was observed, suggesting that urinary SaP/SoP is a more sensitive biomarker for FB1 exposure. The accumulation of SaP and SoP was evident in the time-course of SaP/Sa and SoP/So, which may reflect activity changes of enzymes closely related to the metabolism and catabolism of SaP and SoP. These results provide concrete evidence towards the practical use of excreted FB1, Sa/So, and SaP/SoP as biomarkers of exposure to FNs.
Keywords: Validation, biomarkers, fumonisin B1 (FB1), sphinganine, sphingosine, sphinganine 1-phosphate, sphingosine 1-phosphate, F344 rats
Introduction
Fumonisins (FNs), produced mainly by Fusarium verticillioides, are ubiquitous contaminants of cereal grains around the world (Marasas, 1996; WHO, 2000). At least 15 FNs have been isolated, characterized, and designated as fumonisin A, B, C, and P, although only fumonisin B1 (FB1) and B2 (FB2) appear to be biologically significant. FB1, the representative mycotoxin, causes several fatal animal diseases, including leukoencephalomalacia in horses, pulmonary edema in swine, and hepatotoxicity in horses, swine and rats (WHO, 2000). FB1 has been found to induce renal tube adenomas and carcinomas in male F344 rats and hepatocellular carcinomas in female B6C3F1 mice (Howard et al., 2001; Gelderblom et al., 2002). It is also a potent tumor promoter in rats after initiation with diethylnitrosamine and aflatoxin B1 (Gelderblom et al., 1996). Etiological roles of exposure to FNs through ingestion of moldy corn in human esophageal and liver cancers, as well as neural tube defects, have been suggested by several studies in South Africa, China, and the Texas-Mexico border (Marasas et al., 1988; Sydenham et al., 1990; Chu and Li, 1994; Yoshizawa et al., 1994; Ueno et al., 1997; Missmer et al., 2006).
Given the toxicity of FNs in animals and potential worldwide human exposure, the development, validation and application of biomarkers have been a priority for research on these toxins (Turner et al., 1999; WHO, 2000). Toxicokinetic data showed that orally dosed FB1 was eliminated rapidly from circulation (WHO, 2000). This rapid elimination and low bioavailability, as well as the lack of a major metabolite, indicate that direct measurement of FB1 in biological fluids may be a possible biomarker for studying short-term exposure. To that end, efforts have been made on monitoring free FNs in human urine (Shetty and Bhat, 1998), plasma (Shephard et al., 1992a), feces (Chelule et al., 2001) and hair (Sewram et al., 2003).
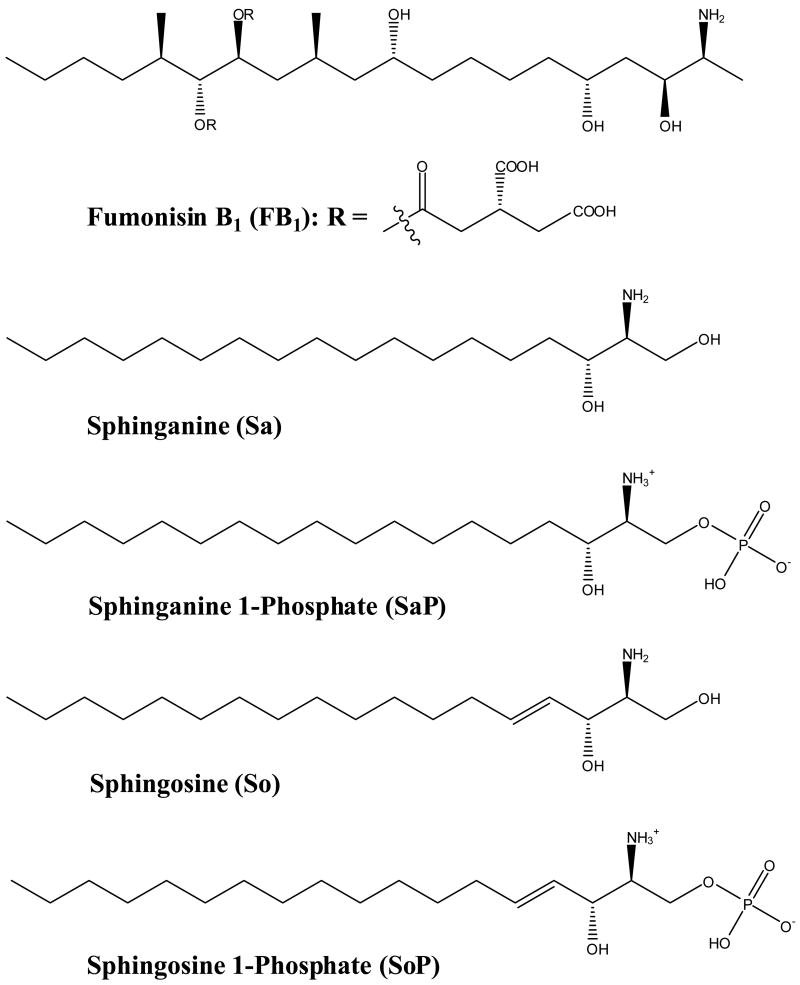
FNs disrupt sphingolipid metabolism by inhibition of sphinganine (sphingosine) N-acetyltransferase due to their structural similarity to long-chain sphingoid base backbones (Fig. 1) (Wang et al., 1991; Merrill et al., 1993). FB1 causes an increase in intracellular free sphinganine (Sa) and, to a lesser extent, sphingosine (So) which precedes the depletion of complex bioactive lipids (Riley et al., 2001; Ogretmen and Hannun, 2004). The FB1-induced biochemical alterations, particularly elevated Sa levels and Sa to So or Sa 1-phosphate to So 1-phosphate ratios in tissues, urine and blood, have been proposed as potential biomarkers in various animal species including foals (Wang et al., 1992), pigs (Riley et al., 1993), mink (Morgan et al., 1997), rats (Wang et al., 1999), vervet monkeys (van der Westhuizen et al., 2001a), and ducks (Tran et al., 2006). Several studies have also been carried out to explore the potential of the Sa/So biomarker for human dietary exposure to FNs (van der Westhuizen et al., 1999; Abnet et al., 2001; Qiu and Liu, 2001; Solfrizzo et al., 2004; Missmer et al., 2006).
Fig. 1.
Chemical structure of FB1 and the major sphingolipid metabolites affected.
Biomarkers are measurements of the changes that occur in response to an insult, and are indicators of exposure, effects, or susceptibility. Ideally, putative biomarkers are validated in pilot animal studies where sensitivity, specificity, accuracy, and reliability parameters can be established. Data obtained in animal studies can be used to assess intra- or inter-individual variability, background levels, relationship of biomarkers to external dose or to disease status, as well as feasibility for use in large population-based human studies (Rothman et al., 1995; Groopman and Kensler, 1999). To date, few biomarkers have been rigorously validated using this entire process. In this study, we tentatively validated the putative FN biomarkers, especially urinary and serum Sa/So and SaP/SoP as well as free FB1 urine and feces in F344 rats exposed to FB1.
Materials and methods
Chemicals
Boric acid, o-phthaldialdehyde (OPA), 2-mercaptoethanol, FB1 from Fusarium moniliforme (~98%, TLC), D-erythro-sphinganine (Sa), D-erythro-sphingosine (So), 10 × phosphate buffered saline (PBS), ammonium hydroxide, ammonium sulfate, sodium chloride, sodium phosphate monobasic, hydrochloric acid, HPLC-grade ammonium formate, and formic acid were purchased from Sigma-Aldrich (St. Louis, MO, USA). D-erythro-C17-sphinganine 1-phosphate (C17SaP), D-erythro-sphinganine 1-phosphate (SaP), D-erythro-sphingosine 1-phosphate (SoP) and D-erythro-C20-sphingosine (C20So) were obtained from Avanti Polar Lipids, Inc. (Alabaster, AL, USA). Other HPLC-grade solvents including water, methanol, 2-propanol, acetonitrile, and ethyl acetate were from Honeywell Burdick & Jackson (Muskegon, MI, USA). OPA reagents were prepared by dissolving 10 mg of OPA and 30 μL of 2-mercaptoethanol in 250 μL of methanol and mixing with 4.75 mL of 3% boric acid buffer (pH 10.5).
Animals and treatment protocols
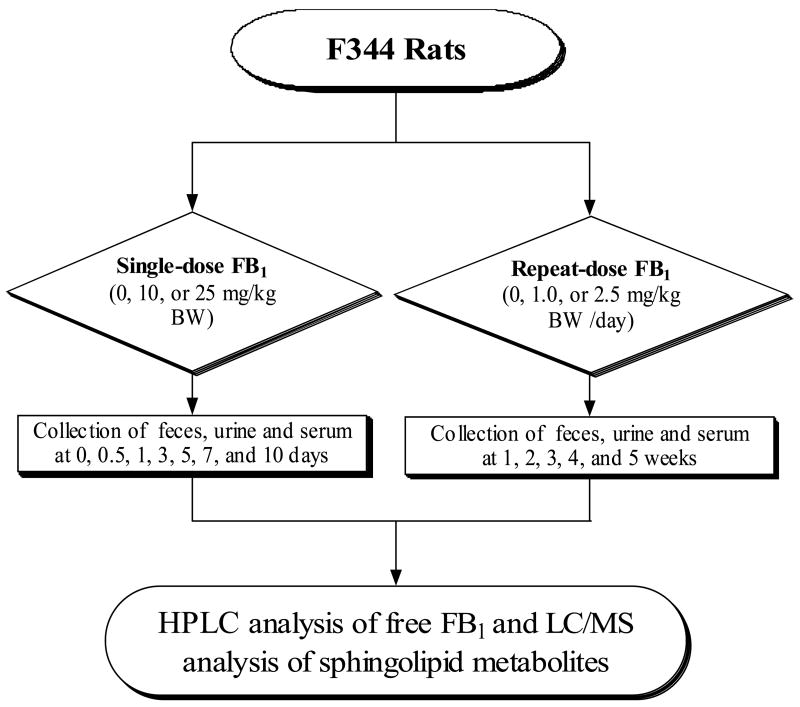
Male F344 rats (5-week age; Body weight (BW) = 100 ± 20 g) were purchased from Charles River Laboratories International, Inc. (Wilmington, MA, USA), and were acclimated for one week prior to the experiment. After randomly assigned to groups, they were maintained under constant environmental conditions (temperature = 24 ± 1 °C, relative humidity = 55 ± 5%, ventilation frequency = 18 times/h, and 12-h light/dark cycle). Rats were housed individually in stainless-steel cages. Prolab RMH 2500 rodent diet (PharmaServ, Framingham, MA, USA) and deionized water were provided ad libitum. When necessary, rats were transferred to Nalgene metabolic cage systems (Rochester, NY, USA) for collecting urine and feces. All studies were approved by the Animal Care and Use Committee of Texas Tech University. The overall experimental design for the study is depicted in Fig. 2. Briefly, for the single-dose protocol, rats (3 to 6 per group) received a single oral dose of FB1 in saline of 0 (control), 10, or 25 mg/kg BW. For the repeat-dose protocol, FB1 was freshly prepared in saline before dosing and rats were administered daily by gavage FB1 at 0.0 (control), 1.0, or 2.5 mg/kg BW 5 days per week. Fecal, urine, and blood samples were collected at different time points. All specimens were stored at −80 °C until analysis.
Fig. 2.
Experimental design for the validation of sphingolipid metabolites as FB1 biomarkers in F344 rats.
Measurement of urinary creatinine
Creatinine in rat urine was analyzed using the Sigma 555-A kit (St. Louis, MO, USA). The analysis is based on a modified Jaffe colorimetric method that measures the difference in absorbance (500 nm) of the creatinine-picrate complex before and after acidification. The assay was carried out according to manufacturer’s instructions, and absorbance was measured using a DU-640 spectrophotometer from Beckman Coulter, Inc. (Fullerton, CA, USA).
Extraction of FB1 from rat feces, urine, and serum
Approximately 1.0 g of homogenous feces was vortexed with 10 mL of water. A portion of the supernatant (3.0 mL) was loaded onto an Oasis MAX cartridge (Waters Co., Milford, MA, USA) preconditioned with 3 mL of methanol and 3 mL of water. The solid-phase extraction cartridge was sequentially washed with 1 mL of 2% aqueous ammonium hydroxide and 3 mL of 75% aqueous methanol. FB1 fractions were eluted with 3×0.6 mL of 2% formic acid in methanol. For urine and serum, homogenized samples (200 μL) were incubated with 200 μL of saturated ammonium sulfate for 15 min at 4 °C, and centrifuged at 15000×g for 10 min. Supernatants were diluted with 10 mL of water and loaded onto a FumoniTest immunoaffinity column (VICAM, Watertown, MA, USA) by gravity. After washing with 10 mL of 1× PBS, FB1 fractions were eluted with 3×0.5 mL of 20% methanol in 10 mM hydrochloric acid directly onto a primed Oasis HLB cartridge (Waters Co.). The HLB cartridge was sequentially washed with 2 mL of water and 2 mL of 30% aqueous methanol, and then eluted with 3×0.6 mL of 2% formic acid in methanol. Finally, eluents containing FB1 fractions from feces, urine, and serum were evaporated to dryness under a stream of ultra-high-purity nitrogen at 35 °C. Dry residues were reconstituted with 200 μL of 50% aqueous methanol and 50 μL of OPA reagent prior to HPLC analysis.
Extraction of sphingolipid metabolites
In glass tubes equipped with Teflon-lined screw caps, the extraction began with 100 μL of homogenous rat serum, or urinary pellets harvested from 0.5 mL of homogenized rat urine via centrifugation at 1500×g for 10 min. The extraction procedure followed a reported method with modifications (Bielawski et al., 2006). Briefly, 500 μL of 1×PBS (pH 7.4), 100 μL of formic acid, and 3 mL of ethyl acetate/2-propanol (85/15, v/v) plus 20 μL of internal standard (7.5 μM of C17SaP and C20So) were added to each sample. Samples were sonicated for 60 s at room temperature, tightly capped and vortexed at 500 rpm for 40 min. To facilitate phase separation, samples were centrifuged at 1500×g for 10 min. Portions of the upper phase were transferred to fresh glass tubes and evaporated to dryness at 35 °C using an N-EVAP from Organomation Associates Inc. (Berlin, MA, USA). Dry residues were reconstituted in 400 μL of 50% aqueous acetonitrile before liquid chromatography/mass spectrometry (LC/MS) analysis.
HPLC analysis of FB1
Briefly, FB1 was analyzed on an Agilent 1100 liquid chromatography system equipped with an on-line degasser, a quaternary gradient pump, an automatic injector, a fluorescence detector, and a ChemStation data system (Agilent Technologies, Wilmington, DE, USA). Chromatographic separations were performed on a Zorbax Eclipse XDB-C18 (5 μm particle size, 150×4.6 mm, Agilent Technologies) which was maintained at 35 °C. The mobile phase consisted of a linear gradient starting from 0.1 M sodium phosphate monobasic (pH 3.4)-methanol (35/65, v/v) to 0.1 M sodium phosphate monobasic (pH 3.4)-methanol (20/80, v/v) over 13 min. The flow rate was 1.0 mL/min and injection volume was 100 μL. The fluorescent derivative of FB1 was monitored at excitation and for emission wavelengths of 330 nm and 440 nm, respectively. The limit of quantitation for the HPLC method was 20 pg per injection of FB1. The mean recovery rate of FB1 was 93.9 ± 0.7% for feces, and 62.0 ± 0.5% for urine and serum.
LC/MS analysis of sphingolipid metabolites
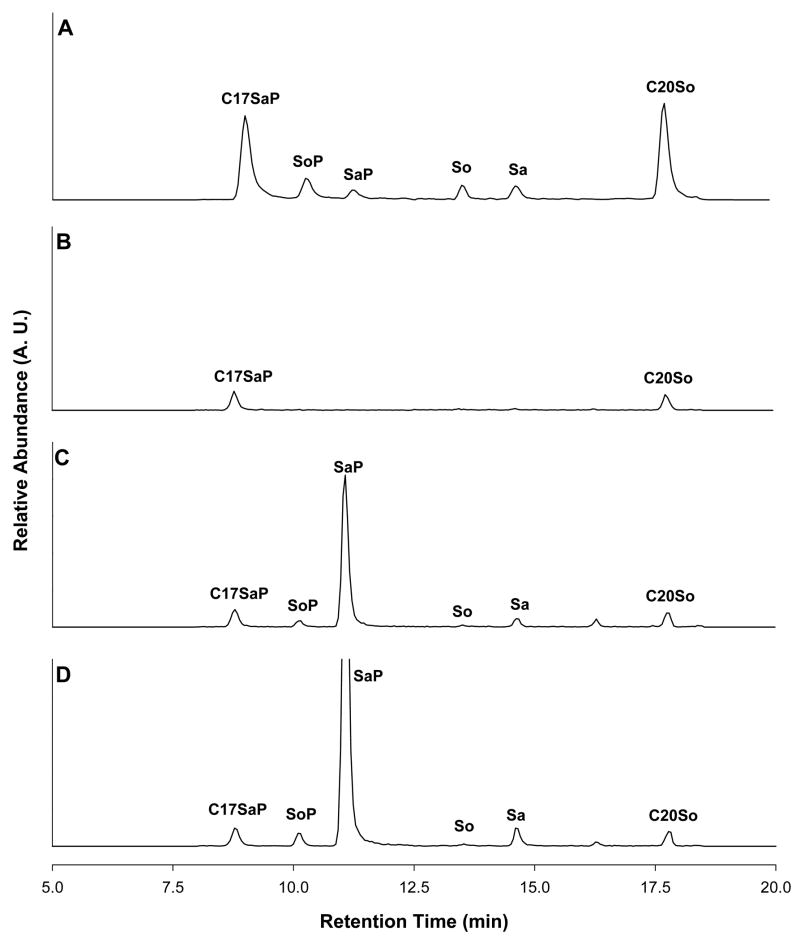
Sphingolipid metabolites and internal standards were resolved on a Thermo Electron Surveyor LC system (San Jose, CA, USA) comprising a Surveyor MS pump, a Surveyor autosampler, and a Finnigan Xcalibur 1.3 data system. Chromatographic separations (Fig. 3) were performed in a BetaBasic C18 column (150 mm × 2.1 mm, 5 μm particle size, Thermo Electron) maintained at 30 °C. The mobile phase consisted of a linear gradient starting from 10 mM ammonium formate-formic acid-acetonitrile (50:0.01:50, v/v) to 125 mM ammonium formate-formic acid-acetonitrile (4:0.01:96, v/v) in 15 min with a 10-min equilibration between each injection. The flow rate was 200 μL/min and injection volume was 20 μL. During 8 to 20 min in each chromatographic run, the column effluent was delivered to a Thermal Electron LCQ Advantage ion trap mass spectrometer through a 6-port divert valve. The MS detector was operated in positive electrospray ionization mode with an inlet capillary temperature of 200 °C and source voltage of 3.5 kv. Both the sheath gas and the auxiliary gas were nitrogen set to 34 and 9 units, respectively. Mass fragments were scanned in selected ion monitoring mode at m/z of 368, 380, 382, 300, 302, and 328 for C17SaP, SoP, SaP, So, Sa, and C20So, respectively. SaP and SoP were quantified according to standard curves using the relative areas of the unknown versus the C17SaP internal standard, while So and Sa were quantified according to standard curves using the relative areas of the unknown versus the C20So internal standard. Typical mean retention times were 8.90 min, 10.20 min, 11.30 min, 13.60 min, 14.50 min, and 17.80 min for C17SaP, SoP, SaP, So, Sa, and C20So, respectively. Limits of detection of the LC/MS method were 0.2 pmol per injection for each analyte.
Fig. 3.
Representative LC/MS total ion chromatograms of a standard (A) containing C17SaP, SoP, SaP, So, Sa, and C20So (5 pmol injection each analyte), and urine extracts from a control rat (B), rats receiving 1.0 (C) and 2.5 (D) mg/kg BW/day of FB1.
Data analysis
Urinary levels of free FB1 and sphingolipid metabolites were normalized to urinary creatinine excretion; and all ratios were expressed on a molar basis. Unless indicated otherwise, all values are expressed as means ± SE. Statistical analysis was done using a SPSS 14.0 software package (SPSS Inc., Chicago, IL, USA). One-way ANOVA was used, followed by LSD or Games-Howell test for post hoc multiple comparisons. Independent-samples T-test or Mann-Whitney U test was used for two-group comparison. Spearman correlation coefficients were calculated to evaluate the association between pairs of variables. All tests were two-sided and the difference among means were considered significant if P < 0.05.
Results
Time-course changes of free FB1 in feces, urine, and serum of F344 rats
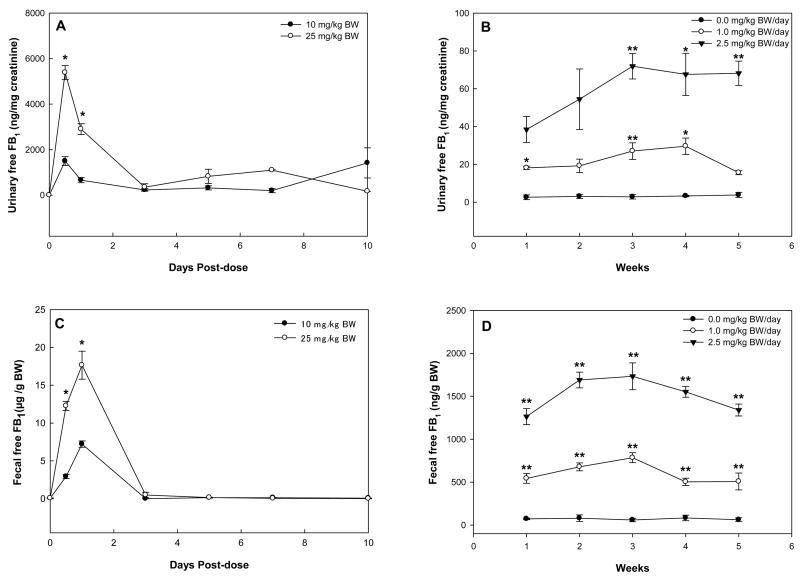
In rats treated with a single dose of FB1, the urinary level of free FB1 reached a maximum at 12 h, rapidly decreased thereafter, and remained at low levels until day 10 (Fig. 4A). In rats treated with repeat-dose of FB1, urinary excretion of free FB1 was significantly elevated in both 1.0 and 2.5 mg/kg BW groups as compared to controls (Fig. 4B). Apparent dose-response elevation of free FB1 was observed in urine samples of rats treated with 2.5 mg/kg BW. In rats treated with a single dose of FB1, the fecal level of FB1 began to increase at 12 h, reached a maximum at day 1, and decreased thereafter for both treatment groups (Fig. 4C). No free FB1 was detectable after day 3 for both treatment groups. In rats treated with repeat-dose of FB1, the fecal excretion of FB1 was dose-dependently elevated in both treated groups as compared to controls (Fig. 4D), which had similar patterns to the urinary excretion (Fig. 4B). In the repeat-dose study, there was a significant correlation between urinary levels of free FB1 and fecal levels of FB1 for all time points and doses (r = 0.89, P<0.001). In contrast with the urinary and fecal excretions, no detectable levels of free FB1 were found in rat serum in both single-and repeat-dose studies.
Fig. 4.
Urinary levels of free FB1 in rats receiving a single-dose (A) or repeat-dose (B) of FB1, and fecal levels of free FB1 in rats receiving a single-dose (C) or repeat-dose (D) of FB1. Asterisks indicate time points where the results were significantly different from the low-dose group in the single-dose study or the control group in the repeat-dose study (* and ** for P<0.05 and P<0.01, respectively).
Time-course changes in urinary Sa/So and SaP/SoP in F344 rats treated with single-dose FB1
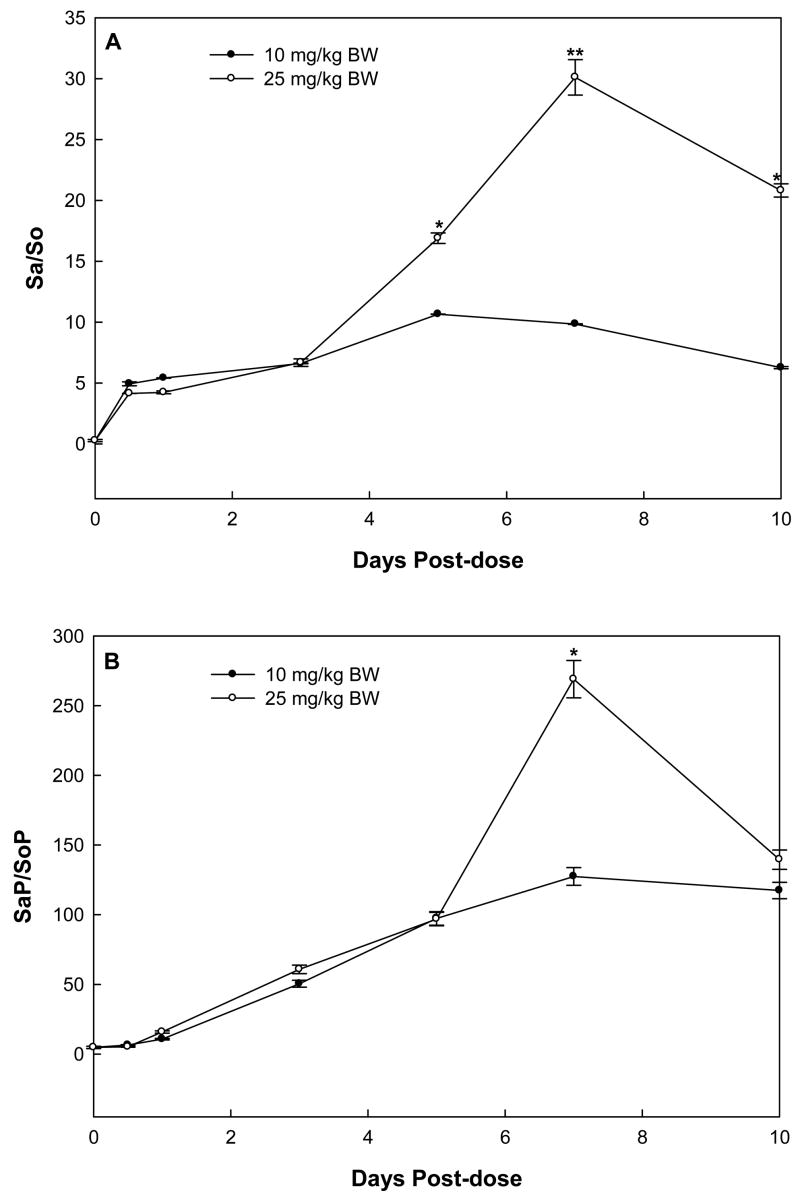
In rats treated with a single dose of 10 (low-dose group) and 25 mg FB1/kg BW (high-dose group), urinary Sa/So began to increase at 12 hours after administration, continually increased, reached a maximum at day 5 and 7, respectively, and decreased thereafter (Fig. 5A). The urinary Sa/So of rats in the high-dose group was significantly higher than that of the low-dose group at days 5, 7, and 10 (P<0.05, 0.01 and 0.05, respectively).
Fig. 5.
Urinary ratios of Sa/So (A) and SaP/SoP (B) in rats receiving single-dose of 10 or 25 mg/kg BW FB1. The asterisks (* and **) indicate time points where the results of 25 and 10 mg/kg BW doses were significantly different (P<0.05 and P<0.01, respectively).
Interestingly, the time-course of urinary SaP/SoP followed similar patterns as that of Sa/So (Fig. 5B), however, the SaP/SoP in the low dose group reached a maximum at day 7 instead of day 5 for Sa/So. The maximal urinary SaP/SoP in rats treated with high-dose FB1 was significantly higher than that of the low-dose group (269.00 ± 13. 40 vs. 127.48 ± 6.39 in three rats, P<0.05). At day 7 post-dosing, urinary SaP/SoP ratios were more than 7- and 10-fold higher than the urinary Sa/So ratios in high- and low-dose groups, respectively.
Time-course changes in serum Sa/So and SaP/SoP in F344 rats treated with single-dose FB1
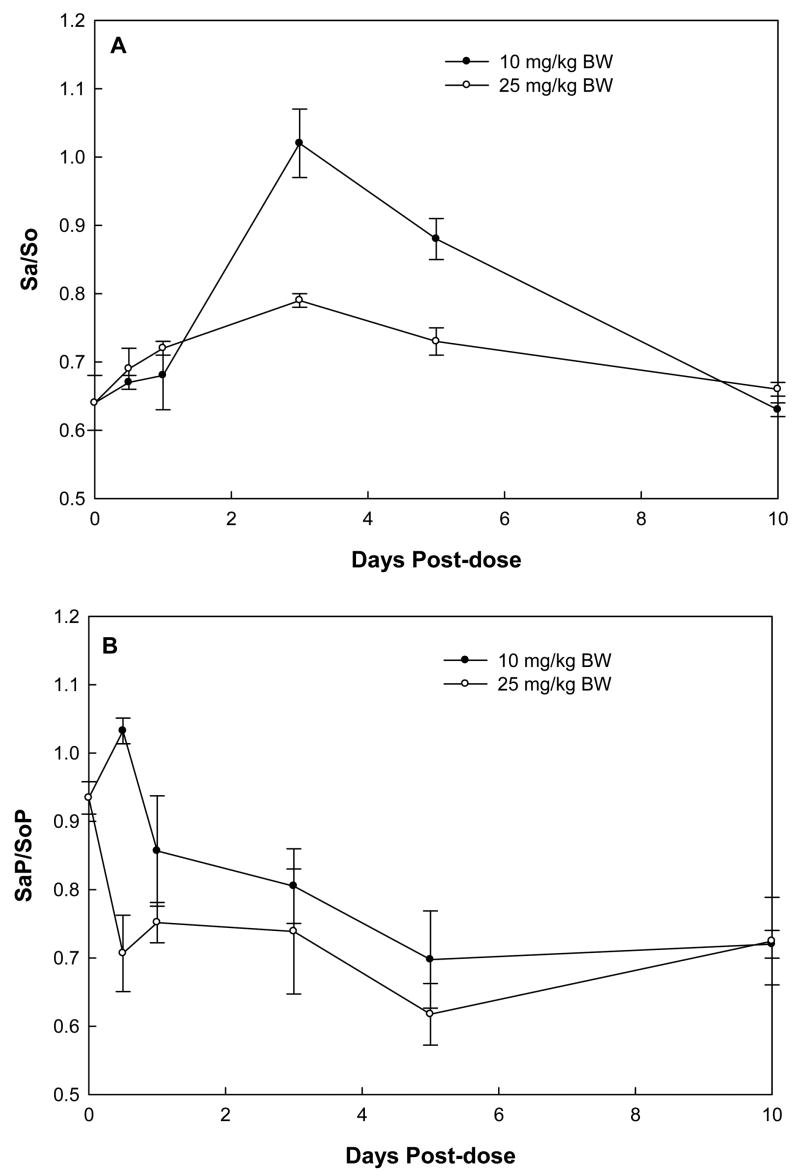
The time course of serum Sa/So was different from that of urinary Sa/So. In both treatment groups, serum Sa/So began to increase at 12 hours, continually increased, reached a maximum at day 3, and decreased thereafter (Fig. 6A). There was no significant difference between the maximum serum Sa/So in rats treated with high- and low-dose FB1. In contrast, the time-course of serum SaP/SoP was rather erratic and showed no significant difference between groups (Fig. 6B). In addition, serum Sa/So or SaP/SoP had much narrower dynamic ranges compared to urinary ratios.
Fig. 6.
Serum ratios of Sa/So (A) and SaP/SoP (B) in rats receiving single-dose of 10 or 25 mg/kg BW FB1.
Time-course changes in urinary Sa/So, SaP/SoP, SaP/Sa and SoP/So in F344 rats treated with repeat-dose FB1
Rats treated with daily doses of 1.0 mg FB1/kg BW (low-dose group) or 2.5 mg FB1/kg BW (high-dose group) showed marked increases in urinary SaP and Sa, and to a lesser extent urinary SoP and So levels. Levels in control rats remained virtually unchanged during the 5-week study period (data not shown).
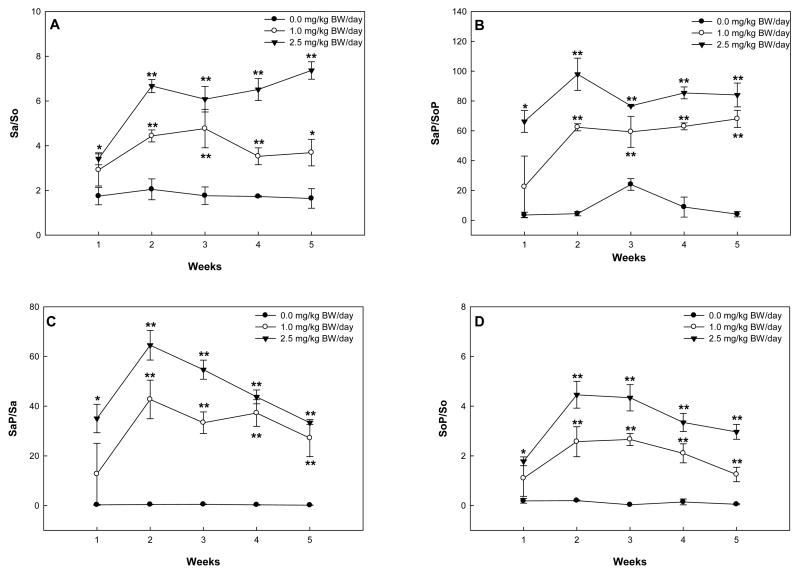
The urinary Sa/So in rats of the low-dose group reached a maximum (4.77 ± 0.86) at week 3, and decreased thereafter (Fig. 7A). In the high-dose group, the urinary Sa/So in rats increased rapidly to 6.67 ± 0.50 in the first two weeks, and remained steady thereafter (Fig. 7A). The high-dose group had significantly higher urinary Sa/So at week 5 than the low-dose group (7.36 ± 0.39 vs. 3.69 ± 0.59 in three rats, P<0.05).
Fig. 7.
Urinary ratios of Sa/So (A), SaP/SoP (B), SaP/Sa (C), and SoP/So (D) in rats receiving repeat-dose of 0.0, 1.0, or 2.5 mg/kg BW/day FB1. The asterisks (* and **) indicate time points where the results were significantly different from the control group with P<0.05 and P<0.01, respectively.
The urinary SaP/SoP in rats from the low-dose group increased to more than 50 in the first two weeks and kept at plateau thereafter (Fig. 7B). In the high-dose group, the urinary SaP/SoP in rats increased to more than 90 in the first two weeks, dropped to a level comparable to the first week by week 3 (76.69 ± 0.23), and remained steady thereafter. Compared to the control group, the treatment groups had significantly higher urinary SaP/SoP at week 3 and week 5 (P<0.01).
SaP/Sa (Fig. 7C) and SoP/So (Fig. 7D) illustrated the time-course of conversion rates of sphingoid bases to sphingoid base 1-phosphates during FB1 treatment. In the treatment groups, both ratios increased to a maximum at week 2 and decreased thereafter while these ratios in control rats remained essentially constant. The maximal SaP/Sa was significantly higher than the maximal SoP/So in the high-dose group (64.51 ± 5.94 vs. 4.46 ± 0.54 in three rats, P<0.01)
Time course changes in serum Sa/So, SaP/SoP, SaP/Sa and SoP/So in F344 rats treated with repeat-dose FB1
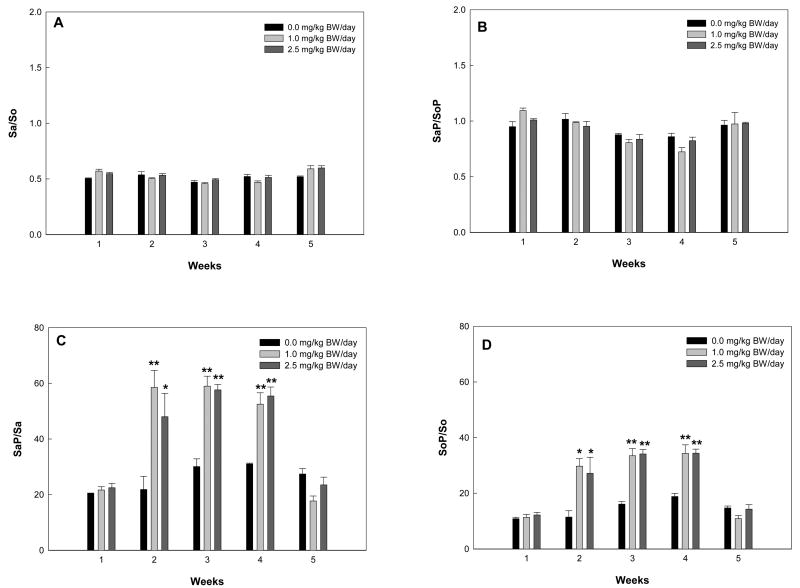
Time-course plots of serum Sa, So, SaP, and SoP did not show a clear pattern (data not shown). Serum Sa/So and SaP/SoP in repeated-dose rats fluctuated during the 5-week study period and demonstrated no significant difference between groups at each time point (Figs. 8A and 8B). Surprisingly, data for SaP/Sa and SoP/So in treatment groups showed that higher ratios of SaP/Sa or SoP/So were maintained from week 2 to week 4 compared to week 1 or 5, although there was no significant difference between low- and high-dose groups (Figs. 8C and 8D). SaP/Sa was roughly two-fold higher than SoP/So during week 2 to week 4.
Fig. 8.
Serum ratios of Sa/So (A), SaP/SoP (B), SaP/Sa (C), and SoP/So (D) in rats receiving repeat-dose of 0.0, 1.0 or 2.5 mg/kg BW/day FB1. The asterisks (* and **) indicate time points where the results were significantly different from the control group with P<0.05 and P<0.01, respectively.
Correlation analysis between FB1 excretion and sphingolipid metabolites
No statistically significant correlations were found between free FB1 excretion and sphingolipid metabolites in the single-dose study (data not shown). However, in the repeat-dose study, statistically significant positive correlations were found between urinary FB1 excretion and urinary levels of Sa, So, SaP, SoP, Sa/So, and SaP/SoP. Furthermore, as shown in Table 1, fecal FB1 illustrated better correlations with these urinary sphingolipid metabolites. In contrast, only serum Sa/So showed significant positive correlation with free FB1 excretion in urine (r = 0.46, P = 0.001) or feces (r = 0.36, P = 0.014).
Table 1.
Correlation analysis between FB1 excretion and sphingolipid metabolites in the repeat-dose study*
| Sphingolipid metabolites | Correlation coefficient (P value)
|
|
|---|---|---|
| Urinary free FB1 | Fecal free FB1 | |
| In urine | ||
| Sa | 0.78 (<0.001) | 0.82 (<0.001) |
| So | 0.69 (<0.001) | 0.74 (<0.001) |
| SaP | 0.80 (<0.001) | 0.87 (<0.001) |
| SoP | 0.82 (<0.001) | 0.86 (<0.001) |
| Sa/So | 0.80 (<0.001) | 0.84 (<0.001) |
| SaP/SoP | 0.77 (<0.001) | 0.81 (<0.001) |
| In serum | ||
| Sa | −0.17 (0.268) | −0.32 (0.035) |
| So | −0.21 (0.158) | −0.36 (0.014) |
| SaP | −0.22 (0.148) | −0.32 (0.031) |
| SoP | −0.30 (0.042) | −0.32 (0.033) |
| Sa/So | 0.46 (0.001) | 0.36 (0.014) |
| SaP/SoP | −0.01 (0.966) | −0.20 (0.198) |
n = 45
Discussion
Animal studies have shown that FB1 is poorly absorbed when dosed orally, rapidly eliminated from circulation, and recovered largely unmetabolized in feces (Shephard et al., 1994b; Shephard et al., 1994c; Martinez-Larranaga et al., 1999). However, there is evidence that at least three decomposition products, namely two partially and one fully hydrolysed forms could be present in feces, urine, or blood (Shephard et al., 1994c; Jackson et al., 1996). Results of this study demonstrated that fecal free FB1 levels reached a maximum at day 1; no appreciable amounts were recovered after 3 days in F344 rats receiving a single-dose of FB1. Our finding is somewhat different from the previous finding in non-human primates orally treated with a single dose of 7.5 mg/kg BW FB2, which showed free FB2 excretion reached a maximum around day 5 in feces (Shephard and Snijman, 1999). It is uncertain if the results obtained in rats can be extrapolated to larger animals, since FNs are rapidly eliminated from rats and mice while elimination in humans is believed to be slower (Delongchamp and Young, 2001). On the other hand, our results indicated persistent amounts of 24-h fecal FB1 were recovered in rats receiving multi-dose FB1, which was dose-dependent as well. To our best knowledge, this is the first time-course study of fecal FB1 excretion in experimental animals receiving multi-dose FB1. Regardless of the poor bioavailability of FB1 as evidenced in several toxicokinetic studies (Prelusky et al., 1994; Shephard et al., 1994a; Prelusky et al., 1995), FB1 in human feces has been detected and proposed as a short-term biomarker of exposure (Chelule et al., 2000; Chelule et al., 2001).
Results of this study also showed that urinary free FB1 in single-dosed rats reached a maximum at 12 h and trace excretion was recorded 10 days post-dosing, while in the repeat-dose study the pattern was very similar to that of fecal excretion of free FB1. The dose-dependent excretion of fecal and urinary free FB1 in rats treated with a repeated-dose of FB1 suggested that low-level chronic exposure to dietary FB1 could be mirrored by measurement of urinary and fecal free FB1 levels, and therefore, strengthened the fact that fecal and urinary free FB1 could be short-term biomarkers of exposure in the rodent model. Free fecal and urinary FB1 may also reflect long-term exposure at a constant daily FB1 intake level as low as 1.0 mg/kg BW in rats as found by our study.
Our study failed to detect any appreciable free FB1 in rat serum. There are at least three reasons for this observation. First, in the single-dose study our serum samples were collected 12 h post-dose, while several toxicokinetic studies have shown the elimination half-life of FB1 in plasma as less than 4 h and bioavailability of FB1 as less than 5% in rats orally treated with FB1 (Shephard et al., 1992b; Martinez-Larranaga et al., 1999). Secondly, in the multi-dose study, serum FB1 levels may be below the limit of detection of the method, even in the high-dose group (2.5 mg/kg BW/day), which agrees with a recent study showing that serum FB1 could only be detected in high-dose group rats fed a diet containing 88.6 μg/g of FNs (64.5% of FB1 by weight) (Riley and Voss, 2006). Thirdly, a majority of absorbed FB1 might bind to serum lipids or proteins, making them undetectable as the free form.
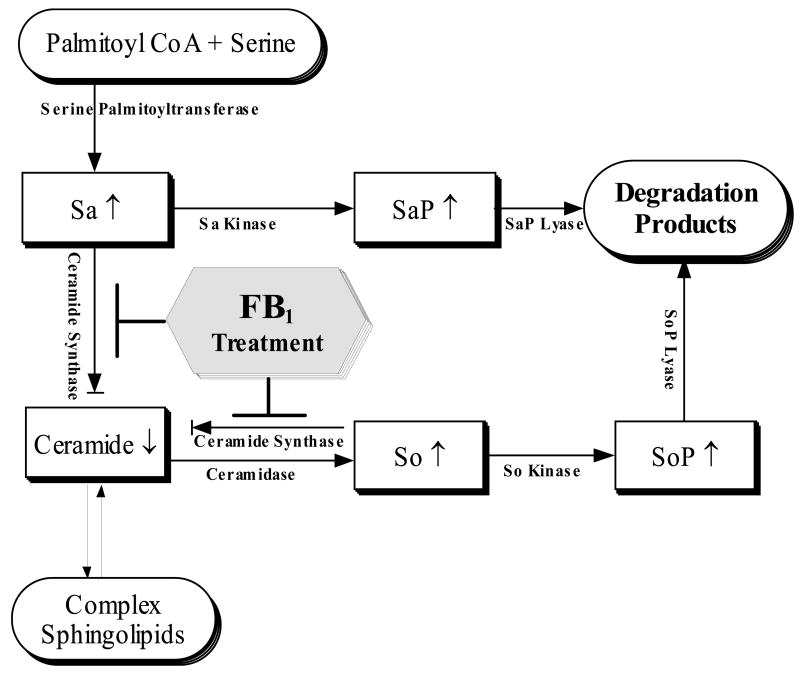
FNs are naturally occurring disruptors of de novo sphingolipid biosynthesis and turnover by inhibiting Sa or So N-acetyltransferases (Fig. 9). Based on this mechanism, several sphingolipid metabolites, particularly Sa and the Sa/So ratio in vivo, have been proposed as potential FN biomarkers of exposure (Riley et al., 1994b); nevertheless, none of these biomarkers has been rigorously validated to date. This study using F344 rats treated with both single- and repeat-dose FB1 demonstrates that urinary ratios of sphingolipid metabolites, particularly Sa/So and SaP/SoP, can serve as sensitive and specific biomarkers of exposure.
Fig. 9.
Disruption of de novo sphingolipid biosynthetic and turnover pathways by FB1 treatment.
Our single-dose study showed that urinary Sa/So in rats reached a maximum at day 5 to 7, whereas serum Sa/So only increased marginally at day 3. There are limited published data on Sa/So kinetics in experimental animals treated with single-dose FB1 to compare with our results. A study on the time-course of Sa/So in kidney and liver of mice following a single dose of FB1 found that the more persistent ratios were obtained in kidney rather than liver (Enongene et al., 2002). However, in a study of vervet monkeys, a single oral dose of 10 mg/kg BW FB1 induced an elevation of serum Sa/So for several weeks (van der Westhuizen et al., 2001a). It is unclear whether the latter observation was simply related to species differences.
In rats sub-chronically dosed with 1.0 or 2.5 mg/kg BW/day FB1, urinary Sa/So ratio, ut not the serum Sa/So ratio, illustrates unambiguous time- and dose-dependent increases. This finding is consistent with other studies in rats (Riley et al., 1994a; olfrizzo et al., 1997; Wang et al., 1999; Garren et al., 2001). FNs are toxic to many organs; however, liver and kidney are the major targets in rats. It has been found that rat kidney is much more sensitive to dietary FB1 exposure than liver. A two-year feeding study showed that FB1 induced renal tube adenomas and carcinomas in male F344, whereas hepatocellular carcinomas were induced in female B6C3F1 mice (Howard et al., 2001). Nephrotoxicity was first confirmed in male rats fed FB1 at ≥ 15 μg/g and female rats fed FB1 at ≥ 50 μg/g for 4 weeks (Voss et al., 1993). Typical kidney ultrastructural lesions consisted of cytoplasmic vacuoles which occasionally manifested multilamellar membranous whorls, and disorganization and distention of basilar membrane folds (Riley et al., 1994a). That study in Sprague-Dawley rats (Riley et al., 1994a) also established that exfoliated cells from urinary sedimentation were the primary source of free sphingolipid metabolites in urine and precisely reflected dose-dependent increases of Sa/So in kidney. Ratios of Sa/So in liver and serum changed less than in kidney and urine. Although rats fed FB1 at 15–150 μg/g in the diet showed dose-dependent elevations of urinary Sa/So at all doses, significant serum Sa/So elevation was only observed at ≥ 150 μg/g FB1 in males and ≥ 50 μg/g in females (Riley et al., 1994a). Previously, no significant alteration of the serum Sa/So ratio was detected in BDIV rats treated with FB1 at 1.0 mg/kg BW per day (Castegnaro et al., 1998). Plasma Sa and So were significantly elevated in rats fed 50 μg/g FB1 on day 21, but the ratio remained virtually unchanged (Wang et al., 1999). Only modest increases in Sa/So ratios were observed in liver from rats dosed with 1–5 mg/kg BW/day FB1 for 5 weeks; there was no marked dose-response related increase in the ratio (Garren et al., 2001). Conversely, statistically significant increases in serum Sa/So were observed in pigs fed total FNs as low as 5 μg/g, while other serum biochemistry parameters and tissue morphology were not altered (Riley et al., 1993). The rapid decrease of free Sa and So in rat liver suggests the liver is much better at handling accumulated Sa or So by either elimination or metabolism. Alternatively, the kidney may retain free Sa or accumulate it from serum and may be more resistant to the toxic effects of sphingolipid metabolites (Riley and Voss, 2006). The collective body of evidence confirms that animal circulation has certain regulating mechanisms to alleviate FB1-induced sphingolipid accumulation in liver and blood. The much narrower range of serum Sa/So compared with urinary Sa/So may limit the application of serum Sa/So as a sensitive biomarker in large-scale human epidemiological studies (Abnet et al. 2001; Missmer et al. 2006; van der Westhuizen et al. 1999). Nonetheless, a study in vervet monkeys dosed with repeated gavages of 1.0 mg FB1/kg BW demonstrated that the plasma Sa/So ratio increased three-fold after 30 days compared to control monkeys, and then declined slowly to double the value in controls after 51 days. There was not a clear elevation in urinary Sa/So ratios after 51 days in the dosed monkeys (van der Westhuizen et al., 2001b).
We found that a large amount of urinary SaP rather than SoP accumulates during single- and repeat-dose FB1 exposure which makes urinary SaP/SoP a more promising biomarker of exposure than urinary Sa/So in terms of sensitivity. The urinary SaP/SoP ratios were at least five-fold higher than Sa/So in both dosing scenarios at each time point. Interestingly, for both urine and serum after the initial repeated exposure to FB1, the conversion of Sa to SaP and So to SoP were boosted at week 2 to 4, but reduced at week 5. A recent study has shown that maximal amounts of SaP were 50-fold greater than levels of SoP in kidney from rats fed a diet containing 88.6 μg/g FB1 (Riley and Voss, 2006). This finding also agrees with the observation in mice intraperitoneally treated with 10 mg/kg BW/day FB1 for 5 days (Kim et al., 2006).
SoP has been proposed as an intracellular second messenger in pathways regulating calcium homeostasis and activating pathways for promoting cell survival (Spiegel and Milstien, 2002; Hla, 2003). No data are available as to the physiological functions of accumulated SaP in vivo. However, an in vitro study indicated SaP sometimes stimulates growth and inhibits apoptosis (Desai et al., 2002). SaP and SoP are also known to act as ligands for a family of extracellular G protein-coupled receptors known as S1P receptors (Spiegel, 1999; Spiegel and Milstien, 2002). The sources of SaP and SoP in urine and serum may include leakage from altered tissues and clearance from metabolic pathways. The synthesis and degradation of SaP and SoP by triggering Sa or So kinases and lyases (Fig. 9) may be involved in cellular signal transduction pathways. The exact mechanism by which cells metabolize Sa and So into their 1-phosphate analogs is not well understood. Sphingoid bases are believed to be catabolized by phosphorylation and lytic cleavage to a fatty aldehyde and ethanolamine phosphate. In addition, N-acetylation of Sa could occur in cells exposed to large amounts of sphingolipids (Merrill et al., 2001). The accelerated conversion of sphingoid bases to their 1-phosphate analogs may represent a systemic response to the accumulated So and Sa which may be growth inhibitory and cytotoxic (Schwarz and Futerman, 1998). The increased SaP/Sa and SoP/So during weeks 2–4 may account for the induced Sa(So) kinase activity upon exposure to FB1, while the reduced SaP/Sa and SoP/So after week 5 suggests an increased clearance or an induced SaP (SoP) lyase activity due to the accumulated SaP and SoP in the target organs. Enzymatic activities and downstream products pertinent to SaP and SoP warrant more investigation, in particular under chronic exposure to FB1 in vivo.
Biomarkers that reveal FN exposure are of interest to epidemiological studies for assessing human exposure to FNs and their link to human diseases. From a practical point of view, non-invasive biospecimens such as urine, blood, and feces are preferred to tissues in molecular epidemiological studies involving numerous human subjects. By thoroughly validating previously proposed biomarkers in animal studies, we can better understand the mechanism underlying the associations between dietary FB1 exposure and sphingolipid-mediated disorders, including cancer. Our findings largely validated that in F344 rats, urinary SaP/SoP or Sa/So are more sensitive than serum ratios for both acute and sub-chronic exposure to FB1. Compared to Sa/So, SaP/SoP has practical advantages in serving as a sensitive and specific biomarker, especially under chronic low-level exposure scenarios in humans. Also, free FB1 levels in urine and feces are strongly correlated with urinary sphingolipid metabolites in the repeat-dose study, and worth further evaluation as biomarkers of exposure to dietary FNs in human studies.
Acknowledgments
This study was supported by US NIH grants CA94683, CA90997, and US DOD research contract DAAD 13-01-C0053. Authors thank Dr. Todd Anderson for his review of the manuscript.
Abbreviations
- BW
body weight
- C17SaP
D-erythro-C17-sphinganine 1-phosphate
- C20So
D-erythro-C20-sphingosine
- FB1
fumonisin B1
- FNs
fumonisins
- LC/MS
liquid chromatography/mass spectrometry
- OPA
o-phthaldialdehyde
- PBS
phosphate buffered saline
- Sa
D-erythro-sphinganine
- SaP
D-erythro-sphinganine 1-phosphate
- So
D-erythro-sphingosine
- SoP
D-erythro-sphingosine 1-phosphate
Footnotes
Publisher's Disclaimer: This is a PDF file of an unedited manuscript that has been accepted for publication. As a service to our customers we are providing this early version of the manuscript. The manuscript will undergo copyediting, typesetting, and review of the resulting proof before it is published in its final citable form. Please note that during the production process errors may be discovered which could affect the content, and all legal disclaimers that apply to the journal pertain.
References
- Abnet CC, Borkowf CB, Qiao YL, Albert PS, Wang E, Merrill AH, Jr, Mark SD, Dong ZW, Taylor PR, Dawsey SM. Sphingolipids as biomarkers of fumonisin exposure and risk of esophageal squamous cell carcinoma in china. Cancer Causes Control. 2001;12:821–828. doi: 10.1023/a:1012228000014. [DOI] [PubMed] [Google Scholar]
- Bielawski J, Szulc ZM, Hannun YA, Bielawska A. Simultaneous quantitative analysis of bioactive sphingolipids by high-performance liquid chromatography-tandem mass spectrometry. Methods. 2006;39:82–91. doi: 10.1016/j.ymeth.2006.05.004. [DOI] [PubMed] [Google Scholar]
- Castegnaro M, Garren L, Galendo D, Gelderblom WC, Chelule P, Dutton MF, Wild CP. Analytical method for the determination of sphinganine and sphingosine in serum as a potential biomarker for fumonisin exposure. J Chromatogr B Biomed Sci Appl. 1998;720:15–24. doi: 10.1016/s0378-4347(98)00446-0. [DOI] [PubMed] [Google Scholar]
- Chelule PK, Gqaleni N, Chuturgoon AA, Dutton MF. The determination of fumonisin B-1 in human faeces: a short term marker for assessment of exposure. Biomarkers. 2000;5:1–8. doi: 10.1080/135475000230497. [DOI] [PubMed] [Google Scholar]
- Chelule PK, Gqaleni N, Dutton MF, Chuturgoon AA. Exposure of rural and urban populations in KwaZulu Natal, South Africa, to fumonisin B(1) in maize. Environ Health Perspect. 2001;109:253–256. doi: 10.1289/ehp.01109253. [DOI] [PMC free article] [PubMed] [Google Scholar]
- Chu FS, Li GY. Simultaneous occurrence of fumonisin B1 and other mycotoxins in moldy corn collected from the People’s Republic of China in regions with high incidences of esophageal cancer. Appl Environ Microbiol. 1994;60:847–852. doi: 10.1128/aem.60.3.847-852.1994. [DOI] [PMC free article] [PubMed] [Google Scholar]
- Delongchamp RR, Young JF. Tissue sphinganine as a biomarker of fumonisin-induced apoptosis. Food Addit Contam. 2001;18:255–261. doi: 10.1080/02652030118953. [DOI] [PubMed] [Google Scholar]
- Desai K, Sullards MC, Allegood J, Wang E, Schmelz EM, Hartl M, Humpf HU, Liotta DC, Peng Q, Merrill AH., Jr Fumonisins and fumonisin analogs as inhibitors of ceramide synthase and inducers of apoptosis. Biochim Biophys Acta. 2002;1585:188–192. doi: 10.1016/s1388-1981(02)00340-2. [DOI] [PubMed] [Google Scholar]
- Enongene EN, Sharma RP, Bhandari N, Miller JD, Meredith FI, Voss KA, Riley RT. Persistence and reversibility of the elevation in free sphingoid bases induced by fumonisin inhibition of ceramide synthase. Toxicol Sci. 2002;67:173–181. doi: 10.1093/toxsci/67.2.173. [DOI] [PubMed] [Google Scholar]
- Garren L, Galendo D, Wild CP, Castegnaro M. The induction and persistence of altered sphingolipid biosynthesis in rats treated with fumonisin B1. Food Addit Contam. 2001;18:850–856. doi: 10.1080/02652030120881. [DOI] [PubMed] [Google Scholar]
- Gelderblom WC, Marasas WF, Lebepe-Mazur S, Swanevelder S, Vessey CJ, Hall Pde L. Interaction of fumonisin B(1) and aflatoxin B(1) in a short-term carcinogenesis model in rat liver. Toxicology. 2002;171:161–173. doi: 10.1016/s0300-483x(01)00573-x. [DOI] [PubMed] [Google Scholar]
- Gelderblom WC, Snyman SD, Lebepe-Mazur S, van der Westhuizen L, Kriek NP, Marasas WF. The cancer-promoting potential of fumonisin B1 in rat liver using diethylnitrosamine as a cancer initiator. Cancer Lett. 1996;109:101–108. doi: 10.1016/s0304-3835(96)04431-x. [DOI] [PubMed] [Google Scholar]
- Groopman JD, Kensler TW. The light at the end of the tunnel for chemical-specific biomarkers: daylight or headlight? Carcinogenesis. 1999;20:1–11. doi: 10.1093/carcin/20.1.1. [DOI] [PubMed] [Google Scholar]
- Hla T. Signaling and biological actions of sphingosine 1-phosphate. Pharmacol Res. 2003;47:401–407. doi: 10.1016/s1043-6618(03)00046-x. [DOI] [PubMed] [Google Scholar]
- Howard PC, Eppley RM, Stack ME, Warbritton A, Voss KA, Lorentzen RJ, Kovach RM, Bucci TJ. Fumonisin B1 carcinogenicity in a two-year feeding study using F344 rats and B6C3F1 mice. Environ Health Perspect. 2001;109(Suppl 2):277–282. doi: 10.1289/ehp.01109s2277. [DOI] [PMC free article] [PubMed] [Google Scholar]
- Jackson LS, Hlywka JJ, Senthil KR, Bullerman LB. Effect of thermal processing on the stability of fumonisins. Adv Exp Med Biol. 1996;392:345–353. doi: 10.1007/978-1-4899-1379-1_30. [DOI] [PubMed] [Google Scholar]
- Kim DH, Yoo HS, Lee YM, Kie JH, Jang S, Oh S. Elevation of sphinganine 1-phosphate as a predictive biomarker for fumonisin exposure and toxicity in mice. J Toxicol Environ Health Part A. 2006;69:2071–2082. doi: 10.1080/15287390600746215. [DOI] [PubMed] [Google Scholar]
- Marasas WF. Fumonisins: history, world-wide occurrence and impact. Adv Exp Med Biol. 1996;392:1–17. doi: 10.1007/978-1-4899-1379-1_1. [DOI] [PubMed] [Google Scholar]
- Marasas WF, Jaskiewicz K, Venter FS, Van Schalkwyk DJ. Fusarium moniliforme contamination of maize in oesophageal cancer areas in Transkei. S Afr Med J. 1988;74:110–114. [PubMed] [Google Scholar]
- Martinez-Larranaga MR, Anadon A, Diaz MJ, Fernandez-Cruz ML, Martinez MA, Frejo MT, Martinez M, Fernandez R, Anton RM, Morales ME, Tafur M. Toxicokinetics and oral bioavailability of fumonisin B1. Vet Hum Toxicol. 1999;41:357–362. [PubMed] [Google Scholar]
- Merrill AH, Jr, Sullards MC, Wang E, Voss KA, Riley RT. Sphingolipid metabolism: roles in signal transduction and disruption by fumonisins. Environ Health Perspect. 2001;109(Suppl 2):283–289. doi: 10.1289/ehp.01109s2283. [DOI] [PMC free article] [PubMed] [Google Scholar]
- Merrill AH, Jr, van Echten G, Wang E, Sandhoff K. Fumonisin B1 inhibits sphingosine (sphinganine) N-acyltransferase and de novo sphingolipid biosynthesis in cultured neurons in situ. J Biol Chem. 1993;268:27299–27306. [PubMed] [Google Scholar]
- Missmer SA, Suarez L, Felkner M, Wang E, Merrill AH, Jr, Rothman KJ, Hendricks KA. Exposure to fumonisins and the occurrence of neural tube defects along the Texas-Mexico border. Environ Health Perspect. 2006;114:237–241. doi: 10.1289/ehp.8221. [DOI] [PMC free article] [PubMed] [Google Scholar]
- Morgan MK, Schroeder JJ, Rottinghaus GE, Powell DC, Bursian SJ, Aulerich RJ. Dietary fumonisins disrupt sphingolipid metabolism in mink and increase the free sphinganine to sphingosine ratio in urine but not in hair. Vet Hum Toxicol. 1997;39:334–336. [PubMed] [Google Scholar]
- Ogretmen B, Hannun YA. Biologically active sphingolipids in cancer pathogenesis and treatment. Nat Rev Cancer. 2004;4:604–616. doi: 10.1038/nrc1411. [DOI] [PubMed] [Google Scholar]
- Prelusky DB, Savard ME, Trenholm HL. Pilot study on the plasma pharmacokinetics of fumonisin B1 in cows following a single dose by oral gavage or intravenous administration. Nat Toxins. 1995;3:389–394. doi: 10.1002/nt.2620030511. [DOI] [PubMed] [Google Scholar]
- Prelusky DB, Trenholm HL, Savard ME. Pharmacokinetic fate of 14C-labelled fumonisin B1 in swine. Nat Toxins. 1994;2:73–80. doi: 10.1002/nt.2620020205. [DOI] [PubMed] [Google Scholar]
- Qiu M, Liu X. Determination of sphinganine, sphingosine and Sa/So ratio in urine of humans exposed to dietary fumonisin B1. Food Addit Contam. 2001;18:263–269. doi: 10.1080/02652030117470. [DOI] [PubMed] [Google Scholar]
- Riley RT, An NH, Showker JL, Yoo HS, Norred WP, Chamberlain WJ, Wang E, Merrill AH, Jr, Motelin G, Beasley VR, Haschek WM. Alteration of tissue and serum sphinganine to sphingosine ratio: an early biomarker of exposure to fumonisin-containing feeds in pigs. Toxicol Appl Pharmacol. 1993;118:105–112. doi: 10.1006/taap.1993.1015. [DOI] [PubMed] [Google Scholar]
- Riley RT, Enongene E, Voss KA, Norred WP, Meredith FI, Sharma RP, Spitsbergen J, Williams DE, Carlson DB, Merrill AH., Jr Sphingolipid perturbations as mechanisms for fumonisin carcinogenesis. Environ Health Perspect. 2001;109(Suppl 2):301–308. doi: 10.1289/ehp.01109s2301. [DOI] [PMC free article] [PubMed] [Google Scholar]
- Riley RT, Hinton DM, Chamberlain WJ, Bacon CW, Wang E, Merrill AH, Jr, Voss KA. Dietary fumonisin B1 induces disruption of sphingolipid metabolism in Sprague-Dawley rats: a new mechanism of nephrotoxicity. J Nutr. 1994a;124:594–603. doi: 10.1093/jn/124.4.594. [DOI] [PubMed] [Google Scholar]
- Riley RT, Voss KA. Differential sensitivity of rat kidney and liver to fumonisin toxicity: organ-specific differences in toxin accumulation and sphingoid base metabolism. Toxicol Sci. 2006;92:335–345. doi: 10.1093/toxsci/kfj198. [DOI] [PubMed] [Google Scholar]
- Riley RT, Wang E, Merrill AH. Liquid-chromatographic determination of sphinganine and sphingosine - use of the free sphinganine-to-sphingosine ratio as a biomarker for consumption of fumonisins. J AOAC Int. 1994b;77:533–540. [Google Scholar]
- Rothman N, Stewart WF, Schulte PA. Incorporating biomarkers into cancer epidemiology: a matrix of biomarker and study design categories. Cancer Epidemiol Biomarkers Prev. 1995;4:301–311. [PubMed] [Google Scholar]
- Schwarz A, Futerman AH. Inhibition of sphingolipid synthesis, but not degradation, alters the rate of dendrite growth in cultured hippocampal neurons. Brain Res Dev Brain Res. 1998;108:125–130. doi: 10.1016/s0165-3806(98)00041-8. [DOI] [PubMed] [Google Scholar]
- Sewram V, Mshicileli N, Shephard GS, Marasas WF. Fumonisin mycotoxins in human hair. Biomarkers. 2003;8:110–118. doi: 10.1080/1354750031000081002. [DOI] [PubMed] [Google Scholar]
- Shephard GS, Snijman PW. Elimination and excretion of a single dose of the mycotoxin fumonisin B2 in a non-human primate. Food Chem Toxicol. 1999;37:111–116. doi: 10.1016/s0278-6915(98)00117-3. [DOI] [PubMed] [Google Scholar]
- Shephard GS, Thiel PG, Sydenham EW. Determination of fumonisin B1 in plasma and urine by high-performance liquid chromatography. J Chromatogr. 1992a;574:299–304. doi: 10.1016/0378-4347(92)80043-p. [DOI] [PubMed] [Google Scholar]
- Shephard GS, Thiel PG, Sydenham EW. Initial studies on the toxicokinetics of fumonisin B1 in rats. Food Chem Toxicol. 1992b;30:277–279. doi: 10.1016/0278-6915(92)90004-5. [DOI] [PubMed] [Google Scholar]
- Shephard GS, Thiel PG, Sydenham EW, Alberts JF. Biliary excretion of the mycotoxin fumonisin B1 in rats. Food Chem Toxicol. 1994a;32:489–491. doi: 10.1016/0278-6915(94)90047-7. [DOI] [PubMed] [Google Scholar]
- Shephard GS, Thiel PG, Sydenham EW, Alberts JF, Cawood ME. Distribution and excretion of a single dose of the mycotoxin fumonisin B1 in a non-human primate. Toxicon. 1994b;32:735–741. doi: 10.1016/0041-0101(94)90342-5. [DOI] [PubMed] [Google Scholar]
- Shephard GS, Thiel PG, Sydenham EW, Vleggaar R, Alberts JF. Determination of the mycotoxin fumonisin B1 and identification of its partially hydrolysed metabolites in the faeces of non-human primates. Food Chem Toxicol. 1994c;32:23–29. doi: 10.1016/0278-6915(84)90032-2. [DOI] [PubMed] [Google Scholar]
- Shetty PH, Bhat RV. Sensitive method for the detection of fumonisin B1 in human urine. J Chromatogr B Biomed Sci Appl. 1998;705:171–173. doi: 10.1016/s0378-4347(97)00428-3. [DOI] [PubMed] [Google Scholar]
- Solfrizzo M, Avantaggiato G, Visconti A. In vivo validation of the sphinganine/sphingosine ratio as a biomarker to display fumonisin ingestion. Cereal Res Commun. 1997;25:437–441. [Google Scholar]
- Solfrizzo M, Chulze SN, Mallmann C, Visconti A, De Girolamo A, Rojo F, Torres A. Comparison of urinary sphingolipids in human populations with high and low maize consumption as a possible biomarker of fumonisin dietary exposure. Food Addit Contam. 2004;21:1090–1095. doi: 10.1080/02652030400013318. [DOI] [PubMed] [Google Scholar]
- Spiegel AM. Hormone resistance caused by mutations in G proteins and G protein-coupled receptors. J Pediatr Endocrinol Metab. 1999;12:303–309. [PubMed] [Google Scholar]
- Spiegel S, Milstien S. Sphingosine 1-phosphate, a key cell signaling molecule. J Biol Chem. 2002;277:25851–25854. doi: 10.1074/jbc.R200007200. [DOI] [PubMed] [Google Scholar]
- Sydenham EW, Thiel PG, Marasas WFO, Shephard GS, Van Schalkwyk DJ, Koch KR. Natural occurrence of some Fusarium mycotoxins in corn from low and high esophageal cancer prevalence areas of the Transkei, Southern Africa. J Agric Food Chem. 1990;38:1900–1903. [Google Scholar]
- Tran ST, Tardieu D, Auvergne A, Bailly JD, Babile R, Durand S, Benard G, Guerre P. Serum sphinganine and the sphinganine to sphingosine ratio as a biomarker of dietary fumonisins during chronic exposure in ducks. Chem Biol Interact. 2006;160:41–50. doi: 10.1016/j.cbi.2005.07.009. [DOI] [PubMed] [Google Scholar]
- Turner PC, Nikiema P, Wild CP. Fumonisin contamination of food: progress in development of biomarkers to better assess human health risks. Mutat Res. 1999;443:81–93. doi: 10.1016/s1383-5742(99)00012-5. [DOI] [PubMed] [Google Scholar]
- Ueno Y, Iijima K, Wang SD, Sugiura Y, Sekijima M, Tanaka T, Chen C, Yu SZ. Fumonisins as a possible contributory risk factor for primary liver cancer: a 3-year study of corn harvested in Haimen, China, by HPLC and ELISA. Food Chem Toxicol. 1997;35:1143–1150. doi: 10.1016/s0278-6915(97)00113-0. [DOI] [PubMed] [Google Scholar]
- van der Westhuizen L, Brown NL, Marasas WF, Swanevelder S, Shephard GS. Sphinganine/sphingosine ratio in plasma and urine as a possible biomarker for fumonisin exposure in humans in rural areas of Africa. Food Chem Toxicol. 1999;37:1153–1158. doi: 10.1016/s0278-6915(99)00113-1. [DOI] [PubMed] [Google Scholar]
- van der Westhuizen L, Shephard GS, van Schalkwyk DJ. The effect of a single gavage dose of fumonisin B(1) on the sphinganine and sphingosine levels in vervet monkeys. Toxicon. 2001a;39:273–281. doi: 10.1016/s0041-0101(00)00125-2. [DOI] [PubMed] [Google Scholar]
- van der Westhuizen L, Shephard GS, van Schalkwyk DJ. The effect of repeated gavage doses of fumonisin B1 on the sphinganine and sphingosine levels in vervet monkeys. Toxicon. 2001b;39:969–972. doi: 10.1016/s0041-0101(00)00235-x. [DOI] [PubMed] [Google Scholar]
- Voss KA, Chamberlain WJ, Bacon CW, Norred WP. A preliminary investigation on renal and hepatic toxicity in rats fed purified fumonisin B1. Nat Toxins. 1993;1:222–228. doi: 10.1002/nt.2620010404. [DOI] [PubMed] [Google Scholar]
- Wang E, Norred WP, Bacon CW, Riley RT, Merrill AH., Jr Inhibition of sphingolipid biosynthesis by fumonisins. Implications for diseases associated with Fusarium moniliforme. J Biol Chem. 1991;266:14486–14490. [PubMed] [Google Scholar]
- Wang E, Riley RT, Meredith FI, Merrill AH., Jr Fumonisin B1 consumption by rats causes reversible, dose-dependent increases in urinary sphinganine and sphingosine. J Nutr. 1999;129:214–220. doi: 10.1093/jn/129.1.214. [DOI] [PubMed] [Google Scholar]
- Wang E, Ross PF, Wilson TM, Riley RT, Merrill AH., Jr Increases in serum sphingosine and sphinganine and decreases in complex sphingolipids in ponies given feed containing fumonisins, mycotoxins produced by Fusarium moniliforme. J Nutr. 1992;122:1706–1716. doi: 10.1093/jn/122.8.1706. [DOI] [PubMed] [Google Scholar]
- WHO. Environmental Health Criteria. Vol. 219. World Health Organization; Geneva, Switzerland: 2000. Fumonisin B1; pp. 1–134. [Google Scholar]
- Yoshizawa T, Yamashita A, Luo Y. Fumonisin occurrence in corn from high- and low-risk areas for human esophageal cancer in China. Appl Environ Microbiol. 1994;60:1626–1629. doi: 10.1128/aem.60.5.1626-1629.1994. [DOI] [PMC free article] [PubMed] [Google Scholar]


