

Abstract
Single nucleotide polymorphisms (SNPs) can result in protein sequence polymorphisms (PSPs) when codon translations are altered. Both top-down and bottom-up proteomics strategies can identify PSPs, but only if databases and software are used with this in mind. A 14319 Da protein from human saliva was characterized using the top-down approach on a hybrid linear ion-trap Fourier-transform ion cyclotron resonance mass spectrometer equipped for both collisionally-activated (CAD) and electron-capture (ECD) dissociation. Sequence tags identified the protein as Cystatin SN, and defined the N-terminal signal peptide cleavage site, as well as two disulfide bonds, in agreement with previous studies. The mass of the intact protein (< 5 ppm error) deviated from that calculated from the published gene sequence by 16.031 Da, and, based on CAD and ECD fragment ion assignments, it was concluded that the isoform of the protein analyzed carried a PSP at residue 11 such that the Pro translated from the genome was in fact Leu/Ile. An independently determined SNP (rs2070856) subsequently confirmed the genetic basis of the mass spectral interpretation and defined the residue as Leu. In another example, the PRP3 protein with mass ∼10,999 Da was found to be an isomeric/isobaric mixture of the reported sequence with PSPs D4N or D50N (rs1049112). Both CAD and ECD datasets support two phosphorylation sites at residues Ser8 and Ser22, rather than Ser17. In the context of discovery proteomics, previously undefined PSPs and PTMs will only be detected if the logic of data processing strategies considers their presence in an unbiased fashion.
Keywords: top-down mass spectrometry, collision-activated dissociation, electron-capture dissociation, FT-MS, FT-ICR
Introduction
The ability to dissociate peptides and proteins during mass spectrometry experiments, generating sequence-dependent information, has revolutionized primary structure determination. While the earliest studies were aimed at de novo structure determination, the availability of complete genomic information has lead to a shift toward matching experimental peptide mass spectrometry datasets to sequences translated from DNA sequences, enabling the advent of high-throughput proteomics. Peptides with post-translational modifications (PTMs) and protein sequence polymorphisms (PSPs) that lead to disagreement between experimental data with sequences in protein databases are consequently ignored, unless the software algorithms used for matching are instructed to consider modifications that alter mass. Our ability to fully understand the diversity of the human proteome is inevitably somewhat restrained.
Top-down mass spectrometry and proteomics centers on intact protein mass measurements and dissociation of the intact protein to yield tandem mass spectrometry datasets that can be used to reconcile the primary structure with the measured mass of the protein [1,2]. Thus an essential difference between bottom-up peptide-based strategies and top-down is that the latter approach must fully describe the primary structure of not only the parts of the protein that match the sequence in the protein database, but also the parts that do not. Consequently, data interpretation is more demanding, typically divided into protein identification followed by detailed structural characterization [3,4]. Top-down mass spectrometry of proteins started with the observations that large intact proteins could be subjected to collisionally-activated dissociation (CAD) [5], identified using sequence tags [6], and has benefited from the discovery of a second fragmentation mechanism, electron-capture dissociation (ECD) [7]. The importance of high-resolution and high-mass accuracy for data interpretation in top-down experiments has long been recognized [8], and the Fourier-transform ion cyclotron resonance (FT-ICR) mass analyzer is unsurpassed in these respects [9]. The recent introduction of hybrid linear ion-trap (and quadrupole) FTICR instruments has further benefited top-down because of dramatic improvements in product-ion mass accuracy, achieved by maintaining optimal pressure in the ICR cell and by carefully regulating the number of ions transmitted to it [10].
The human salivary proteome has long interested protein chemists; indeed, Peter Roepstorff and colleagues used mass spectrometry to define the blocked N-terminus of salivary amylase over twenty-five years ago [11]. More recently, attempts are being made to fully understand the variety of proteins found in saliva and the lists of identified proteins grow ever longer [12,13,14]. The bulk of saliva protein is constituted by amylase and a small group of proline-rich proteins (PRPs) in the mass range 5-30 kDa. Intact protein maps have been developed and have lead to the recognition that although there are only a few parent genes there is a tremendous diversity of protein/peptide products depending upon post-translational processing [15]. Comparisons between individuals has further shown a variety of human alleles with both sequence and downstream processing diversity [16]. The net result is that a single liquid chromatography mass spectrometry experiment on a quadrupole instrument (100 ppm) reveals a wide range of proteins each with an apparently unique intact mass tag (IMT). In this report, two IMTs are subjected to detailed top-down analysis with a hybrid FT-ICR mass spectrometer. The data illustrates how high resolution and high mass accuracy is essential for understanding the protein-sequence polymorphisms and post-translational modifications inherent in the expression of these proteins. The analysis of isomeric forms of PRP3 demonstrates that in some instances IMTs are ambiguous, and consequently that the presence of ‘unique’ ions in dissociation spectra are necessary to define ‘distinct’ molecular species.
Materials and Methods
Chemicals
All solvents, buffer and reagents (guanidine HCl, acetonitrile, anti-protease cocktail, trifluoroacetic acid, TFA) used were purchased from Thermo Fisher Corp.
Sample collection
Saliva donors were recruited from the general population and samples were collected at the UCLA Medical Center with full donor consent using procedures in accord with the Medical Institution Review Board and the Office of Protection for Research Subjects. Donors were in general in good health and exhibited normal salivary function. Parotid and whole saliva samples were collected with the purpose of developing methodologies to identify possible specific biomarkers. Whole saliva was collected in an un-stimulated fashion by allowing a donor to drool into a sterile container on ice (4°C) for approximately 5-10 minutes. For Parotid saliva collections, a sterile parotid cup was applied over the opening to the parotid duct (Stenson's Duct) to isolate the gland. The parotid gland was stimulated by the repeated topical application of a mild solution of citric acid (2 % wt/vol) to the dorsal surface of the tongue. The first few drops of collected parotid saliva were discarded. Care was taken to keep the acid solution away for the collection area. Individual whole saliva collections ranged from 3-5 mL and parotid collections ranged from 300-1500 μL per subject. Once collected the samples were centrifuged at 3500 rpm for 15 min at 4°C. The fluid phase was then removed and protease inhibitor added promptly while the fluid phase was maintained on ice. All samples were stored at −80°C prior to MS analyses.
Reverse-phase chromatography with online reverse-phase mass spectrometry and fraction collection (LC-MS+)
Pooled whole saliva samples were dried by centrifugal evaporation (Speed Vac), dissolved in 6 M guanidine-HCl and cleared by centrifugation (10,000 x g; 5 minutes) to remove insoluble material prior to LC-MS+. Each sample was loaded onto a reverse phase HPLC column (40 °C, PLRP/S 5 μm, 300 Å, 2 × 150 mm, Polymer Labs) previously equilibrated in 95 % A, 5 % B (A, 0.1 % TFA in water; B, 0.1 % TFA in CH3CN) and eluted with a compound linear gradient from 5% B at 5 min after injection, through 20% B at 10 min, 50% B at 70 min, and 90% B at 90 min. The eluent was passed through a UV detector (280 nm) prior to a liquid-flow splitter with fused silica capillaries to transfer liquid to the ESI source (50 cm) and the fraction collector (25 cm). Fractions were collected into microcentrifuge tubes at 1 minute intervals. Samples were kept at −20 °C before analysis by mass spectrometry.
Electrospray Ionization Mass Spectrometry
LC-MS+ experiments were performed using a triple quadrupole instrument (API III+, Applied Biosystems) tuned and calibrated using a PEG mixture as described previously [18]. Data were processed using MacSpec 3.3, Hypermass, or BioMultiview 1.3.1 software (Applied Biosystems).
Top-down tandem mass spectrometry experiments were performed on a hybrid linear ion-trap 7-T FTICR mass spectrometer (LTQ-FT, Thermo Fisher Corporation, San Jose, USA) fitted with an off-line nanospray source. HPLC fractions were individually loaded into 2 μm i.d. externally-coated nanospray emitters (New Objective Inc., Woburn, MA) and desorbed using a spray voltage of between 1.2 - 1.4 kV (versus the inlet of the mass spectrometer). These conditions produced a flow rate of 20 - 50 nL/min.
Ion transmission into the linear trap and further to the ICR cell was automatically optimized for maximum ion signal. The ion count targets for the full scan and MS2 ICR experiments were 2 × 10⁶. The m/z resolving power of the instrument was set at 100,000 (defined by m/Δm50% at m/z 400). Individual charge states of the multiply protonated protein molecular ions were selected for isolation and collisional activation in the linear ion trap followed by the detection of the resulting fragments in the ICR cell. For the CAD studies, the precursor ions were activated using 35% normalized collision energy at the default activation q-value of 0.25. Alternative studies were conducted in which the precursor ions were guided to the ICR cell and further fragmented using ECD. The ECD fragmentation efficiency was optimized to maximize fragment ion signal.
Data analysis with Prosight
All FTICR spectra, derived from an average of between 50 - 500 transient signals, were processed using XtractAll (Xcaliber 2.0, Thermo Electron, Bremen, Germany) to produce monoisotopic mass lists (s/n =1.1, fit 0%, remainder 0%, averagine table set to averagine). Prosight PTM (https://prosightptm.scs.uiuc.edu) and Prosight PC (Thermo Fisher Corp.) software suites were used to first identify and then fully characterize the protein primary structure. The ‘sequence tag compiler’ function was used to generate short sequence tags for protein identification using the ‘sequence tag’ function. Once the protein was identified, the ‘single protein mode’ function was used to fully characterize the primary structure with custom post-translational modifications as required. This is largely a manual process as different sequences and post-translational modifications must be tried independently to maximize the number of fragment ions matched. A threshold of 15 ppm is used for matching in Prosight. Nomenclature for assignment of peptide/protein fragments was according to Biemann [19, 20].
Results
Identification of Cystatin SN
Cystatin SN was identified by a set of sequence tags, IYNA, EYNKAT, FFDV, PWE that Prosight PTM extracted from the CAD dataset (Figure 1). While Cystatin SN was the fourth hit, it was the first with multiple tags and is annotated as salivary. Improvements are required for fully automated confident identification of proteins in top-down experiments.
Figure 1.

Tandem mass spectrometry of intact Cystatin SN, mass 14319 Da. A 14-charge parent ion (inset) was subjected to CAD (A) and ECD (B) on a hybrid linear ion-trap FTICR mass spectrometer. Peaklists were extracted from the datasets using Xtract software prior to processing with Prosight software. Fragment ion mass accuracy was better than 5 ppm RMS.
A protein sequence polymorphism in Cystatin SN
The calculated mass for the complete Cystatin SN sequence is 16351.33 Da so the experimentally determined monoisotopic mass of 14319.171 Da indicates a truncation. Based on the observation that only y-ions were matched, the truncation was located to the N-terminus, in agreement with annotation at SwissProt (P01037) and the literature [21]. The first twenty amino-acid residues are removed leaving tryptophan at the N-terminus and a calculated monoisotopic mass of 14307.119 Da. At this point the CAD dataset started to match predicted b-ions but only as far as b7 so a modification was hypothesized more than seven amino-acid residues from the N-terminus. Concomitantly, it was noted that y-coverage was increased by assuming that the 4 Cys residues were involved in disulfide bonds, in agreement with annotation at SwissProt (‘by similarity’). The largest y-ion matched at this point was y107 implying that the mass discrepancy was localized between positions 8 and 14 of the mature sequence. Based upon the experimental mass and the mass calculated for the two-disulfide form (14303.087 Da) the mass discrepancy was calculated to be 16.084 Da. The accurate mass of this measurement implied that the origin of the mass discrepancy was CH4 (calculated mass = 16.0313 Da) rather than NH2 (16.0187 Da) or O (15.9949 Da). Substitution of Pro for Ile/Leu changes the atomic formula by CH4 so we hypothesized that the residue at position 11 was in fact Ile/Leu. This change allowed one more y-ion to be matched in the CAD data set, and subsequent examination of the ECD data allowed several ions to be matched across this N-terminal region, effectively confirming the hypothetical protein sequence polymorphism with accurate mass measurements (Figure 2). When Prosight was used to add CH4, NH2 or O to the sequence at position 11 to specifically test which atomic formula gave the best fit of experimental fragment ion data, the CH4 modification resulted in the most fragment ions matched (15 ppm inclusion threshold), and the lowest error (RMS) on the set of matched ions (see supplementary 2). Subsequent to our analysis a wide array of SNP information was annotated to SwissProt in mid-2006. Five SNPs were reported for Cystatin SN including the P11L alteration (position 31 in the complete sequence translation; dbSNP:rs2070856; var_028933) confirming the genetic basis of the protein sequence polymorphism, and distinguishing the isomeric Leu from Ile. The mass accuracy of the intact protein measurement was 3.5 ppm based on the assigned structure.
Figure 2.
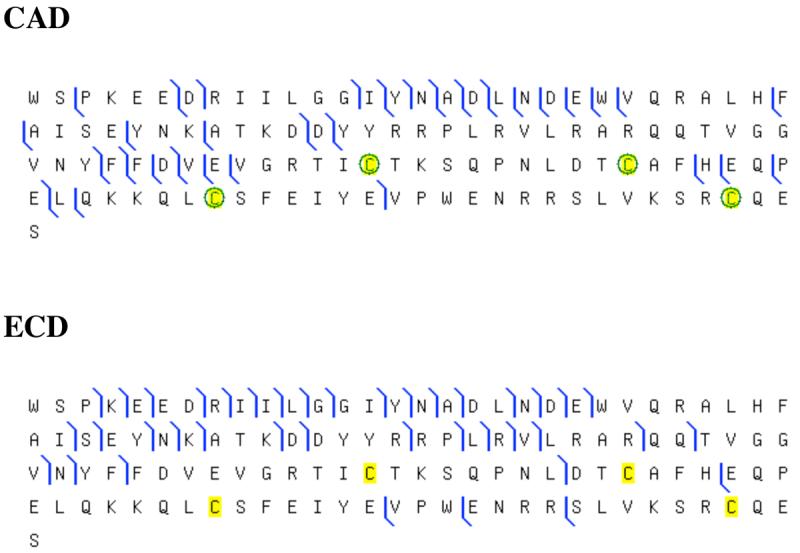
Sequence coverage from top-down mass spectrometry on human salivary Cystatin SN. The graphical output of Prosight PTM was used to illustrate assigned ions from CAD and ECD experiments shown in Figure 1. In the case of CAD the Cys residues were oxidized to disulfides (−1.007825 Da each).
Identification of PRP3
PRP3 was identified using a sequence tag, QQQGPPP, compiled using ProSightPC from the CAD spectrum (Figure 3A). The sequence-tag function returned only three proteins of which only PRP3 was annotated as salivary.
Figure 3.

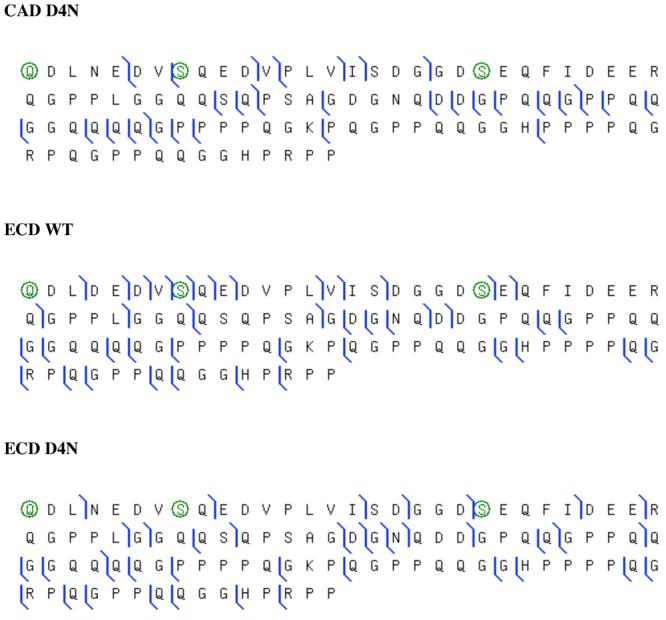
Tandem mass spectrometry of intact PRP3 isoforms, mass ∼11,000 Da. An 11-charge parent ion (m/z 1001) was subjected to CAD (A) and ECD (B) experiments. The parent molecular ion is shown in Figure 4B. (C) Sequence coverage for D4N with CAD data, WT (unmodified sequence) with ECD data and D4N with ECD data all support phosphorylation at Ser22.
Post-translational modifications of PRP3
The PRP3 sequence was truncated as previously described, including the loss of C-terminal Arg and N-terminal pyroglutamate formation [22, 23], in agreement with SwissProt (P02810, PRH1; residues 17-122). Phosphorylation of Ser8, Ser 17 and Ser22 have been reported, as well as glycosylation of Ser17. The intact mass of PRP3 supports two phosphorylations and both CAD and ECD datasets (Figure 3A and B) are consistent with phosphorylation of Ser8 and Ser22 (see Figure 3C and supplemental 3).
Protein sequence polymorphisms of PRP3
Examination of the high-resolution mass spectra revealed that the PRP3 species analyzed was in fact an isobaric/isomeric mixture of isoforms resulting from two protein sequence polymorphisms, as shown in Figure 4. Firstly, detailed inspection of the c3 and c4 ions from the ECD experiment showed the appearance of a lighter amidated form present at position 4. Figure 4A compares the measured c3 and c4 ions with simulations based on the reported sequence. The ion at 471.2 that is 0.984 Da lighter is due to the presence of D4N in the PRP3 sequence. This is consistent with a documented polymorphism in P02810 (position 20, var_005563, for alleles PRH1-PIF, PRH1-PA and PRH1-DB). Secondly, simulation of the isotopic profile for the molecular ion at 1001 (Figure 4B) shows that the experimental profile is best fit by a mixture with ∼75 % M-1, the amidated form. This is contributed by the D4N PSP and another, D50N, that is seen clearly in y-ions starting at y55. Figure 4C shows y61 demonstrating a contribution of ∼30% M-1 to its isotopic profile. Thus the data supports relative proportions of 50% D4N and 30% D50N, in the fraction examined and the charge state used as parent. The D50N polymorphism is also annotated in P02810 (position 66, var_005564, for allele PRH2-1) and in this case is accounted for by a genomic SNP (rs1049112). In the future, accurate quantification of the different isoforms requires analysis of all charge states across the chromatographic peak and would be best achieved using online LC-FTMS.
Figure 4.

Isomeric/isobaric forms of PRP3. A. Shows the experimentally determined c3 and c4 ions (upper) compared to theoretical ions (lower). The c4 ion clearly shows the appearance of the amidated isoform at position 4. B. The molecular ion fits a model with 75 % amidated isoforms (open circles). The open triangles represent the distribution expected for the D form whereas the open diamonds represent that expected for the N (amidated) isoform. C. The profile of y61 fits a model with around 30% contribution from an amidated form, this time due to D50N (open circles). The open triangles represent the distribution expected for the D form whereas the open diamonds represent that expected for the N (amidated) isoform.
Tables including the peak lists extracted by Xtract and output tables from Prosight are included as supplementary material. The Prosight outputs include calculations that demonstrate product-ion mass accuracy of 2 - 4 ppm for most fragments. The number of outliers is dependent on the accuracy threshold used within Prosight and when set at 15 ppm typical RMS values achieve 3 - 5 ppm.
Discussion
Bottom-up strategies for proteomics largely rely upon peptides whose sequence is correctly predicted by genomic translation. Post-translational modifications or sequence alterations of known mass can also be screened if the software algorithms used are so instructed. Newer, novel software solutions are seeking to mine unusual peptides with sequence homologies to easily identified peptides but with otherwise unpredictable modifications [24, 25] and interesting findings have emerged. Based on these observations, Zubarev has suggested that a peptide may have as many modifications as its number of amino-acid residues. Always, the idea is that sufficient product ions are matched such that the peptide structure is confirmed and that no other peptide structure could account for that dataset. Confidence of correct assignments is dramatically helped by high resolution/mass accuracy of precursor and product ions, though this has not yet been fully embraced in all software packages.
Interpretation of top-down datasets is considerably more demanding because of the increased size of the subject, and consequently high resolution and accuracy become vital. In the case of the Cystatin SN example, the power of accurate mass measurement was used to rapidly identify the most likely sequence polymorphism to explain the experimental data. The added sequence coverage afforded by ECD provided complementary information so that the modification could be finitely localized and measured with accurate mass, and an independently reported SNP provided the genetic explanation of the observed PSP. Though many ions provided confirmation of much of the rest of the primary structure, other regions were assumed in agreement with the published sequence, a reminder of our continued reliance on genomic data. The Cystatin PSP is a relatively clean example because of the large mass discrepancy. The PRP3 example is more complex because the isoforms differ from the reported sequence with a mass discrepancy of less than 1 Da (0.984) such that the isotopomer envelop of the different isoforms substantially overlap each other, and even at the relatively high resolution employed the different isoforms are not resolved. That is, the mixture of molecular species is represented by an apparently single isotopomer cluster that approximates the unmodified form according to the database entry. Cursory processing of the data would have revealed sufficient information for protein identification and confirmation that the observed structure is consistent with the reported sequence and modifications, yet detailed examination provides a clear indication of additional isoforms, again supported by previously documented results, including SNPs. Thus, the issue of ‘endpoint’ is raised; at what point is a top-down dataset fully interpreted ? In the future, this will be addressed with simulation of tandem mass spectra and subtraction to minimize the residual to some acceptable noise level, as well as measurements at very high resolution where the amidated/deamidated isotopomers are resolved.
Amidation of Asp to Asn via SNPs provide a contrast to the spontaneous deamidation process that can result in Asn to Asp and Gln to Glu (or the iso-acidic forms) conversion. It is noted that a SNP that changes Asp to Asn can potentiate formation of Asp or iso-Asp via deamidation. Thus an isoform with an Asp could then have a partner isoform that has a mixture of Asn, as a result of the SNP, as well as Asp and iso-Asp as a result of deamidation and the complex factors that determine the rate of this process in vivo. As others have shown [26] and confirmed here, deamidation/amidation can be measured using high-resolution mass spectrometry. Furthermore, ECD experiments can be used to distinguish the isomers, Asp and iso-Asp, providing another tool for characterization of protein micro-heterogeneity [27]. ‘Hot’ ECD was reported to be useful for distinguishing Leu and Ile [28] though we did not use it in this study. Finally, it has been recently shown that non-covalent associations can endure the ECD process [29] providing another route to distinguishing isomeric species if probes can be designed to discriminate different structural forms.
Conclusions
Contemporary high-resolution mass spectrometers are empowering top-down proteomics. Examples of protein sequence polymorphisms in Cystatin SN and PRP3 were characterized with the aid of accurate mass measurements, and the complementary nature of CAD and ECD. The complexity of the human proteome is highlighted, and translational research based on the human salivary proteome will need to acknowledge and encompass this variability. Only when inter- and intra-individual variability is understood will it be possible to reliably identify biomarkers related to health issues. The measurements presented here highlight the subtleties of protein structure and illuminate the technologies that must be brought to bear for accurate tracking of potential biomarkers. Intact mass tags must be measured at high resolution and mass accuracy, and at least in the case of PRP3, must be supplemented with unique product ions for accurate tracking of individual isoforms.
Supplementary Material
Acknowledgements
Financial support from NIH-NIDCR (U01 DE016275-01) is gratefully acknowledged. We thank Robert Barkovich for assistance with software.
Abbreviations
- IMT
Intact mass tag
- MSMS
tandem mass spectrometry
- FTICR-MS
Fourier-transform Ion Cyclotron resonance mass spectrometry
- PRP
proline rich protein
- CAD
collisionally-activated dissociation
- ECD
electron-capture dissociation
Footnotes
Publisher's Disclaimer: This is a PDF file of an unedited manuscript that has been accepted for publication. As a service to our customers we are providing this early version of the manuscript. The manuscript will undergo copyediting, typesetting, and review of the resulting proof before it is published in its final citable form. Please note that during the production process errors may be discovered which could affect the content, and all legal disclaimers that apply to the journal pertain.
References
- 1.Kelleher NL, Lin HY, Valaskovic GA, Aaserud DJ, Fridriksson EK, McLafferty FW. J. Am. Chem. Soc. 1999;121:806–807. [Google Scholar]
- 2.Reid GE, McLuckey SA. J. Mass Spectrom. 2002;37:63–75. doi: 10.1002/jms.346. [DOI] [PubMed] [Google Scholar]
- 3.Kelleher NL. Anal. Chem. 2004;76:197A–203A. [PubMed] [Google Scholar]
- 4.Whitelegge JP, Halgand F, Souda P, Zabrouskov V. Expert Rev. Proteomics. 2006;3:585–96. doi: 10.1586/14789450.3.6.585. [DOI] [PubMed] [Google Scholar]
- 5.Loo JA, Udseth HR, Smith RD. Anal. Biochem. 1989;179:404–412. doi: 10.1016/0003-2697(89)90153-x. [DOI] [PubMed] [Google Scholar]
- 6.Mørtz E, O'Connor PB, Roepstorff P, Kelleher NL, Wood TD, McLafferty FW, Mann M. Proc. Natl. Acad. Sci. U.S.A. 1996;93:8264–8267. doi: 10.1073/pnas.93.16.8264. [DOI] [PMC free article] [PubMed] [Google Scholar]
- 7.Zubarev RA, Kelleher NL, McLafferty FW. J. Am. Chem. Soc. 1998;120:3265–3266. [Google Scholar]
- 8.Nielsen PF, Roepstorff P, Clausen IG, Jensen EB, Jonassen I, Svendsen A, Balschmidt P, Hansen FB. Protein Eng. 1989;2:449–57. doi: 10.1093/protein/2.6.449. [DOI] [PubMed] [Google Scholar]
- 9.Henry KD, Williams ER, Wang BH, McLafferty FW, Shabanowitz J, Hunt DF. Proc. Natl. Acad. Sci. U. S. A. 1989;86:9075–8. doi: 10.1073/pnas.86.23.9075. [DOI] [PMC free article] [PubMed] [Google Scholar]
- 10.Zabrouskov V, Senko MW, Du Y, Leduc RD, Kelleher NL. J. Am. Soc. Mass Spectrom. 2005;16:2027–38. doi: 10.1016/j.jasms.2005.08.004. [DOI] [PMC free article] [PubMed] [Google Scholar]
- 11.Karn RC, Petersen TE, Hjorth JP, Nieles JT, Roepstorff P. FEBS Lett. 1981;126:293–6. doi: 10.1016/0014-5793(81)80264-5. [DOI] [PubMed] [Google Scholar]
- 12.Hu S, Xie Y, Ramachandran P, Ogorzalek Loo RR, Li Y, Loo JA, Wong DT. Proteomics. 2005;5:1714–28. doi: 10.1002/pmic.200401037. [DOI] [PubMed] [Google Scholar]
- 13.Ramachandran P, Boontheung P, Xie Y, Sondej M, Wong DT, Loo JA. J. Proteome Res. 2006;6:1493–503. doi: 10.1021/pr050492k. [DOI] [PubMed] [Google Scholar]
- 14.Guo T, Rudnick PA, Wang W, Lee CS, Devoe DL, Balgley BM. J. Proteome Res. 2006;5:1469–78. doi: 10.1021/pr060065m. [DOI] [PubMed] [Google Scholar]
- 15.Messana I, Cabras T, Inzitari R, Lupi A, Zuppi C, Olmi C, Fadda MB, Cordaro M, Giardina B, Castagnola M. J. Proteome Res. 2004;3:792–800. doi: 10.1021/pr049953c. [DOI] [PubMed] [Google Scholar]
- 16.Inzitari R, Cabras T, Onnis G, Olmi C, Mastinu A, Sanna MT, Pellegrini MG, Castagnola M, Messana I. Proteomics. 2005;5:805–15. doi: 10.1002/pmic.200401156. [DOI] [PubMed] [Google Scholar]
- 17.Wolff A, Begleiter A, Moskona D. J. Dent. Res. 1997;76:1782–6. doi: 10.1177/00220345970760111001. [DOI] [PubMed] [Google Scholar]
- 18.Whitelegge JP, Gundersen C, Faull KF. Protein Sci. 1998;7:1423–1430. doi: 10.1002/pro.5560070619. [DOI] [PMC free article] [PubMed] [Google Scholar]
- 19.Biemann K, Scoble HA. Science. 1987;237:992–8. doi: 10.1126/science.3303336. [DOI] [PubMed] [Google Scholar]
- 20.Biemann K. Biomed. Environ. Mass Spectrom. 1988;16:99–111. doi: 10.1002/bms.1200160119. [DOI] [PubMed] [Google Scholar]
- 21.Semura S, Saitoh E, Sanada K, Minakata K. J. Biochem. 1991;110:648–654. doi: 10.1093/oxfordjournals.jbchem.a123634. [DOI] [PubMed] [Google Scholar]
- 22.Jonsson AP, Griffiths WJ, Bratt P, Johansson I, Stromberg N, Jornvall H, Bergman T. FEBS Lett. 2000;475:131–134. doi: 10.1016/s0014-5793(00)01645-8. [DOI] [PubMed] [Google Scholar]
- 23.Castagnola M, Cabras T, Inzitari R, Zuppi C, Rossetti DV, Petruzzelli R, Vitali A, Loy F, Conti G, Fadda MB. Eur. J. Morphol. 2003;41:93–8. doi: 10.1080/09243860412331282192. [DOI] [PubMed] [Google Scholar]
- 24.Tsur D, Tanner S, Zandi E, Bafna V, Pevzner PA. Nat. Biotechnol. 2005;23:1562–7. doi: 10.1038/nbt1168. [DOI] [PubMed] [Google Scholar]
- 25.Savitski MM, Nielsen ML, Zubarev RA. Mol. Cell. Proteomics. 2006;5:935–48. doi: 10.1074/mcp.T500034-MCP200. [DOI] [PubMed] [Google Scholar]
- 26.Robinson NE, Zabrouskov V, Zhang J, Lampi KJ, Robinson AB. Rapid Commun. Mass Spectrom. 2006;20:3535–41. doi: 10.1002/rcm.2767. [DOI] [PubMed] [Google Scholar]
- 27.Cournoyer JJ, Lin C, Bowman MJ, O'Connor PB. J Am Soc Mass Spectrom. 2007;18:48–56. doi: 10.1016/j.jasms.2006.08.008. [DOI] [PubMed] [Google Scholar]
- 28.Kjeldsen F, Haselmann KF, Sorensen ES, Zubarev RA. Anal Chem. 2003;75:1267–74. doi: 10.1021/ac020422m. [DOI] [PubMed] [Google Scholar]
- 29.Xie Y, Zhang J, Yin S, Loo JA. J. Am. Chem. Soc. 2006;128:14432–14433. doi: 10.1021/ja063197p. [DOI] [PubMed] [Google Scholar]
Associated Data
This section collects any data citations, data availability statements, or supplementary materials included in this article.