Abstract
We described linear ion-trap mass spectrometric approaches applying MS3 and MS4 toward to the structural characterization of 1-O-alk-1′-enyl-2-acyl-, 1-O-alkyl-2-acyl- and diacyl-glycerolphospholipids (GPL) as the [M – H]− ions desorbed by ESI in negative-ion mode. Further dissociation of the [M – H – R2CO2H – polar head group]− ions from the [M – H]− ions of GPL that have undergone the consecutive losses of the fatty acid substituent at sn-2 and the polar head group readily gives the structural information of the radyl group at sn-1, resulting in structural differentiation among the 1-O-alk-1′-enyl-2-acyl-, 1-O-alkyl-2-acyl and diacyl-glycerophospholipid molecules. The distinction between a 1-O-alk-1′-enyl-2-acyl- and a 1-O-alkyl-2-acyl-GPL is based on the findings that the MS3 (or MS4) spectrum of the [M – H – R2CO2H – polar head group]− ion from the former compound is dominated by the alkenoxide anion that represents the radyl moiety at sn-1, while the spectrum from the latter compound is dominated by the ion at m/z 135 arising from further loss of the 1-O-alkyl group as an alcohol. Another important notion is that the optimal collision energy required for acquiring the former spectrum is significantly lower than that required for obtaining the latter spectrum. Using the approaches, we are able to reveal the structures of several isobaric isomers in GPL mixtures of biological origin. Because the [M – H]− ions are readily formed by various GPL classes (except glycerophosphocholine) in the negative-ion mode, these mass spectrometric approaches should have broad application in the structural identification of GPLs.
Keywords: 1-O-alk-1′-enyl-2-acyl Glycerolphospholipids, 1-O-alkyl-2-acyl Glycerolphospholipids, Phosphatidylethanolamine, Phosphatidylinositol, Phosphatidylserine, Plasmalogens, Linear ion-trap mass spectrometry, ESI
Introduction
The subclasses of plasmanyl and plasmenyl lipids consist of a 1-O-alkyl and a 1-O-alk-1′-enyl group bonded to the sn-1 position of the glycerol backbone, respectively; while a fatty acyl group is attached to the sn-2 position of the glycerol backbone by an ester bond. The differentiation of a plasmenyl glycerolphopholipid (GPL) (plasmalogen) from a plasmanyl GPL by tandem mass spectrometry has been a difficult task due to the structural similarity between the two classes of compounds. Several mass spectrometric approaches have been employed. For examples, Murphy et al. described the confirmation of the plasmalogen glycerophosphoethanolamine (GPEtn) (plasmenylethanolamine) molecules in lipid mixture by comparison of the mass spectra of the lipid mixtures before and after the removal of plasmalogen GPEtn by acid treatment [1,2]. The approach is simple but destructive and resulted in a severe sample loss [3]. Hsu and Turk described tandem quadrupole mass spectrometric method to characterize plasmenyl- and plasmanyl glycerophosphocholines (GPCho) using their lithiated ions desorbed by ESI, the structures of both the plasmenyl- and plasmanyl GPCho, including the identities of the radyl groups at the glycerol backbone and the polar head group can be obtained [4]. The product-ion spectra of the [M + Li]+ ion of plasmalogen GPEtn after collisonally activated dissociation (CAD) also contain the fragment ions that readily reflect the radyl groups, leading to unambiguous structural assignment of the structure [5]. Similar results were also reported by Berry and Murphy, who described the structural identification of plasmalogen GPEtn species as the [M + H]+ ion desorbed by ESI, followed by multiple-stage IT mass spectrometry [2]. The prominent fragment ions from MS3 that reflect the fatty acyl substituent at sn-2 (seen as a [R2CO2H + 56 + H]+ ion), and the 1-O-alk-1′-enyl moiety at sn-1 (seen as a [M + H - R2CO2H - 56]+ ion) afford unambiguous assignment of plasmalogen GPEtn structures [2].
While the [M + Li]+ and [M + H]+ ions are readily formed by the GPCho and GPEtn classes upon ESI in positive-ion mode, phospholipid classes of GPEtn, glycerophosphatidic acid (GPA), glycerophosphoinositol (GPIns), glycerophosphoserine (GPSer), and glycerophosphoglycerol (GPGro) yield abundant ions in the [M – H]− form in negative-ion mode. The CAD product-ion spectra of the [M – H]− ions from diacyl glycerophopholipids have been routinely used for their structural characterization, including the assignments of the fatty acid substituents at the glycerol backbone [6,7]. By contrast, the MS2 spectra of the [M –H]− ions from both a 1-O-alkyl-2-acyl and a 1-O-alk-1′-enyl-2-acyl glycerophospholipids obtained with a triple-stage quadrupole (TSQ) or an ion-trap instrument only give the carboxylate anion at sn-2 (i.e., the R2CO2− ion) and of the ions arising from losses of the fatty acid substituent at sn-2 as an acid and as a ketene (i.e., the [M – H – R2CO2H]− and [M – H – R′2 CH=CO] − ions), respectively. These ions are informative for determination of the fatty acyl group at sn-2, but the structural information regarding to the identity of the radyl group at sn-1 is not available. Thus, differentiation of a plasmanyl GPL from a plasmenyl GPL by their MS2 product-ion spectra from the [M – H]− ions is not readily applicable.
Herein, we described the multiple-stage ion-trap mass spectrometric approaches employing MSn (n=3,4) for characterization of plasmenyl- and plasmanyl-GPLs. The distinction between the MSn (n=3,4) spectra from a 1-O-alkyl-2-acyl GPL and a 1-O-alk-1′-enyl-2-acyl GPL afforded unambiguous differentiation of a plasmenyl-GPL from a plasmanyl-GPL.
Materials and Methods
Materials
All chemicals used are in spectroscopic grade and were purchased from Sigma Chemical Co (St. Louis, MO, USA). The 1-O-octadec-1′-enyl-2-oleoyl-sn-glycero-3-phosphoethanolamine was purchased from Avanti polar lipid Co. (Alabaster, Al, USA), while the 1-O-octadecanyl-2-steroyl-sn-glycero-3-phosphoethanolamine was prepared by hydrogenation of 1-O-octadec-1′-enyl-2-oleoyl-sn-glycero-3-phosphoethanolamine. The lipid extracts from Leishmania major (L. major) and African trypanosomes were prepared as previously described [8,10].
Methods
Mass spectrometry
Low-energy CAD tandem mass spectrometry experiments were conducted on a Finnigan (San Jose, CA) Linear ion-trap (LIT) mass spectrometer (MS) with Xcalibur operating system. Accurate mass measurements were performed on a Finnigan LIT-FT instrument. Lipid solution in methanol (1–5 pmol/μL) was infused (2 μL/min) to the ESI source, where the skimmer was set at ground potential, the electrospray needle was set at 4.5 kV, and temperature of the heated capillary was 300 °C. The automatic gain control of the ion trap was set to 5 × 10⁴, with a maximum injection time of 400 ms. Helium was used as the buffer and collision gas at a pressure of 1×10⁻³ mbar (0.75 mTorr). The MSn experiments were carried out with an optimized relative collision energy ranging from 16–20% and with an activation q value at 0.25, and the activation time at 30–50 ms to leave a minimal residual abundance of precursor ion (around 20%). Mass spectra were accumulated in the profile mode, typically for 3–5 min for MS2- and MS3-spectra. The mass resolution of the instrument was tuned to 0.6 Da at half peak height.
Nomenclature
The abbreviations previously described for plasmanyl and plasmenyl (plasmalogen) lipids were used. The 1-O-alk-1′-enyl-2-acyl glycerophopholipids (plasmalogens), for example, the 1-O-octadec-1′-enyl-2-oleoyl-sn-glycero-3-phosphoethanolamine was designated as p18:0/18:1-GPEtn; while the 1-O-alkyl-2-acyl glycerolphopholipids (plasmanyl lipids), for example, the 1-O-octadecanyl-2-steroyl-sn-glycero-3-phosphoethanolamine was designated as a18:0/18:0-GPEtn. In text, we also used, for example, plasmenyl glycerophospholipid (plasmenyl-GPL) to signify the plasmalogens with the understanding that “plasmenyl” bears 1-O-alk-1′-enyl-2-acyl of sn-glycero-3-phosphate. The product-ion spectrum from MSn (n=2,3,..) experiments is designated as MSn spectrum.
Results and Discussion
Characterization of plasmenyl and plasmanyl glycerophosphoethanolamines
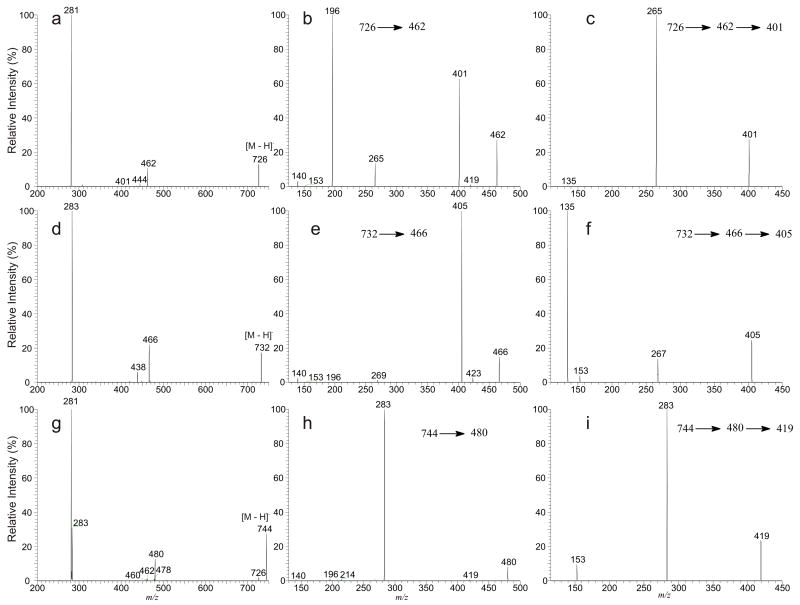
The MS2 product-ion spectrum of the [M – H]− ion of a plasmanyl or a plasmenyl-GPL obtained by a tandem quadrupole or an ion-trap instrument contains limited structural information that only the fatty acyl substituent at sn-2 can be determined. For example, the LIT MS2 spectrum of the [M – H]− ion of p18:1/18:1-GPEtn at m/z 726 (Figure 1a) contains a prominent ion at m/z 281, corresponding to a 18:1-carboxylate anion, along with the ions at m/z 462 and 444, arising from losses of the 18:1-fatty acyl substituent at sn-2 as a ketene and as an acid, respectively. These ions reflect the 18:1-fatty acid substituent at sn-2, and the ions reflecting the radyl group at sn-1 are not available. The feature ions at m/z 140 and 196 that are commonly seen for a GPEtn [10] are also absent due to the low-mass cutoff of an ion-trap instrument. These two ions, however, are readily seen in the tandem quadrupole mass spectrum of m/z 726 (data not shown) [10]. Similarly, the LIT MS2 spectrum of the [M – H]− ion of a18:0/18:0-GPEtn at m/z 732 (Figure 1d) contains a major 18:0-carboxylate anion at m/z 283, along with the ions at m/z 466 and 448, corresponding to losses of the 18:0-fatty acyl substituent at sn-2 as a ketene and as an acid, respectively. The profiles of the two spectra (Figure 1a and 1d) are nearly identical, indicating that differentiation of a plasmenylethanolamine from a plasmanylethanolamine by their MS2 spectra is not possible.
Figure 1.
The LIT MS2 spectra of the [M – H]− ions of p18:1/18:1-GPEtn at m/z 726 (a), of a18:0/18:0-GPEtn at m/z 732 (d), of 18:0/18:1- GPEtn at m/z 744 (g), their MS3 spectra of the ions at m/z 462 (726 → 462) (b), at m/z 466 (732 → 466) (e), at m/z 480 (744→ 480) (h), and their MS4 spectra of the ions at m/z 401 (726 → 462 → 401) (c), at m/z 405 (732 → 466 → 405) (f), and at m/z 419 (744 → 480 → 419) (i).
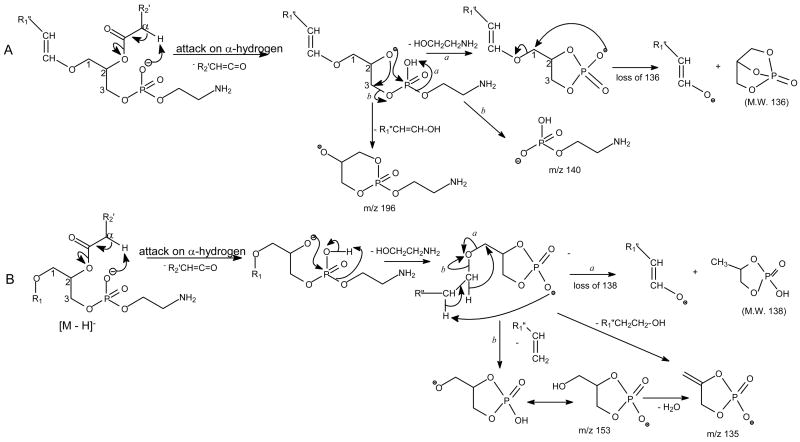
Further dissociation of the ion at m/z 462 (726 → 462) (Figure 1b) from m/z 726 gives rise to the prominent ion at m/z 196, arising from loss of the 1-O-alk-1′-enyl residue at sn-1 as an alcohol (loss of HO-CH=CH-C16H31). The prominent ion at m/z 401 arises from further loss of the ethanolamine (HOCH2CH2NH2) group, and the ions at m/z 140 and 153 probably represent a phosphoethanolamine and a 2-hydroxy-1,3-cyclophosphoric anions, respectively (Scheme 1A ). These ions signify that the compound is a GPEtn [10]. The spectrum also contains the ion at m/z 265, corresponding to an −O-CH=CH-C16H31 ion, consistent with the presence of the 1-O-alk-1′-enyl residue at sn-1. In contrast, the IT MS3 spectrum of the ion at m/z 466 (732 → 466) (Figure 1e) derived from a18:0/18:0-GPEtn is dominated by the ion at m/z 405, arising from loss of the ethanolamine residue (Scheme 1B ). The spectrum is also featured by the phophoethanolamine anion at m/z 140, along with the ion at m/z 196, arising from loss of the 1-O-octadecanyl residue as an alcohol (loss of C18H37OH). However, the ion at m/z 196 is of low abundance, consistent with the presence of the weak ion at m/z 269. The results may suggest that the cleavage of the 1-O-alkyl residue to yield an alkoxide ion or to the ion at m/z 196 by loss of an alcohol is a less facile process than cleavage of the 1-O-alk-1′-enyl residue that results in the formation of the alk-1′-enoxide ion and ion at m/z 196 seen for a plasmalogen GPEtn. The substantial differences between the two spectra arising from a plasmenylethanolamine (Figure 1b) and a plasmanylethanolamine (Figure 1e) demonstrated that multiple-stage tandem mass spectrometry employing MS3 is readily applicable in their structural identification.
Scheme 1.
The fragmentation pathways proposed for the [M – H] − ions of (A) Plasmenylethanolamine, and (B) Plasmanlyethanolamine
The MS3 spectra of m/z 462 (726 → 462) (Figure 1b) and of m/z 466 (732 → 466) (Figure 1e) are identical to MS2 spectra of the [M – H]− ions of 1-O-octadec-1′-enyl-2-lyso-sn-glycero-3-phosphoethanolamine (p18:1/0-GPEtn) at m/z 462 and of 1-O-octadecanyl-2-lyso-sn-glycero-3-phosphoethanolamine (a18:0/0-GPEtn) at m/z 466 (data not shown), respectively. These results are consistent with the notion that the ions seen at m/z 462 in Figure 1a and at m/z 466 in Figure 1d arise from m/z 726 and 732, respectively, by primary losses of the 18:1- and 18:0-fatty acyl substituents at sn-2 as a ketene, respectively.
The LIT MS2 spectrum of the [M – H]− ion from a diacyl-GPEtn is readily applicable for structural assignment. For example, the MS2 spectrum of the [M – H]− ion of 18:0/18:1-GPEtn at m/z 744 (Figure 1g) contains the ions at m/z 480 and 478 arising from losses of the 18:1-fatty acyl ketene at sn-2 and the 18:0-fatty acyl ketene at sn-1, respectively, along with the ions at m/z 281 and 283, corresponding to 18:1- and 18:0-carboxylate anions, respectively [10]. The MS3 spectrum of the ion at m/z 480 (744 → 480, Figure 1h) is dominated by the carboxylate anion at m/z 283, and the spectrum is readily distinguishable from those seen in Figure 1b and 1e. The distinction among the MS3 spectra (Figure 1b, 1e, 1h) of the analogous ions (i.e., the [M – H – R′2CH=C=O]− ions) arising from various subclasses of GPEtn demonstrated the utility of multiple-stage tandem mass spectrometry employing MS3 in the differentiation of various GPEtn subclasses.
The IT MS4 spectrum of the ion at m/z 401 (726 → 462 → 401, Figure 1c), formed from p18:1/18:1-GPEtn by consecutive losses of the 18:1-fatty acyl ketene and the ethanolamine moieties is dominated by the ion at m/z 265, corresponding to an −O-CH=CH-C16H31 ion, and the ion at m/z 135, arising from loss of a HO-CH=CH-C16H33 (268 Da) residue is of low abundance. By contrast, the IT MS3 spectrum of the ion at m/z 405 (734 → 466 → 405, Figure 1f), originated from a18:0/18:0-GPEtn is dominated by the ion at m/z 135, arising from further loss of the 1-O-alkyl ether as an alcohol (loss of HO-C18H37), along with the ion at m/z 267, probably representing an −O-CH=CH-C16H31 anion arising from neutral loss of 138 (Scheme 1B ). The optimal relative collision energy required to obtain the spectrum shown in Figure 1f is also significantly higher than that required to obtain the spectrum shown in Figure 1c (24% vs. 15%). The apparent differences in these two spectra (Figure 1c and 1f) are consistent with the notion that they arise from a plasmenylethanolamine and a plasmanylethanolamine, respectively. The MS4 spectrum of the ion at m/z 419 (744 → 480 → 419, Figure 1i) originated from m/z 744 by consecutive losses of the 18:1-fatty acyl ketene and the ethanolamine residues is also dominated by the 18:0-carboxylate anion ion at m/z 283, together with the ion at m/z 153 arising from further loss of the 18:0-fatty acyl ketene. This distinction among the MS4 spectra (Figure 1c, 1f, 1i) of the analogous ions (i.e., the [M – H – R′2CH=C=O –HOCH2CH2NH2 ]− ions) arising from various subclasses of GPEtn demonstrated that multiple-stage mass spectrometry with subsequent application of MSn (n=2, 3, 4) is readily applicable in the identification of various GPEtn subclasses. Because the product-ion spectra of the [M – H – R′2CH=C=O – HOCH2CH2NH2 ]− ions, which lead to the structural distinction, do not involve the polar head group, the approaches may also be useful in the differentiation of various subclasses of GPLs (shown later).
Characterization of plasmenyl and plasmanyl glycerophoslipids in the lipid extract from Leishmania major
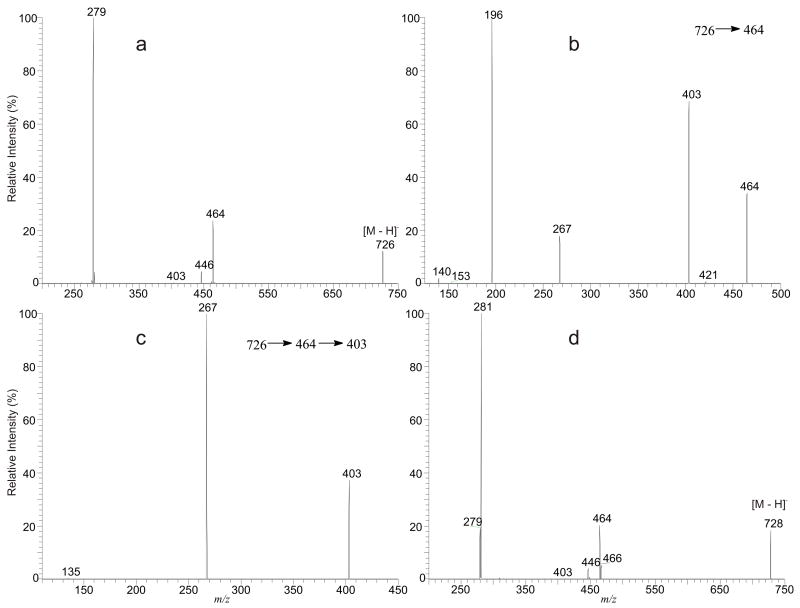
The major ions belong to the GPEtn class found in L. major were seen at m/z 726 and 728 [11]. The LIT MS2 spectrum of the ion at m/z 726 (Figure 2a) is dominated by the 18:1-carboxylate anion at m/z 279, together with the ions at m/z 464 and 446, arising from losses of the 18:2-fatty acid substituent as an acid and as a ketene, respectively. The results indicated that the compound contains a 18:2-fatty acyl moiety. Further dissociation of the ion at m/z 464 (726 → 464, Figure 2b) gives rise to the ion at m/z 403, arising from further loss of the ethanolamine group, and the ion at m/z 267, representing a −O-CH=CH-C16H33 anion. The spectrum also contains the feature ions for an GPEtn that were seen at m/z 196, arising from loss of the sn-1 1-O-alk-1′-enyl residue as an alcohol, and the ion at m/z 140, corresponding to a phosphoethanolamine anion. The profile of the spectrum is similar to that shown in Figure 1b, indicating that the compound is a p18:0/18:2-GPEtn. The structural assignment is further supported by the MS4 spectrum of the ion at m/z 403 (Figure 2c), of which the profile is identical to that shown in Figure 1c. The LIT MS2 spectrum of the ion at m/z 728 (Figure 2d) is similar to that shown in Figure 2a and its MS3 spectrum of the ion at m/z 464 (728 → 464) and MS4 spectrum of the ion at m/z 403 (728 → 464 → 403) (data not shown) are also identical to Figure 2b and Figure 2c, respectively, indicating that the ion at m/z 728 represents a p18:0/18:1-GPEtn. However, the spectrum (Figure 2d) also contains another set of the ions at m/z 279, corresponding to a 18:2-carboxylate anion and at m/z 466 and 405, arising from losses of the 18:2-fatty acyl substituenet as a ketene and as an acid, respectively. The MS3 spectrum of the ion at m/z 466 (728 → 466) and the MS4 spectrum of the ion at m/z 405 (728 → 466 → 405) (data not shown) are identical to those shown in Figure 1e and Figure 1f, respectively. The results suggested the ion at m/z 728 may also consist of an a18:0/18:2-GPEtn isomer.
Figure 2.
The LIT MS2 spectrum of the [M – H]− ion of p18:0/18:2-GPEtn at m/z 726 (a), its MS3 spectrum of the ion at m/z 464 (726 → 464) (b), its MS4 spectrum of the ion at m/z 403 (726 → 464 → 403) (c), and the MS2 spectrum of the ion at m/z 728 (d), which is consisted of both a p18:0/18:1-GPEtn and an a18:0/18:2-GPEtn structures.
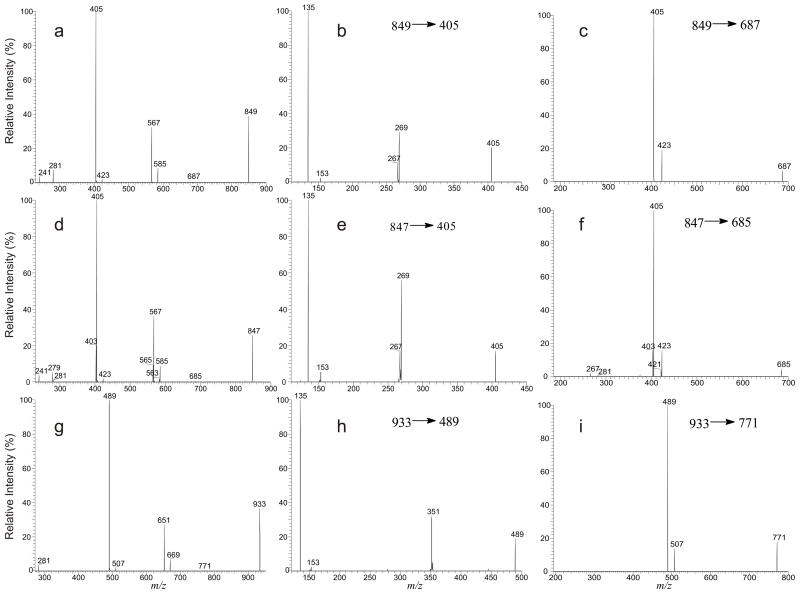
Several ions belong to the plasmanylinositol were observed. These ions were seen at m/z 847, 849 and 933, corresponding to an a18:0/18:2-GPIns, a18:0/18:1-GPIns and a24:0/18:1-GPIns, respectively [11]. The LIT MS2 spectrum of the ion at m/z 849 (Figure 3a) contains the ion at m/z 567 and 585, arising from losses of 18:1-fatty acid as an acid and as a ketene, respectively, along with the ion at m/z 281, representing a 18:1-carboxylate anion. The prominent ion at m/z 405 (567 – 162) arises from further loss of the inositol residue from m/z 567, and the ion at m/z 241 represents a inositol-1,2-cyclic phosphate anion that is commonly seen for an GPIns [11, 12]. The above results indicated that the ion at m/z 849 is a GPIns consisting of a 18:1-fatty acyl residue, probably represents an a18:0/18:1-GPIns. The assignment of the a18:0 residue is supported by the LIT MS3 spectrum of the ion at m/z 405 (849 → 405, Figure 3b), which is nearly identical to that shown in Figure 1f.
Figure 3.
The LIT MS2 spectrum of the [M – H]− ions of a18:0/18:1-GPIns at m/z 849 (a), and its MS3 spectra of the ions at m/z 405 (849 → 405) (b), and at m/z 687 (849 → 687) (c). The MS2 spectrum of the ion at m/z 847 (d), as well as its MS3 of the ions at m/z 405 (e), and at m/z 685 (f) represents mainly an a18:0/18:2-GPIns structure, along with the minor 17:0/18:2-GPIns and p18:1/18:1-GPIns species; while the MS2 spectrum of the ion at m/z 933 (g), and its MS3 spectra of the ions at m/z 489 (933 → 489) (h), and at m/z 771 (933 → 771) (i), represent an a24:0/18:1-GPIns structure.
In the same spectrum, an ion at m/z 269, probably representing a C16H33CO2−anion was also observed (Figure 3b). This minor peak may indicate the presence of a 17:0/18:1-GPIns isomer, which yielded the ion at m/z 405 by primary losses of the 18:1-fatty acid substituent and the inositol head group, followed by loss of a 136 residue, probably a bicyclic glycerophosphate ester moiety [12,13], to a 17:0-carboxylate anion at m/z 269 via the fragmentation process as seen for a diacyl-GPIns [12], a similar process that also yields the MS4 spectrum as shown in Figure 1i. The results are also consistent with the accurate mass measurement of the precursor ion with a LTQ-FT instrument, which gives a major ion at m/z 849.5856, corresponding to C45H86O12P1 (calculated mass: 849.5857) that arises from the a18:0/18:1-GPIns structure, along with a minor peak at m/z 849.5488, corresponding to C44H82O13P1 (calculated mass: 849.5493) arising from17:0/18:1-GPIns.
The LIT MS2 spectrum of the ion at m/z 847 (Figure 3d) is similar to Figure 3a. The 18:2-fatty acid substituent at sn-2 is recognized by the ions at m/z 585 and 567, arising from losses of the 18:2-fatty acid as a ketene and as an acid, respectively, along with the ion at m/z 279; while the MS3 spectrum of the ion at m/z 405 (Figure 3e, 847 → 405) is similar to Figure 1f, confirming the a18:0 structure at sn-1. The observation of the ion at m/z 269 in Figure 3e, again, indicated the presence of a 17:0-fatty acid substituent at sn-2 arising from a 17:0/18:2-GPIns isomeric structure. The results are also consistent with accurate mass measurements (data not shown). The ion pairs at m/z 583 and 565 arising from m/z 847 by losses of a 18:1-fatty acid substituent as a ketene and as an acid, respectively, along with the ion at m/z 281, representing a 18:1-carboxylate anion (Figure 3d) signify that a 18:1-fatty acid moiety is also present. These ions are formed concurrently with the ion at m/z 403 ([565 – 162] & [583–180]), deriving from further losses of the various inositol moieties from m/z 583 (i.e., loss of 180) and 565 (i.e., loss of 162). The MS3 spectrum of the ion at m/z 403 (847 → 403, data not shown) is identical to that shown in Figure 2c. These results suggest that the ion at m/z 847 may also consist of a p18:0/18:1-GPIns structure.
The LIT MS2 spectrum of the ion at m/z 933 (Figure 3g) is also similar to that of m/z 849 (Figure 3a) and the spectrum is dominated by the ion at m/z 489 (933 –C17H33CO2H – 162), an ion analogous to m/z 405 as seen in Figure 3a. The presence of the 18:1-fatty acid moiety at sn-2 is seen by the ions at m/z 651 (933 - C17H33CO2H) and 669 (933 - C16H31CHC=O), along with the 18:1-carboxylate anion at m/z 281. The MS3 spectrum of the ion at m/z 489 (933 →489, Figure 3h) contains the ion at m/z 351, arising from loss of a 138 residue as described earlier and the profile of the spectrum is similar to that of Figure 1f, suggesting that the ion at m/z 489 is derived from a plasmanyl-GPL rather than from a plasmenyl-GPL. The results support that the ion at m/z 933 is indeed an a24:0/18:1-GPIns.
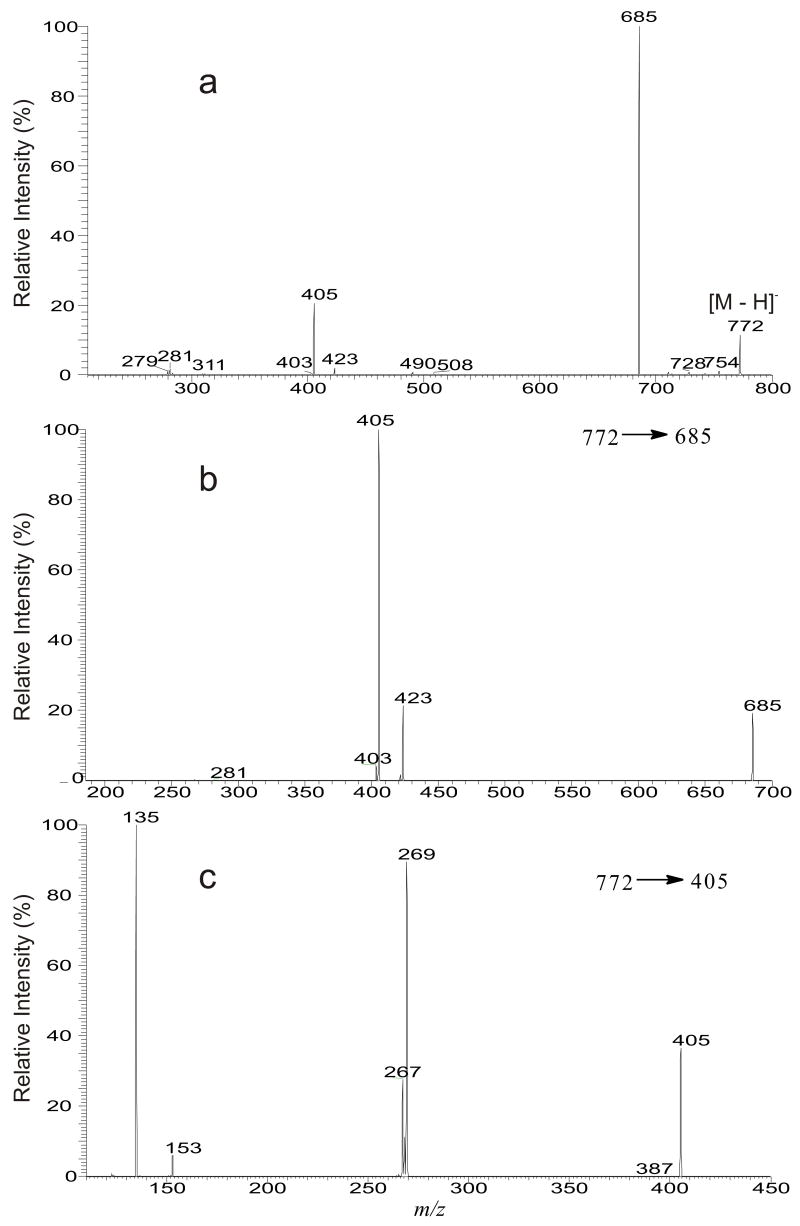
In the lipid extract obtained from African trypanosomes [9], an ion at m/z 772 was observed. The IT MS2 spectrum of the ion at m/z 772 (Figure 4a) is dominated by the ion at m/z 685, probably corresponding to loss of a serine head group (loss as [Serine – H2O]) [14]. Further dissociation of the ion at m/z 685 gives rise to ions at m/z 405 and 423, by losses of 18:2-fatty acid substituent as an acid and as a ketene, respectively (Figure 4b, 772 → 685). The spectrum also contains the ion at m/z 279, corresponding to a 18:2-carboxylate anion. The results indicate that the ion at m/z 772 is a glycereoposphoserine (GPSer) containing a 18:2-fatty acid substituent. The MS3 spectrum of the ion at m/z 405 (Figure 4c, 772 → 405) and the MS4 spectrum of the ion at m/z 405 (772 → 685 → 405, data not shown) are identical and the spectra contain the ions at m/z 267 and 135, indicating the presence of an a18:0 moiety at sn-1. The results suggest that the ion at m/z 772 is mainly an a18:0/18:2-GPSer. However, the spectrum (Figure 4c) also contains a prominent ion at m/z 269, probably representing a 17:0-carboxylate anion, together with the ion at m/z 153, arising from loss of a 17:0-fatty acid moiety as a ketene as described earlier. These ions may indicate that the ion at m/z 772 also consist of a 17:0/18:2-GPSer structure. The assignment of the minor 17:0/18:2-GPSer structure is also consistent with the results from high-resolution mass measurement of the precursor ions, which give the major ion at m/z 772.5508 corresponding to a elemental composition of C42H79O9N1P1 (calculated: 772.5492) from a18:0/18:2-GPSer, and a minor peak at m/z 772.5120 corresponding to a elemental composition of C41H75O10N1P1 (Calculated: 772.5128) from 17:0/18:2-GPSer.
Figure 4.
The LIT MS2 spectrum of the ion at m/z 772 (a), its MS3 spectrum of the ion at m/z 685 (772 → 685) (b), and its MS4 spectrum of the ion at m/z 405 (772 → 685 → 405) (c), from isobaric isomers of a18:0/18:2-GPSer, 17:0/18:2-GPSer and p18:0/18:1-GPSer.
In Figure 4a, an ion at m/z 403 (685 – 282), arising from loss of a 18:1-fatty acid moiety is also observed. The presence of this ion is consistent with the observation of the ion at m/z 281, corresponding to a 18:1-carbolylate anion, suggesting that a GPSer consisting of a 18:1-fatty acyl group may also exist. The MS3 spectrum of the ion at m/z 403 (data not shown) is identical to that shown in Figure 2c, indicating that a compound with p18:0/18:1-GPSer structure may also exist.
The ion at m/z 685 (Figure 4a) deriving from loss of a serine group from an analogous GPSer ion at m/z 772 is equivalent to a deprotonated glycerophosphoric acid (GPA) anion [14]. Similarly, the ions at m/z 687, 685, and 771 seen in the LIT MS2 spectra of the ions at m/z 849 (Figure 3a), 847 (Figure 3d), and at 933 (Figure 3g), respectively, are also equivalent to phosphatidic anions, arising from loss of an inositol group [14]. The MS3 spectra of the ions at m/z 687 (849 → 687, Figure 3c), 685 (847 → 685, Figure 3f), and 771 (933 → 771, Figure 3i) are similar to that shown in 4b, and the MS4 spectra of the ions at m/z 405 (849 → 687 → 405), 405 (847 → 685 → 405) and 489 (933 → 771 → 489) (data not shown) are also identical to Figure 3b, 3e, and 3h, respectively. These results indicate that the above LIT multiple-stage mass spectrometric method with successive application of MS2 and MS3 should also be readily feasible for identification of plasmenyl- and plasmanyl-GPA molecules.
Identification of isobaric plasmalogen glycerophosethanolamine structures in bovine brain extract
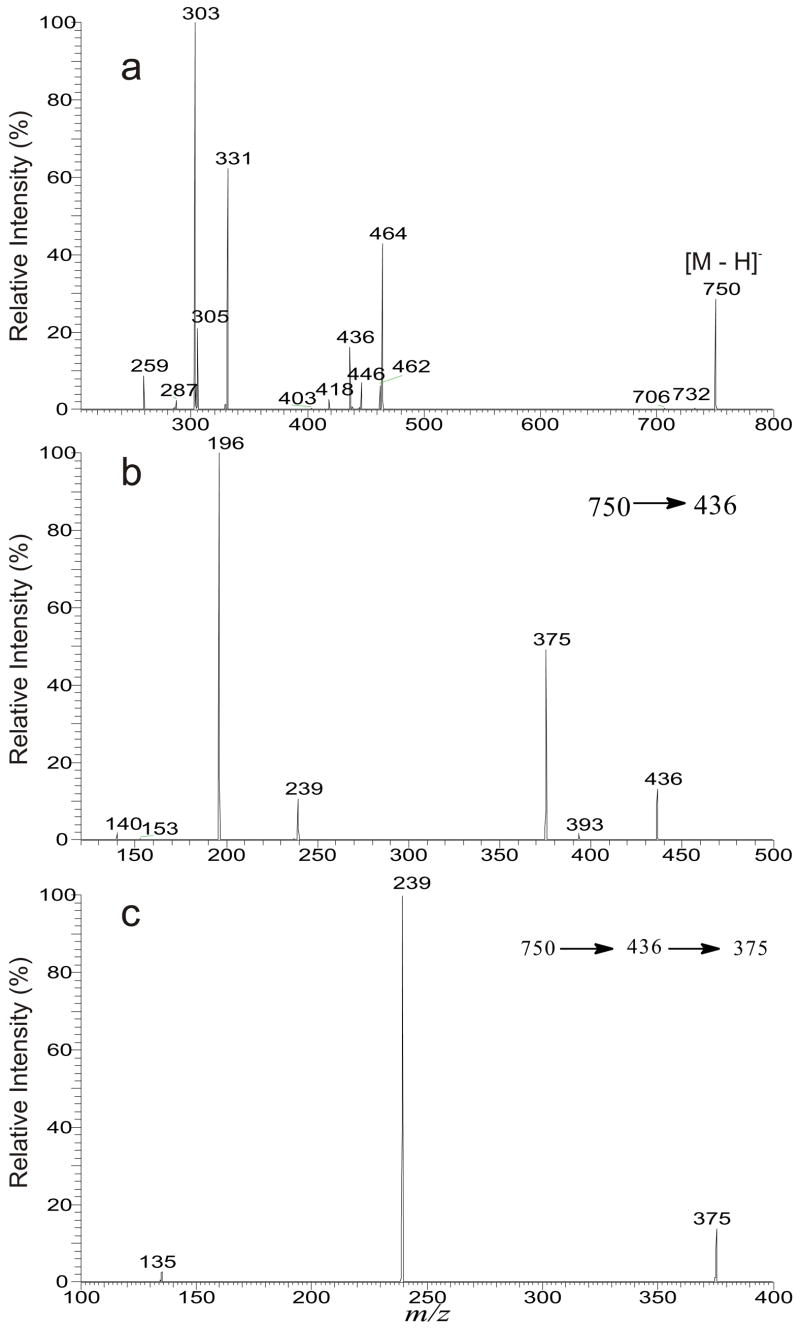
Several plasmalogen GPEtns that consist of multiple isomeric structures were seen in the lipid extract from bovine brain. For example, the LIT MS2 spectrum of the ion at m/z 750 (Figure 5a) contains the carboxylate anions at m/z 331, 305, and 303, representing the 20:4-, 20:3-, and 22:4-fatty acyl substituents, respectively. The observation of the above ions is consistent with the presence of the ion pairs at m/z 464/446, 462/444, and 436/418 arising from losses of the 20:4-, 20:3-, and 22:4-fatty acyl substituents as a ketene and as an acid, respectively. The LIT MS3 spectrum of the ions at m/z 462 (750 → 462), and at m/z 464 (750 → 464) (data not shown) are identical to Figure 1b and Figure 2b, respectively, and the profile of the MS3 spectrum of the ion at m/z 436 (Figure 5b) is also similar, suggesting that the ion at m/z 750 is consisted of a major p18:0/20:4-GPEtn molecule together with a minor p18:1/20:3-GPEtn and p16:0/22:4-GPEtn structures. These structural assignments were further supported by the MS4 spectra of the ions at m/z 403 (750 → 464 → 403) (data not shown), 401 (750 → 462 → 401) (data not shown), and at m/z 375 (750 → 436 → 375) (Figure 5c). The former two spectra are identical to those shown in Figure 2c and Figure 1c, respectively; and the profile of Figure 5c is also similar to Figure 1c (or Figure 2c) consistent with the structural assignments.
Figure 5.
The LIT MS2 spectrum of the ion at m/z 750 (a), its MS3 spectrum of the ion at m/z 436 (750 → 436) (b), and its MS4 spectrum of the ion at m/z 375 (750 → 436 → 375) (c), from a major p18:0/20:4-GPEtn structure together with two minor p18:1/20:3-GPEtn and p16:0/22:4-GPEtn isomers.
Conclusions
We demonstrated multiple-stage mass spectrometry with implement of MS3 or MS4 on the [M – H]− ions of GPL that have undergone the consecutive losses of the fatty acid substituent at sn-2 and the polar head group (i.e., the [M – H – R2CO2H – polar head group]− ions), are readily applicable in the differentiation of the plasmanyl-, plasmenyl-and diacy-glycerophospholipid subclasses of GPLs, including GPEtn, GPIns, and GPSer. Thus, structures of GPL with isobaric isomers in mixtures can be unambiguously unveiled. Because the product-ion spectrum of the [M – H – R2CO2H – polar head group]− ion that leads to the structural differentiation involves only the substituent at sn-1, this mass spectrometric approach should be also applicable for GPA and GPGro, of which the MSn (n=2, 3) spectra also contain the similar precursor ions (i.e., the [M – H –R2CO2H – polar head group]− ion) [15] that can be subjected to further dissociation.
Acknowledgments
Research at the Mass Spectrometry Resource of Washington University was supported by US Public Health Service grants P41-RR-00954, R37-DK-34388, P60-DK-20579, P01-HL-57278, and P30-DK56341. We are grateful to Dr. Stephen M. Beverley and Dr Kai Zhang of Washington University in St. Louis and Dr. Jay D. Bangs and Dr. Shaheen S. Sutterwala of University of Wisconsin for providing the lipid samples.
Footnotes
Publisher's Disclaimer: This is a PDF file of an unedited manuscript that has been accepted for publication. As a service to our customers we are providing this early version of the manuscript. The manuscript will undergo copyediting, typesetting, and review of the resulting proof before it is published in its final citable form. Please note that during the production process errors may be discovered which could affect the content, and all legal disclaimers that apply to the journal pertain.
References
- 1.Kayganich KA, Murphy RC. Fast atom bombardment tandem mass spectrometric identification of diacyl, alkylacyl, and alk-1-enylacyl molecular species of glycerophosphoethanolamine in human polymorphonuclear leukocytes. Anal Chem. 1992;64:2965–2971. doi: 10.1021/ac00047a015. [DOI] [PubMed] [Google Scholar]
- 2.Zemski Berry KA, Murphy RC. Electrospray ionization tandem mass spectrometry of glycerophosphoethanolamine plasmalogen phospholipids. J Am Soc Mass Spectrom. 2004;15:1499–1508. doi: 10.1016/j.jasms.2004.07.009. [DOI] [PubMed] [Google Scholar]
- 3.Ramansdham S, Hsu FF, Bohrer A, Nowatzke W, Ma Z, Turk J. Electrospray ionization mass spectrometric analyses of phospholipids from rat and human pancreatic islets and subcellular membranes: comparison to other tissues and implications for membrane fusion in insulin exocytosis. Biochemistry. 1998;37:4553–4567. doi: 10.1021/bi9722507. [DOI] [PubMed] [Google Scholar]
- 4.Hsu FF, Turk J, Thukkani AK, Messner MC, Wildsmith KR, Ford DA. Characterization of alkylacyl, alk-1-enylacyl and lyso subclasses of glycerophosphocholine by tandem quadrupole mass spectrometry with electrospray ionization. J Mass Spectrom. 2003;38:752–763. doi: 10.1002/jms.491. [DOI] [PubMed] [Google Scholar]
- 5.Hsu FF, Turk J. Characterization of phosphatidylethanolamine as a lithiated adduct by triple quadrupole tandem mass spectrometry with electrospray ionization. J Mass Spectrom. 2000;35:595–606. doi: 10.1002/(SICI)1096-9888(200005)35:5<595::AID-JMS965>3.0.CO;2-D. [DOI] [PubMed] [Google Scholar]
- 6.Hsu FF, Turk J. Electrospray Ionization with Low-Energy Collisionally Activated Dissociation Tandem Mass Spectrometry of Complex Lipids: Structural Characterization and Mechanisms of Fragmentation. In: Byrdwell WC, editor. Modern Methods for Lipid Analysis by Liquid Chromatography/Mass Spectrometry. AOCS Press: Champaign, IL; 2005. pp. 61–178. [Google Scholar]
- 7.Pulfer M, Murphy RC. Electrospray mass spectrometry of phospholipids. Mass Spectrom Rev. 2003;22:332–364. doi: 10.1002/mas.10061. [DOI] [PubMed] [Google Scholar]
- 8.Hsu FF, Turk J, Zhang K, Beverley SM. Characterization of Inositol Phosphorylceramides from Leishmania major by Tandem Mass Spectrometry with Electrospray Ionization. J Am Soc Mass Spectrom. 2007;18:1591–1604. doi: 10.1016/j.jasms.2007.05.017. [DOI] [PMC free article] [PubMed] [Google Scholar]
- 9.Sutterwala SS, Creswell CH, Sanyal S, Menon AK, Bangs JD, De Novo Sphingolipid Synthesis Is Essential for Viability, but Not for Transport of Glycosylphosphatidylinositol-Anchored Proteins, in African Trypanosomes. Eukaryotic Cell. 2007;6:454–464. doi: 10.1128/EC.00283-06. [DOI] [PMC free article] [PubMed] [Google Scholar]
- 10.Hsu FF, Turk J. Charge-remote and charge-driven fragmentation processes in diacyl glycerophosphoethanolamine upon low-energy collisional activation: a mechanistic proposal. J Am Soc Mass Spectrom. 2000;10:892–899. doi: 10.1016/S1044-0305(00)00159-8. [DOI] [PubMed] [Google Scholar]
- 11.Zufferey R, Allen S, Barron T, Sullivan DR, Denny PW, Almeida IC, Smith DF, Turco SJ, Ferguson MA, Beverle SM. Ether phospholipids and glycosylinositolphospholipids are not required for amastigote virulence or for inhibition of macrophage activation by Leishmania major. J Biol Chem. 2003;278:44708–44718. doi: 10.1074/jbc.M308063200. [DOI] [PubMed] [Google Scholar]
- 12.Hsu FF, Turk J. Characterization of phosphatidylinositol, phosphatidylinositol-4-phosphate, and phosphatidylinositol-4,5-bisphosphate by electrospray ionization tandem mass spectrometry: a mechanistic study. J Am Soc Mass Spectrom. 2000;11:986–999. doi: 10.1016/S1044-0305(00)00172-0. [DOI] [PubMed] [Google Scholar]
- 13.Hsu FF, Turk J. Charge-driven fragmentation processes in diacyl glycerophosphatidic acids upon low-energy collisional activation. A mechanistic proposal. J Am Soc Mass Spectrom. 2000;11:797–803. doi: 10.1016/S1044-0305(00)00151-3. [DOI] [PubMed] [Google Scholar]
- 14.Hsu FF, Turk J. Studies on phosphatidylserine by tandem quadrupole and multiple stage quadrupole ion-trap mass spectrometry with electrospray ionization: structural characterization and the fragmentation processes. J Am Soc Mass Spectrom. 2005;9:1510–1522. doi: 10.1016/j.jasms.2005.04.018. [DOI] [PubMed] [Google Scholar]
- 15.Hsu FF, Turk J. Studies on Phosphatidylglycerol with Triple Quadrupole Tandem Mass Spectrometry with Electrospray Ionization: Fragmentation Processes and Structural Characterization. J Am Soc Mass Spectrom. 2001;12:1036–1043. [Google Scholar]


