Abstract
Although it is known that innate immunity is key for protecting the body against foreign agents such as bacteria, little is known about elements of the innate immune system that have anti-tumor activity. Human Beta Defensin-1 (hBD-1), an important component of the innate immune response, is lost at high frequencies in malignant prostatic tissue, while high levels of expression are maintained in adjacent benign regions. In prostate carcinoma, frequent genetic alterations occur in the 8p22-23 region and several studies indicate there may be multiple tumor suppressor genes present within this region. The high incidence of loss of hBD-1 expression in prostate cancer, along with its chromosomal location of 8p23.2, raised the possibility that it may play a role in tumor suppression. To gain insight as to its function in prostate cancer, hBD-1 was cloned and ectopically expressed in four prostate cancer cell lines. Induction of hBD-1 expression resulted in a decrease in cellular growth in DU145 and PC3 cells. However, hBD-1 has no effect on the growth of androgen receptor (AR) positive LNCaP prostate cancer cells, but was again growth suppressive to PC3 cells with ectopic AR expression (PC3/AR+). hBD-1 also caused rapid induction of cytolysis and caspase-mediated apoptosis in DU145 and PC3 prostate cancer cells. Although the regulation of hBD-1 was not addressed in this study, our preliminary data demonstrated that the pathways involoved may include cMYC and/or PAX2. Data presented here are the first to provide evidence of its potential role in prostate cancer cell death.
Keywords: Apoptosis, Defensin, Function, hBD-1, prostate cancer, tumor immunity
1. Introduction
Prostate cancer is the most common non-cutaneous malignancy in American men and is the third leading cause of cancer-related death in males in the United States (Jemal et al., 2006). The clinical outcome of prostate cancer is closely related to tumor grade and stage, with poorly differentiated tumors having a poor prognosis (Prasad et al., 1998). Prostate tumor progression has been linked to an increase in immune suppression in prostate cancer patients (McNeel and Malkovsky, 2005). It has also been suggested that an imbalance between immune activation and suppression during tumor growth allows a tumor to escape immune destruction (Tien et al., 2005). However, little is known about specific components of the innate immune system that play a role in prostate tumor suppression.
The defensin genes, a family of 3–4 kDa polycationic peptides clustered on the short arm of chromosome 8 at segment 8p22-8p23, have been shown to act as antimicrobial agents by disrupting membrane integrity resulting in cell lysis and death (Linzmeier et al., 1999). The involvement of defensin proteins in cytotoxicity and cytolysis, with respect to tumor immunity, is gaining more attention. Human beta defensin-1 (hBD-1) is a potent “microchemokine” that attracts immature dendritic cells and memory T cells via a specific interaction with the chemokine receptor CCR6 (Yang et al., 2004). It is through this action that β-defensins are thought to play an important role in both innate and adaptive immune responses, but their role in prostate tumor progression remains unclear (Yang et al., 2004). We have previously shown that the expression of hBD-1 is lost or suppressed in 82% of malignant prostate tissue sections analyzed, whereas benign tissues generally expressed moderate to high levels of this peptide (Donald et al., 2003). Although hBD-1 expression is lost at high frequency in prostate cancer, little is known about its function or whether this phenomenon contributes to prostate tumor progression.
These observations led to the hypothesis that hBD-1 may have anti-tumor activities and that its loss may contribute to prostate tumorigenesis. In this study, we test this hypothesis by assessing the function of hBD-1 in prostate cancer. Initial screening for hBD-1 expression revealed high levels of hBD-1 expression in benign prostatic tissue and the prostate primary culture hPrEC. However, we observed a loss of hBD-1 expression in adjacent malignant prostatic tissue, as well as in DU145, PC3 and LNCaP prostate cancer cell lines. Our functional data show that the induction of hBD-1 expression resulted in rapid cell death in the late-stage prostate cancer cell lines, PC3 and DU145, but had no effect on cell viability in the early-stage prostate cancer cell line, LNCaP, or the normal prostate epithelial cell line hPrEC. The data also provides the first experimental evidence that hBD-1 may play a specific role in tumor suppression of advanced prostate cancer via a pathway involving cMYC and PAX2. Furthermore, these results support the potential utility of hBD-1 as a therapeutic agent for late-stage prostate cancer without cytotoxic effects to the host.
2. Materials and Methods
2.1 Cell culture
The prostate cancer cell lines were obtained from the American Type Culture Collection (Manassas, VA). DU145 cells were cultured in DMEM medium, PC3 and PC3/AR+ were grown in F12 medium, LNCaP were grown in RPMI medium (Life Technologies, Inc., Grand Island, NY). Growth media for all three lines was supplemented with 10% (v/v) fetal bovine serum (Life Technologies). The hPrEC primary culture was obtained from Cambrex Bio Science, Inc. (Walkersville, MD) and cells were grown in prostate epithelium basal media. All cell lines were maintained at 37° C and 5% CO2.
2.2 Tissue Samples and Laser Capture Microdissection
Prostate tissues were obtained from patients who provided informed consent prior to undergoing radical prostatectomy. Samples were acquired through the Hollings Cancer Center tumor bank in accordance with an Institutional Review Board-approved protocol. This included guidelines for the processing, sectioning, histological characterization, RNA purification and PCR amplification of samples. Prostate specimens received from the surgeons and pathologists were immediately frozen in OCT compound. Each OCT block was cut to produce serial sections which were stained and examined. Areas containing benign cells, Prostatic Intraepithelial Neoplasia (PIN), and cancer were identified and used to guide our selection of regions from unstained slides using the Arcturus PixCell II System (Sunnyvale, CA). Caps containing captured material were exposed to 20 ul of lysate from the Arcturus Pico Pure RNA Isolation Kit and processed immediately. RNA quantity and quality was evaluated using sets of primers that produce 5′ amplicons. The sets include those for the ribosomal protein L32 (the 3′ amplicon and the 5′ amplicon are 298 bases apart), for the glucose phosphate isomerase (391 bases apart), and for the glucose phosphate isomerase (842 bases apart). Ratios of 0.95 to 0.80 were routinely obtained for these primer sets using samples from a variety of prepared tissues. Additional tumor and normal samples were grossly dissected by pathologists, snap frozen in liquid nitrogen and evaluated for hBD-1 and cMYC expression.
2.3 Cloning of hBD-1 Gene
hBD-1 cDNA was generated from RNA by reverse transcription-PCR using primers generated from the published hBD-1 sequence (Accession No. U50930) (Ganz, 2004). The PCR primers were designed to contain ClaI and KpnI restriction sites. hBD-1 PCR products were restriction digested with ClaI and KpnI and ligated into a TA cloning vector. The TA/hBD-1 vector was then transfected into the XL-1 Blue strain of E. coli by heat shock and individual clones were selected and expanded. Plasmids were isolated by Cell Culture DNA Midiprep (Qiagen, Valencia, CA) and sequence integrity verified by automated sequencing. The hBD-1 gene fragment was then ligated into the pTRE2 digested with ClaI and KpnI, which served as an intermediate vector for orientation purposes. The pTRE2/hBD-1 construct was digested with ApaI and KpnI to excise the hBD-1 insert. The insert was ligated into pIND vector of the Ecdysone Inducible Expression System (Invitrogen, Carlsbad, CA) also double digested with ApaI and KpnI. The construct was again transfected into E. coli and individual clones were selected and expanded. Plasmids were isolated and sequence integrity of pIND/hBD-1 was again verified by automated sequencing.
2.4 Transfection
Cells (1 × 10⁶) were seeded onto 100-mm Petri dishes and grown overnight. Next, the cells were co-transfected using Lipofectamine 2000 (Invitrogen) with 1 μg of pvgRXR plasmid, which expresses the heterodimeric ecdysone receptor, and 1 μg of the pIND/hBD-1 vector construct or pIND/β-galactosidase (β-gal) control vector in Opti-MEM media (Life Technologies, Inc.). Transfection efficiency was determined by inducing β-gal expression with Ponasterone A (PonA) and staining cells with a β-galactosidase detection kit (Invitrogen). Assessment of transfection efficiency by counting positive staining (blue) colonies which demonstrated that 60–85% of cells expressed β-galactosidase for the cell lines.
2.5 Immunocytochemistry
In order to verify hBD-1 protein expression, DU145 and hPrEC cells were seeded onto 2-chamber culture slides (BD Falcon, USA) at 1.5–2 × 10⁴ cells per chamber. DU145 cells transfected with pvgRXR alone (control) or with the hBD-1 plasmid were induced for 18 hours with media containing 10 μM Pon A, while untransfected cells received fresh growth media. Following induction, cells were washed in 1x PBS and fixed for 1 hour at room temperature with 4% Paraformaldehyde. Cells were then washed 6 times with 1x PBS and blocked in 1x PBS supplemented with 2% BSA, 0.8% normal goat serum (Vector Laboratories, Inc., Burlingame, CA) and 0.4% Triton-X 100 for 1 hour at room temperature. Next, cells were incubated overnight in primary rabbit anti-human BD-1 polyclonal antibody (PeproTech Inc., Rocky Hill, NJ) diluted 1:1000 in blocking solution. Following this, cells were washed 6 times with blocking solution and incubated 1 hour at room temperature in Alexa Fluor 488 goat anti-rabbit IgG (H+L) secondary antibody at a dilution of 1:1000 in blocking solution. After washing cells with blocking solution 6 times, coverslips were mounted with Gel Mount (Biomeda, Foster City, CA). Finally, cells were viewed under differential interference contrast (DIC) and under laser excitation at 488 nm. The fluorescent signal was analyzed using a confocal microscope (Zeiss LSM 5 Pascal) and a 63x DIC oil lens with a Vario 2 RGB Laser Scanning Module. The digital images were exported into Photoshop CS Software (Adobe Systems) for image processing and hard copy presentation.
2.6 RNA Isolation and Quantitative RT-PCR
QRT-PCR was performed as previously described (Gibson et. al, 2007). Briefly, total RNA (0.5 μg per reaction) from tissue sections were reverse transcribed into cDNA utilizing random primers (Promega). Two-step QRT-PCR was performed on cDNA generated using the MultiScribe Reverse Transcriptase from the TaqMan Reverse Transcription System and the SYBR Green PCR Master Mix (Applied Biosystems, Foster City, CA). The primer pairs for hBD-1, c-MYC and PAX2 were generated from the published sequences (Table 1). Forty cycles of PCR were performed under standard conditions using an annealing temperature of 56.4°C for hBD-1 and c-MYC and 55°C for PAX2. In addition, β-Actin (Table 1) was amplified as a housekeeping gene to normalize the initial content of total cDNA. Gene expression in benign prostate tissue samples was calculated as the expression ratio compared to β-Actin. Levels of hBD-1 expression in malignant prostate tissue, hPREC prostate primary culture, and prostate cancer cell lines before and after induction were calculated relative to the average level of hBD-1 expression in hPrEC cells. As a negative control, QRT-PCR reactions without cDNA template were also performed. All reactions were run a minimum of three times.
Table 1. Sequences of QRT-PCR Primers.
Nucleotide sequences of primers used to amplify hBD-1, cMyc, PAX2, and β-Actin.
| Sense (5′-3′) | Antisense (5′-3′) | |
|---|---|---|
| β-Actin | 5′-CCTGGCACCCAGCACAAT-3′ | 5′-GCCGATCCACACGGAGTACT-3′ |
| hBD-1 | 5′-TCAGCAGTGGAGGGCAATG-3′ | 5′-CCTCTGTAACAGGTGCCTTGAAT-3′ |
| cMYC | 5′-ACAGCAAACCTCCTCACAGCC-3′ | 5′-TGGAGACGTGGCACCTCTTG-3′ |
2.7 MTT Cell Viability Assay
To examine the effects of hBD-1 on cell growth, we performed metabolic 3-[4,5-dimethylthiazol-2yl]-2,5-diphenyl tetrazolium bromide (MTT) assay. DU145, LNCaP, PC3 and PC3/AR+ cells co-transfected with pvgRXR plasmid and pIND/hBD-1 construct or control pvgRXR plasmid were seeded onto a 96-well plate at 1–5 × 10³ cells per well. Twenty-four hours after seeding, fresh growth medium was added containing 10 μM Pon A daily to induce hBD-1 expression for 24, 48 and 72 hours after which the MTT assay was performed according to the manufacturer’s instructions (Promega). Reactions were performed three times in triplicate.
2.8 Analysis of Membrane Integrity
Acridine orange (AO)/ethidium bromide (EtBr) dual staining was performed to identify changes in cell membrane integrity, as well as apoptotic cells by staining the condensed chromatin. AO stains viable cells and early apoptotic cells, whereas EtBr stains late stage apoptotic cells that have compromised membranes. Briefly, PC3, DU145 and LNCaP cells were seeded into 2-chamber culture slides (BD Falcon). Cells transfected with empty plasmid or hBD-1 plasmid were induced for 24 or 48 hours with media containing 10 μM Pon A, while control cells received fresh growth media at each time point. After induction, cells were washed once with PBS and stained with 2 ml of a mixture (1:1) of AO (Sigma, St. Louis, MO) and EtBr (Promega) (5 μg/ml) solution for 5 min and were again washed with PBS.
Fluorescence was viewed by a Zeiss LSM 5 Pascal Vario 2 Laser Scanning Confocal Microscope (Carl Zeiss). The excitation color wheel contains BS505-530 (green) and LP560 (red) filter blocks which allowed for the separation of emitted green light from AO into the green channel and red light from EtBr into the red channel. The laser power output and gain control settings within each individual experiment were identical between control and hBD-1 induced cells. The excitation was provided by a Kr/Ar mixed gas laser at wavelengths of 543 nm for AO and 488 nm for EtBr. Slides were analyzed under 40x magnification and digital images were stored as uncompressed TIFF files and exported into Photoshop CS software (Adobe Systems) for image processing and hard copy presentation.
2.9 Flow Cytometry
PC3 and DU145 cells transfected with the hBD-1 expression system were grown in 60-mm dishes and induced for 12, 24, and 48 hours with 10 μM Pon A. Following each incubation period, the medium was collected from the plates (to retain any detached cells) and combined with PBS used to wash the plates. The remaining attached cells were harvested by trypsinization and combined with the detached cells and PBS. The cells were then pelleted at 4°C (500 × g) for 5 min, washed twice in PBS, and resuspended in 100 μl of 1x Annexin binding buffer (0.1 M Hepes/NaOH at pH 7.4, 1.4 M NaCl, 25 mM CaCl2) containing 5 μl of Annexin V-FITC and 5 μl of PI. The cells were incubated at RT for 15 min in the dark, then diluted with 400 μl of 1x Annexin binding buffer and analyzed by FACscan (Becton Dickinson, San Jose, CA). All reactions were performed three times.
2.10 Caspase Detection
Detection of caspase activity in the prostate cancer cell lines was performed using an APO LOGIX™ Carboxyfluorescin Caspase detection kit (Cell Technology, Mountain View, CA). Active caspases were detected through the use of the carboxyfluorescein labeled peptide fluoromethyl ketone (FAM-VAD-FMK) that irreversibly binds to active caspases. Briefly, DU145 and LNCaP cells (1.5–3 × 10⁵) containing the hBD-1 expression system were plated in 35 mm glass bottom dishes (Matek, Ashland, MA) and treated for 24 hours with media only or with media containing Pon A as previously described. Next, 10 μl of a 30X working dilution of FAM-VAD-FMK was added to 300 μl of media and added to each 35 mm dish. Cells were then incubated for 1 hour at 37° C under 5% CO2. The medium was aspirated and the cells were washed twice with 2 ml of a 1x working dilution Wash Buffer. Cells were viewed under differential interference contrast (DIC) or under laser excitation at 488 nm. The fluorescent signal was analyzed using a confocal microscope (Zeiss LSM 5 Pascal) and a 63x DIC oil lens with a Vario 2 RGB Laser Scanning Module.
2.11 siRNA Silencing of PAX2
SiRNA knock-down and verification was performed as previously described (Gibson, et al, 2007). Briefly, a pool of four complementary siRNAs targeting human PAX2 mRNA (Accession No. NM_003989.1) were synthesized (Dharmacon Research, Lafayette, CO, USA). In addition, a second pool of four siRNAs was used as an internal control to test for the specificity of PAX2 siRNAs. SiRNA molecules were coated with CodeBreaker transfection reagent (Promega, Inc.) according to manufacturer’s directions prior to treatment.
2.12 Statistical Analysis
Statistical analysis was performed by using the Student’s t-test for unpaired values. P values were determined by a two-sided calculation, and a P value of less than 0.05 was considered statistically significant. Statistical differences are indicated by asterisks.
3. Results
3.1 hBD-1 Expression in Prostate Tissue
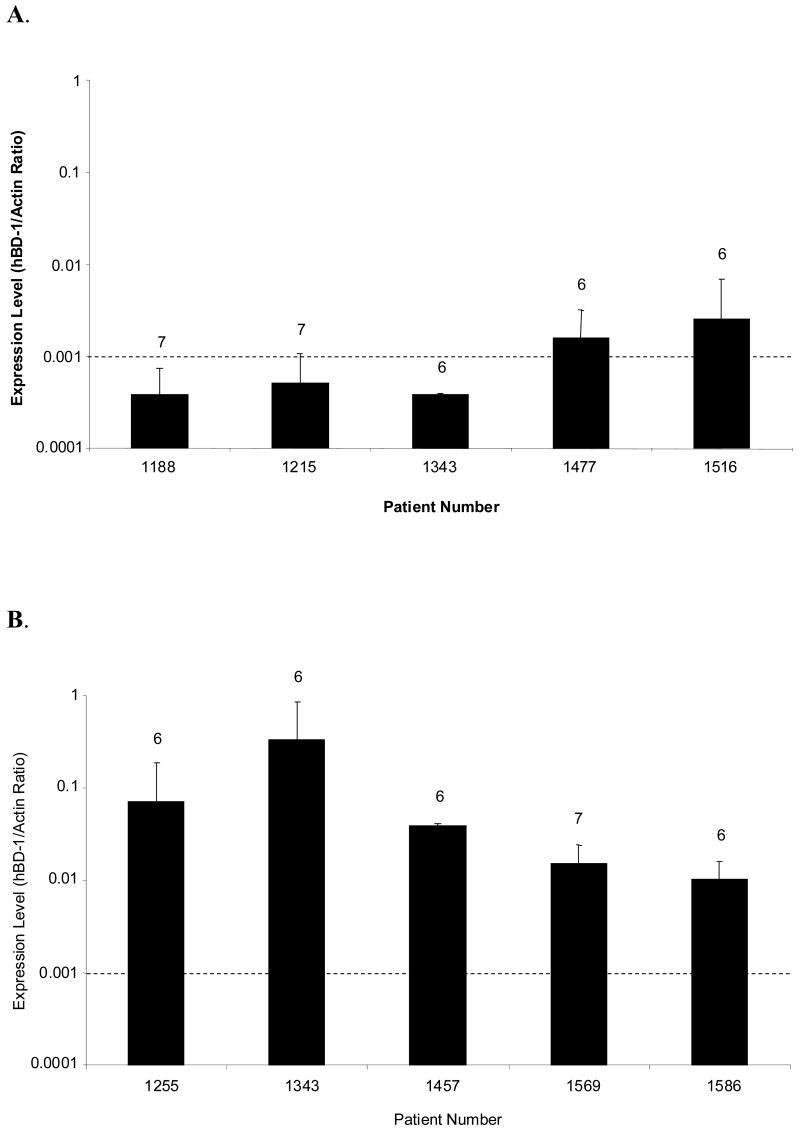
We previously demonstrated that 82% of prostate cancer frozen tissue sections analyzed exhibited little or no expression of hBD-1 (Donald et al., 2003). In that study we observed a potential correlation between clinical prostate samples with little or no expression of hBD-1 and higher rates of cancer recurrence (unpublished data). To compare hBD-1 expression levels, QRT-PCR analysis was performed on normal prostate tissue obtained by gross dissection or LCM of normal prostate tissue adjacent to malignant regions which were randomly chosen. Here, hBD-1 was detected in all of the gross dissected normal clinical samples with a range of expression that represents an approximately 6.6-fold difference in expression levels (Figure 1A). LCM captured normal tissue samples expressed hBD-1 at levels in a range that represents a 32-fold difference in expression (Figure 1B). Matching sample numbers to corresponding patient profiles revealed that in most cases, the hBD-1 expression level was higher in patient samples with a Gleason score of 6 than in patient samples with a Gleason score of 7. In addition, a comparison of hBD-1 expression levels in tissue obtained by gross dissection and LCM from the same patient, #1343, demonstrated an 854-fold difference in expression between the two isolation techniques. Therefore, our results strongly suggest that LCM may provide a more sensitive technique to assess hBD-1 expression in prostate tissue.
Figure 1. Analysis of hBD-1 Expression in Human Prostate Tissue.
hBD-1 relative expression levels were compared in normal clinical samples from patients that underwent radical prostatectomies. The dashed line serves as a point of reference to compare values obtained between gross and LCM-derived specimen, and corresponding Gleason scores are indicated above each bar. A, hBD-1 expression levels were compared in tissues obtained by gross dissection. B, hBD-1 expression levels were compared in tissue obtained by Laser Capture Microdissection.
3.2 hBD-1 Expression in Prostate Cell Lines
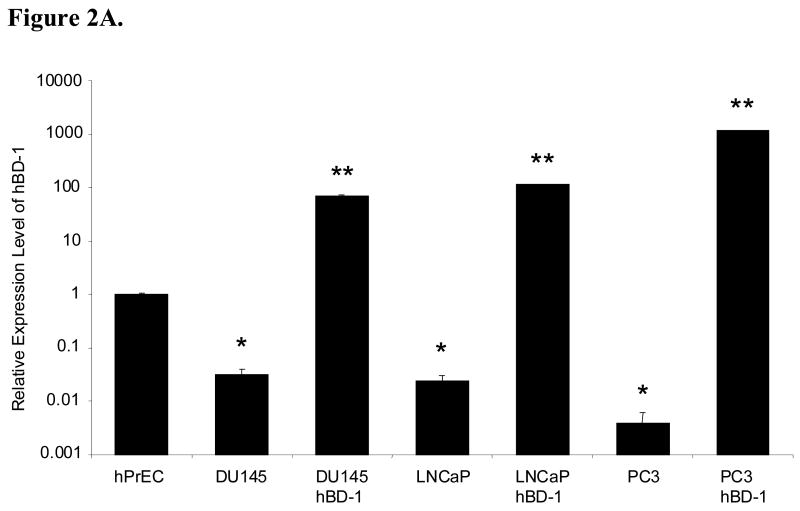
To verify upregulation of hBD-1 in the prostate cancer cell lines after transfection with the hBD-1 expression system, QRT-PCR was performed. In addition, no template negative controls were also performed, and amplification products were verified by gel electrophoresis (data not shown). Here, hBD-1 expression was significantly lower in the prostate cancer cell lines compared to hPrEC cells. Following a 24 hour induction period, relative expression levels of hBD-1 significantly increased in DU145, PC3 and LNCaP as compared to the cell lines prior to hBD-1 induction (Figure 2A).
Figure 2. Analysis of hBD-1 Expression in Prostate Cell Lines.
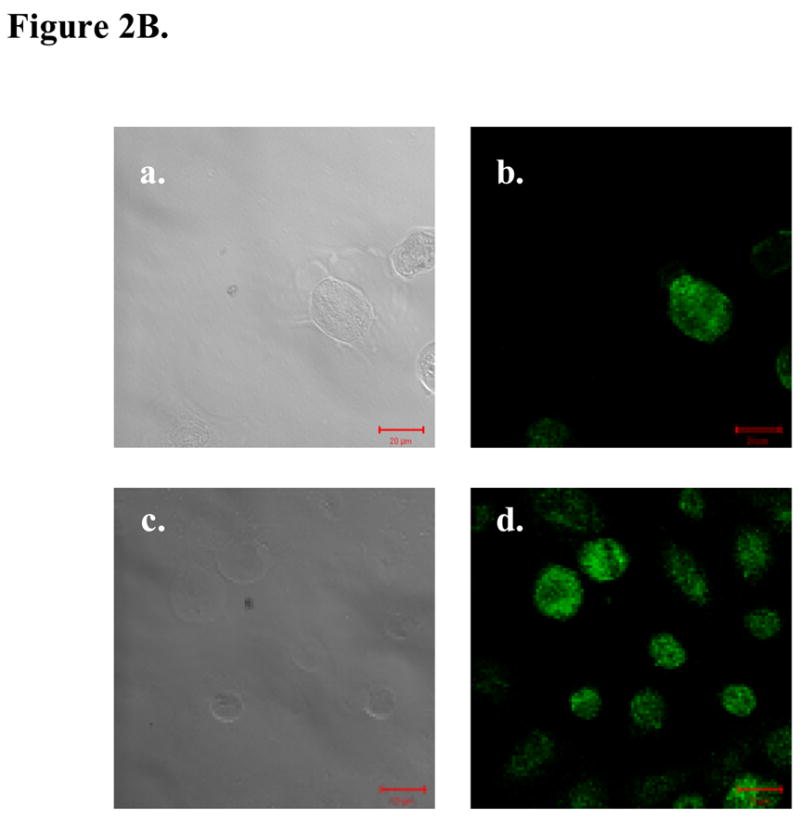
A, hBD-1 expression levels were compared relative to hPrEC cells in prostate cancer cell lines before and after hBD-1 induction. A single asterisk represents statistically lower expression levels compared to hPrEC. Double asterisks represent statistically significant levels of expression compared to the cell line before hBD-1 induction (Student’s T-test, p<0.05). B, Ectopic hBD-1 expression was verified in the prostate cancer cell line DU145 by immunocytochemistry. hPrEC cells were stained for hBD-1 as a positive control (A: DIC and B: Fluorescence). DU145 cells were transfected with hBD-1 and induced for 18 hours (C: DIC and D: Fluorescence). Size bar= 20 μM.
Next, we verified protein expression of hBD-1 in DU145 cells transfected with the hBD-1 expression system after induction with Pon A by immunocytochemistry. As a positive control, hBD-1 expressing hPrEC prostate epithelial cells were also examined. Cells were stained with primary antibody against hBD-1 and protein expression was monitored based on the green fluorescence of the secondary antibody (Figure 2B). Analysis of cells under DIC verify the presence of hPrEC cells and DU145 cells induced for hBD-1 expression at 18 hours. Excitation by the confocal laser at 488 nm produced revealed green fluorescence indicating the presence of hBD-1 protein in hPrEC as a positive control. However, there was no detectable green fluorescence in control DU145 cells and empty plasmid induced DU145 cells (data not shown) demonstrating no hBD-1 expression. Confocal analysis of DU145 cells induced for hBD-1 expression revealed green fluorescence indicating the presence of hBD-1 protein following induction with Pon A.
3.3 Expression of hBD-1 Results in Decreased Cell Viability
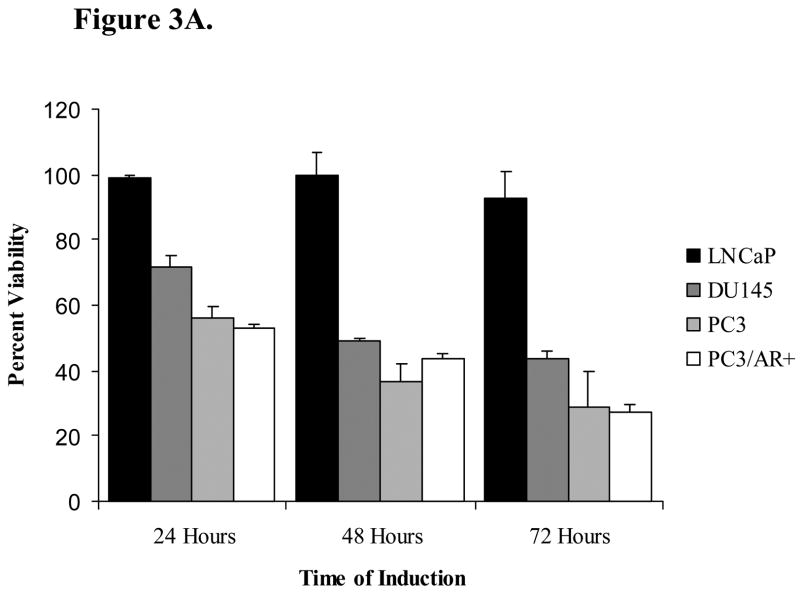
We performed an MTT assay to assess the effect of hBD-1 expression on relative cell viability in DU145, PC3, PC3/AR+ and LNCaP prostate cancer cell lines. MTT analysis with empty vector exhibited no statistical significant change in cell viability (data not shown). Twenty-four hours following hBD-1 induction, relative cell viability was 72% in DU145 and 56% in PC3 cells, and after 48 hours cell viability was reduced to 49% in DU145 and 37% in PC3 cells (Figure 3A). Following 72 hours of hBD-1 induction, relative cell viability decreased further to 44% in DU145 and 29% PC3 cells. Conversely, there was no significant effect on the viability of LNCaP cells. In order to assess whether the resistance to hBD-1 cytotoxicity observed in LNCaP was due to the presence of the androgen receptor (AR), we examined the hBD-1 cytotoxicity in PC3 cells with ectopic AR expression (PC3/AR+). Here, there was no difference between PC3/AR+ and PC3 cells. Therefore, the data suggests that that hBD-1 is cytotoxic specifically to late-stage prostate cancer cells.
Figure 3. Analysis of hBD-1 Cytotoxicity in Prostate Cancer Cells.
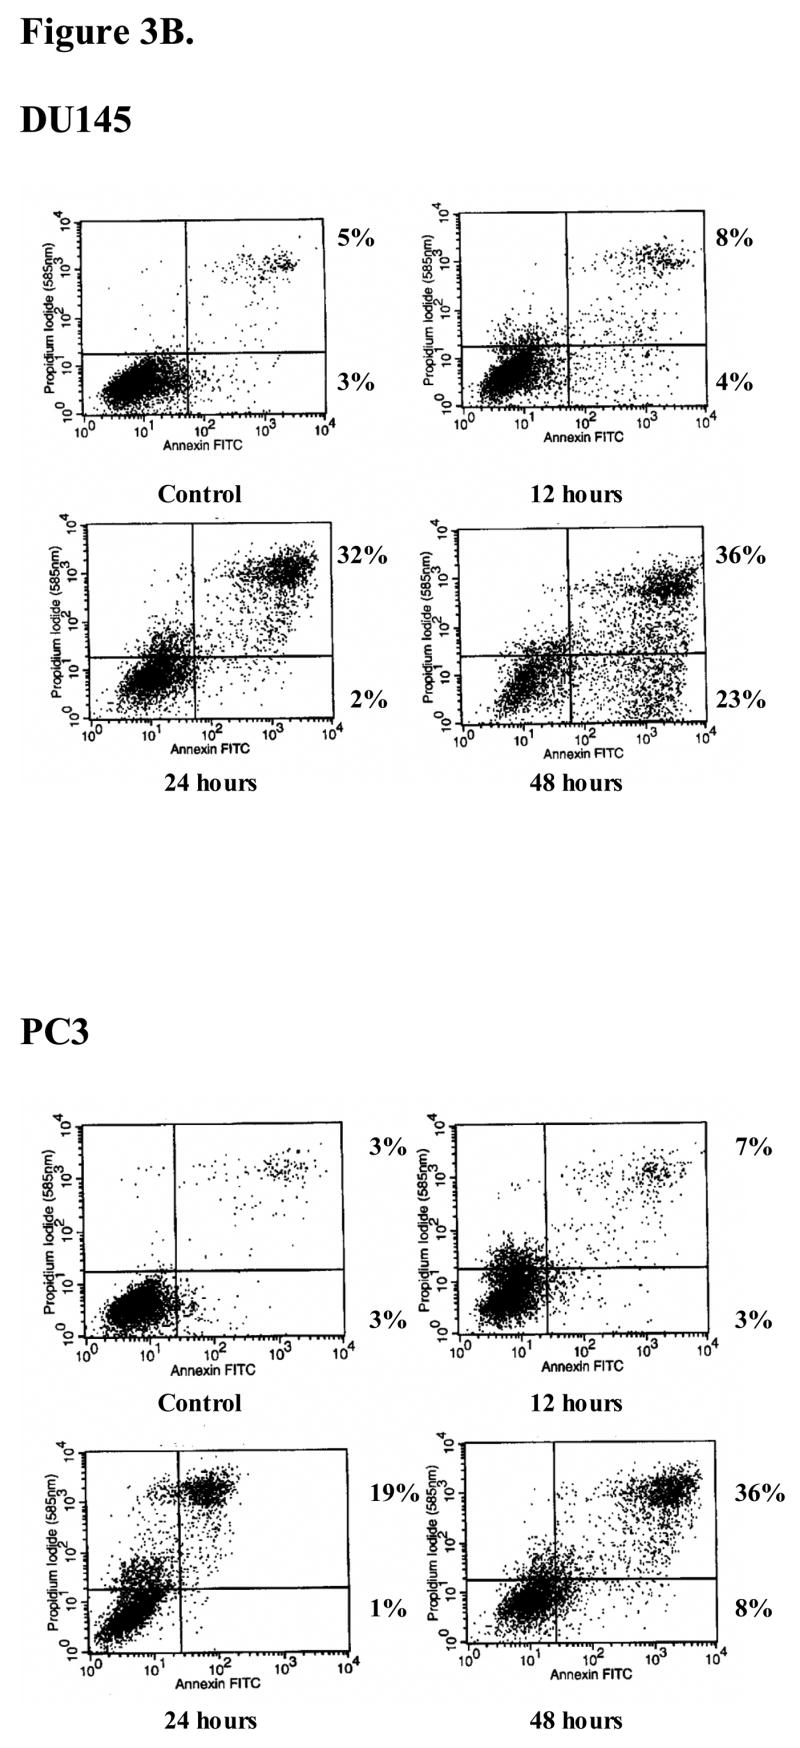
A, the prostate cell lines DU145, PC3, PC3/AR+ and LNCaP were treated with Pon A to induce hBD-1 expression for 1–3 days after which MTT assay was performed to determine cell viability. Each bar represents the mean ± S.E.M. of three independent experiments performed in triplicate. B, cells positive for propidium iodide and annexin V were considered apoptotic. Times of induction are shown under each panel. Numbers next to the boxes for each time point represent the percentages of propidium iodide (PI)− annexin V+ cells (lower right quadrant), and PI+ annexin V+ cells (upper right quadrant).
In order to determine whether the effects of hBD-1 on PC3 and DU145 were cytostatic or cytotoxic, FACS analysis was performed to measure cell death. Under normal growth conditions, more than 90% of PC3 and DU145 cultures were viable and non-apoptotic (lower left quadrant) and did not stain with annexin V or PI (Figure 3B). After inducing hBD-1 expression in PC3 cells, the number of cells undergoing early apoptosis and late apoptosis/necrosis (lower and upper right quadrants, respectively) totaled 10% at 12 hours, 20% at 24 hours, and 44% at 48 hours. For DU145 cells, the number of cells undergoing early apoptosis and late apoptosis/necrosis totaled 12% after 12 hours, 34% at 24 hours, and 59% after 48 hours of induction. No increase in apoptosis was observed in cells containing empty plasmid following induction with Pon A (data not shown). Annexin V and propidium iodide uptake studies have demonstrated that hBD-1 has cytotoxic activity against DU145 and PC3 prostate cancer cells and results indicate apoptosis as a mechanism of cell death.
3.4 hBD-1 Causes Alterations in Membrane Integrity and Caspase Activation
We investigated whether the cell death observed in prostate cancer cells after hBD-1 induction is caspase-mediated apoptosis. To better understand the cellular mechanisms involved in hBD-1 expression, confocal laser microscopic analysis was performed (Figure 4A) on DU145 and LNCaP cells induced for hBD-1 expression. Pan-caspase activation was monitored based on the binding and cleavage of green fluorescing FAM-VAD-FMK to caspases in cells actively undergoing apoptosis. Analysis of cells under DIC showed the presence of viable control DU145 (A), and LNCaP (E) cells at 0 hours. Excitation by the confocal laser at 488 nm produced no detectable green staining which suggests no caspase activity in DU145 (B) or LNCaP (F) control cells. Following induction for 24 hours, DU145 (C) and LNCaP (G) cells were again visible under DIC. Confocal analysis under fluorescence revealed green staining in DU145 (D) cells indicating pan-caspase activity after the induction of hBD-1 expression. However, there was no green staining in LNCaP (H) cells induced for hBD-1 expression. Therefore, cell death observed following induction of hBD-1 is caspase-mediated apoptosis.
Figure 4. Analysis of hBD-1 mediated cell death.
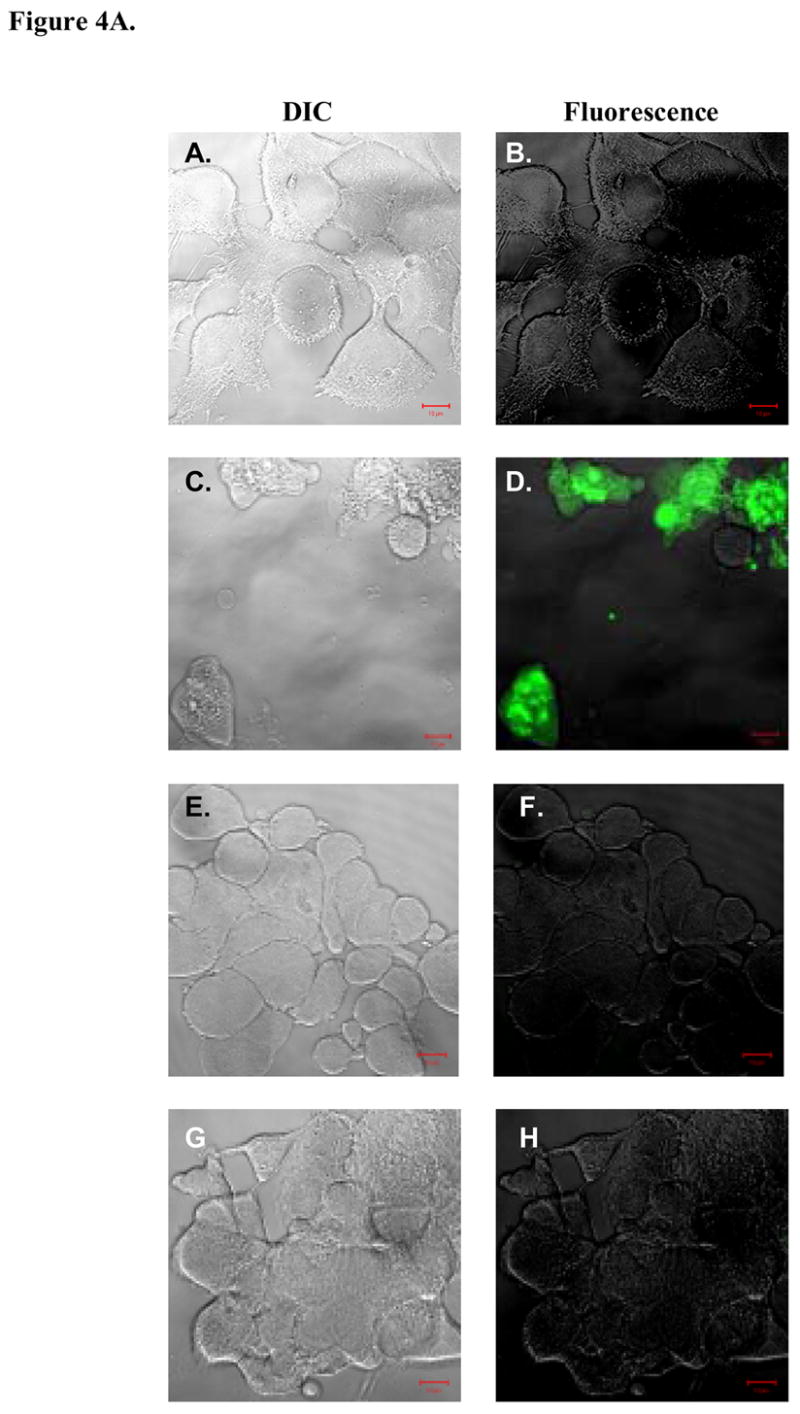
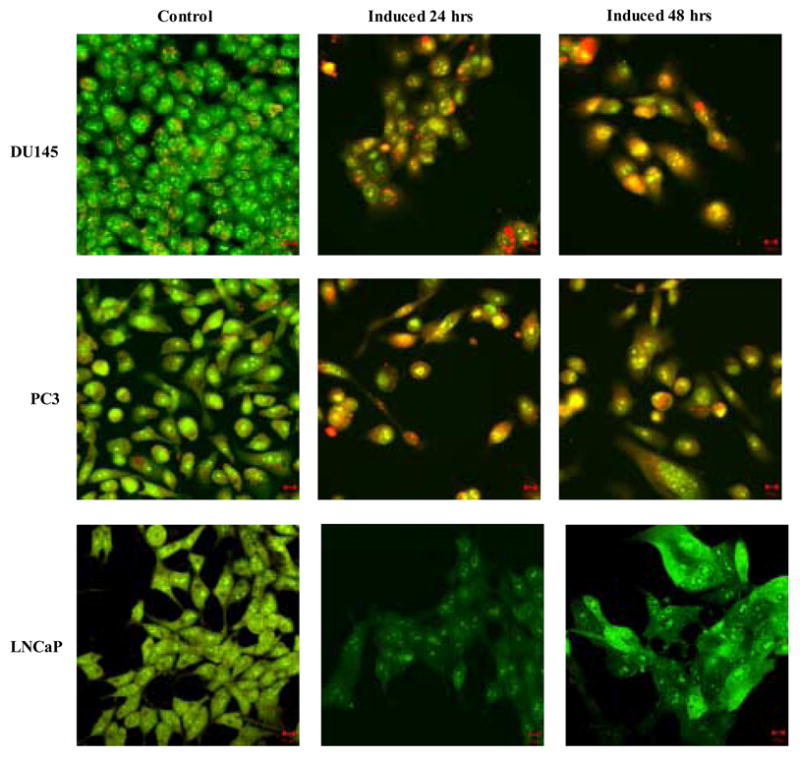
A, DIC visualization of DU145 cells before (A) and after (C) hBD-1 induction, and LNCaP cells before (E) and after (G) induction. Fluorescence analysis revealed no caspase activity in control DU145 (B) and LNCaP (F) cells. However, cells treated with Pon A for 24 hours to induce hBD-1 revealed caspase activity in DU145 (D), but not in LNCaP (H). B, membrane integrity of DU145, PC3 and LNCaP was analyzed by confocal microscopy 24 and 48 hours after hBD-1 induction. Green staining indicates the localization of AO, red staining represents EtBr and yellow staining represents the co-localization of both AO and EtBr. Size bars= 10 μM.
The proposed mechanism of antimicrobial activity of defensin peptides is the disruption of the microbial membrane due to pore formation (Papo and Shai, 2005). In order to determine if hBD-1 expression altered membrane integrity EtBr uptake was examined by confocal analysis (Figure 4B). Intact cells were stained green due to AO which is membrane permeable, while only cells with compromised plasma membranes stained red due to incorporation of membrane impermeable EtBr. Control DU145 and PC3 cells stained positively with AO and emitted green color, but did not stain with EtBr. However, hBD-1 induction in both DU145 and PC3 resulted in the accumulation of EtBr in the cytoplasm at 24 hours as indicated by the red staining. By 48 hours, DU145 and PC3 possessed condensed nuclei and appeared yellow due to the co-localization of green and red staining from AO and EtBr, respectively. Conversely, there were no observable alterations to membrane integrity in LNCaP cells after 48 hours of induction as indicated by positive green fluorescence with AO, but lack of red EtBr fluorescence. This finding suggests that alterations to membrane integrity and permeabilization in response to hBD-1 expression differ between early- and late-stage prostate cancer cells.
3.5 Comparison of hBD-1 and cMYC Expression Levels
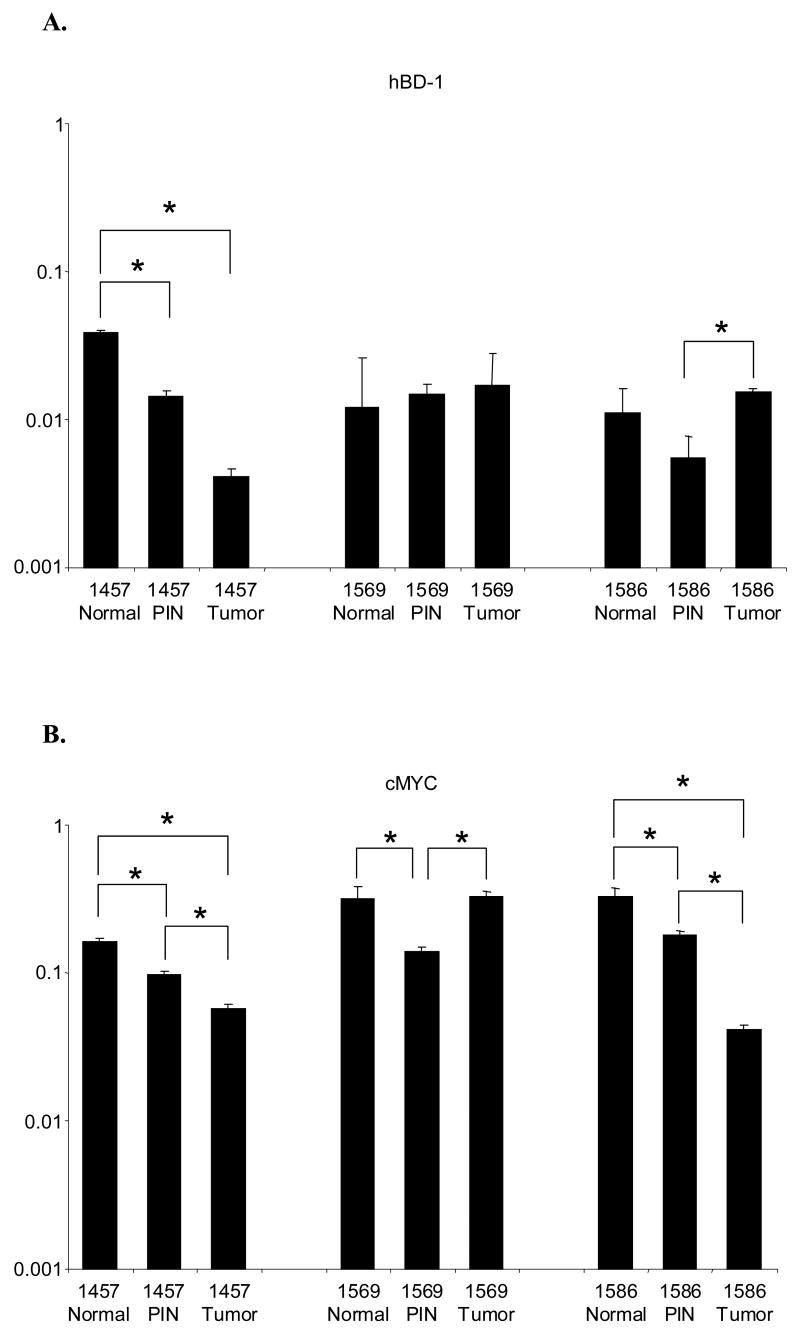
QRT-PCR analysis was performed on LCM prostate tissue sections from three patients (Figure 5). In patient #1457, hBD-1 expression exhibited a 2.7-fold decrease from normal to PIN, a 3.5-fold decrease from PIN to tumor and a 9.3-fold decrease from normal to tumor (Figure 5A). Likewise, we observed cMYC expression followed a similar expression pattern in patient # 1457 where expression decreased by 1.7-fold from normal to PIN, 1.7-fold from PIN to tumor and 2.8-fold from normal to tumor (Figure 5B). In addition, there was a statistically significant decrease in cMYC expression in the other two patients. Patient # 1569 had a 2.3-fold decrease from normal to PIN, while in patient # 1586 there was a 1.8-fold decrease from normal to PIN, a 4.3-fold decrease from PIN to tumor and a 7.9-fold decrease from normal to tumor.
Figure 5. QRT-PCR analysis of hBD-1 and cMYC expression in LCM human prostate tissue sections of normal, PIN and tumor.
Expression for each gene is presented as expression ratios compared to β-actin. A, Comparison of hBD-1 expression levels in normal, PIN and tumor sections. B, Comparison of cMYC expression level in normal, PIN and tumor sections.
3.6 Induction of hBD-1 Expression Following PAX2 Inhibition
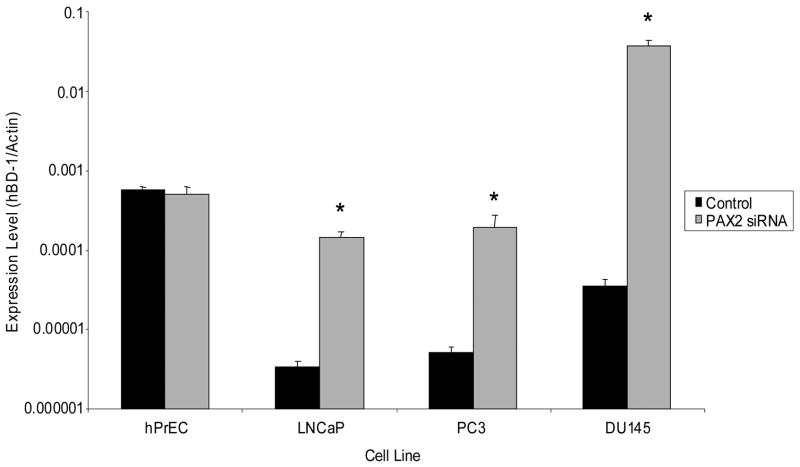
To further examine the role of PAX2 in regulating hBD-1 expression, we utilized siRNA to knockdown PAX2 expression and performed QRT-PCR to monitor hBD-1 expression. Treatment of hPrEC cells with PAX2 siRNA exhibited no effect on hBD-1 expression (Figure 6). However, PAX2 knockdown resulted in a 42-fold increase in LNCaP, a 37-fold increase in PC3 and a 1026-fold increase in DU145 expression of hBD-1. As a negative control, cells were treated with non-specific siRNA which had no significant effect on hBD-1 expression (data not shown).
Figure 6. QRT-PCR analysis of hBD1 expression following PAX2 knockdown with siRNA.
hBD-1 expression levels are presented as expression ratios compared to β-actin. A single asterisk represents statistically lower expression levels compared to the cell line before PAX2 siRNA treatment (Student’s T-test, p<0.05).
4. Discussion
The identification of susceptibility genes and genetic alterations associated with prostate cancer has greatly enhanced our understanding of the disease (Mazzucchelli et al., 2004). However, the basic mechanism underlying prostate carcinogenesis is still poorly understood. Recent interest has focused on the role of inflammation or infection in the progression of prostate cancer (Mazzucchelli et al., 2004; Nelson et al., 2004; Palapattu et al., 2005). Members of the defensin family of peptides have an important role in host defense against bacterial, fungal and viral infections (Lehrer and Ganz, 1996) and are considered a critical part of the initial response to a pathogen (Jurevic et al., 2002). In contrast to other members of the defensin family, hBD-1 exhibits no activity against fungal and viral infections and only very weak antimicrobial activity. Given this, the exact role of hBD-1 expression in the epithelial cell remains unclear (Braida et al., 2004; Ganz, 1999; Ganz, 2002).
Our previous studies have shown that hBD-1 expression is lost at a high frequency in prostate cancer (Donald et al, 2003). However, little is known about its function in cancer or whether the loss of expression contributes to prostate tumor progression. There has been increasing interest in whether host defense peptides possess anti-cancer activity (Papo and Shai, 2005). Here we show that hBD-1 is cytotoxic to prostate cancer cells. Overall, hBD-1 expression was approximately 10- to 1000-fold less in grossly dissected tissues compared to LCM tissue samples. Furthermore, expression in benign prostate tissue adjacent to cancer varied over a range differing by 6.6-fold difference in gross dissected tissues and a 32-fold difference in LCM derived tissue. In this, we found that patient #1343 had an 854-fold difference in detectable hBD-1 expression when comparing gross and LCM derived tissue. The difference in detectable levels of hBD-1 when comparing grossly dissected to LCM derived tissue indicates LCM is a more sensitive technique to analyze expression of hBD-1. Additionally, analysis indicated that in most cases, patient samples with higher hBD-1 expression levels had a Gleason score of 6, while those with less expression were diagnosed with cancers having Gleason scores of 7. Although LCM derived tissue appeared to display the trend of higher hBD-1 expression and lower Gleason score, other factors such as degree of inflammation within the tissue were not evaluated in this study. In addition, we have preliminary data from a previous long-term patient follow-up study which suggests that those with little to no hBD1 expression experienced higher cancer recurrence rates compared to those with higher expression levels. Taken together, these results suggests that decreased or loss of hBD-1 expression and its subsequent anti-cancer activity may contribute to prostate tumor progression.
In 2006, Sherman et al. published data indicating that hBD-1 is upregulated in response to BSA treatment and the pathway involved may be regulated by the c-Myc proto-oncogene. C-myc has also been shown to sensitize tumor cells to various apoptotic stimuli (Juin et al, 2002). One of these pathways involves the permeabilization of the cellular and mitochondrial membranes, and the release of cytochrome C. Therefore, c-Myc must act to potentiate the ability of an additional factor to induce permeabilization and cytochrome C release. However, in cancer cells c-Myc-induced release of cytochrome C is suppressed by cell survival factors, which subsequently exacerbates c-Myc oncogenicity.
Given that all potential pro-apoptotic actions of c-Myc involve its functional integrity as a transcription factor, it is possible that c-Myc modulates target genes that encode proteins which can permeabilize the mitochondrial membrane. Here we show that hBD-1 causes rapid cell death in late-stage prostate cancer cells via the disruption of cell membrane potential and caspase activation. Furthermore, we found a positive correlation between cMyc and hBD-1 in one of three prostate tissue samples, where tissue exhibiting decreased cMyc expression also possessed a decreased hBD-1 level. This suggests that the loss of hBD1 observed in prostate cancer may be due to the down-regultation of cMyc expression or by the up-regulation of transcription factors acting as pro-survival factors, therefore preventing the triggering of apoptosis, and ultimately promoting tumor progression.
Paired box 2, PAX2, is a member of the PAX gene family of transcriptional regulators that functions early in the development of the urogenital system (Eccles et al, 2002). Although PAX2 is typically repressed upon terminal differentiation, in urogenital cancers including prostate cancer it has been shown to be overexpressed (Discenza et al, 2003). In addition, studies have demonstrated that PAX2 expression can stimulate proliferation stimulus, thus serving as a critical component of a multi-step oncogenic transformation process (Stuart et al, 1995). Therefore, PAX2 may offer an advantage for the survival and growth of cancer cells.
PAX genes function to activate or repress transcription by transactivating the promoter of target genes that regulate cell growth and apoptosis (Margue et al, 2000; Stuart et al, 1995). Unique recognition sequences are contained within the paired domain and activating domains in PAX2 that aid to activate or repress the transcription of specific genes (Havik, et al, 1999). The hBD-1 promoter possesses a PAX2 recognition sequence between bases-172 and -157 upstream of the TATA box. Our results show that the suppression of PAX2 protein expression by siRNA results in the re-expression of hBD1. We have preliminary quantitative RT-PCR data which suggests that aberrant PAX2 expression may occur as early as PIN and therefore may influence hBD1 expression at the premalignant stage (data not shown). These findings suggest that PAX2 may be a transcriptional repressor of hBD-1 expression although this was not examined in this study. Taken together, it is plausible that the delicate balance of the regulation of hBD-1 expression may play a key role in determining the fate of cancer cells and tumor progression.
In summary, data presented here demonstrate that hBD-1 expression is highly cytotoxic to DU145 and PC3 which represent AR negative, hormone refractory late-stage prostate cancer. These findings suggests that hBD-1 has anti-cancer and/or tumor suppressive activities and that it suppression or loss contributes to cancer cell survival and tumor progression. Cytotoxic effects of hBD-1 observed in DU145 and PC3, but not in LNCaP suggest that hBD-1 specifically affects late-stage prostate cancer cells. This reasoning is further supported by the high frequency of cancer-specific loss of hBD-1 expression, and that hBD-1 loss of expression may influence Gleason grading and cancer recurrence. Therefore, hBD-1 may be an integral component of the innate immune system involved in the recognition and destruction of cancer cells. In conclusion, our studies are the first to demonstrate hBD-1 functionality in prostate cancer progression, thus offering hBD-1 as a viable therapeutic agent for the treatment of late-stage prostate cancer.
Acknowledgments
We thank the Hollings Cancer Center Tumor Bank for tissue procurement and Dr. Gian Re for technical assistance with QRT-PCR. Also, we would like to thank Carlene S. Brandon for assistance with immunocytochemistry and Mr. James Nicholson for technical assistance with confocal microscopy. We also thank Dr. Bradley Schulte for helpful discussions and critical review of the article. This work was supported by grants CA096788 and C06RR14516 from the National Institutes of Health.
Footnotes
Publisher's Disclaimer: This is a PDF file of an unedited manuscript that has been accepted for publication. As a service to our customers we are providing this early version of the manuscript. The manuscript will undergo copyediting, typesetting, and review of the resulting proof before it is published in its final citable form. Please note that during the production process errors may be discovered which could affect the content, and all legal disclaimers that apply to the journal pertain.
References
- Braida L, Boniotto M, Pontillo A, Tovo PA, Amoroso A, Crovella S. A single-nucleotide polymorphism in the human beta-defensin 1 gene is associated with HIV-1 infection in Italian children. Aids. 2004;18:1598–600. doi: 10.1097/01.aids.0000131363.82951.fb. [DOI] [PubMed] [Google Scholar]
- Discenza MT, He S, Lee TH, Chu LL, Bolon B, Goodyer P, Eccles MR, Pelletier J. WT1 is a modifier of the Pax2 mutant phenotype: cooperation and interaction between WT1 and Pax2. Oncogene. 2003;22(50):8145–55. doi: 10.1038/sj.onc.1206997. [DOI] [PubMed] [Google Scholar]
- Donald CD, Sun CQ, Lim SD, Macoska J, Cohen C, Amin MB, Young AN, Ganz TA, Marshall FF, Petros JA. Cancer-specific loss of beta-defensin 1 in renal and prostatic carcinomas. Lab Invest. 2003;83:501–5. doi: 10.1097/01.lab.0000063929.61760.f6. [DOI] [PubMed] [Google Scholar]
- Eccles MR, HE S, Legge M, Kumar R, Fox J, Zhou C, French M, Tsai RW. PAX genes in development and disease: the role of PAX2 in urogenital tract development. Int J Dev Biol. 2002;46(4):535–44. [PubMed] [Google Scholar]
- Ganz T. Defensins and host defense. Science. 1999;286:420–1. doi: 10.1126/science.286.5439.420. [DOI] [PubMed] [Google Scholar]
- Ganz T. Immunology. Versatile defensins. Science. 2002;298:977–9. doi: 10.1126/science.1078708. [DOI] [PubMed] [Google Scholar]
- Ganz T. Defensins: antimicrobial peptides of vertebrates. C R Biol. 2004;327:539–49. doi: 10.1016/j.crvi.2003.12.007. [DOI] [PubMed] [Google Scholar]
- Gibson W, Green A, Bullard RS, Eaddy AR, Donald CD. Inhibition of PAX2 Expression Results in Alternate Cell Death Pathways in Prostate Cancer Cells Differing in p53 Status. Can Lett. 2007;248 (2):251–61. doi: 10.1016/j.canlet.2006.08.007. [DOI] [PubMed] [Google Scholar]
- Havik B, Ragnhildstveit E, Lorens JB, Saelemyr K, Fauske O, Knudsen LK, Fjose A. A novel paired domain DNA recognition motif can mediate Pax2 repression of gene transcription. Biochem Biophys Res Commun. 1999;266(2):532–541. doi: 10.1006/bbrc.1999.1854. [DOI] [PubMed] [Google Scholar]
- Jemal A, Siegel R, Ward E, Murray T, Xu J, Smigal C, Thun MJ. Cancer statistics, 2006. CA Cancer J Clin. 2006;56:106–30. doi: 10.3322/canjclin.56.2.106. [DOI] [PubMed] [Google Scholar]
- Juin P, Hunt A, Littlewood T, Griffiths B, Brown-Swigart L, Korsmeyer S, Evan G. c-Myc functionally cooperates with Bax to induce apoptosis. Mol Cell Bio. 2002;22:6158–6169. doi: 10.1128/MCB.22.17.6158-6169.2002. [DOI] [PMC free article] [PubMed] [Google Scholar]
- Jurevic RJ, Chrisman P, Mancl L, Livingston R, Dale BA. Single-nucleotide polymorphisms and haplotype analysis in beta-defensin genes in different ethnic populations. Genet Test. 2002;6:261–9. doi: 10.1089/10906570260471787. [DOI] [PubMed] [Google Scholar]
- Lehrer RI, Ganz T. Endogenous vertebrate antibiotics. Defensins, protegrins, and other cysteine-rich antimicrobial peptides. Ann N Y Acad Sci. 1996;797:228–39. doi: 10.1111/j.1749-6632.1996.tb52963.x. [DOI] [PubMed] [Google Scholar]
- Linzmeier R, Ho CH, Hoang BV, Ganz T. A 450-kb contig of defensin genes on human chromosome 8p23. Gene. 1999;233:205–11. doi: 10.1016/s0378-1119(99)00136-5. [DOI] [PubMed] [Google Scholar]
- Margue CM, Bernasconi M, Barr FG, Schafer BW. Transcriptional modulation of the anti-apoptotic protein BCL-XL by the paired box transcription factors PAX3 and PAX3/FKHR. Oncogene. 2000;19:2921–2929. doi: 10.1038/sj.onc.1203607. [DOI] [PubMed] [Google Scholar]
- Mazzucchelli R, Barbisan F, Tarquini LM, Galosi AB, Stramazzotti D. Molecular mechanisms in prostate cancer. A review. Anal Quant Cytol Histol. 2004;26:127–33. [PubMed] [Google Scholar]
- McNeel DG, Malkovsky M. Immune-based therapies for prostate cancer. Immunol Lett. 2005;96:3–9. doi: 10.1016/j.imlet.2004.06.009. [DOI] [PubMed] [Google Scholar]
- Nelson WG, De Marzo AM, DeWeese TL, Isaacs WB. The role of inflammation in the pathogenesis of prostate cancer. J Urol. 2004;172:S6–11. doi: 10.1097/01.ju.0000142058.99614.ff. discussion S11–2. [DOI] [PubMed] [Google Scholar]
- Palapattu GS, Sutcliffe S, Bastian PJ, Platz EA, De Marzo AM, Isaacs WB, Nelson WG. Prostate carcinogenesis and inflammation: emerging insights. Carcinogenesis. 2005;26:1170–81. doi: 10.1093/carcin/bgh317. [DOI] [PubMed] [Google Scholar]
- Papo N, Shai Y. Host defense peptides as new weapons in cancer treatment. Cell Mol Life Sci. 2005;62:784–90. doi: 10.1007/s00018-005-4560-2. [DOI] [PubMed] [Google Scholar]
- Prasad MA, Trybus TM, Wojno KJ, Macoska JA. Homozygous and frequent deletion of proximal 8p sequences in human prostate cancers: identification of a potential tumor suppressor gene site. Genes Chromosomes Cancer. 1998;23:255–62. [PubMed] [Google Scholar]
- Sherman H, Chapnik N, Froy O. Albumin and amino acids upregulate the expression of human beta-defensin 1. Mol Immunol. 2006;43:1617–23. doi: 10.1016/j.molimm.2005.09.013. [DOI] [PubMed] [Google Scholar]
- Stuart ET, Haffner R, Oren M, Gruss P. Loss of p53 function through PAX-mediated transcriptional repression. EMBO J. 1995;15:5638–5645. doi: 10.1002/j.1460-2075.1995.tb00251.x. [DOI] [PMC free article] [PubMed] [Google Scholar]
- Tien AH, Xu L, Helgason CD. Altered immunity accompanies disease progression in a mouse model of prostate dysplasia. Cancer Res. 2005;65:2947–55. doi: 10.1158/0008-5472.CAN-04-3271. [DOI] [PubMed] [Google Scholar]
- Yang D, Biragyn A, Hoover DM, Lubkowski J, Oppenheim JJ. Multiple roles of antimicrobial defensins, cathelicidins, and eosinophil-derived neurotoxin in host defense. Annu Rev Immunol. 2004;22:181–215. doi: 10.1146/annurev.immunol.22.012703.104603. [DOI] [PubMed] [Google Scholar]


