Abstract
Magnesium ions (Mg2+) play a key role in regulating hepatic cellular functions and enzymatic activities. In the present study, we report a concentration-dependent effect of cytosolic Mg2+ on G6P1 and pyrophosphate (PPi) transport and hydrolysis in digitonin-permeabilized rat hepatocytes. The stimulatory effect of Mg2+ on G6P is specific but biphasic, with a maximal effect at a concentration of 0.25mM, whereas the effect on PPi increases in a dose-dependent manner. Both effects can be abolished by addition of EDTA to the system. Addition of taurocholate, histone-2A, alamethicin or A23187 to the incubation system results in a marked decrease in the Mg2+ concentration present within the endoplasmic reticulum lumen. Under these conditions, the stimulatory effect of extra-reticular Mg2+ on G6P transport and hydrolysis is abolished. Taken together, these data suggest that cytosolic Mg2+ stimulates G6P transport by acting at the level of the substrate binding site of the G6Pase enzymatic complex or the surrounding phospholipid environment. The effect, which is lost when G6P has readily access to the ER lumen, requires physiological endoplasmic reticulum Mg2+ content.
Keywords: Mg2+, G6P, G6Pase, pyrophosphate, endoplasmic reticulum, hepatocyte
INTRODUCTION
Magnesium (Mg2+) is the second most abundant cation after potassium [1]. In the majority of mammalian cells, total Mg2+ concentration ranges between 16 to 18mM within nucleus, mitochondria and endo-sarco-plasmic reticulum [1]. In the cytoplasm, Mg2+ is mostly in a form of a complex with ATP or other phosphonucleotides (about 4–5mM, [2]), so that 0.5–0.7mM is actually in a free form ([Mg2+]i, [1,3]). As our understanding of cellular Mg2+ homeostasis has improved over the years, the relevance of Mg2+ in regulating cell cycle, channel function and various cellular enzymes has also increased [4]. One of the last counts indicates more than 300 enzymes, channels, and kinases as being regulated directly or indirectly by Mg2+ [4]. The list includes enzymes regulating glycolysis and glucose homeostasis [4], as well as regulatory enzymes such as adenylyl cyclase [4]. The existence of a ‘link’ between glucose utilization and Mg2+ homeostasis is supported by the observation that liver cells mobilize Mg2+ in addition to glucose in response to the exogenous administration [5] or the endogenous release [6] of glucagon or catecholamine. Technical limitations, however, have hampered our ability to properly relate changes in total or free cellular Mg2+ content with variations in Mg2+ content within specific cellular compartments, de facto preventing us from establishing cause-effect correlation between hormone-mediated Mg2+ fluxes at the cellular level with changes in Mg2+ concentration and activity of specific enzymes within cellular compartments.
Glucose-6-phosphatase (G6Pase, EC 3.1.3.9) is an enzymatic complex operating within the endoplasmic reticulum (ER) of liver [7], kidney [8] and pancreatic beta-cells [9]. Because it catalyzes the hydrolysis of glucose 6-phosphate (G6P) to glucose and phosphate (Pi), this enzyme has a key role in regulating glycolysis and glucose homeostasis [10]. Structurally, G6Pase presents nine transmembrane helices embedded in the ER membrane [11,12] with the catalytic site of the hydrolase being located within the ER lumen [13]. Thus, to be hydrolyzed the substrate G6P must enter the ER via a specific transport mechanism [11]. Despite extensive studies, the structure and operation of this enzymatic complex are still debated. Two models have been proposed. In the substrate-transport model, G6P enters the ER lumen via a specific transporter (T1) distinct from the hydrolase. In this model, T1 represents the rate-limiting factor for the G6Pase system [14]. The conformational flexibility substrate-transport model, instead, proposes that in addition to hydrolytic activity the G6Pase enzyme would possess a hydrophilic region at its cytoplasmic side responsible for substrate binding. Binding of the substrate to this region would result in a conformation change and delivery of the substrate to the intra-luminal catalytic site. According to this model, the substrate binding site and the hydrolytic site of G6Pase are two parts of the same protein, and the enzyme is not specific for a particular substrate [13]. In both models, the bio-products of G6P hydrolysis (i.e. glucose and Pi) are released into the cytoplasm via two additional, specific transport mechanisms [10,13–15].
Pyrophosphate (PPi) can also be hydrolyzed by the G6Pase system [13]. However, the transport mechanism delivering PPi to the ER lumen is reputed to be distinct from that involved in G6P transport [13].
In the present study, collagenase-dispersed hepatocytes permeabilized by digitonin were used to test the hypothesis that changes in cytoplasmic or endo-luminal Mg2+ concentration could modulate G6P hydrolysis. The reported results suggest that changes in cytoplasmic Mg2+ level can affect the rate of G6P hydrolysis by acting on the G6P transport mechanism. The physio-pathological relevance of these results is discussed.
MATERIALS AND METHODS
Materials
All chemicals were of the purest analytical grade (Sigma, St. Louis, MO). Di-sodium salt hydrate G6P and M6P were used in the study. Collagenase (CLS-2) was from Worthington Biochemical Corporation (Lakewood, NJ).
Hepatocytes Isolation
Hepatocytes were isolated as previously described [6]. Fed male Sprague–Dawley rats (230–250 g body weight) were anesthetized by i.p. injection of saturated sodium pentobarbital solution (65mg/ml). The portal vein was cannulated, and hepatocytes were isolated by collagenase digestion. Following isolation, hepatocytes were washed twice in a medium containing 120mM NaCl, 3mM KCl, 1.2mM KH2PO4, 1.2mM CaCl2, 1.2mM MgCl2, 10mM HEPES, 10mM glucose, 12mM NaHCO3 (pH 7.35) equilibrated with O2: CO2 (95:5 v/v), and resuspended therein, at a final volume of 30 ml. After passage through a Percoll gradient [6] to maximize cell viability, the hepatocytes were resuspended in the medium described above, at a final concentration of 1 × 10⁵ cells/ml. Trypan blue exclusion test indicated a viability of 95±3% (n=10), which did not change significantly over 2 hours (94±4%, n= 10).
Hepatocyte Permeabilization
Five ml aliquots of hepatocyte suspension were withdrawn and gently sedimented at 600 g × 1 min. The cell pellet was then resuspended in a cytosol-like medium containing 20mM NaCl, 100mM KCl, 10mM MOPS (pH 7.2) plus 50μg/ml digitonin [16]. Cell permeabilization, assessed by trypan blue exclusion test, was attained within 5 min at room temperature (96±2% trypan blue positive, n=10). Digitonin-permeabilized cells were sedimented at 1,200 g × 1 min and washed twice in the cytosol-like medium indicated above to remove cytoplasmic components. The final pellet was resuspended in the same medium at the final concentration of 1 × 10⁵ cells/ml, and used immediately.
In a separate set of experiments, digitonin-permeabilized hepatocytes were incubated for 15 min at room temperature in the presence of 1mM (final concentration) taurocholate to attain endoplasmic reticulum (ER) permeabilization [17]. ER-permeabilized hepatocytes were then washed twice and resuspended in a similar volume of cytosol-like medium as indicated previously, and used immediately.
G6Pase Activity
Digitonin-permeabilized or digitonin-taurocholate-permeabilized hepatocytes were incubated at the final concentration of 200–250μg/ml in the cytosol-like medium described above in the presence of varying concentrations of Mg2+ (as MgCl2), at 37°C. Hydrolytic activity was initiated by addition of varying concentrations of G6P, PPi or M6P, and carried out for at least 45 min. All the substrates were dissolved in the cytosol-like buffer devoid of magnesium. Starting from time = 0 min, 1 ml aliquots of the incubation mixture were removed at 15 min intervals, and the hydrolysis activity stopped by rapid addition of TCA (5% final concentration). The acid mixture was then sedimented at 1,500 rpm for 10 min in a refrigerated Beckman B6J centrifuge. The supernatant was removed and the amount of Pi present was measured spectrophotometrically according to the Fiske and SubbaRow assay [18] at 700 nm in an Agilent 8453 spectrophotometer equipped with a computerized data acquisition program.
In selected experiments, histone 2A (250μg/ml or isodose with the amount of protein present in the system, [19]) or alamethicin (3μg/ml, [19]) were added directly to the incubation mixture containing digitonin-permeabilized hepatocytes to enhance ER membrane permeability to G6P [9,19]. In a separate set of experiments, the ionophore A23187 was added at the final concentration of 2μg/ml to mobilize Mg2+ from ER [20] without altering ER membrane permeability to G6P.
For the experiments involving EDTA to chelate extra-reticular added Mg2+ to 0mM, a computational program [21] was used to determine the correct amount of chelating agent to add to the incubation system.
G6P Transport Assay
Aliquots of digitonin-permeabilized cells were incubated in the presence of varying Mg2+ concentrations at the final concentration of 200–250μg protein/ml. After 2 min equilibration, 5mM G6P labeled with 1μCi/ml 3H-G6P were added to the incubation system. At the time reported in the figure 250ml incubation mixture were withdrawn, diluted into 4 ml of 250mM ‘ice-cold’ sucrose and rapidly filtered onto Whatman GF/C filters under vacuum [16]. The radioactivity retained onto the filters was measured by beta-scintillation counting in a Beckman LS-5100 counter.
Mg2+ Determination
Following attainment of plasma membrane (digitonin) or endoplasmic reticulum (taurocholate) permeabilization, aliquots of the cell mixture (200–250μg protein/ml) were withdrawn and sedimented in microfuge tubes (7,000 rpm × 4 min). Supernatants were removed and assessed for Mg2+ content by atomic absorbance spectrophotometry (AAS) in a Perkin-Elmer 3100. The cell pellets were resuspended in 500μl 10% HNO3, sonicated by 2 pulses of 10 sec each at 15 sec intervals on ice with a Brandson sonicator at setting 7, and digested overnight. Following sedimentation of denaturated protein, Mg2+ content in the acid extract was measured by AAS upon appropriate dilution. Contaminant Mg2+ present in the cytosol-like incubation buffer was also measured by AAS and found to range between 2 to 5μM.
Protein Determination
Protein concentrations were assayed by the method of Bradford [22].
Statistical Analysis
Data were analyzed by pared t-test with a significance of p<0.05.
RESULTS
Addition of G6P to digitonin-permeabilized hepatocytes results in a time- and dose-dependent hydrolysis of G6P and generation of glucose and inorganic phosphate (Pi) into the incubation system [16]. In the present study, G6P concentrations ranging from 1 to 10mM were added to digitoning-permeabilized hepatocytes, and the hydrolysis rate measured as the amount of Pi generated into the incubation system at various time points. Maximal hydrolysis was observed upon addition of 5mM G6P, not increasing significantly at higher G6P concentrations (not shown). Hence, this concentration of G6P was used in the majority of the experiments reported in this study.
As illustrated in Fig. 1A, varying Mg2+ concentrations in the incubation system had a bi-phasic effect on G6P hydrolysis. Glucose 6-phosphate hydrolysis and inorganic phosphate generation increased at an external Mg2+ concentration of 0.25mM as compared to 0 mM [Mg2+]o, but decreased in the presence of larger extra-reticular Mg2+ concentrations (i.e. 0.5 or 1mM). In keeping with the physiological range of cytoplasmic Mg2+ concentration within mammalian cells, concentrations of Mg2+ larger than 1 mM were not tested. Radioisotope distribution of G6P indicated that over 45 min of incubation, digitonin-permeabilized hepatocytes incubated in the presence of 0.25mM Mg2+ accumulated 30±3% more G6P than hepatocytes incubated in the presence of nominal 0mM Mg2+ (4.90±0.27 vs. 3.76±0.19 μmol G6P/mg protein/45 min, respectively, n=4 for both experimental conditions, p<0.001) whereas hepatocytes incubated in the presence of 0.5 or 1mM Mg2+ accumulated ~10% more G6P (e.g. 4.19±0.21 μmol G6P/mg protein/45 min, n=4, for cells incubated in the presence of 1mM Mg2+) as compared to hepatocytes incubated in the presence of nominal 0mM Mg2+.
Figure 1. G6P hydrolysis in the presence of varying Mg2+ (Fig. 1A) and G6P (Fig. 1B) concentrations.
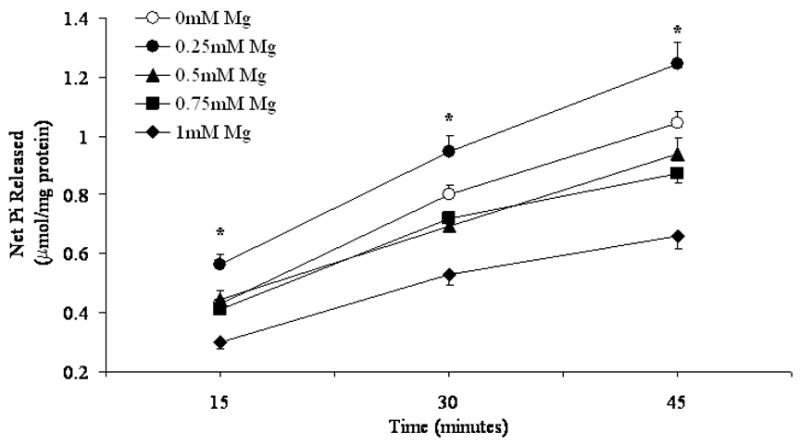
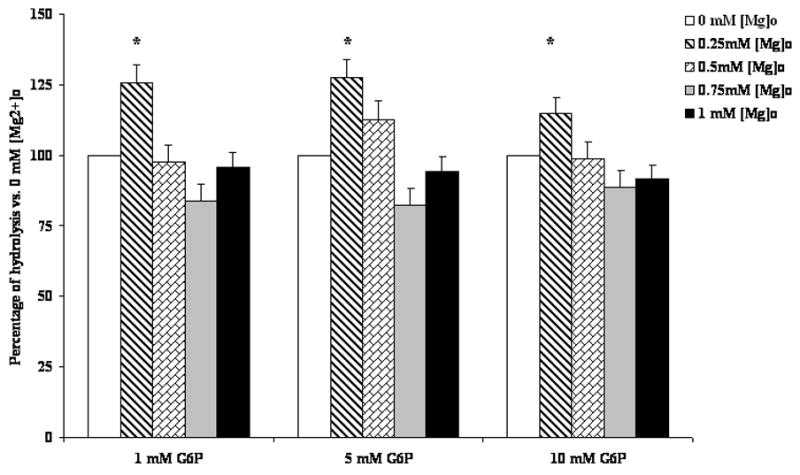
Time course of net G6P hydrolysis in digitonin-permeabilized hepatocytes incubated in the presence of 5mM G6P and varying Mg2+ concentrations, expressed as μmol Pi/mg protein, is reported in Fig. 1A. Hydrolysis in the presence of 1mM, 5mM, and 10mM G6P and varying Mg2+ concentrations at time 45 min is reported in Fig 1B as percent change vs. hydrolysis in the presence of 0mM external Mg2+. Data are means±S.E. of 6 experiments for each condition, each performed in duplicate. *Statistically significant vs. other samples.
The effect on G6P hydrolysis was Mg2+ specific, as it was not observed when permeabilized hepatocytes were incubated in the presence of equivalent concentrations of other divalent cations (Table I). The enhanced hydrolysis in the presence of 0.25mM [Mg2+]o was observed at all the concentrations of G6P tested (Fig. 1B).
Table 1.
Effect of Different Cations on G6P hydrolysis
| Net G6P hydrolysis | Percent change vs. 1mM | ||||
|---|---|---|---|---|---|
| 15 min | 30 min | 15 min | 30 min | ||
| Mg2+ | 0.25mM | 1.14±0.2* | 1.90±0.1* | 121.8 | 128.7 |
| 1mM | 0.94+0.1 | 1.48+0.2 | |||
| Mn2+ | 0.25mM | 1.32+0.2 | 1.82+0.3 | 105.6 | 104.0 |
| 1 mM | 1.25+0.4 | 1.75+0.2 | |||
| Ca2+ | 0.25mM | 1.14+0.3 | 1.93+0.2 | 108.6 | 109.7 |
| 1mM | 1.05+0.4 | 1.76+0.5 | |||
| Co2+ | 0.25mM | 1.30+0.2 | 1.92+0.3 | 103.2 | 105.5 |
| 1mM | 1.26+0.4 | 1.82+0.2 | |||
| Ni2+ | 0.25mM | 1.25+0.3 | 2.00+0.4 | 104.2 | 96.6 |
| 1mM | 1.20+0.2 | 2.07+0.5 | |||
G6P (5 mM) was added at time = 0 min. Net hydrolysis was calculated vs. the hydrolysis at time = 0 min, and expressed as μmol Pi/mg protein. Hydrolysis at time = 45 min was omitted for simplicity. Data are means +S.E. of 4 different preparations.
Statistically significant vs. corresponding values at 1mM.
The biphasic effect of Mg2+ appears to be specific for G6P. In experiments in which 1mM PPi was used as the hydrolytic substrate instead of G6P, the amount of Pi generated increased over time in a manner directly proportional to the Mg2+ concentration present in the incubation system (Fig. 2). Increasing the concentration of PPi beyond 1mM did not result in a larger hydrolytic activity (not shown).
Figure 2. PPi hydrolysis in the presence of varying Mg2+ concentrations.
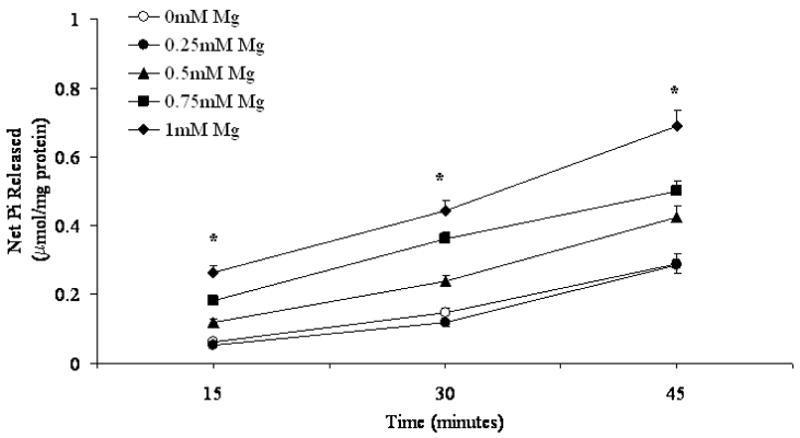
Time course of net PPi hydrolysis in digitonin-permeabilized hepatocytes incubated in the presence of 1mM PPi and varying Mg2+ concentrations is reported. Data, expressed as μmol Pi/mg protein, are means±S.E. of 6 experiments for each condition, each performed in duplicate. *Statistically significant vs. other samples. All t=15 min, t=30 min and t=45 min of samples incubated in the presence of 0.5mM, 0.75mM and 1mM Mg2+ are statistically significant vs. the corresponding time points of 0mM and 0.25mM Mg2+ samples. Labeling is omitted for simplicity.
To confirm that the effect of Mg2+ on G6P and PPi was specific, EDTA was added at a selected time to chelate Mg2+ from the system. Experimental samples containing either nominal 0 (i.e. no Mg2+ added) or 1mM Mg2+ were split into two samples after 15 min incubation. While one sample retained the indicated Mg2+ concentration, the other received a concentration of EDTA calculated to decrease the level of Mg2+ to 0mM [21]. As shown in Fig. 3A, chelating Mg2+ by EDTA resulted in a decreased G6P hydrolysis rate as compared to the EDTA-free counterpart. The net change in G6P hydrolyzed, reported in the inset of Fig. 3A, indicates a 20–25% increase in hydrolysis rate in the presence of 0.25mM Mg2+ vs. 0 mM Mg2+ at 30 and 45 min. Following EDTA addition, G6P hydrolysis was marked attenuated, reaching levels similar to those observed at 0mM Mg2+ in the absence of EDTA (Fig, 3A). Similar experiments were performed using 1mM PPi as substrate, in the presence of 1mM Mg2+, as PPi was maximal at this Mg2+ concentration. Also in this case, the addition of EDTA at a concentration sufficient to chelate Mg2+ level to 0mM resulted in a complete inhibition of PPi hydrolysis (Fig. 3B, and relative inset). Similar inhibition of G6P and PPi hydrolysis were obtained adding EDTA at t = 0 min after quickly splitting the sample (not shown).
Figure 3. G6P (Fig. 3A) and PPi (Fig. 3B) hydrolysis in the presence of varying Mg2+ concentration, in the absence or in the presence of EDTA.
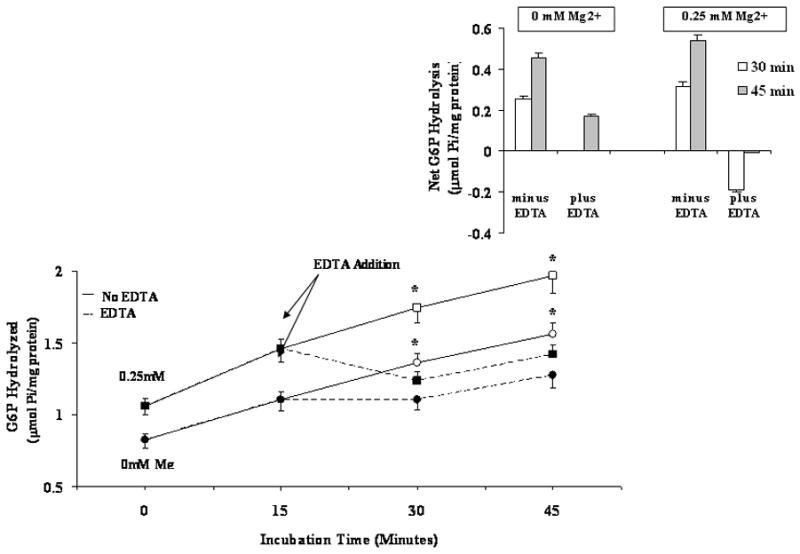
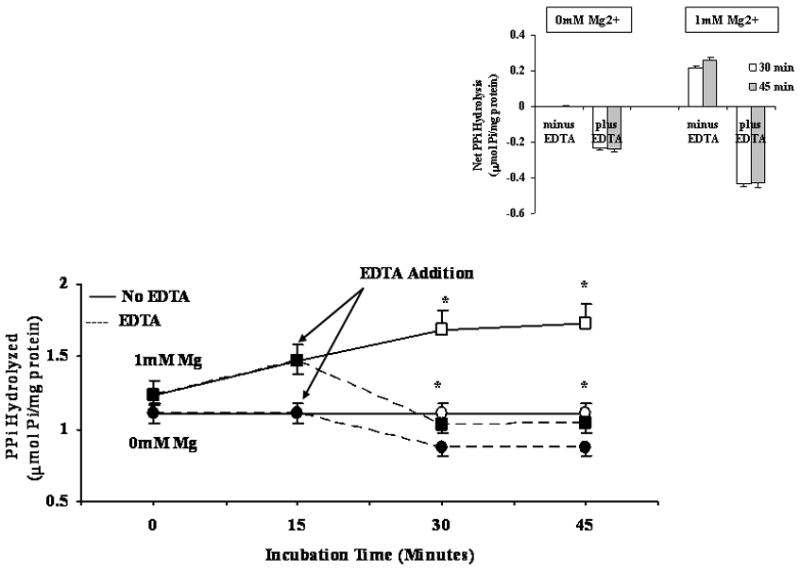
Digitonin-permeabilized hepatocytes were incubated in the presence of 5mM G6P (Fig. 3A) and 1mM PPi (Fig. 3B) in a medium containing either nominal 0mM or 0.25mM Mg2+ (Fig, 3A), or 0mM and 1mM Mg2+ (Fig. 3B). After 15 min incubation, the samples were split into two, one of which received a concentration of EDTA sufficient to chelate all external Mg2+ [20]. The inset in each figure reports the net change in hydrolysis at time=30min and time=45 min in the absence and in the presence of EDTA vs. time=15min. Data are means±S.E. of 5 different preparations. *Statistically significant vs. the corresponding sample in the presence of EDTA. Labeling in the inset is omitted for simplicity.
To exclude that the effect of Mg2+ on G6P or PPi hydrolysis was due to a leak of Mg2+ across the ER membrane over time, the amount of Mg2+ retained within the ER of digitonin permeabilized hepatocytes was measured by AAS. The values, reported in Table 2, indicate that Mg2+ content did not change significantly during our incubation procedure irrespective of the absence or the presence or EDTA or the amount of Mg2+ added to the system.
Table 2.
Changes in the amount of Mg2+ retained within the hepatocytes following addition of digitonin, EDTA, taurocholate, histone 2A, alamethicin, or A23187.
| Mg2+ content | Percent Variation at 45 min vs. no Agent | ||
|---|---|---|---|
| 0 min | 45 min | ||
| Digitonin-Permeabilized | |||
| 0mM Mg2+/no EDTA | 21.4+1.8 | 20.8±2.3 | |
| 0mM Mg2+/EDTA | 20.0±1.2 | 96.2 | |
| 0.25mM Mg2+/no EDTA | 22.2±0.9 | 22.0±1.5 | |
| 0.25mM Mg2+/EDTA | 20.9±1.9 | 95.0 | |
| 0mM Mg2+/no H2A | 22.1±1.7 | 21.5±1.1 | |
| 0mM Mg2+/H2A | 10.5±1.1* | 48.8 | |
| 0.25mM Mg2+/no H2A | 21.3.1±1.5 | 21.9±1.5 | |
| 0.25mM Mg2+/H2A | 11.4±1.3* | 52.1 | |
| 0mM Mg2+/no Ala | 22.6±0.8 | 22.3±2.5 | |
| 0mM Mg2+/Ala | 10.9±1.3* | 48.9 | |
| 0.25mM Mg2+/no Ala | 21.2±1.3 | 21.0±2.4 | |
| 0.25mM Mg2+/Ala | 11.6±1.2* | 55.2 | |
| 0mM Mg2+/no A23187 | 21.1±1.0 | 22.1±2.2 | |
| 0mM Mg2+/A23187 | 11.7±1.5* | 52.9 | |
| 0.25mM Mg2+/no A23187 | 21.8±1.2 | 22.6±1.4 | |
| 0.25mM Mg2+/A23187 | 10.0±2.0* | 44.2 | |
| 0.25mM Mg2+/A23187/EDTA | 9.76±2.7* | 43.2 | |
Values (nmol Mg2+/mg protein) represent total cellular Mg2+ content at the indicated time points. Only 1 value for time = 0 min is reported as samples were split at time = 15 min to continue the incubation in the absence or in the presence of EDTA (~0.3mM)., histone 2A (250μg/ml), alamethicin (3μg/ml), or A23187 (2μg/ml). Data are means+S.E. of 4 different preparations, each performed in duplicate.
Statistically significant vs. corresponding value (p<0.001).
The next series of experiments was designed to determine whether Mg2+ effect was at the level of G6P transport mechanism, or intra-ER Mg2+ concentration was involved in the process. Taurocholate was used to permeabilize the ER membrane and allow G6P to access the hydrolytic site bypassing the G6P transport mechanism. Following addition of taurocholate a loss of Mg2+ from the ER lumen larger than that observed in digitonin-only treated cells was observed (Table 2). Under these conditions, the effect of 0.25mM extra-reticular Mg2+ on G6P hydrolysis was completely abolished (Fig. 4A). Similar results were obtained when 5mM mannose 6-phosphate (M6P) instead of G6P (Fig. 4B) were used as alternative substrates.
Figure 4. G6P (Fig. 4A) and M6P (Fig. 4) hydrolysis in the presence of varying Mg2+ concentrations.
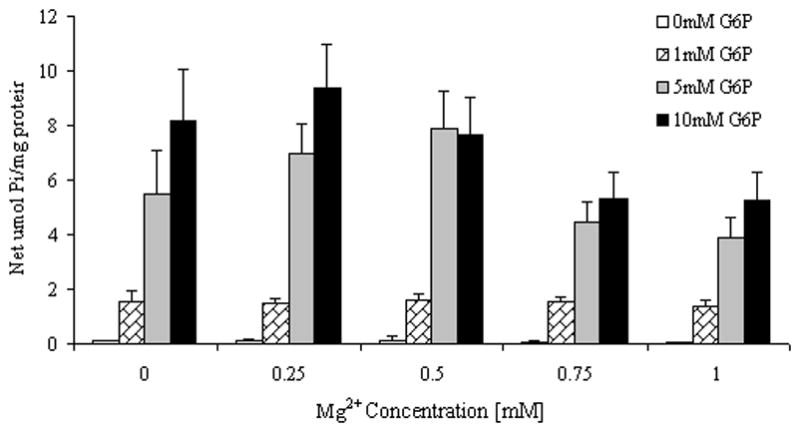
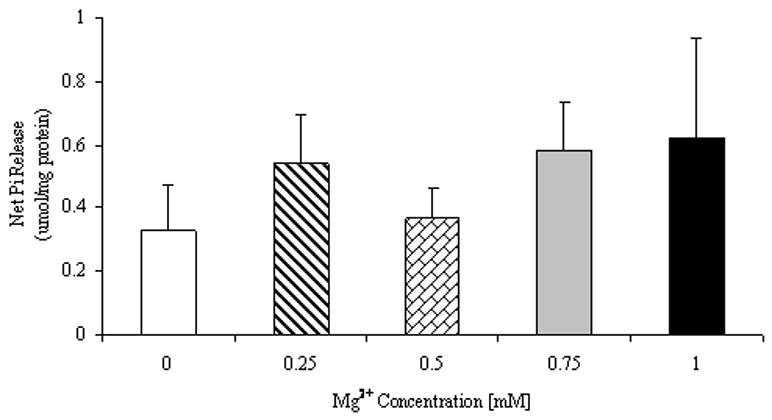
Digitonin- and taurocholate-permeabilized hepatocytes were incubated in the presence of varying Mg2+ and G6P concentrations (Fig. 4A) or 5mM mannose 6-phosphate (M6P, Fig. 4B). Net hydrolysis at time = 45 min is reported for all samples. Data are means±S.E. of 6 experiments for each condition, each performed in duplicate.
Histone 2A [19] and alamethicin [9,19] have been used in alternative to taurocholate or deoxycholate to enhance permeability of ER membrane to G6P bypassing the transport mechanism. The effect of either of these agents on G6P hydrolysis is reported in Fig. 5. As the figure illustrates, in the presence of alamethicin (3μg/ml) or histone 2A (250μg/ml or isodose vs. the protein content in the incubation system, [9,19]) G6P hydrolysis in the presence of 0.25mM extra-reticular Mg2+ was significantly lower than that observed in cells permeabilized only with digitonin. Following the addition of alamethicin or histone 2A, a similar amount of Mg2+ was lost from the ER (Table 2). No additional Mg2+ loss was observed when concentrations of histone 2A or alamethicin larger than those indicated above were used. When the Mg2+ ionophore A23187 was used to decrease intra-luminal Mg2+ concentration [20] without altering ER permeability to G6P, the amount of Mg2+ retained within the hepatocyte was comparable to that measured following administration of histone 2A or alamethicin (Table 2). Under these conditions, G6P hydrolysis was only partially stimulated (plus 13%) by the addition of 0.25mM extra-reticular Mg2+ as compared to the hydrolysis occurring in the presence of 0mM Mg2+ (Fig. 5). This trend did not reach statistical significance and was further abolished in the presence of EDTA to levels similar to those observed with alamethicin or histone 2A (Fig. 5).
Figure 5. G6P hydrolysis in the presence of varying histone 2A or alamethicin.
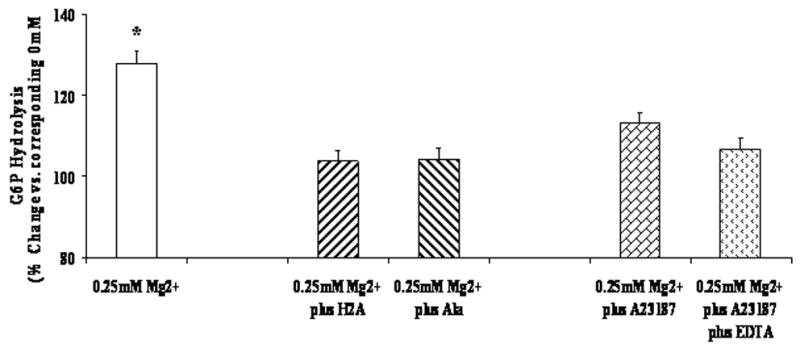
Digitonin-permeabilized hepatocytes were incubated in the presence of 5mM G6P, 0.25mM Mg2+, and 250μg/ml histone 2A or 3μg/ml alamethicin or 2μg/m A23187 (plus or minus EDTA). Net hydrolysis at time = 45 min is reported as percent variation vs. the corresponding sample incubated in the presence of 0mM Mg2+. Data are means+S.E. of 4 experiments for each condition, each performed in duplicate. *Statistically significant vs. other samples.
Perturbation of endo-luminal Mg2+ content by taurocholate, alamethicin or A23187 also abolished the effect of extra-reticular Mg2+ (1mM) on PPi hydrolysis (not shown).
DISCUSSION
Cytoplasm and endoplasmic reticulum (ER) represents two of the main Mg2+ compartments within the hepatocyte [1]. While in the cytoplasm Mg2+ is predominantly in the form of a complex with ATP and other phosphonucleotides [2], the presence of a total Mg2+ concentration in the order of 16 to 20mM, at least in the rough component of the ER [1], has questioned the physiological role the cation may play within the ER compartment. Protein synthesis is a main area in which ER Mg2+ appears to play a major regulatory role [23]. Cytoplasmic and/or ER Mg2+ concentration have also been implicated in regulating the amplitude of Ca2+ release from the endoplasmic [24] or sarcoplasmic reticulum [25] via IP3 and ryanodine receptor, respectively. These conditions, however, do not exclude the possibility that reticular and/or trans-reticular Mg2+ gradient is involved in regulating other ER functions.
Glucose 6-phosphatase is one of the main enzymes operating within the endoplasmic reticulum of the hepatocyte. Although two different models have been proposed for its operation [12,13], consensus is there that G6P, the substrate of choice, has not free access to the hydrolytic site of the G6Pase but has to be transported via a specific transport mechanism. Following hydrolysis, glucose and Pi are released into the cytoplasm via two distinct transport mechanisms separated from that utilized by G6P [13]. Aside from some organic compounds [26], no specific inhibitory or regulatory agents for G6P transport and/or hydrolysis have been reported. Hence, it has been proposed that the G6P hydrolysis rate is regulated by the rate of substrate delivery to the hydrolytic site [12,13].
The present study was undertaken to test the hypothesis that cytoplasmic Mg2+ or endoplasmic reticulum Mg2+ concentration could play a role in regulating G6P hydrolysis within the hepatocyte.
Cytoplasmic Mg2+
Varying the concentrations of extra-reticular Mg2+ results in a biphasic effect on G6P hydrolysis rate (Fig. 1, and radioisotope distribution). Hydrolysis is larger at a concentration of 0.25mM Mg2+ and decreases at higher Mg2+ concentrations, being the lowest at ~1mM Mg2+. This effect is specific for Mg2+, is abolished by EDTA addition, and is observed at all the concentrations of G6P tested. The possibility this effect is due to a leak of Mg2+ from the ER is not supported by two observations. First, the amount of Mg2+ retained within the ER does not vary significantly over the time course of our incubation irrespective of the extra-reticular Mg2+ concentration utilized (Table 2). Second, the addition of EDTA at a dose calculated to reduce the extra-reticular Mg2+ content to 0mM (Fig. 3) reduces the hydrolysis rate while minimally altering the amount of Mg2+ retained within the ER. If dependent on a non-specific leak from the ER luminal reservoir, the Mg2+ effect should continue to persist in the presence of EDTA since the amount of EDTA added (i.e. ~0.35mM for a 0.25mM Mg2+ concentration) would be insufficient to chelate all the Mg2+ present within the ER [1] in addition to that added to the incubation system. Furthermore, by acting as ‘Mg2+-sink’, EDTA should amplify the leak of Mg2+ from the ER lumen. The inhibitory effect of EDTA also excludes that the decrease in hydrolysis rate observed at higher Mg2+ concentrations is due to a ‘chelating’ effect of Mg2+ on G6P. If this was indeed the case, by removing Mg2+ from its G6P binding, EDTA addition should result in an increase rather than a decrease in hydrolysis. Although the modalities by which Mg2+ redistributes across the ER membrane are not elucidated, it is unlikely that the addition of 0.25mM Mg2+ to the extra-reticular space (cytoplasm) changes intra-luminal Mg2+ concentration (16 to 18mM, [1]) to a significant extent able to influence the activity of G6Pase hydrolytic site. On the other hand, EDTA appears to have a marked inhibitory effect in samples containing a nominal 0mM Mg2+ (i.e. no Mg2+ added). This is likely to depend on a chelating effect of EDTA on Mg2+ present as contaminant in the buffer (2–5μM), or as carry-over from the cell suspension following permeabilization by digitonin. The possibility that EDTA is chelating Mg2+ bound to phospholipids and/or proteins of the ER membrane, however, cannot be excluded altogether. Lastly, G6Pase activity appears to be qualitatively and quantitatively different in the rough and smooth portion of the ER, at least in microsomal vesicles [7]. Because the present study was carried out in permeabilized cells, our results do not clarify whether the effect of Mg2+ predominates in the smooth compartment, in which G6Pase is reported to be more active [7], or occurs instead on both rough and smooth portions of the ER.
Endo-luminal Mg2+
The stimulatory effect of Mg2+ on G6P does not take place in digitonin-permeabilized hepatocytes treated with taurocholate (Fig. 4), histone 2A or alamethicin (Fig. 5). All these agents induce a major Mg2+ loss (50% or more) from the ER (Table 2) that is not significantly affected by the concentration of extra-reticular Mg2+ (0mM or 0.25mM) present in the incubation system (Table 2). All these agents, however, increase the delivery of G6P to the hydrolytic site of the G6Pase bypassing the transport mechanism. This explains why the level of Pi generated under these experimental conditions is larger than that generated in hepatocytes permeabilized only with digitonin. A lack of Mg2+ effect is also observed on the alternative hydrolysis substrate M6P.
Perturbing ER Mg2+ content with the ionophore A23187, which does not alter G6P delivery to the ER lumen, however, results in a partially maintained stimulatory effect of extra-reticular Mg2+ on G6P hydrolysis, an effect that is completely abolished by EDTA addition (Fig. 5). Although not statistically significant when compared to the hydrolysis in the absence of ionophore, this effect 1) supports the idea that extra-reticular Mg2+ acts at the level of the G6P transport mechanism, and 2) suggests a modulating role of trans-reticular Mg2+ gradient on G6P transport and/or hydrolysis. Since the ionophore A23187 moves Mg2+ down its concentration gradient in exchange for two protons, it could be argued that G6P hydrolysis rate is affected by intra-reticular pH acidification occurring under these experimental conditions. While not fully consistent with the notion that pH 6.8 is optimal for G6Pase hydrolysis [13], the possibility that intra-reticular pH drops below the optimal range for hydrolytic activity cannot be completely dismissed.
Effect of Mg2+ on PPi transport and hydrolysis
Changes in cytoplasmic and intra-reticular Mg2+ level appear to have a significant regulatory role on PPi hydrolysis as well. The stimulatory effect of Mg2+ on the PPi transporter, however, is different from that observed for G6P, in that it is dose-dependent and not biphasic, and it is completely abolished by removal of Mg2+ following EDTA addition. This observation strongly suggests that also in this case Mg2+ plays a regulatory role at the level of PPi transport rather than its hydrolysis.
Patho-physiological relevance
The biphasic effect of cytoplasmic Mg2+on T1 transporter and G6P hydrolysis is interesting. Yet, the stimulatory effect occurs at a concentration that is not physiological for the hepatocyte. As attested by 31P-NMR [3] or fluorescence indicator [27] measurements, cytoplasmic Mg2+ level ranges between 0.5–0.7 mM under basal, un-stimulated conditions. Total and free Mg2+ concentrations, however, decrease significantly under diabetic conditions [20,28] or prolonged exposure to ethanol [29], reaching values close to the concentration of 0.25mM tested here. Diabetic conditions are indeed characterized by an increased G6Pase activity [30], a phenomenon that has been explained by the lack of repression on G6Pase gene due to insulin absence (type-I diabetes) or reduced effectiveness (type-II diabetes). Because type-I and type-II diabetes are both characterized by a decrease in cellular and cytoplasmic Mg2+ [20], it is tempting to speculate that the enhanced activity of G6Pase observed under diabetic conditions is due to a genomic effect, linked to insulin deficiency, and in part to a ‘stimulatory’ effect of a reduced cytoplasmic Mg2+ concentration on T1 transporter. Further studies in hepatocytes from diabetic animals are necessary to confirm if this is indeed the case.
Conclusions
Taken together, our results suggest that cytoplasmic Mg2+ level plays a significant role in regulating G6P and PPi transport and hydrolysis in liver cells. This effect appears to be at the level of the transport mechanisms for PPi and G6P, or surrounding phospholipid environment, rather than on the hydrolytic site of G6Pase enzymatic complex. In the case of G6P, our results are consistent with either G6Pase model proposed, and do not necessarily support one model over the other. In the case of the substrate-transport model, Mg2+ effect adds a new level of complexity and regulation at the level of T1, which already represents the rate-limiting factor for the G6Pase system. In the conformational flexibility substrate-transport model, instead, Mg2+ may regulate the conformational changes of the hydrophilic region, located at the cytosolic side, which occurs upon substrate binding and is responsible for the delivery to the intra-luminal catalytic site. As indicated previously, it is possible that intra-reticular Mg2+ content provides an additional level of modulation on G6P transport and hydrolysis. This effect of Mg2+ is likely to have a major impact under diabetic conditions rather than under physiological conditions.
Acknowledgments
This study was supported by NIAAA-AA11593
Footnotes
Abbreviations: G6P = Glucose 6 phosphate; G6Pase = glucose 6 phosphatase; PPi = pyrophosphate; Pi = inorganic phosphate; M6P = mannose 6-phosphate; EDTA = ethylenediamine tetraacetic acid; H2A = histone 2A; A23187 = 5-methylamino-2-(2S,3R,5R,8S,9S)-3,5,9-trimethyl-2-(1-oxo-1-(1H-pyrrol-2-yl)propan-2-yl)- 1,7-dioxaspiro(5.5)undecan-8-yl)methyl)benzooxazole-4-carboxylic acid; AAS = atomic absorbance spectrophotometry.
Publisher's Disclaimer: This is a PDF file of an unedited manuscript that has been accepted for publication. As a service to our customers we are providing this early version of the manuscript. The manuscript will undergo copyediting, typesetting, and review of the resulting proof before it is published in its final citable form. Please note that during the production process errors may be discovered which could affect the content, and all legal disclaimers that apply to the journal pertain.
References
- 1.Romani A, Scarpa A. Front Biosci. 2000;5:d720–d734. doi: 10.2741/romani. [DOI] [PubMed] [Google Scholar]
- 2.Scarpa A, Brinley FJ. Fed Proc. 1981;40:2646–2652. [PubMed] [Google Scholar]
- 3.Corkey BE, Duszynski J, Rich TL, Matschinsky B, Williamson JR. J Biol Chem. 1986;261:2567–2574. [PubMed] [Google Scholar]
- 4.Romani A, Scarpa A. Arch Biochem Biophys. 1992;298:1–12. doi: 10.1016/0003-9861(92)90086-c. [DOI] [PubMed] [Google Scholar]
- 5.Romani A, Scarpa A. FEBS Lett. 1990;269:37–40. doi: 10.1016/0014-5793(90)81113-3. [DOI] [PubMed] [Google Scholar]
- 6.Torres LM, Youngner J, Romani A. Am J Physiol. 2005;288:G195–G206. doi: 10.1152/ajpgi.00488.2003. [DOI] [PubMed] [Google Scholar]
- 7.Romani A, Fulceri R, Benedetti A. Arch Biochem Biophys. 1988;266:1–9. doi: 10.1016/0003-9861(88)90231-7. [DOI] [PubMed] [Google Scholar]
- 8.Fulceri R, Romani A, Pompella A, Benedetti A. Biochim Biophys Acta. 1990;1022:129–133. doi: 10.1016/0005-2736(90)90409-h. [DOI] [PubMed] [Google Scholar]
- 9.Senesi S, Marcolongo P, Kardon T, Bucci G, Sukhodub A, Burchell A, Benedetti A, Fulceri R. Biochem J. 2005;389:57–62. doi: 10.1042/BJ20050213. [DOI] [PMC free article] [PubMed] [Google Scholar]
- 10.Banhegy G, Marcolongo P, Fulceri R, Hinds C, Burchell A, Benedetti A. J Biol Chem. 1997;272:13584–13590. doi: 10.1074/jbc.272.21.13584. [DOI] [PubMed] [Google Scholar]
- 11.Pan CJ, Lei KJ, Annabi B, Hemrika W, Chou JY. J Biol Chem. 1998;273:6144–6148. doi: 10.1074/jbc.273.11.6144. [DOI] [PubMed] [Google Scholar]
- 12.Gerin I, Schaftingen EV. FEBS Lett. 2002;517:257–260. doi: 10.1016/s0014-5793(02)02640-6. [DOI] [PubMed] [Google Scholar]
- 13.Foster JD, Nordlie RC. Exp Biol Med. 2002;227:601–608. doi: 10.1177/153537020222700807. [DOI] [PubMed] [Google Scholar]
- 14.Berteloot A, Vidal H, van de Werve G. J Biol Chem. 1991;266:5497–5507. [PubMed] [Google Scholar]
- 15.St-Denis J-F, Berteloot A, Vidal H, Annabi B, van de Werve G. J Biol Chem. 1995;270:21092–21097. [PubMed] [Google Scholar]
- 16.Benedetti A, Fulceri R, Romani A, Comporti M. Biochim Biophys Acta. 1987;928:282–286. doi: 10.1016/0167-4889(87)90187-x. [DOI] [PubMed] [Google Scholar]
- 17.Benedetti A, Fulceri R, Romani A, Comporti M. J Biol Chem. 1988;263:3466–3473. [PubMed] [Google Scholar]
- 18.Seddon D, Fynn GH. Anal Biochem. 1973;56:566–570. doi: 10.1016/0003-2697(73)90221-2. [DOI] [PubMed] [Google Scholar]
- 19.Benedetti A, Fulceri R, Allan BB, Houston P, Sukhodub AL, Marcolongo P, Ethell B, Burchell B, Burchell A. Biochem J. 2002;367:505–510. doi: 10.1042/BJ20020187. [DOI] [PMC free article] [PubMed] [Google Scholar]
- 20.Fagan TE, Cefaratti C, Romani A. Am J Physiol. 2004;286:E184–E193. doi: 10.1152/ajpendo.00200.2003. [DOI] [PubMed] [Google Scholar]
- 21.Fabiato A. Meth Enzymol. 1988;157:378–417. doi: 10.1016/0076-6879(88)57093-3. [DOI] [PubMed] [Google Scholar]
- 22.Bradford MM. Anal Biochem. 1976;72:248–254. doi: 10.1006/abio.1976.9999. [DOI] [PubMed] [Google Scholar]
- 23.Terasaki M, Rubin H. Proc Natl Acad Sci USA. 1985;82:7324–7326. doi: 10.1073/pnas.82.21.7324. [DOI] [PMC free article] [PubMed] [Google Scholar]
- 24.Volpe P, Alderson-Lang BH, Nickols GA. Am J Physiol. 1990;258:C1077–C1085. doi: 10.1152/ajpcell.1990.258.6.C1077. [DOI] [PubMed] [Google Scholar]
- 25.Zahradnikova A, Dura M, Gyorke I, Escobar AL, Zahradnik I, Gyorke S. Am J Physiol. 2003;285:C1059–C1070. doi: 10.1152/ajpcell.00118.2003. [DOI] [PubMed] [Google Scholar]
- 26.Hiraiwa H, Pan CJ, Lin B, Moses SW, Chou JY. J Biol Chem. 1999;274:5532–5536. doi: 10.1074/jbc.274.9.5532. [DOI] [PubMed] [Google Scholar]
- 27.Harman AW, Nieminen AL, Lemasters JJ, Herman B. Biochem Biophys Res Commun. 1990;170:477–483. doi: 10.1016/0006-291x(90)92116-h. [DOI] [PubMed] [Google Scholar]
- 28.Barbagallo M, Dominguez LJ, Resnick LM. Am J Ther. 2007;14:375–385. doi: 10.1097/01.mjt.0000209676.91582.46. [DOI] [PubMed] [Google Scholar]
- 29.Young A, Cefaratti C, Romani A. Am J Physiol. 2003;284:G57–G67. doi: 10.1152/ajpgi.00153.2002. [DOI] [PubMed] [Google Scholar]
- 30.Grempler R, Günther S, Steffensen KR, Nilsson M, Barthel A, Schmoll D, Walter R. Biochem Biophys Res Commun. 2005;338:981–986. doi: 10.1016/j.bbrc.2005.10.030. [DOI] [PubMed] [Google Scholar]


