

Abstract
We used a new method to measure the perceived quality of contrast-enhanced motion video. Patients with impaired vision (n = 24) and normally-sighted subjects (n = 6) adjusted the level of MPEG-based enhancement of 8 videos (4 minutes each) drawn from 4 categories. They selected the level of enhancement that provided the preferred view of the videos, using a reducing-step-size staircase procedure. Most patients made consistent selections of the preferred level of enhancement, indicating an appreciation of and a perceived benefit from the MPEG-based enhancement. The selections varied between patients and were correlated with letter contrast sensitivity, but the selections were not affected by training, experience or video category. We measured just noticeable differences (JNDs) directly for videos, and mapped the image manipulation (enhancement in our case) onto an approximately linear perceptual space. These tools and approaches will be of value in other evaluations of the image quality of motion video manipulations.
Introduction
An estimated 3.5 to 4 million Americans have visual impairment (visual acuity: VA<20/60), and, due to aging of the population, [1] the number is projected to increase by 70% by 2020. [2] Diseases that cause central field loss (CFL), such as age-related macular degeneration, are the leading cause of legal blindness (VA<20/200). [2-5] When the central retina is damaged, people are forced to adopt a peripheral eccentric location (peripheral retinal locus: PRL [6]) for detailed visual tasks with the consequent reduced resolution (e.g. VA decreases by 50% at 2 deg from the center [7]).
Impairment of central vision impacts quality of life and daily activities, such as watching TV. [8] Watching TV is important to people with impaired vision, whose viewing habits are comparable to normally-sighted people. [9] However, people with visual impairment encounter difficulties in the recognition of faces and other details of the scene that impedes their ability to follow the action and to obtain complete information. Thus, visual impairment reduces enjoyment of TV and restricts access to a very important source of information.
A number of aids have been devised to improve TV watching. Optical magnification (e.g. by head- and spectacle-mounted telescopes) increases the retinal size of the image and therefore its resolution. However, the field limitation of telescopes may result in context being lost as the peripheral parts of the image are no longer visible. Sitting closer or using larger sized screens also provides magnification. Additional information can be provided by sensory substitution techniques such as audio description provided by Descriptive Video Service (DVS [10, 11]) or by other people. While useful, these are limited and may interfere with the TV experience.
Contrast enhancement via image processing that may be used together with optical magnification was first proposed in the 1980s. [12, 13] General contrast enhancement can increase the visibility of information in a video image (i.e., via histogram equalization [13, 14]). A spatial filtering algorithm, the adaptive enhancement, first applied by Peli and colleagues [12, 15] and later adopted by others [16, 17] applies band pass (or band enhance) filtering to increase contrast at those spatial frequencies to which people with visual impairment have reduced sensitivity. Such band enhancement has been applied to static images [15-19], analog videos [20-23] and digital compressed videos. [24, 25] Other approaches include converting the images to binary high contrast images using adaptive thresholding [13, 15, 17, 26] and adding high contrast edges to the image. [27, 28] A recent paper [17] compared a range of image enhancement algorithms, including an implementation of adaptive enhancement [12], though they had an additional parameter (slope) and did not enhance the same frequency range as Peli et al. [12, 15] Also, they [17] claimed to apply adaptive thresholding [15], but the image in their paper (Fig 2 top-right) bears no similarity to the equivalent figure in the original paper (Fig 4 bottom-left) [15] and no threshold level parameter was considered.
As described previously [24, 25], our MPEG-decoding video enhancement is based on filtering in the discrete cosine transform (DCT) domain by manipulating Intra- and Inter-quantization matrices of the JPEG aspect of the MPEG standard within the MPEG decompression stage. Each 8×8 block of DCT converted image block can be filtered by applying a multiplicative filter to the quantization matrices. [29] The enhancement visual effect is to increase contrast energy in specific spatial frequency bands above the block frequency. This enhancement, achieved within the decoder, has two advantages over post-processing of the image. The first is computational efficiency; no additional processing is required above that normally required for decoding once the modified (8×8) quantization matrix is calculated. The second is the reduction of block artifacts; increasing contrast within a block implicitly prevents the contrast of block-to-block changes becoming enhanced. Recently, we integrated this enhancement technique into open-source software available to decode MPEG-2 that enabled processing of real-time video segments from any MPEG source on a desktop computer. [25] The technique works in real time on a standard PC because it is computationally inexpensive. This flexible implementation facilitated improvements in the filter design and resolution of other difficulties encountered in previous implementations, including motion artifacts and edge-ringing artifacts. [25] Our MPEG enhancement would require minimal modification to conventional MPEG decoders, and could provide an inexpensive and flexible way of delivering image enhancement to people with visual impairment using any digital TV signal.
Before such general modification is made to digital TV chips, a benefit from image enhancement should be demonstrated. A major difficulty is the lack of appropriate methods to assess the value of motion video image enhancement. We have previously developed and tested a number of evaluation methods. [30] In some applications of image enhancement, such as medical imaging, [31] a specific task (e.g. detection or diagnosis) can be identified. Improvement in task performance (e.g. accuracy [31] or reaction time [32]) with and without enhancement may be compared. [33] There is, however, no accepted task(s) that represents performance of people watching TV for their entertainment. We have measured the receiver operating characteristics (ROC) in a celebrity-face recognition task (with static images) to demonstrate the effect of image enhancement, [18] but we do not know of similar performance measures that can be applied to video sequences. Another major difficulty of such assessments is the variable and constantly changing content and image characteristics inherent in a video sequence.
Previously, in an attempt to evaluate performance in a video sequence, we used a questionnaire we developed to assess the effectiveness of the auditory description techniques; however, it was not effective as people with visual impairment could correctly answer 70% of questions without audio description [11] or without image enhancement [22] (audio description was developed to be used by people with blindness and visual impairment).
As has been done with static images, [17, 28] the value of video enhancement has been evaluated using perceived image quality. [22, 24] It could be argued that the subjective perception of image quality is all that one should care about in our application of image enhancement to TV viewing, since viewing is primarily for pleasure. When asked to report perceived image quality following the presentation of video sequences, with and without image enhancement, patients reported difficulties making these comparisons as they differed in content, even though they were the continuation of the same program. [22] Patients found it easier to indicate their instantaneous perceived image quality by moving a mouse on a graphic bitpad. This technique was developed to measure patients’ continuous responses to changes in processing parameters of static images. [34] Peli and colleagues have used it to measure the effect of enhancement [19, 28] and also modified it to measure the responses to changes in enhancement parameters when watching moving videos. [22] Using this approach perceived-image-quality ROCs were used to demonstrate a preference for enhanced images over original images, but no difference between arbitrary-level enhanced and individually-tuned enhanced video sequences [22].
To reduce memory limitations that may occur with comparisons made between views seen at different times, patients can assess perceived image quality in a side-by-side comparison of enhanced and original video sequences. [23, 24] The two videos were displayed on the same monitor [24] or two matching monitors. [23] Short video sequences were repeated until the patient made a selection in one study. [24] This repeated presentation overcame the difficulty in comparing continuously variable content but limited the samples being evaluated. Possibly due to differences between the eyes, many patients with visual impairment had a bias to one side that limited the usefulness of side-by-side comparison in this population.
Previously, we [20-22] proposed that if individuals tune the level of enhancement consistently (e.g. spatial frequency, gain, threshold level) they would be demonstrating a perceived value of the image enhancement. Patients were shown to be able to apply such image-enhancement tuning consistently to static images. [22] Two small studies in which patients simultaneously controlled two or three image-enhancement parameters while watching video sequences were not successful, as the patients were unable to converge on a preferred enhancement in that large parameter space. [20, 21] In our current study, we evaluated the value of MPEG image enhancement [25] by measuring each patient’s continuous adjustment of the enhancement level, using a remote control as they watched video sequences.
Adaptation to image enhancement, whereby, enhanced (static) images are perceived as less enhanced or even normal after a short period of adaptation, was demonstrated by Webster et al. [35] Such adaptation to image enhancement may have affected the subjective evaluations of enhanced video and the value of enhancement in previous studies. On the other hand, such adaptation, which seems to maintain a relatively constant perception of the appearance of the world, may not diminish the benefits of image enhancement, since it could lead to the perception of the enhanced images as normal. A secondary aim of our study was to test the effect of adaptation by leaving part of the image unenhanced in half of the video presentations. In addition, possible effects of differences in motion, contrast and scene lighting between video sequences on the chosen level of enhancement were evaluated.
Methods
To assess the perceived quality of the MPEG enhanced videos we asked people with visual impairment to adjust the level of image enhancement while watching four-minute videos. We propose that a consistent selection of a level of image enhancement by people with visual impairment indicates that they noticed the effect of image enhancement and that they have a preference for a specific level of enhancement. We tested the hypothesis that videos of different categories (in terms of the amount of motion, scene brightness and contrast) might elicit different selections of the level of enhancement. Also, we examined the possibility that adaptation to enhanced (sharpened) imagery [35] may affect the perceived enhancement and thereby different level of enhancement settings would be chosen when adaptation was controlled or reduced.
General Procedure
Participants in the experiment, 24 patients with various visual impairment (mostly macular degeneration) and 6 subjects with normal or corrected-to-normal sight, adjusted the level of enhancement of playing MPEG videos using a hand-held IR remote control. The MPEG enhancement hardware and software system was described previously. [25] The participants were told that the purpose of the system was to make video clearer for them to see, but some settings could make details less clear. Participants were asked to find the preferred level of enhancement as soon as possible and to continue to verify, by frequent adjustment, that the selected level of enhancement was still preferred as the scene was changing. The adjustments applied by participants were controlled by a simple decreasing-step-size staircase, where step size was specified in terms of the just-noticeable-difference (JND).
The level of enhancement was controlled by a multiplication of the quantization matrix values in the encoded MPEG pictures during the decoding process. [19, 24, 25] The multiplication factor, k, applied by the remote control increased or decreased the visibility of image detail. The multiplication factor, k, and the filter shape matrix <set>ij, developed previously, [25] together define the filter, q ij, applied to the quantization matrix
| (1) |
With this relation setting k = 0 yields no enhancement (original), and k<0 results in image degradation (low pass). The filter, <set>, used is identical to that developed previously [25]. The specific values of the multiplicative array were developed empirically to enhance contrast energy in the higher spatial frequency bands and may be compactly described by letting:
| (2) |
and setting:
| (3) |
| (4) |
| (5) |
The DC coefficient, s(0), is never manipulated by the enhancement algorithm, thus s(0) = 0.
The requirement that q ij ≥ 0, constrains k > -34. Examples of the effect of this MPEG image enhancement on single video frames are shown in Fig. 1.
Fig. 1.

Examples of the effect of MPEG image enhancement on two video frames. The top row is the original (k = 0); the middle row is the level of enhancement chosen by patient 12 in the main experiment (k = 5); and the bottom row is the level of enhancement chosen by patient 24 in the main experiment (k = 13.6). In the main experiment, all 24 patients with visual impairment chose an image enhancement with k>0 (Fig. 7).
Preliminary experiments to describe the MPEG-image-enhancement perceptual space
To evaluate the perceptual space created by the MPEG image enhancement, we conducted three preliminary experiments using normally-sighted observers. The goal was to allow adjustments within that perceptual space to occur with approximately equal perceptual increments and to facilitate data analysis. The range of k values that resulted in reasonable image quality was established in pilot experiments. Though, we hypothesized that positive k values would be preferred, participants could choose negative k values. It was important to have a range of values that extends beyond no enhancement (k = 0), so that a ceiling (or floor) effect was not created, as participants adjusted the level of enhancement. Positive (enhancement) and negative (degradation) k values have different appearances at higher values (for higher negative k values the appearance is increasingly blurred and ‘blocky’). The transition from positive to negative k values changed the filter from high-enhanced (increasing contrast of higher frequencies) to low-pass (reducing contrast of higher frequencies).
The first preliminary experiment compared perceived image enhancement to k. The screen was split into three equal parts each displaying identical segments of the “Susi” test video sequence that looped repeatedly (Fig. 2). Two normally-sighted observers (authors MF and RW) adjusted the k of the middle video that was between two videos with different k values (Fig. 2), until the middle video appeared to be perceptually halfway between the enhancements on either side. First, the range of positive k values (enhancement), k = 0 to 80, was explored, then the range of negative k values (degradation), k = 0 to -34 was explored. The positive and negative ranges of k were treated separately because of their different appearances. Each range was first subdivided (split in half), then further subdivisions were made using the k values determined in previous subdivisions. For example, -1/4 was found by adjusting the image to appear halfway between 0 and -1/2 (k = 0 and k = -15; k = -15, being perceptually halfway between k = 0 and k = -34). Both observers made four estimates of each subdivision with the adjustment starting twice from the lower and twice from the higher k value (of one side), and with the higher k value video twice on the right and twice on the left. Each observer made seven subdivisions of the positive k range and four subdivisions of the negative k range, as shown in Fig. 3.
Fig. 2.

Illustration of the side-by-side video display used in the first and second preliminary experiments to examine the MPEG-enhancement perceptual space. In the example, the left side is the original video (k = 0), in the middle is a moderate level of enhancement (k = 26) and the right is the highest level of enhancement (k = 80) used in these experiments. In the first preliminary experiment the observer adjusted the middle video to a level of enhancement perceptually halfway between the levels on either side. That process was repeated to further subdivide the perceptual space. In the second preliminary experiment the middle image video was the original (k = 0) and on one side was a degraded video (k = -9). The observer adjusted the level of the enhancement of the other side to be perceptually equi-distant from the original image as the degraded video.
Fig. 3.

For MPEG-enhanced videos (k>0, above horizontal dashed line) there was an expansive relationship between perceived enhancement and k, and an approximately linear relationship for degraded videos (k<0). Data for the two normally-sighted observers are shown for the first (open symbols) and second (closed/solid symbols) preliminary experiments. The extreme values of the negative and positive ranges used in the first preliminary experiment are shown as crosses. The fits, shown as a solid line, were to the average of the two observers data in the first preliminary experiment. The comparison degraded video (k = -9) used in the second preliminary experiment is shown as a solid circle. It was perceived to be as far below the dashed line (original video) as the enhanced videos were above that line, shown as solid triangle and square.
As noted, there was a qualitative difference in appearance between the enhanced and degraded images. Therefore a second preliminary experiment determined perceptually equal intervals either side of the original image so we could describe k in the same units for both positive and negative values of k. The same three-part side-by-side display as in the first preliminary experiment was used (Fig. 2), with the original video in the middle and a degraded video, k = -9, on one side. The observer altered the positive k value of the third (other) side so that it appeared to be perceptually the same distance from the original image as the degraded image. That level of image degradation (k = -9) was chosen empirically to allow sufficient range of positive k values for the matching task. Both observers made four estimates of equidistance, with the adjustment starting twice from a high and twice from a low positive k value, and with the adjusted (positive k) video twice on the right and twice on the left. The average levels of enhancement chosen by each observer are shown in Fig. 3.
Based on those two preliminary experiments we defined an approximately linear perceptual scale for data processing and analysis. From the first preliminary experiment the perceived level of enhancement was non-linear (expansive) with positive k, while the fit for negative k was sufficiently close to linear, that we used a linear equation (Fig. 3). The negative scale was expanded to equate the negative and positive perceptual distances. Thus, the Enhancement Level was defined as:
| (6) |
The relationship between perceived enhancement and the enhancement parameter k on which equation 6 was based is shown in Fig. 3. The right ordinate axis of that figure shows Enhancement Level units.
In the third preliminary experiment, the JND of normally-sighted observers was determined. The JND was used for steps of the staircase in the main experiment, as smaller increments provide no visual feedback and therefore can be frustrating for participants. Two normally-sighted observers (one was author MF) viewed a screen split into two halves both showing the same section of the Susi test video (Fig. 4). The level of enhancement of the video shown in one half, the reference side, remained unmodified during a trial, whilst the level of enhancement of other side (the stimulus side), was changed by the computer. The level of enhancement of the stimulus side was gradually increased or decreased in linear 0.2 unit increments of k, except for higher levels of enhancement, k>40, when increments were 0.5 units and greater degradation, k<-10, when increments were 0.3 units. These larger increments facilitated the detection task, and were based on pilot tests. The observer’s task was to identify the stimulus side as soon as possible. To reduce adaptation effects that occur when a change is made gradually, the increments were alternated every 850 ms with the level of enhancement of the reference side. For example, if the level of enhancement of the reference side was k = 10, then the level of enhancement of the stimulus side was 10, 10.2, 10, 10.4, 10, 10.6, etc., each for 850 ms. If the observer incorrectly identified the reference side as changing, that trial was repeated later. JND was measured on both observers at ten reference levels of enhancement, with each level tested for increasing and for decreasing k. Data per reference level were averaged (except for the original reference video, k = 0, which were averaged separately for increasing and decreasing stimulus side enhancement), and separate linear fits derived for enhanced (k≥0) and degraded (k≤0) reference levels (Fig. 5). The two resulting fits were used to calculate the size of one JND at any given level of enhancement for the main experiment. This description of the perceptual space is valid for the television and settings used in the experiment, ensuring that each step made with the remote control was (just) detectable by a normally-sighted observer.
Fig. 4.

Illustration of the side-by-side video segments used to determine the just noticeable differences (JNDs) in levels of MPEG-enhancement in the third preliminary experiment. In this example the reference video is on the left, with k = 11.8. The level of enhancement of the stimulus video on the right alternated every 850ms between that of the reference video and a test level. The test level of enhancement was increased or decreased at every flicker cycle until the observer correctly reported the side that was flickering. The difference between the reference and test k at that time was the JND. The image shown on the right (k = 35.4) represents 4 JNDs, as a single JND is hard to appreciate in the print.
Fig. 5.
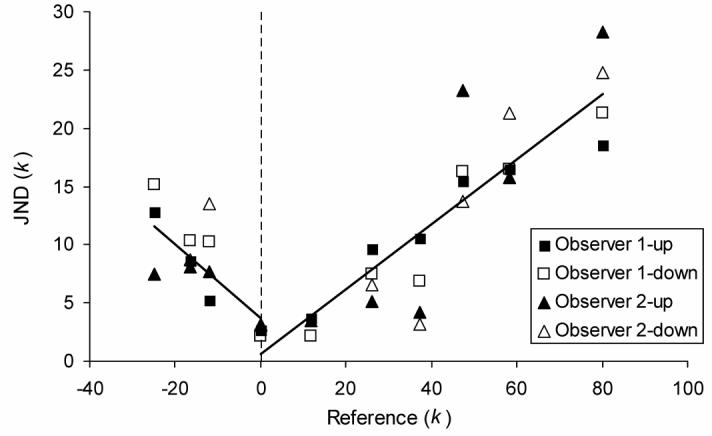
The measured just noticeable differences (JND) of enhanced (k>0, right of dashed line) and degraded (k<0) videos as a function of the reference level of enhancement (Fig. 4). The JND increased linearly with the level of enhancement. Data for the two normally-sighted observers, for increasing (“up”) and decreasing (“down”) levels of enhancement relative to the reference level, is shown. The linear fits were to the average of all data at each reference level, separately for reference level above and below k = 0.
Staircase
The adjustment applied by participants was controlled by a decreasing-step-size staircase and encouraged with audio cues. Each video segment was initiated with k at either a high (k = 70) or low (k = -30) level of enhancement (these extremes caused distortions due to saturation or severe low pass filtering and block artifacts, respectively). Starting from these extreme values, each remote control key press resulted in a level of enhancement change of 3 JNDs. Following the first two changes in direction of adjustment of the level of enhancement (“reversals”, i.e. increasing to decreasing or decreasing to increasing) in each video segment, each remote key press resulted in a level of enhancement change of 2 JNDs. Data collected after this transition is called post-exploratory data and was used to determine the chosen Enhancement Level of each video segment. During this post-exploratory stage, when a participant seemed to be ‘settling’ on a chosen level of enhancement, the effect of each remote control key press was decreased to 1 JND. ‘Settling’ was defined as a sequence of two reversals of direction (at the 2 JND level) with up to one intermediate level between reversals (e.g. if a participant pressed the ‘up’ control on the remote, followed by the ‘down’ control once or twice, followed by the ‘up’ control again) [36]. The post-exploratory stage of the staircase was designed so that each change made by a participant should be detectable to them. If they were unable to see changes below a 2 JND level, settled behavior was unlikely and the staircase would be less likely to move to the settled stage.
To ensure regular adjustment, participants were automatically encouraged by computer-generated speech output to adjust the enhancement if they had stopped adjusting. At first, such speech reminders were issued after 8 seconds of inaction, to encourage the speedy locating of an initial level of enhancement and progress towards the settled stage. If the staircase reached the settled stage (1 JND per key press), the period increased to 15 seconds.
Practice session
Participants were given ample opportunity to practice using the remote control applying the level of enhancement using increments and decrements of 2 JNDs on a short looping video containing various sequences cross-faded together. These included a cartoon, a dark nighttime scene, a basketball game and a martial arts film sequence.
The concepts of adjusting the level of enhancement were explained. Participants were first guided to increase the level of enhancement until a difference in the image appearance was noted and then to increase further to the point were the video appeared so distorted and saturated that it was unclear. Participants were also guided to decrease the level of enhancement to the point were the video appeared ‘blocky’ and blurred. Experimenters sought to ensure that participants understood that there were two extreme, unsuitable levels of enhancement, and that a better level would lie somewhere between these extreme levels. A short sound feedback was produced by the computer on every remote control key press, and a longer sound cue indicated that the maximum or minimum setting had been reached. These audio signals were demonstrated and explained to the participants.
Participants were asked to continuously watch the video and try to adjust it such that it looked best for them. It was suggested that when they thought that they were satisfied with the video as it looked at any point, they should adjust up or down and check if this made the video less satisfactory, returning to the previous level if that was the case. Participants were reminded that the video content would (naturally) be changing continuously, and that it was therefore appropriate to be reevaluating the video quality and making adjustments on a regular basis. The auditory reminders were demonstrated and explained and the participants were told that they should make an adjustment, in any direction upon hearing the auditory reminder. Participants were also told that they should not wait for the reminder before they made an adjustment.
We found that the experiment required a large amount of description and explanation for many patients. Experimenters took as much time as was required until they were satisfied that participants understood the instructions. To verify that the participant understood the instruction, a complete pilot trial was presented before the eight videos of the main experiment. This allowed the finer points of the task to be explained and any remaining questions to be answered.
Test video material
Four video categories were defined, with two samples in each category, giving eight videos in total. Each video lasted four minutes. The video categories defined in Table 1 were chosen to consistently exhibit characteristics that we hypothesized might require different levels of enhancement for people with visual impairment. Also, the video categories represent a wide range of TV material, to test the enhancement with a variety of source videos. Cartoons were included in our selection as we believed they would require lower enhancement. Johnson and Fairchild [30] found that the perceived image quality of a cartoon type image (a computer rendered cow) did not improve with sharpening (enhancement).
Table 1.
Descriptions of the video categories and the videos chosen to illustrate those categories.
| Video No. | Description | Source of video |
|
|---|---|---|---|
| Set 1 | Set 2 | ||
| 1/5 | Low motion: Well lit, with little motion. Example: Newsroom | Local television - ‘Roundtable’ discussion | Local television - city government zoning hearing |
| 2/6 | High motion: Average, reasonably constant lighting, with high motion. Example: Car chase | Car racing | Car racing (Formula 1) |
| 3/7 | Cartoon: High Contrast. Example: Animated cartoon. | The Simpsons | Yogi Bear |
| 4/8 | Dark: Low light, with low contrast. Example: Detective drama nighttime scene. | Batman Forever | Buffy the Vampire Slayer |
The first four videos from Set 1 (videos 1 to 4) were presented in a balanced sequence for the 24 patients, such that every possible order of videos 1 to 4 was used. The Set 2 videos (videos 5 to 8) followed in an alternative balanced sequence that ensured that two videos of one video category did not occur in sequence and to meet other requirements described below.
Each video comprised two continuous video segments of two minutes each. This length was chosen in order to provide both sufficient time for participants to find their preferred level, and elicit further ‘settled’ adjustments in the remaining time as additional measurements. Each video segment started from either an extremely enhanced (k = 70) or an extremely degraded (k = -30) level. The first and the second video segment of each video had different starting levels of enhancement. Of the 24 patients, 12 started their first video with high enhancement and the remaining 12 started their first video with high degradation. For each participant, the start level of each video was alternated across the eight videos. Thus, each participant saw four videos with the first video segment starting with high enhancement and four starting with high degradation. The ordering of set-1 and set-2 videos was such that for each video category, one video started with high enhancement and one video started with high degradation.
The split of each video into two segments allowed evaluation of the consistency of the chosen level of enhancement for each video and for effects of the starting level of enhancement. The two samples of each video category allowed examination of the hypothesized relationship between chosen level of enhancement and video category, and to address the possible effect of adaptation [35] on chosen level of enhancement.
Taking multiple measures of preference across the video, and the variable length of time taken to reach the post-exploratory stage (see Staircase, above) placed the requirement on the videos that they have similar imagery throughout. This was ensured through careful selection of the four-minute segment from each video source, except in the case of the dark set-2 video (Table 1) from which a short sequence of daylight scene was removed in such a way as to give the appearance of a continuous drama.
Adaptation to image enhancement
To permit a preliminary investigation into the effects of adaptation to image enhancement [35] on the choice of enhancement, an anchor region of the video was provided in half of the videos. The anchor region was not enhanced (original, k = 0) video. The hypothesis was that if the patient was able to see part of the video without enhancement, adaptation to the enhancement would not take place or it would be much reduced, resulting in a difference in the chosen level of enhancement between videos with and without an anchor region. In pilot testing, we found that an anchor region showing the original was frequently not noticed. To make the anchor more apparent, the anchor region was flickered at 1Hz between the current level of enhancement and the original video. The anchor region was a rectangular ring at the outer edge of the image, which surrounded an inner enhanced area (controlled by the remote key press) that filled 57% of the image. An anchor region in the middle of the image (e.g. split screen) would be expected to have higher impact on adaptation, but would have been disruptive to the viewing experience and possibly complicate the enhancement adjustment task of the patient. A surrounding ring was used as it was thought to be a practical design for controlling the adaptation effect and at the same time to be unobtrusive. Also, the ring shape was expected to avoid bias from a patient’s PRL, since some part of the anchor region would always be visible. The experimenter controlled the presence of the anchor region during the practice session, and ensured that the participant could notice it. Participants were told that when the anchor region was present they only had direct control over the central area. Of the 24 patients, 12 saw their first video with the anchor region and the remaining 12 saw their first video with no anchor region. For each participant, the presence of the anchor region was alternated across the eight videos. Thus, each participant saw four videos with the anchor region and four without the anchor region. The ordering of set-1 and set-2 videos was such that for each video category, one video was seen with and one was seen without the anchor region.
Apparatus
Videos were played on a 27“ Sylvania television model 642766 (Funai Corporation, Rutherford, NJ). MPEG videos were played using the adapted VLC media player software (www.videolan.org/vlc) developed previously [25] on a PC running Windows XP to implement our MPEG-based enhancement. Level of enhancement was controlled with a Zenith large button small universal TV remote control designed to be used by elderly or visually-impaired people (www.independentliving.com). The remote control communicated with the computer via a LIRC RS232 IR Receiver (zapway.de, Munich, Germany and Liebtech LLC Lakewood, NJ). The remote control setup supported participants’ holding down of a button in order to quickly explore the range of enhancement. Participants sat 3ft from the screen, an average TV viewing distance of people with visual impairment found in a previous study. [28] Participant position was not restrained during the experiment, and the display characteristics were not photometrically calibrated. If such enhancements are to be widely used, they must be effective without luminance calibration of the display, so studies of their value should be conducted using common or standard settings of the display. Effectively, our preliminary experiments on the perceptual space were a calibration of the display that we used.
Custom software written in C++ using wxWidgets (www.wxwidgets.org) controlled the order of presentation of videos, the presence of the anchor region and the starting level of enhancement of each video segment, and provided auditory feedback based on responses. The time of all remote control presses was recorded to a text file for later analysis.
Participants
Twenty four patients with visual impairment, aged 19 to 84 (median 61) years and with habitual binocular visual acuity 20/46 to 20/609 (median 20/136), were recruited from our database and local ophthalmic clinics. There were no differences in age, visual acuity, letter contrast sensitivity, PRL eccentricity or fixation stability between the 16 male and 8 female patients (Mann-Whitney, z8 to 23 <1.3, p>0.19). Single-letter visual acuity was measured using TestChart2000 Pro (Thomson Software Solutions, Herts, UK; www.thomson-software-solutions.com), with five letters of each size, using the stopping and scoring rules of Kitchen and Bailey. [37, 38]
Letter contrast sensitivity was measured for 49, 20, 10, 5 and 3mm high letters viewed at 450mm using custom software substantially modified from software provided by Bailey et al. [39] To provide a single measure of letter contrast sensitivity, the area under the letter contrast sensitivity function was found by integration of a third-order polynomial fit. [40]
A Nidek MP-1 retinal microperimeter (Nidek Technologies, Vigonza, Italy) was used to find the location of any PRL and to measure the stability of the eccentric fixation for patients with CFL. The MP-1 and a custom computerized central perimetry system were used to document CFL. Fixation stability was defined as the proportion of time that the MP-1 reported that fixation was within 2° of the fixation target.
Patients were asked a number of questions regarding their TV viewing habits at home, covering such areas as length of time spent watching, types of programs watched and the size of their television. They were also asked about what impact they felt their visual impairment had on their ability to watch and understand television programs. Following the main experiment patients were asked to comment on the helpfulness of the adjustable enhancement, and whether they thought it would be of benefit in their daily lives. Also, they were asked whether a commercial device would be worth paying for, and if so, how much, either as a one-time payment or monthly subscription to a cable company.
To allow comparison of the responses of the patients, six age-matched, normally-sighted subjects, aged 23 to 73 (median 60) years with binocular visual acuity 20/14 to 20/18 (median (20/15) were recruited from our database and associates.
Data Processing
Data files were processed using MATLAB (The Mathworks, Natick, MA) to provide summary plots of behavior for each patient (Fig. 6) and to compute the summary measures described below. Data after the second reversal for each video segment, the post-exploratory phase, were used in analyses.
Fig. 6.

Responses of three of the 30 patients (6 of which were excluded) to their first (left) and last (8th) (right) video. Each panel represents the staircase obtained for one video, composed of two 2-minutes video segments. In each video segment the dashed vertical line represents the time of the second reversal, and thus the commencement of the post-exploratory phase. The solid vertical line in the middle of each panel represents the transition between the two video segments, at which time the level of enhancement was reset to an extreme value. The dotted horizontal line through the staircase represents the median of the staircase values in the post-exploratory phase. The bottom row shows the responses of one of the six patients who were excluded. This patient could not appreciate the MPEG-enhancement and therefore alternated between the two extreme values (visual acuity 20/576). The first and second rows show responses of the median patient (#12, visual acuity 20/84) and the patient with the highest average chosen Enhancement Level (#24, visual acuity 20/152). Despite the occasional explorations, as was requested of the patients, these two patients clearly had a reliable preference for a certain level of enhancement.
The median Enhancement Level (eq. 6) selected in the post-exploratory phase of each video segment was defined as the chosen Enhancement Level. The inter-quartile range of Enhancement Level was used as a basis of exclusion from further analysis of patients who seemed unable to perform the task, either due to a lack of understanding or an inability to find a preferred level of enhancement. Three patients with an average (across all 16 video segments) inter-quartile range above 0.25 units were excluded. Such patients continuously and repeatedly ‘swept’ the range from the most negative to most positive k, and reported seeing no effect (e.g. bottom panel of Fig. 6). Also excluded were three patients who took longer than 80s to reach the post-exploratory phase (i.e. make two reversals) in any video segment during the main experiment. Recruitment continued until all excluded patients were replaced.
There were no significant differences in visual acuity (Mann-Whitney, z29 = 0.26, p = 0.98) or PRL eccentricity (z26 = 0.06, p = 0.95) between the 24 patients who were included in the data analysis and the 6 patients who were excluded. The 6 excluded patients were slightly, but not significantly, older (median 76, 36 to 85 years) than the 24 patients who were included (z29 = 1.74, p = 0.08).
Statistical Analyses
Statistical analyses were conducted with SPSS 11.0.4 for Mac. In general, within-participant distributions were approximately normally distributed, whereas, between-participants distributions were often skewed. Since sample sizes were relatively small and normality of distributions was uncertain, where possible, non-parametric statistical tests were applied. Analyses for which a repeated-measures ANOVA was the most powerful available test, were followed by non-parametric post-hoc tests to confirm the outcome. A significance level of p<0.05 was considered statistically significant.
Results
As illustrated in Fig 6, the people with visual impairment that were recruited for the main experiment were able to effectively select a level of enhancement to their liking. With the encouragement to regularly adjust, as used here for evaluation purposes, they also returned most of the time to the same level of enhancement after a brief exploration of other levels of enhancement. As there were no significant effects of other factors (see below), the average of the chosen Enhancement Levels for the 16 video segments is shown for each patient (Fig 7). Each of the 24 patients chose, on average, to enhance the videos (Enhancement Level > 0) as shown in Fig. 7. Patients consistently chose Enhancement Levels that were above zero for each video segment, except for one video segment by patient #6 (Dark-2: -0.003) and one video segment by patient #9 (Cartoon-2: -0.01) out of the total 384 video segments. The average chosen Enhancement Levels were significantly above zero for all patients (t15>4.8, p<0.001). The effect of the average chosen Enhancement Level selected by two patients is illustrated in Fig. 1. No patient’s chosen Enhancement Level was above 0.55 (k = 33) for any video segment.
Fig. 7.
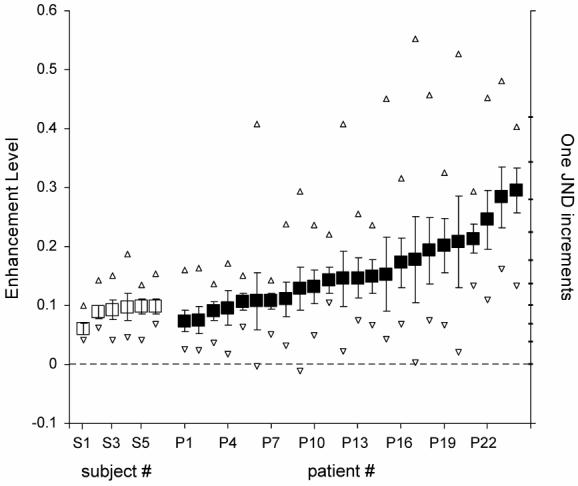
The chosen Enhancement Level averaged across all 16 video segments for each of the 24 patients with visual impairment (filled squares) and 6 normally-sighted subjects (open squares). The maximum and minimum chosen Enhancement Levels chosen for a video segment by each participant are shown as open triangles. Error bars are 95% confidence limits of the mean. All participants had average chosen Enhancements Levels significantly above zero (no enhancement), with only two patients choosing an Enhancement Level, each for only one video segment, that was not above zero. No patient had a chosen Enhancement Level above 0.55 (k = 33).
The normally-sighted subjects selected a low level of enhancement, significantly different from the patients (Mann-Whitney, z29=-2.85, p=0.04). As shown in Figure 7, they all chose Enhancement Levels that were above zero for each video segment, and all average chosen Enhancement Levels (open squares) were significantly above zero (t15>9.0, p<0.001). These six subjects chose levels of enhancement that were similar to the lowest levels chosen by the patients with visual impairment.
Averaged across all patients, there were no effects of the order in which the videos were presented (each patient saw a different sequence of videos) on the chosen Enhancement Level for each video (Spearman r7 = -0.14, p = 0.74). For three patients, Patient #18 (Spearman r7 = -0.81, p = 0.015), Patient #17 (Spearman r7 = -0.76, p = 0.03), and Patient #1 (Spearman r7 = -0.71, p = 0.05), chosen Enhancement Level decreased with time (negative correlations with video order) and for Patient #19 there was a trend for increased Enhancement Level with time (Spearman r7 = 0.67, p = 0.07). Such effects are often attributed to adaptation or experience, but could have resulted from the particular sequence of videos experienced by those patients, as there were small differences in the chosen Enhancement Levels between videos. As illustrated in Fig. 6, there was no significant difference between the first and second video segments (repeated measures ANOVA, F1,23 = 0.01, p = 0.91; Wilcoxon Signed Rank, Z23>1.5, p<0.14) and no significant difference between low and high video-segment-starting Enhancement Levels (repeated measures ANOVA, F1,20 = 1.6, p = 0.22; Wilcoxon Signed Rank, Z23≤1.26, p≥0.21), indicating that patients were consistent in their chosen Enhancement Level.
We hypothesized that there may be differences in the chosen Enhancement Levels between videos and between video categories. There were no significant differences between the four video categories (repeated measures ANOVA, F3,69 = 2.03, p = 0.12) and small differences between videos (repeated measures ANOVA, F7,161 = 1.95, p = 0.065; significant paired differences are shown in Fig. 8). Also, we hypothesized that the presence of an anchor region (non-enhanced ring) might mitigate effects of adaptation to image enhancement, thereby altering the chosen Enhancement Level. The presence of the anchor region had no significant effect (Mann-Whitney, z23 ≤ 1.72, p ≥ 0.09). Similarly, we hypothesized that visual status might affect the chosen Enhancement Level. Consistent with that hypothesis, there was a trend for people with worse contrast sensitivity to choose higher levels of enhancement (contrast sensitivity data was available for only 22 subjects). Chosen Enhancement Level was significantly correlated with letter contrast sensitivity for 49mm letters (Spearman r22 = -0.49, p = 0.02), 3mm letters (Spearman r22 = -0.44, p = 0.04), and for the area under the letter contrast sensitivity function (Spearman r22 = -0.46, p = 0.03). Correlation approached statistical significance with 5mm letters (Spearman r22 = -0.41, p = 0.06). Correlation was not found with visual acuity (Spearman r23 = 0.26, p = 0.22) or PRL eccentricity in the better eye (Spearman r21 = 0.28, p = 0.20). Chosen Enhancement Level was significantly correlated with fixation stability in the right (Spearman r19 = 0.49, p = 0.03) but not left (Spearman r21 = 0.14, p = 0.54) or better (Spearman r21 = 0.24, p = 0.28) eye. Also, there was no significant correlation between chosen Enhancement Levels and patient age (Spearman r23 = -0.04, p = 0.86), and there was no significant difference in the chosen Enhancement Levels between male and female patients (Mann-Whitney, z23 = 0.61, p = 0.54).
Fig. 8.
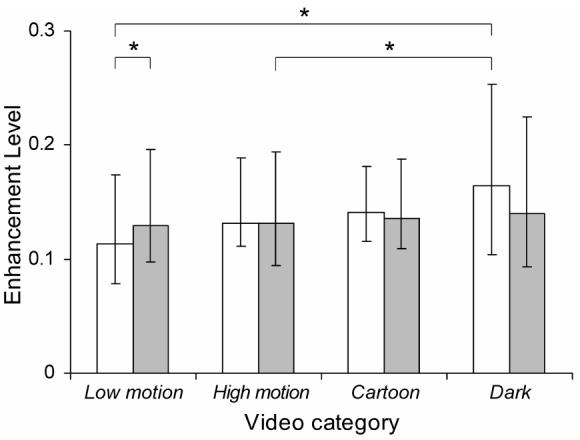
Planned analyses showed significant differences in the Enhancement Levels chosen by the 24 patients between some videos (* = p<0.05). The Set 1 (open/white) video segments were all viewed before the Set 2 (gray) video segments. As the distributions of chosen Enhancement Levels across patients were not normally distributed, the median is shown, and error bars are first and third quartiles.
Among the 24 included patients, 10 patients reported the use of a telescope to assist watching TV while at home. The median viewing time was 2.5 (range 0.1 to 10) hours per day. Movies (n = 20), sports (n = 19), news (n = 18) and documentaries (n = 17) were the most commonly reported types of programs viewed. The median reported TV size was 29 (range 12 to 53) inches-diagonal and the median reported viewing distance was 1.8 (range 0.1 to 5.5) metres, such that the median calculated visual angle subtended by that TV-diagonal was 28 (range 7 to 81) degrees. Some patients reported multiple viewing distances that depended on the setting (e.g. room, presence of others). Thirteen of 24 patients reported difficulty following the story line while watching TV and movies.
The questionnaire following the main experiment was completed by 23 patients. Of those 23: 22 patients felt that the MPEG-enhancement was helpful, 17 patients felt that the MPEG-enhancement would improve daily viewing, and 16 patients reported being prepared to pay for the MPEG-enhancement. While there was a tendency, patients who reported having trouble following the storyline while watching television were not significantly more likely to report that the MPEG enhancement was beneficial (Fisher Exact test, p = 0.25) or be prepared to pay for it (Fisher Exact test, p = 0.16). There were no significant differences in age, visual acuity, PRL eccentricity, fixation stability or chosen Enhancement Level between the patients who reported being prepared to pay and those not prepared to pay (Mann-Whitney, z19 to 22<1.3, p>0.19). Of those 16 patients who would be prepared to pay for the MPEG-enhancement, the median one-time amount that patients reported as being prepared to pay was $150 (range $50 to $1,250) and the median amount that patients reported being prepared to pay for a monthly subscription service was $5 (range $0 to $20).
Discussion
Evaluating or measuring image quality is far from being a solved problem, even for static images, as is evidenced by this special issue of the journal. Wang and Bovik in the preface to their book on computational image quality [41] made a number of interesting observations. They reported that a literature search yielded 400 times as many articles on image enhancement as there were papers on image quality assessment. They proposed that for a computational image quality metric to be relevant it has to predict the judgment of human observers, as this is the ultimate purpose of the effort. Approaches for measuring and correlating the human response to computational measures of image quality and sharpness have been reported for static analog (non-compressed) images by a number of groups [42-44]. In this paper we propose a method of subjective evaluation that may be able to address image quality in compressed video. Wang and Bovik pointed out that assessing the quality of motion video is the most relevant problem to be solved.
All the problems encountered in assessing quality of static images become substantially more difficult when dealing with motion video. Inherent in motion video is the continuous changes of the image and, with it, the likelihood of time-varying image quality of the original as well as a time-varying effect of the manipulation being assessed (e.g. effect of enhancement or compression). While in some applications certain performance measures may be of interest and offer possible ways to assess directly the image quality, we do not know of a measure that could be applied to the perceived quality of video watched for pleasure, the most common use of video. Therefore, indirect measures, such as preference or perception of image quality, are required.
While the image quality of the original content may vary with time, in many situations one would like to assess the effect of image manipulations, such as compression, or enhancement on the perceived quality. It would be preferable if any such measure will be at least partially independent from the effect of the quality of the original content. We believe that the approach we developed and tested here appears promising in this regard. Our study was limited to assessing video manipulation effects of changing one parameter at a time. This may be expandable to multiple parameter manipulations if the effects of various parameters are completely or largely independent [22]. Proving or demonstrating such independence is not a simple problem either.
We are interested in image quality assessment in general, but particularly as a tool for assessing the value of image enhancements that we develop for people with visual impairment. Using our tuning approach with our MPEG enhancement, we found that all patients (who could perform the task at all) chose some level of enhancement-thus, we have shown that the MPEG enhancement improved the image quality. The chosen levels of enhancement varied between patients. There were significant differences between some patients (see non-overlap of 95% confidence intervals in Fig. 7). Note also that the small 95% confidence intervals indicate that the patients were consistent between video segments in their chosen levels of enhancement. The differences between viewers suggests that any device implementing such image enhancement would probably need to allow for individual tuning. It is clearly interesting and important to determine what affects the level of enhancement selected. As in previous studies, [22, 28] the level of enhancement selected was not correlated with visual acuity. However, in this study we did find such a factor to be the letter contrast sensitivity. Furthermore, significant correlation was found with 3mm letters (fundamental spatial frequency 6.5 cyc/deg) and approached significance with 5mm letters (3.9 cyc/deg). These frequencies fall roughly in the middle of the range of frequencies enhanced by the system. [24] The correlation with much lower spatial frequencies (49mm letters) may be related to enhancement of these frequencies through the non-linear retinal response driven by enhancing the edges of large features across the image [45].
The level of enhancement selected by patients was low to moderate, a level of enhancement that should not be bothersome to people with normal sight, with whom the viewing experience may be shared. It is a level of enhancement that results in only minimal image distortion, suggesting that the patients prefer a naturally looking image even at a cost of clarity and details. The low level of enhancement selected by people with significant visual impairment may surprise readers. It is, however, consistent with our finding of moderate enhancement being preferred in previous studies [22, 24, 28]. Note that the observation distance of people with visual impairments is much closer than that of people with normal sight and that reduced distance improves their ability to discern visual details on the screen (including enhancement induced distortions) that would be invisible for them at the standard observation distance.
Since we found only a minimal effect of video category, video sample, or video segment, there appears to be no need to adjust the level of enhancement differently for different videos. It also suggests that, at least for the MPEG-based enhancement approach we were testing, the user may not need to adjust their setting very frequently while watching. This is likely to make the experience more comfortable and relaxed.
We found no effect of the anchor region (non-enhanced flashing ring) which we implemented to investigate possible effect of adaptation to enhancement of the type demonstrated by Webster at al [35]. We have anecdotal reports from the patients and experimenters that patients frequently did not notice the ring during the study even though its presence was demonstrated during the practice session. Though we did not find an effect of the ring, that does not mean that there was no adaptation, only that, if it does occur, adaptation does not affect the level of enhancement that provides the preferred appearance. The impact of such adaptations on the perception of images is still not clear.
We found that patients with visual impairment can select their preferred level of enhancement in a staircase procedure. An effective and comfortable staircase often starts with a large step size to quickly progress to the level of interest (e.g. threshold, subjective equality) and then step size is reduced to facilitate determination of that level of interest. The optimal step size depends on a number of factors, including the spread (slope) of the psychometric function (e.g. [46, 47]). In the absence of prior knowledge of the spread of the psychometric function to be measured, we propose that the JND is a reasonable choice for the smallest step size. We are not aware of a study that has evaluated the relationship between JND and the spread of the psychometric function. The average inter-quartile range (spread of responses for each video segment) of our 24 patients varied between about 2 and 6 JND steps. A secondary problem encountered in applying the staircase is that the JNDs may vary with the level being tested. When the staircase procedure requires adjustment of the gain by more than one JND, and if, as in our case, the JND varies with the level of the parameter setting, then a method for computing the step size is required. We used an iterative algorithm to compute the step size. An analytic equation would allow direct calculation of the step size required to achieve any desired number of JNDs.
The magnitude of the improvement perceived by the participants was not directly assessed by our method. However, since we measured the JND directly we could express the selected level of enhancement in terms (units) of JNDs. Using JND as a measure of difference between images in measures of image quality is a long standing tradition. The Sarnoff Visual Discrimination Model [48] computes a JND map showing the local difference in the image in units of JNDs. An average JND then is computed from this map, though it is not clear that averaging the JND across an image is a reasonable way to quantify the overall effect. Lubin [48] showed that for a number of experiments with static images the average JNDs were correlated with observers rating data for compressed images. Correlation is necessary but might be not be a sufficient indication of the representation provided by the measure. A similar approach using a computed JNDs map over a difference image was applied recently by Watson in using the spatial standard observer [49]. In both Lubin’s [48] and Watson’s [49] approaches the JNDs were computed using contrast detection JND data and rules of combination, but we are not aware of a demonstration of the validity of the JND measure for the whole image. Peli and colleagues [50-53] have measured JND between two images in various conditions and showed that their models could predict the detection of the differences, though they did not apply the concept of JND directly and did not address units or situations of multiple JNDs. Xia et al. [54] measured the JNDs for chromaticity, black level, white level and contour rendering using natural static images. They noted that for natural images the JNDs were much larger than those derived from homogeneous test patterns. This is not surprising as the natural image content serves to mask image differences. When comparing video sequences the temporal variability of the images is likely to similarly mask spatial (and temporal) differences, increasing the JND, as we found previously. [55] Here, we directly measured the JND on video sequences, measured the JND at different levels of the enhancement, and mapped the perceptual space for the enhancement parameter. All these measures enabled us to assess and quantify the effect of the MPEG enhancement in a more complete and direct way than previously done. We believe that this approach is naturally expandable to compression or any other image manipulations. These types of measurements should form the background for any computational model that attempts to predict the measured effect and thus could be used as tools for video image quality measurement.
Acknowledgement
Supported in part by NIH grants # EY05957 and EY12890. Doris Apfelbaum assisted with patient recruitment and scheduling, and Katherine Wagner helped with programming the main experiment.
References
- 1.U.S. Census Bureau . U.S. interim projections by age, sex, race, and Hispanic origin. U.S. Census Bureau, Population Division, Population Projections Branch; 2004. Available at http://www.census.gov/ipc/www/usinterimproj/ [Google Scholar]
- 2.Congdon N, O’Colmain B, Klaver CC, Klein R, Munoz B, Friedman DS, Kempen J, Taylor HR, Mitchell P. Causes and prevalence of visual impairment among adults in the United States. Arch. Ophthalmol. 2004;122(4):477–485. doi: 10.1001/archopht.122.4.477. [DOI] [PubMed] [Google Scholar]
- 3.Seddon JM, Chen CA. The epidemiology of age-related macular degeneration. Int. Ophthalmol. Clin. 2004;44(4):17–39. doi: 10.1097/00004397-200404440-00004. [DOI] [PubMed] [Google Scholar]
- 4.Bunce C, Wormald R. Leading causes of certification for blindness and partial sight in England & Wales. BMC Public Health. 2006;6:1–7. doi: 10.1186/1471-2458-6-58. [DOI] [PMC free article] [PubMed] [Google Scholar]
- 5.Mitchell J, Bradley C. Quality of life in age-related macular degeneration: a review of the literature. Health Qual. Life Outcomes. 2006;4:97. doi: 10.1186/1477-7525-4-97. [DOI] [PMC free article] [PubMed] [Google Scholar]
- 6.Timberlake GT, Mainster MA, Peli E, Augliere RA, Essock EA, Arend LE. Reading with a macular scotoma I. Retinal location of scotoma and fixation area. Invest. Ophthalmol. Vis. Sci. 1986;27(7):1137–1147. [PubMed] [Google Scholar]
- 7.Ciuffreda KJ. Accommodation and its anomalies. In: Charman WN, editor. Visual Optics & Instrumentation: Vision & Visual Dysfunction. Mac Millan; 1991. pp. 231–279. [Google Scholar]
- 8.Hassell JB, Lamoureux EL, Keeffe JE. Impact of age related macular degeneration on quality of life. Br. J. Ophthalmol. 2006;90(5):593–596. doi: 10.1136/bjo.2005.086595. [DOI] [PMC free article] [PubMed] [Google Scholar]
- 9.Packer J, Kirchner C. Who’s watching? A profile of the blind and visually impaired audience for television and video. American Foundation for the Blind; 1997. Available at http://www.afb.org/section.asp?SectionID=3&TopicID=140&DocumentID=1232. [Google Scholar]
- 10.Cronin BJ, King SR. The development of the descriptive video service. Journal of Visual Impairment and Blindness. 1990;84(10):503–506. [Google Scholar]
- 11.Peli E, Fine EM, Labianca AT. Evaluating visual information provided by audio description. J. Vis. Impair. Blind. 1996;90:378–385. [Google Scholar]
- 12.Peli E, Peli T. Image enhancement for the visually impaired. Optical Eng. 1984;23(1):47–51. [Google Scholar]
- 13.Peli E, Arend LE, Jr., Timberlake GT. Computerized image enhancement for low vision: New technology, new possibilities. J. Vis. Impair. Blind. 1986;80:849–854. [Google Scholar]
- 14.Isenberg L, Luebker A, Legge GE. Image enhancement of faces for normal and low vision (abstract) Invest. Ophthalmol. Vis. Sci. 1989;30(4):S396. [Google Scholar]
- 15.Peli E, Goldstein RB, Young GM, Trempe CL, Buzney SM. Image enhancement for the visually impaired: Simulations and experimental results. Invest. Ophthalmol. Vis. Sci. 1991;32(8):2337–2350. [PubMed] [Google Scholar]
- 16.Myers L, Rogers S, Kabrisky M, Burns T. Image perception and enhancement for the visually impaired. IEEE Engineering in Medicine and Biology. 1995:594–602. [Google Scholar]
- 17.Leat SJ, Omoruyi G, Kennedy A, Jernigan E. Generic and customized digital image enhancement filters for the visually impaired. Vision Res. 2005;45(15):1991–2007. doi: 10.1016/j.visres.2005.01.028. [DOI] [PubMed] [Google Scholar]
- 18.Peli E, Lee E, Trempe CL, Buzney S. Image enhancement for the visually impaired: the effects of enhancement on face recognition. J. Opt. Soc. Am. A Opt. Image Sci. Vis. 1994;11(7):1929–1939. doi: 10.1364/josaa.11.001929. [DOI] [PubMed] [Google Scholar]
- 19.Tang J, Kim J, Peli E. Image enhancement in the JPEG domain for people with vision impairment. IEEE Trans. Biomed. Eng. 2004;51(11):2013–2023. doi: 10.1109/TBME.2004.834264. [DOI] [PubMed] [Google Scholar]
- 20.Peli E, Fine EM, Pisano K. Video enhancement of text and movies for the visually impaired. In: Kooijman AC, Looijestijn PL, Welling JA, van der Wildt GJ, editors. Low Vision: Research and New Developments in Rehabilitation. IOS Press; 1994. pp. 191–198. [Google Scholar]
- 21.Fine EM, Peli E, Brady N. Evaluating video enhancement for visually impaired viewers; Proceedings of Vision ‘96: V International Conference on Low Vision; ONCE. 1996.pp. 85–92. [Google Scholar]
- 22.Peli E. Recognition performance and perceived quality of video enhanced for the visually impaired. Ophthal. Physiol. Opt. 2005;25(6):543–555. doi: 10.1111/j.1475-1313.2005.00340.x. [DOI] [PMC free article] [PubMed] [Google Scholar]
- 23.Fullerton M, Peli E. People with visual impairment prefer TV viewing using a contrast enhancement consumer product; SID International Symposium Digest of Technical Papers; Society for Information Display. 2007; pp. 975–978. 15.4. [Google Scholar]
- 24.Kim J, Vora A, Peli E. MPEG-based image enhancement for the visually impaired. Optical Eng. 2004;43(6):1318–1328. [Google Scholar]
- 25.Fullerton M, Peli E. Post-transmission digital video enhancement for people with visual impairments. J. Soc. Inf. Disp. 2006;14(1):15–24. doi: 10.1889/1.2166829. [DOI] [PMC free article] [PubMed] [Google Scholar]
- 26.Peli E. Simple 1-D enhancement for head-mounted low vision aid. Visual Impairment Res. 1999;1(1):3–10. [Google Scholar]
- 27.Massof RW. High-tech help for low vision. NASA Tech Briefs. 1993;17:20–22. [Google Scholar]
- 28.Peli E, Kim J, Yitzhaky Y, Goldstein RB, Woods RL. Wideband enhancement of television images for people with visual impairment. J. Opt. Soc. Am. A Opt. Image Sci. Vis. 2004;21(6):937–950. doi: 10.1364/josaa.21.000937. [DOI] [PubMed] [Google Scholar]
- 29.Tang J, Peli E, Acton S. Image enhancement using a contrast measure in the compressed domain. IEEE Signal Processing Let. 2003;10(10):289–292. [Google Scholar]
- 30.Peli E. Image enhancement for impaired vision: The challenge of evaluation; Proceedings of the 1st International IEEE Symposium on Research on Assistive Technologies; IEEE Computer Society. 2007.pp. 47–58. [Google Scholar]
- 31.Krupinski EA. Using the human observer to assess medical image display quality. J. Soc. Inf. Disp. 2006;14(10):927–932. [Google Scholar]
- 32.Krupinski EA, Roehrig H, Fan J. Influence of 8-bit vs. 11-bit digital medical displays on observer performance and visual search; SID International Symposium Digest of Technical Papers; Society for Information Display. 2007; pp. 965–966. 15.1. [Google Scholar]
- 33.Peli E. Enhancement of retinal images: pros and problems. Neurosci. Biobehav. Rev. 1993;17:477–482. doi: 10.1016/s0149-7634(05)80126-5. [DOI] [PubMed] [Google Scholar]
- 34.Hamberg R, de Ridder H. Continuous assessment of perceptual image quality. J. Opt. Soc. Am. A Opt. Image Sci. Vis. 1995;12(12):2573–2577. doi: 10.1364/josaa.12.002573. [DOI] [PubMed] [Google Scholar]
- 35.Webster MA, Georgeson MA, Webster SM. Neural adjustments to image blur. Nat. Neurosci. 2002;5(9):839–840. doi: 10.1038/nn906. [DOI] [PubMed] [Google Scholar]
- 36.“Due to a rounding error in the experimental code, only 97 of 213 (46%) of these first double-reversals with an intermediate step within the post-exploratory phase correctly transitioned the staircase to the 1 JND (settled) stage (thus delaying the transition to another reversal where there was no intermediate step, or to one with an intermediate step where the error did not occur). There was no significant effect on the Enhancement Level selected by patients whose staircases experienced this error (Wilcoxon Signed Rank, Z23 = -0.17, p = 0.86) nor was there any significant effect on chosen level when staircases naturally did not reach the 1 JND level, compared to those that transitioned correctly (Wilcoxon Signed Rank, Z9 ≤ -0.15, p ≥ 0.44).”
- 37.Kitchin JE, Bailey I. Task complexity and visual acuity in senile macular degeneration. Aust. J. Optom. 1981;64:235–242. [Google Scholar]
- 38.Ferris FL, 3rd, Kassoff A, Bresnick GH, Bailey I. New visual acuity charts for clinical research. Am. J. Ophthalmol. 1982;94(1):91–96. [PubMed] [Google Scholar]
- 39.Bailey IL, Fitz SN, Akinlabi GA. Contrast sensitivity and efficiency at search and detection tasks (Abstract) Invest. Ophthalmol. Vis. Sci. 2003;44(5):2771. [Google Scholar]
- 40.Applegate RA, Howland HC, Sharp RP, Cottingham AJ, Yee RW. Corneal aberrations and visual performance after radial keratotomy. J. Refr. Surg. 1998;14(4):397–407. doi: 10.3928/1081-597X-19980701-05. [DOI] [PubMed] [Google Scholar]
- 41.Wang Z, Bovik AC. Modern Image Quality Assessment. Morgan & Claypool Publishers; 2006. Synthesis Lectures on Image, Video & Multimedia Processing; p. 146. [Google Scholar]
- 42.Kayargadde V, Martens JB. Perceptual characterization of images degraded by blur and noise: model. J. Opt. Soc. Am. A Opt. Image Sci. Vis. 1996;13(6):1178–1188. doi: 10.1364/josaa.13.001178. [DOI] [PubMed] [Google Scholar]
- 43.Kayargadde V, Martens JB. Perceptual characterization of images degraded by blur and noise: experiments. J. Opt. Soc. Am. A Opt. Image Sci. Vis. 1996;13(6):1166–1177. doi: 10.1364/josaa.13.001166. [DOI] [PubMed] [Google Scholar]
- 44.Johnson GM, Fairchild MD. Sharpness rules; Proceedings of the 8th IS&T/SID Color Imaging Conference: Color Science and Engineering; Society for Imaging Science and Technology/Society for Information Display. 2000.pp. 24–30. [Google Scholar]
- 45.Peli E. Perception and interpretation of high-pass filtered images. Optical Eng. 1992;31(1):74–81. [Google Scholar]
- 46.Garcia-Perez M. Forced-choice staircases with fixed step sizes: asymptotic and small-sample properties. Vision Res. 1998;38:1861–1881. doi: 10.1016/s0042-6989(97)00340-4. [DOI] [PubMed] [Google Scholar]
- 47.Garcia-Perez MA. Yes-no staircases with fixed step sizes: psychometric properties and optimal setup. Optom. Vis. Sci. 2001;78(1):56–64. doi: 10.1097/00006324-200101010-00015. [DOI] [PubMed] [Google Scholar]
- 48.Lubin J. A visual discrimination model for imaging system design and evaluation. In: Peli E, editor. Vision Models for Target Detection. World Scientific; 1995. pp. 245–283. [Google Scholar]
- 49.Watson AB. The spatial standard observer: A human vision model for display inspection; SID Symposium Digest of Technical Papers; Society for Information Display. 2006; pp. 1312–1315. 31.1. [Google Scholar]
- 50.Peli E. Test of a model of foveal vision by using simulations. J. Opt. Soc. Am. A Opt. Image Sci. Vis. 1996;13(6):1131–1138. doi: 10.1364/josaa.13.001131. [DOI] [PubMed] [Google Scholar]
- 51.Peli E. Contrast sensitivity function and image discrimination. J. Opt. Soc. Am. A Opt. Image Sci. Vis. 2001;18(2):283–293. doi: 10.1364/josaa.18.000283. [DOI] [PubMed] [Google Scholar]
- 52.Peli E, Geri GA. Discrimination of wide-field images as a test of a peripheral-vision model. J. Opt. Soc. Am. A Opt. Image Sci. Vis. 2001;18(2):294–301. doi: 10.1364/josaa.18.000294. [DOI] [PubMed] [Google Scholar]
- 53.Peli E, Lang A. Appearance of images through a multifocal intra ocular lens. J. Opt. Soc. Am. A Opt. Image Sci. Vis. 2001;18(2):302–309. doi: 10.1364/josaa.18.000302. [DOI] [PubMed] [Google Scholar]
- 54.Xia J, Qin SL, Liu L, Heynderickx I, Yin HC. The just noticeable difference in chromaticity, black level, white level and contour rendering in natural images; Proceedings of the 12th International Display Workshops in conjunction with Asia Display 2005; Society for Information Display. 2005.pp. 1821–1824. [Google Scholar]
- 55.Peli E, Hedges TR, Tang J, Landmann D. A binocular stereoscopic display system with coupled convergence and accommodation demands; SID International Symposium Digest of Technical Papers; Society for Information Display. 2001; pp. 1296–1299. 53.2. [Google Scholar]