

Abstract
To determine the genetic variation that contributes to body composition in the mouse, we interbred a wild-derived strain (PWK/PhJ; PWK) with a common laboratory strain (C57BL/6J; B6). The parental, F1, and F2 mice were phenotyped at 18 weeks old for body weight and composition using dual-energy X-ray absorptiometry (DEXA). A total of 479 (244 male and 235 female) F2 mice were genotyped for 117 polymorphic markers spanning the autosomes. Twenty-eight suggestive or significant linkages for four traits (body weight, adjusted lean and fat weight, and percent fat) were detected. Of these, three QTLs were novel: one on the proximal portion of Chr 5 for body weight (Bwq8; LOD = 4.7), one on Chr 3 for lean weight (Bwtq13; LOD = 3.6), and one on Chr 11 for percent fat (Adip19; LOD = 5.8). The remaining QTLs overlapped previously identified linkages, e.g., Adip5 on Chr 9. One QTL was sex-specific (present in males only) and seven were sex-biased (more prominent in one sex than the other). Most alleles that increased body weight were contributed by the B6 strain, and most alleles that increased percent fat were contributed by the PWK strain. Eight pairs of interacting loci were identified, none of which exactly overlapped the main-effect QTLs. Many of the QTLs found in the B6 × PWK cross map to the location of previously reported linkages, suggesting that some QTLs are common to many strains (consensus QTLs), but three new QTLs appear to be particular to the PWK strain. The location and type of QTLs detected in this new cross will assist in future efforts to identify the genetic variation that determines the ratio of lean to fat weight as well as body size in mice.
Introduction
During domestication, laboratory mice were selected for early, rapid growth and high fertility (Silver 1995) and this has biased and reduced their gene pool (Guenet and Bonhomme 2003). However, this bias can be side-stepped and new genetic diversity infused by pairing traditional strains with recently “wild-caught” inbred strains (Ishikawa et al. 2000). Some wild-caught strains have limited usefulness because there are few genetic resources available to characterize them, but a balance between benefits and drawbacks is offered by the PWK/PhJ (PWK) strain: It is a relatively new, wild-derived strain, but it is also well-described genetically (Bogue and Grubb 2004; Churchill et al. 2004; Gregorova and Forejt 2000; Jansa et al. 2005; Petkov et al. 2004).
Although early work on obesity in mice tended to concentrate on extreme phenotypes (Danforth 1927) and single-gene mutations (Bultman et al. 1992; Naggert et al. 1995; Noben-Trauth et al. 1996; Tartaglia et al. 1995; Zhang et al. 1994), more recent work has concentrated on what might be considered normal variation in fatness and its associated genetic variation (Reed et al. 2007; Svenson et al. 2007; Wuschke et al. 2006). The measurement of normal variation in body fat is important because the outcome of linkage studies can change depending on the exact method used to express the trait (Lang et al. 2005). In addition to the types of obesity measures used, the strength of sex-by-genotype (Farber and Medrano 2007) and gene-gene interactions (Brockmann et al. 2000) influence the trait. These types of interactions may be as important as additive genetic effects in their contribution to the heritability of body composition. As investigators move toward gene identification for obesity in mice, these issues have taken on greater practical meaning because it is difficult to isolate and identify genes with small additive effects if these other influences are not well understood. Therefore, in this study we paired PWK mice with the B6 strain to exploit the genetic diversity and resources of this combination, and we also investigated linkage outcomes in male versus female mice and the influence of epistatic interactions. We used two methods of assessing fatness: fat weight divided by body weight (percent fat) and fat weight adjusted for body weight by regression analysis. The value of this work is twofold: we can compare the identified QTLs with other strain pairings to assist in positional identification strategies like multiple cross and haplotype mapping (Hitzemann et al. 2002; Wade et al. 2002), and we can pursue QTLs that may be unique to the PWK strain.
Methods
Mice
Ten male and ten female mice from the C57BL/6J strain (B6; stock No. 000664) and PWK/PhJ strain (PWK; stock No. 003715) were purchased from The Jackson Laboratory (Bar Harbor, ME) and the F1 and F2 hybrids were bred at the Monell Chemical Senses Center. F2 pups were weaned at 21–23 days of age and reared in same-sex groups. A total of 479 F2 mice (235 ♀ and 244 ♂) were bred from two types of reciprocal crosses: 236 and 243 F2 mice were obtained from (B6 ♀ × PWK♂) F1 ♀ × (B6 ♀ × PWK ♂) F1 ♂ and (PWK ♀ × B6 ♂) F1 ♀ × (B6♀ × PWK ♂) F1 ♂, respectively. The reciprocal cross design was unbalanced because male F1 hybrids with an X chromosome from their PWK mothers are sterile (Storchova et al. 2004). The mice were housed in a temperature-controlled vivarium at 23°C on a 12:12-h light:dark cycle and had free access to water and pelleted AIN-76A diet (12% of energy as fat; Dyets Inc., Bethlehem, PA; catalogue No. 100000). Prior to the measurement of body weight and adiposity, mice were tested to determine their preference for noncaloric taste solutions, and the results of these experiments will be reported elsewhere. All mice (B6, PWK, F1, and F2) were treated similarly before they were measured for body composition. Protocols were reviewed and approved by the Institutional Animal Care and Use Committee of the Monell Chemical Senses Center.
Body composition measurements
All mice were euthanized by CO2 asphyxiation when they were 18 weeks old and weighed to nearest 0.1 g on an electronic balance. Measurements of body fatness were made by dual-energy X-ray absorptiometry (DEXA) using a Lunar PixiMus II densitometer (GE, software version 2.00; Lunar Corp., Madison, WI). This was calibrated daily according to the manufacturer’s instructions using a quality control phantom (Phantom values: percentage fat = 10.0%). Mice were placed on a positioning tray ventral side down with the legs extended away from the body. Because large mice were longer than the image (80 mm × 65 mm), the head of each mouse was excluded as a region of interest. Using these procedures, the precision of measurement of fat weight has a coefficient of variation of less than 2%. Prior work in our laboratory has validated the DEXA method using a wide range of mouse strains (including B6 and PWK) and suggests that differences between this measure and other measures of body composition are minor. Previous investigators have used this method successfully to conduct genetic analyses of body composition in mice (Jerez-Timaure et al. 2005; Masinde et al. 2002c; Srivastava et al. 2006; Vitarius et al. 2006).
Phenotype analysis
The four phenotypes used in the linkage analysis were body weight, lean weight, fat weight, and percent fat (fat weight/body weight × 100). Strain and reciprocal cross differences were evaluated using a two-way ANOVA with group and sex as factors. When significant main effects of strain or sex were found, group means were evaluated by LSD post hoc tests. Differences in the homogeneity of variance between males and females were assessed with Levene’s test. Correlations among phenotypes in the F2 offspring were computed and tested to determine whether the correlation coefficient significantly differed (a) from zero and (b) between males and females. We used a criterion of p < 0.01 to control for the effects of multiple testing for the correlation analysis. These statistical analyses were conducted with Statistica 6.1 (StatSoft, Tulsa, OK).
DNA extraction and genotyping
Genomic DNA was extracted and purified from mouse tails by a sodium hydroxide method (Truett et al. 2000). A genome scan was conducted in two steps with the end result being that the average distance between markers was approximately 10 cM, with no gap greater than 30 cM (Table 1). First, simple sequence repeat markers known to be polymorphic between the parental strains were selected to evenly cover all 19 autosomes (Witmer et al. 2003). These fluorescently labeled microsatellite primers were amplified by PCR and the PCR products were scanned by an ABI 3100 capillary sequencer (Applied Biosystems, Forest City, CA). This genotyping was conducted by CIDR (Center for Inherited Disease Research, Johns Hopkins University, Baltimore, MD). DNA purchased from The Jackson Laboratory as well as parental DNA provided by our laboratory was included as control samples in the genotyping analysis. As a second quality control, blind duplicate DNA samples were genotyped. After the typing was completed, the code was broken and duplicate samples were matched and the data compared, with no disagreement among duplicates. Second, when gaps between the simple sequence length markers were greater than 30 cM, we genotyped single nucleotide polymorphisms, using fluorescently labeled primers and probes designed to discriminate between alleles, with an ABI Prism 7000 Real Time PCR system (ABI Assay-by-Design, Applied Biosystems, Foster City, CA). Genotypes were checked by determining whether they were compatible with the pre-existing haplotype; suspicious genotypes such as those that created double recombinants were reassayed.
Table 1.
Markers used in autosomal genome scan
| Markers | Position cM (Mb) | Markers | Position cM (Mb) | Markers | Position cM (Mb) | Markers | Position cM (Mb) |
|---|---|---|---|---|---|---|---|
| D1MIT64.1 | 5(12.83) | D4MIT209.1 | 79 (153.26) | D8MIT120.1 | 61 (121.23) | D14MIT98.1 | 3 (15.32) |
| D1MIT169.1 | 15 (24.02) | rs13478074 | 80 (154.70) | D14MIT60.1 | 15 (46.02) | ||
| D1MIT1000.1 | 33 (65.24) | D9MIT126.1 | 6 (22.91) | D14MIT39.1 | 30 (67.49) | ||
| D1MIT132.1 | 43 (77.03) | D5MIT123.1 | 3 (6.56) | D9MIT2.1 | 17 (37.14) | D14MIT106.1 | 48 (99.06) |
| D1MIT440.1 | 54 (90.62) | D5MIT348.1 | 8 (24.43) | D9MIT129.1 | 26 (43.64) | ||
| D1MIT1001.1 | 67 (103.59) | D5MIT352.1 | 20 (35.93) | D9MIT336.1 | 35 (65.38) | D15MIT13.1 | 7 (3.41) |
| D1MIT102.1 | 73 (149.01) | rs3713492 | NA (55.96) | D9MIT123.1 | 42 (73.33) | D15MIT143.1 | 21 (51.98) |
| D1MIT507.1 | 88 (166.88) | D5MIT201.1 | 42 (75.44) | D9MIT347.1 | 56 (103.12) | D15MIT70.1 | 48 (81.03) |
| D1MIT426.1 | 101 (182.25) | rs13478400 | NA (96.08) | D9MIT151.1 | 72 (121.33) | D15MIT242.1 | 56 (90.22) |
| D1MIT155.1 | 112 (196.13) | D5MIT314.1 | 59 (109.92) | D15MIT161.1 | 69 (96.84) | ||
| rs3719351 | NA (114.25) | D10MIT49.1 | 2 (4.14) | ||||
| D2MIT293.1 | 11 (25.24) | D5MIT95.1 | 68 (125.12) | D10MIT86.1 | 17 (24.29) | D16MIT107.1 | 3 (5.62) |
| D2MIT242.1 | 29 (57.17) | D5MIT98.1 | 78 (138.45) | D10MIT20.1 | 35 (66.41) | D16MIT60.1 | 23 (32.62) |
| D2MIT327.1 | 40 (69.27) | D5MIT143.1 | 86 (151.27) | D10MIT115.1 | 38 (69.67) | D16MIT169.1 | 37 (49.75) |
| D2MIT100.1 | 48 (106.34) | D10MIT95.1 | 50 (91.93) | D16MIT189.1 | 55 (82.42) | ||
| D2MIT395.1 | 67 (119.22) | D6MIT274.1 | 21 (48.66) | D10MIT96.1 | 56 (98.99) | ||
| D2MIT208.1 | 77 (134.97) | D6MIT284.1 | 38 (92.57) | D10MIT233.1 | 62 (113.79) | D17MIT143.2 | 5 (8.28) |
| D2MIT285.1 | 86 (152.55) | D6MIT36.1 | 46 (104.47) | D17MIT51.1 | 23 (42.97) | ||
| D2MIT113.1 | 103 (172.99) | D6MIT198.1 | 67 (116.44) | D11MIT186.1 | 17 (35.08) | D17MIT180.1 | 29 (50.89) |
| D6MIT373.1 | 74 (147.01) | D11MIT143.1 | 32 (57.73) | D17MIT20.1 | 34 (56.91) | ||
| D3MIT178.1 | 14 (30.58) | D11MIT285.1 | 52 (89.74) | D17MIt123 | 56 (93.49) | ||
| D3MIT5.1 | 25 (50.93) | D7MIT294.1 | 8 (26.99) | D11MIT126.1 | 63 (103.76) | ||
| D3MIT98.1 | 40 (86.27) | D7MIT228.1 | 18 (39.80) | D18MIT64.1 | 2 (6.11) | ||
| D3MIT311.1 | 45 (93.1) | D7MIT83.1 | 27 (51.67) | D12MIT60.1 | 16 (35.38) | D18MIT12.1 | 17 (36.01) |
| D3MIT57.1 | 55 (115.82) | D7MIT350.1 | 41 (83.46) | D12MIT91.1 | 29 (72.66) | D18MIT194.1 | 22 (43.79) |
| D3MIT256.1 | 66 (136.29) | D7MIT98.1 | 53 (114.71) | D12MIT158.1 | 38 (83.54) | D18MIT208.1 | 38 (61.05) |
| D3MIT147.1 | 79 (148.68) | D7MIT109.1 | 66 (136.35) | D12MIT7.1 | 50 (103.39) | D18MIT48.1 | 50 (77.01) |
| D7MIT223.1 | 72 (143.88) | ||||||
| D4MIT227.1 | 3 (9.93) | D13MIT57.1 | 9 (16.78) | D19MIT68.1 | 6 (3.65) | ||
| D4MIT196.1 | 12 (39.64) | D8MIT155.1 | 1 (4.98) | D13MIT16.1 | 10 (20.30) | D19MIT96.1 | 15 (21.91) |
| D4MIT17.1 | 32 (62.85) | D8MIT190.1 | 21 (37.46) | D13MIT247.1 | 32 (51.49) | D19MIT88.1 | 34 (37.32) |
| D4MIT9.1 | 45 (94.56) | D8MIT178.1 | 33 (73.97) | D13MIT144.1 | 48 (97.19) | D19MIT17.1 | 43 (45.60) |
| D4MIT308.1 | 57 (123.66) | D8MIT211.1 | 49 (105.61) | D13MIT151.1 | 71 (116.67) | D19MIT103.1 | 52 (53.82) |
| D4MIT170.1 | 67 (137.89) | D8MIT88.1 | 58 (117.72) |
Position = genetic position in centimorgans (cM) and physical position in megabases (Mb). cM locations are from the Mouse Genome Database, accessed February 2006. Physical locations are from NCBI Build 36.1 [February 2006, strain C57BL/6J, Ensembl (Hubbard et al. 2007); see Web References]
Linkage analysis
Genome-wide scans of the F2 mice involving the four traits were conducted using markers from all 19 autosomes. The genetic map, genotyping errors, and linkage between individual traits and marker genotypes were assessed with algorithms implemented by the R/qtl 1.04 - 53 package of R (Broman et al. 2003). All traits were analyzed with sex as an additive and interacting covariate; for fat and lean weight, body weight was also used as a covariate. For main effects, thresholds for suggestive and significant linkage followed established guidelines (Lander and Kruglyak 1995) and were based on values obtained from 1000 permutations of the observed data. Characterization of the most likely mode of inheritance of each QTL according to free, dominant, recessive, and additive genetic models was determined using MapMaker/QTL 1.1 (Lander et al. 1987). Each QTL’s confidence interval was considered to be the genetic distance between 1.5-LOD drops from its peak score. To identify sex-specific loci, we used a method that allows the male and female genotype effects to be in opposite directions, e.g., one genotype may increase the trait value in males but reduce the trait value in females (Solberg et al. 2004). The analysis method was similar to that described earlier (Farber et al. 2006), with some modification to the thresholds for suggestive (sex-biased) and significant (sex-specific) linkage. Linkage results were defined as sex-biased when the LOD scores differed by 0.9 unit and sex-specific when the LOD scores differed by 3.1 units. We chose the suggestive criterion because it was very similar to the one used in other studies, and we chose the second and more stringent criterion because permutation testing suggested it corresponded to p < 0.001. Two-way interactions (epistasis) were estimated with a two-QTL scan. Statistical significance for these gene-gene interaction tests were based on p < 0.05, using 1000 permutations of the observed data. Significant interactions found in the two-QTL scan were confirmed with two-way ANOVAs.
Exploratory candidate gene assessment
The implication of linkage peaks is that one or more genes that fall underneath the peak are allelic and cause the individual differences in phenotype. We assessed the most likely genes that would account for peaks using software tailored for this purpose. We focused on two regions, one on chromosome 2 and one on chromosome 11, both of which were linked to percent fat. We chose the QTL on chromosome 2 because it is the best studied of all obesity QTLs, and we chose the QTL on chromosome 11 because it was novel. Therefore, these two QTLs are at the extremes in terms of how well scrutinized the genes that fall under the peak are likely to be. We used a 1-LOD drop to capture the confidence interval and mapped the endpoints to Build 36 of the mouse genome to get physical position (Mb). We used a shorter confidence interval to search for candidate genes than to report the linkage. This was to reduce the number of genes captured and considered without substantially increasing the possibility that the gene would be missed. For the automated search, we used the algorithms implemented in Positional Medline Database, which filters candidate genes by location, function, gene expression, and function networks (see Web References section). We used the words “adiposity” and “percent fat” as key search terms.
Results
Obesity-related traits
B6 mice were heavier than PWK mice [Table 2; F(3,584) = 24.6, p < 0.001], and males were heavier than females [F(1,584) = 54.4, p < 0.001], with the sex difference being larger in the B6 than PWK mice [F(3,584) = 5.0, p = 0.002]. A similar pattern was observed for lean weight and fat weight (all main effects and interactions, p < 0.001). Percent fat differed significantly by strain [F(3,584) = 24.7, p < 0.001] and sex [F(1,584) = 5.6, p < 0.05], but the strain × sex interaction was not significant [F(1,584) = 1.9, p = 0.14] (Table 2). Tests of homogeneity of variance showed that relative to male mice, female mice were significantly more variable in body weight [F(1,481) = 4.0, p < 0.01], lean weight [F(1,481) = 9.4, p < 0.01)], and fat weight [F(1,481) = 7.2, p < 0.01], but equally variable in percent fat [F(1, 481) = 1.03, p = 0.79]. There were no differences in the mean trait values of the F2 offspring by reciprocal cross type (p > 0.05).
Table 2.
Means ± standard errors of body composition of parental, F1, and F2 mice
| C57BL/6J | PWK/PhJ | F1 | F2 | |
|---|---|---|---|---|
| Female | ||||
| Number of mice | 14 | 16 | 32 | 235 |
| Age (months) | 4.7 ± 0.6 | 4.7 ± 0.3 | 4.9 ± 0.2 | 4.8 ± 0.4 |
| Body weight (g) | 19.0 ± 1.0c | 12.9 ± 1.0a | 16.3 ± 0.7b | 16.6 ± 0.3b |
| Lean weight (g) | 15.2 ± 0.6c | 10.3 ± 0.5a | 13.1 ± 0.4b | 12.6 ± 0.1b |
| Fat weight (g) | 3.4 ± 0.6a,b | 2.5 ± 0.6a | 2.6 ± 0.4a | 3.5 ± 0.2b |
| Percent fat (%) | 18.0 ± 1.5a,b | 19.6 ± 1.4b,c | 16.7 ± 1.0a | 21.0 ± 0.4c |
| Male | ||||
| Number of mice | 15 | 13 | 30 | 244 |
| Age (months) | 4.7 ± 0.9 | 4.7 ± 0.5 | 4.9 ± 0.7 | 4.8 ± 0.8 |
| Body weight (g) | 23.9 ± 1.0c | 15.3 ± 1.1a | 19.7 ± 0.7b | 23.1 ± 0.3c |
| Lean weight (g) | 19.2 ± 0.5d | 11.8 ± 0.6a | 15.8 ± 0.4b | 16.9 ± 0.1c |
| Fat weight (g) | 4.8 ± 0.6a,b | 3.3 ± 0.7a | 3.3 ± 0.4a | 6.0 ± 0.2b |
| Percent fat (%) | 19.8 ± 1.4a,b | 21.5 ± 1.5b,c | 17.1 ± 1.0a | 24.7 ± 0.4c |
Strains that do not share a common superscript differ by LSD post hoc tests
Correlations among traits
Measures of body composition were moderately or strongly correlated in the F2 population (all p values < 0.01) and the strength of each correlation was influenced by sex (Table 3). The most striking result was that for female mice, body weight was only moderately correlated with percent fat, whereas in male mice, body weight was almost perfectly correlated with percent fat. Lean weight and fat mass were correlated in both sexes, but to a lesser degree in female mice.
Table 3.
Correlations in F2 mice for body weight and body fatness by sex
| Phenotype | Body weight | Lean weight | Fat weight | Percent fat |
|---|---|---|---|---|
| Body weight | 0.63 | 0.58 | 0.45 | |
| Lean weight | 0.93 | 0.97 | 0.76 | |
| Fat weight | 0.92 | 0.76 | 0.86 | |
| Percent fat | 0.84 | 0.61 | 0.96 |
Male values are in the lower diagonal, in boldface; Female values are in the upper diagonal, in italics. All correlations differ significantly from zero, p < 0.01, and each female correlation differs from the corresponding male correlation, p < 0.01
Linkage
In total, 28 main-effect QTLs for four traits were identified on chromosomes 1, 2, 3, 4, 6, 7, 9, 10, 11, 13, and 16 (Fig. 1 and Table 4). For body weight and lean weight, 50% of the linkages were statistically significant. For body weight, lean weight, and fat weight, the “plus” or “trait-increasing” alleles were typically contributed by the B6 strain (i.e., congruent QTLs, recapitulating the differences between the parental strains). However, for the two significant QTLs for percent fat, the PWK strain contributed the trait-increasing allele (i.e., antagonistic QTLs).
Fig. 1.
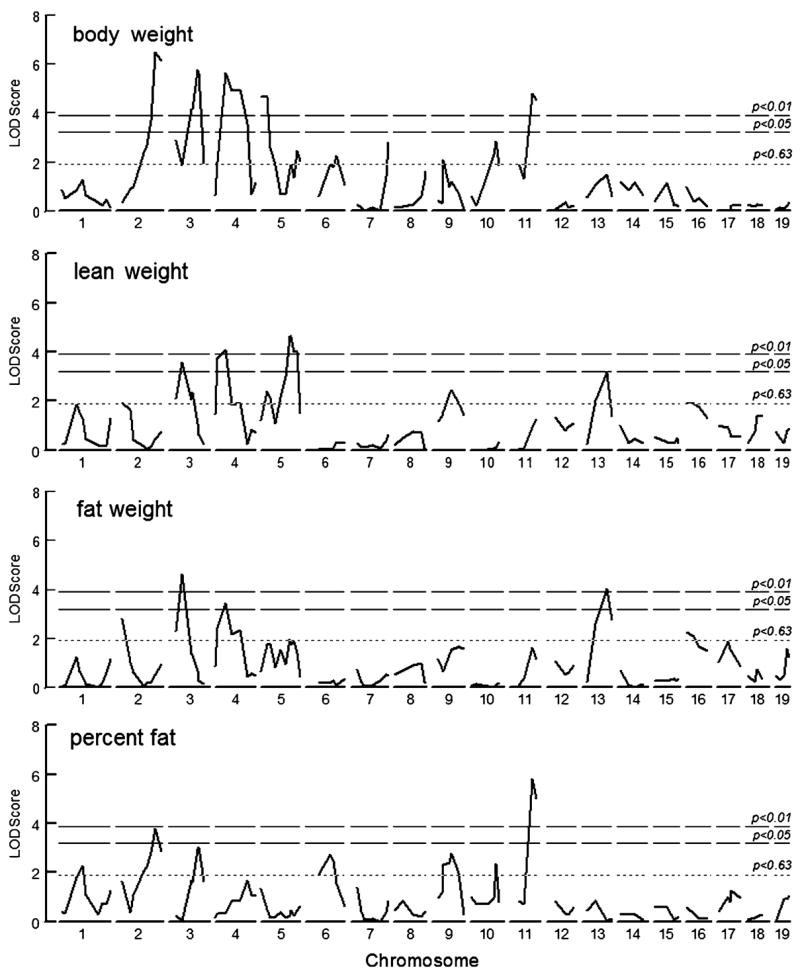
Genome scan results of an F2 intercross between B6 and PWK inbred mouse strains. The interval maps show body weight, lean weight, fat weight, and percent fat (sex is an additive covariate for these analyses, and body weight was a covariate for lean and fat weight). The three horizontal lines represent LOD thresholds at genome-wide significant level (p < 0.01 and p < 0.05), and suggestive level (p < 0.63), respectively, as determined by 1000 permutation tests
Table 4.
Summary of genome scan results and comparison with other QTLs
| Chr | Phenotype | Markera | Peak (CI) (cM) | LOD scoreb | Modec | Plus allele | ΔLODd | Sex effecte | QTL symbol and previous referencesf |
|---|---|---|---|---|---|---|---|---|---|
| 1 | Percent fat | D1MIT440.1 | 54 (43–66) | 2.3* | recessive | B6 | 0.03 | Fatq1 (Moody et al. 1999) | |
| 2 | Body weight | D2MIT285.1 | 86 (78–92) | 6.5*** | free | B6 | 1.91 | M | Pbwg11 (Ishikawa et al. 2005); D2Mit22 (Cheverud et al. 1996); Bw20 (Vitarius et al. 2006) |
| 2 | Fat weight | D2MIT293.1 | 11 (0–15) | 2.8* | dominant# | B6 | 0.12 | Adip10 (Stylianou et al. 2006) | |
| 2 | Percent fat | D2MIT285.1 | 86 (72–98) | 3.8** | dominant | B6 | 0.39 | Gnf3 (Jerez-Timaure et al. 2005) | |
| 3 | Body weight | D3MIT57.1 | 55 (45–67) | 5.8*** | free | B6 | 1.52 | M | Wt10Q2 (Moody et al. 1999) |
| 3 | Lean weight | D3MIT5 | 25 (17–36) | 3.6** | dominant | B6 | 0.36 | Bwtq13 this report | |
| 3 | Fat weight | D3MIT5 | 25 (14–32) | 4.6*** | dominant | B6 | 0.48 | Afw1 (Brockmann et al. 2000) | |
| 3 | Percent fat | D3MIT256.1 | 66 (57–72) | 3.0* | dominant | B6 | 2.62 | M | Afp(1) (Brockmann et al. 1998) |
| 4 | Body weight | D4MIT17.1 | 32 (26–43) | 5.6*** | free | B6 | 1.65 | M | Bw6b (Keightley et al. 1996) |
| 4 | Lean weight | D4MIT17.1 | 32 (13–39) | 4.1*** | additive | B6 | 0.79 | Epb4.1 (Moody et al. 1999) (body weight) | |
| 4 | Fat weight | D4MIT17.1 | 32 (17–46) | 3.5** | dominant | B6 | 0.31 | Adip11 (Stylianou et al. 2006) | |
| 5 | Body weight | D5MIT123.1 | 3 (0–10) | 4.7*** | free | B6 | 0.70 | Bwq8 this report# | |
| 5 | Lean weight | rs3719351 | 49 (43–55) | 4.7*** | free | B6 | 0.14 | Bw6d (Keightley et al. 1996); Bwob (Ewart-Toland et al. 1999) (body weight) | |
| 5 | Fat weight | D5MIT314.1 | 59 (42–71) | 2.0* | additive | B6 | 0.77 | Afw(3) (Brockmann et al. 1998) | |
| 6 | Body weight | D6MIT198.1 | 67 (52–79) | 2.2* | dominant | PWK | 0.41 | Body weight QTL 3 (Anunciado et al. 2001); Bwtq10 (Stylianou et al. 2006) | |
| 6 | Percent fat | D6MIT284.1 | 38 (26–47) | 2.8* | additive | PWK | 0.32 | Pfat2 (Keightley et al. 1998) | |
| 7 | Body weight | D7MIT223.1 | 72 (58–79) | 2.8* | dominant | B6 | 1.46 | M | Pbwg3 (Ishikawa et al. 2005) |
| 9 | Body weight | D9MIT129.1 | 26 (15–41) | 2.1* | free | PWK | 0.96 | Bodw4 (Carlborg et al. 2005); Bwnd4wk5 (Brockmann et al. 2004) | |
| 9 | Lean weight | D9MIT123.1 | 42 (26–55) | 2.5* | dominant | B6 | 1.24 | F | D9Mit164 (Brockmann et al. 2000) (body weight) |
| 9 | Percent fat | D9MIT123.1 | 42 (33–49) | 2.8* | free | PWK | 0.43 | Adip5 (McDaniel et al. 2006) | |
| 10 | Body weight | D10MIT96.1 | 56 (32–65) | 2.9* | recessive | B6 | 0.92 | D10Mit10 (Cheverud et al. 1996) | |
| 10 | Percent fat | D10MIT96.1 | 56 (49–61) | 2.3* | recessive | B6 | 0.61 | Adip15 (Stylianou et al. 2006) | |
| 11 | Body weight | D11MIT285.1 | 52 (44–67) | 4.8*** | free | PWK | 2.35 | M | Bw4 (Brockmann et al. 2004) |
| 11 | Percent fat | D11MIT285.1 | 52 (47–57) | 5.8*** | free | PWK | 3.16 | M | Adip19 this report§ |
| 13 | Fat weight | D13MIT144.1 | 48 (37–59) | 4.0** | dominant | B6 | 0.75 | Fatpad3 (Yi et al. 2006) | |
| 13 | Lean weight | D13MIT144.1 | 48 (39–56) | 3.2* | dominant | B6 | 0.58 | Bw10 (Brockmann et al. 2000) (body weight) | |
| 16 | Lean weight | D16MIT107.1 | 3 (0–16) | 1.9* | additive | PWK | 0.28 | Fatq1 (Moody et al. 1999) | |
| 16 | Fat weight | D16MIT107.1 | 3 (0–11) | 2.2* | dominant# | B6 | 0.18 | Adip17 (Stylianou et al. 2006) |
Chr = chromosome; CI = confidence interval
Marker positions in Mb were obtained using the University of California at San Diego Genome Bioinformatics browser (Kent et al. 2002) accessing Build 36 of the mouse genome, see Web References
LOD score for corresponding mode of inheritance. Genome-wide significance determined by permutation tests:
p<0.01;
p< 0.05;
p < 0.63
Mode = estimate by MAPMAKER/QTL for additive, dominant/recessive and unconstrained (free) models. # indicates that the dominant allele reduced the trait value
ΔLOD indicates the difference between a model with sex as additive or additive and interactive covariate
Sex effect indicates a QTL that is either sex-biased (ΔLOD>0.9) or sex-specific/sex antagonistic (ΔLOD>3.1); M = male-biased QTL, F = female-biased QTL
List of QTLs: When the previous QTL was for a slightly different trait, the original trait is given in parentheses, e.g., (body weight). The list of overlapping QTLs is representative and does not include every QTL known to map to the region.
After Bwq8 was assigned to this locus but before publication, an overlapping QTL (Bw21) was reported (Vitarius et al. 2006).
An unnamed QTL for an adiposity index maps near here (Collin et al. 2005) but it has features that suggest it is not equivalent to Adip19
We named the new QTLs using rules developed by the International Committee on Standardized Genetic Nomenclature for Mice (see Web References section). They were designated as Bwq8, a body weight QTL in the proximal region of Chr 5; Bwtq13, a lean weight QTL identified on Chr 3; and Adip19, a linkage for percent fat on Chr 11. Bwq denotes a QTL that affects body weight, including lean and fat weight. Bwtq was adopted from another study (Stylianou et al. 2006) and is used to indicate a QTL for lean weight. Adip has usually been assigned to QTLs that affect fat weight when adjustments for body size are made (Cheverud et al. 2001). In the current study, body weight was used as a covariate in the analysis of fat weight, and therefore the new QTL on Chr 11 was called Adip19. The remaining QTLs were detected in previous studies and, therefore, those symbols were adopted here (Table 4). In cases where multiple symbols were previously used that were equally appropriate, one was adopted arbitrarily.
Sex-specific loci
Twenty-two body weight QTLs and 19 adiposity QTLs were sex-biased. They were clustered on Chrs 2, 3, 4, 5, and 11 (Table 4). There were more male- than female-dependent and female-biased QTLs. Adip19 was sex-dependent: It was detected only in male mice, with the PWK strain contributing the trait-increasing, additive allele (Fig. 2).
Fig. 2.

Effect plot for the interaction of a sex-specific QTL on chromosome 11. Genotypes B/B, B/P, and P/P represent B6 homozygous, B6/PWK heterozygous, and PWK homozygous, respectively
Epistasis
A pairwise scan was conducted to identify all marker-marker interactions (117 markers; 6786 possible interactions), applying the same covariates used as those for screening the single-effect QTLs. A 5% threshold level was set by permutation testing and confirmed by two-way ANOVA (associated nominal p < 0.0000074). Eight significant epistatic interactions were identified based on the pairwise scan (Fig. 3). A comparison of chromosome position of these epistatic loci with those of main-effect QTLs revealed that no epistatic QTLs overlapped the main-effect QTLs. Potential hubs were also identified: the QTL near D17Mit143.2 interacted with a locus on Chr 11 (63 cM) influencing percent fat, and it also interacted with another locus on Chr 13 (9 cM) affecting lean weight (Fig. 3). Likewise, a QTL on Chr 6 (74 cM) interacted with two other QTLs, one on Chr 3 (79 cM) and the other on Chr 14 (48 cM).
Fig. 3.
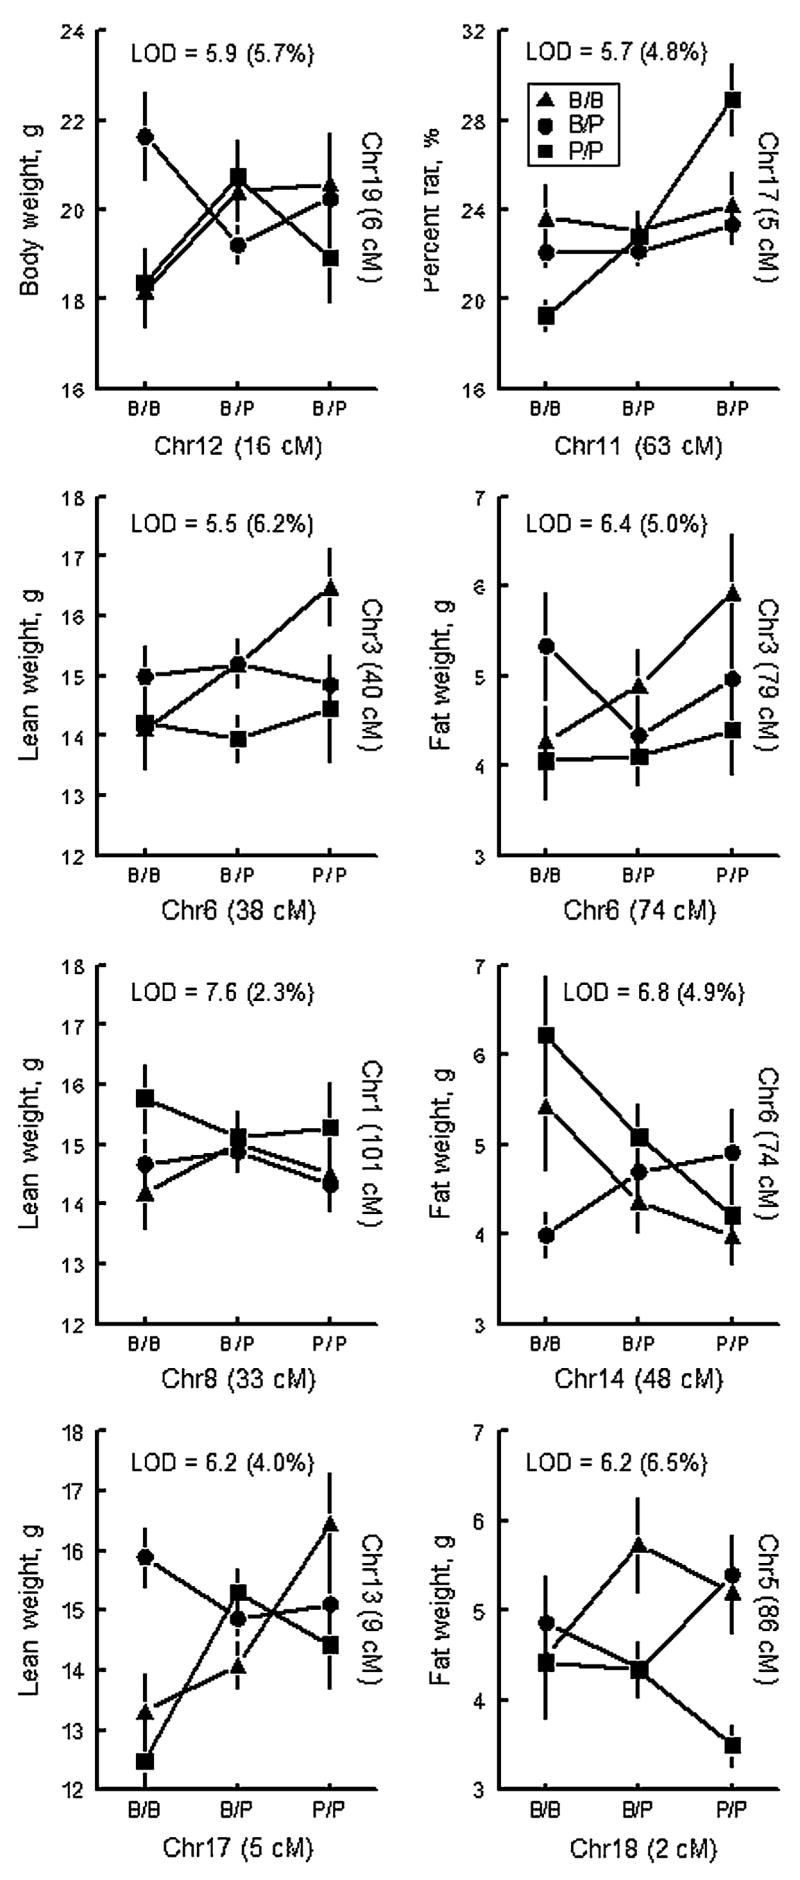
Plots of pairwise interactions. Chromosome number and peak position in cM are indicated for each QTL. Freestanding text = interaction LOD score and percentage of trait variance accounted for
Candidate genes
We conducted exploratory candidate gene assessment for the QTLs on chromosomes 2 and 11. For the chromosome 2 QTL, we searched between 142 and 175 Mb and identified 107 candidate genes. For the chromosome 11 QTL, we searched between 80 and 99 Mb and identified 58 genes. Genes were ranked in terms of likelihood based on the amount of evidence extracted during database searches; for the chromosome 2 QTL, the three highest-ranking genes were adenosine deaminase, cystatin C, and lipo-polysaccharide binding protein, and for the chromosome 11 QTL, the three most likely candidates were transcription factor 2, acetyl-coenzyme A carboxylase alpha, and gastric inhibitory polypeptide. These genes, like the others on the list, have well-known roles in obesity and body weight regulation and could be responsible for the QTL effects described. Details relevant to these genes and the efforts on the part of other investigators to map genes in this region of chromosome 2 are discussed below.
Discussion
Using a classical F2 intercross design, we interbred mice from the PWK and B6 strains, conducted a genome scan using microsatellite and SNP markers, and assessed the presence of primary QTLs, sex-by-genotype interactions, and epistatic interactions. Body weights of the PWK strain were considerably less than those of the B6 strain but the two strains had similar percentages of carcass fat; if anything, the PWK strain tended be fatter. Sex differences in body composition were not remarkable. Like most mice strains (Reed et al. 2007), the males were fatter than the females. The F1 B6 × PWK mice were intermediate between the parental strains in body weight, and the F2 on average were heavier than the B6 strain. This pattern is typical for a complex trait like body weight, which reflects the action of multiple genes and hybrid vigor.
Several QTLs detected here probably replicate those described earlier. However, three new linkages were identified and named (Bwq8, Bwtq13, and Adip19). Sex-by-genotype interactions were of two types: There was one linkage that was detected in only one sex and many linkages detected in both sexes, but with a stronger effect in one than the other (mostly male-biased). Epistatic interactions between loci accounted for up to a third of the trait variance, which is consistent with other reports (Brockmann et al. 2000; Yi et al. 2006).
QTL comparison with earlier studies
A total of 28 primary QTLs were detected in this study, of which nine were significant and the remainder met the criterion for suggestive linkage. One way to determine the statistical reliability of QTLs is to check whether they replicate in other studies, so we compared these findings with earlier experiments. There are no published QTL studies (to the best of our knowledge) that paired the PWK with the B6 strain, but two studies have paired the PWK strain with different inbred partners, either KK (Komatsu et al. 2002) or NOD (Melanitou et al. 1998). The only phenotype in common with the current study was body weight (and then only for the study with the PWK × KK intercross). Although the inbred partner strain differed (KK vs. B6), two of the QTLs were replicated: one QTL on Chr 2 near the agouti locus, and the other on Chr 4, with the same marker (D4Mit17) associated with the highest LOD score in the current and earlier study. The QTL on Chr 2 is the most replicated body weight QTL (Cheverud et al. 1996; Chiu et al. 2007; Ishikawa et al. 2005; Vitarius et al. 2006). We use the symbol Bwfq2 to label it here, but it has many aliases. The presence of the same QTL on Chr 2 detected in crosses involving many divergent strains could have several explanations: (1) It is ancient and was present in mouse strains prior to their dispersal to different continents. (2) It arose several times spontaneously due to a highly mutable gene. (3) It contains polymorphisms that improve survival. (4) It contains a tight cluster of genes that are allelic and influence body weight, i.e., a supergene. For the QTL on Chr 4 for body weight, the results suggest that the PWK strain has a body weight allele that differs from the alleles carried by both the B6 and KK strains. Because the linkage peak locations were nearly identical between the studies, this result suggests that these QTLs are due to the same underlying genotype.
Novel QTLs
In contrast to QTLs that are frequently identified in mouse genome scans, several of the QTLs were apparently novel. Our criteria for novelty were that no previously reported QTLs with the same or very similar phenotype had an overlapping confidence interval, and the behaviors of the QTLs (effect direction and mode of action) were the same or very similar. Using these criteria, we considered Bwq8, on the proximal portion of Chr 5, to be novel because although there are many linkages to body weight on this chromosome, none map to this confidence interval (Bennett et al. 2005; Brockmann et al. 1998, 2000; Ewart-Toland et al. 1999; Le Roy et al. 1999; Rance et al. 2005; Rocha et al. 2004b). Likewise, two other QTLs were novel (Bwtq13 and Adip19), although in the case of Adip19, there were a few points to consider before we concluded that this was a novel QTL. There were three previous reports of QTLs near Adip19 but all previous QTLs had features that made it unlikely that they captured the same underlying genetic variation (Carlborg et al. 2005; Collin et al. 2005; Farber and Medrano 2007). Determining whether a QTL replicates is subject to some uncertainty regarding its location, confidence interval, and its effects on a particular genetic background, and thus the term “novel QTL” is applied here only with these considerations in mind.
Pleiotropy
When QTLs for two or more traits map near the same location, the same genetic variation may contribute to both traits, and this is much more likely to occur when the trait values are highly correlated. This issue is salient for obesity QTL mapping because measures of body size and body composition are generally correlated. In the simple case, QTLs that increase body weight do so because they add to either lean weight, fat weight, or both, and therefore body weight QTLs should overlap with one or both of these traits (Li et al. 2006). However, this result was rarely observed here (or in most QTL studies of body composition). For instance, for the six QTLs for lean weight, only one mapped to the same marker location as a body weight QTL (D4Mit17). For fatness, the lack of agreement in QTL locations for body weight and fat weight QTL phenotypes was even more extreme. The most common finding was that body weight QTLs were found on the same chromosome as lean and fat weight QTLs but they mapped to different locations, i.e., Chrs 2, 3, 4, 5, and 11. Therefore, these QTLs are likely to arise from independent and non-overlapping genetic signals. The most parsimonious explanation for our findings is that body weight QTLs reflect an equal increase in fat and lean weight, whereas the fat and lean QTLs underlie variation in body composition and not body size. However, it is also possible that some effects of body size on body composition were obscured by using body size as a covariate in analyses.
Sex-specific effects
There are several ways to identify sex-specific QTLs. The most common methods are to analyze data separately by sex and to estimate sex effects using linear models. Analyzing data separately by sex typically halves the sample size of each analysis, which is undesirable. Using sex as an additive covariate eliminates this problem but has the limitation that sex-antagonistic effects go undetected (Solberg et al. 2004). One advance has been the use of sex as an additive and interactive covariate. Using this approach, we detected several sex-biased QTLs and Adip19, a sex-dependent QTL that increased percent fat in male mice but had no effect in female mice. We detected no sex-antagonistic QTLs (alleles have opposing effects for each sex). One puzzling observation was that there were three times as many male- than female-biased QTLs, a result seen in several other mouse crosses (Cheverud et al. 2001; Farber and Medrano 2007; Reed et al. 2006). The mechanisms underlying sexually dimorphic QTLs remain unclear, but there are many potential explanations such as sex-specific gene expression (Yang et al. 2006) and epistatic effects of the Y chromosome (Ishikawa et al. 2005). Linkage analysis of gene expression has demonstrated that thousands of genes show sex-biased expression (Wang et al. 2006). Regardless of the mechanism by which it happens, sex-by-genotype interactions play a major role in the determination of mouse body composition.
Epistatic interactions
Previous investigators have tested for epistatic effects on body weight and composition using several approaches. One way is to examine the interaction of primary QTLs for a single trait; a variation of this method is to examine the interaction of primary QTLs among related traits. Another method is to examine all marker-marker interactions regardless of whether primary QTLs are present, which is the approach we used here. Eight pairs of interacting loci for body composition were identified: three for fat weight, three for lean weight, one for percent fat, and one for body weight. Previous studies of epistasis suggest that interactions among primary QTLs is the rule rather than the exception (Brockmann et al. 2000; Yi et al. 2004, 2006). However, at least in our case, the strongest epistatic interactions were not near any of the primary QTLs. This suggests that important determinants of body composition are missed when only the effects of interactions among primary QTL are measured.
Setting the statistical criteria to declare that a given epistatic interaction is significant is not clear, and several approaches have been suggested, e.g., nominal p values in regression or ANOVA analysis and permutation testing. Another method to test the reliability of epistatic interactions is whether they replicate in other studies. With this point in mind, we compared the current pairwise result to those of other studies but found no instances of an identical or similar interaction present for the same or related phenotype (Brockmann et al. 2000, 2004; Carlborg et al. 2005; Collin et al. 2005; Ishikawa and Namikawa 2004; Ishikawa et al. 2005; Ishimori et al. 2004; Li et al. 2006; Masinde et al. 2002a, b; Reifsnyder et al. 2000; Rocha et al. 2004a, b; Stylianou et al. 2006; Yi et al. 2004, 2005, 2006). The results of this comparison suggest that although certain locations are likely to be network “hubs,” i.e., locations that interact with many other genes to determine adiposity (Stylianou et al. 2006), the details are highly dependent on the specific mouse cross studied, the statistical model employed, and threshold for detection selected. The degree to which gene-gene interactions are replicable is probably best tested in two separate studies intercrossing the same strains and measuring the same phenotype.
Candidate genes
We surveyed candidate genes in the region of QTLs for percent fat on Chrs 2 and 11, which were chosen to represent a consensus QTL and a novel QTL. For the novel QTL on Chr 11 (Adip19), we identified three likely gene candidates: transcription factor 2 (Tcf2), acetyl-coenzyme A carboxylase alpha (Acaca), and gastric inhibitory polypeptide (Gip). If we assume that Adip19 is detected only when the PWK and B6 strains are paired, because B6 is often paired with strains but this region has never before been implicated, the search for alleles unique to the PWK strain might be especially useful to triage the variation in this region. The other region in which we searched for candidate genes was on mouse Chr 2, near D2Mit285, which maps between the midpoint of the chromosome and its telomere. Many studies have identified this distal region of Chr 2 as important in body composition phenotypes, and it is the focus of several positional cloning efforts (Chiu et al. 2007; Diament et al. 2004; Farber et al. 2006; Jerez-Timaure et al. 2005). According to our candidate gene analysis, the three genes most likely to underlie the QTL on Chr 2 were adenosine deaminase, cystatin C, and lipo-polysaccharide binding protein. Other investigators, using congenic analysis, have identified other genes such as Pcsk2 as potentially causal. These genes, like the others lower on the list, have well-known roles in obesity and body weight regulation and could be responsible for the QTL effects described. Comparisons of microcongenic or genetically engineered mouse strains will be needed to unequivocally identify the gene(s) (and alleles) in this region that account for this QTL.
We did not conduct a formal candidate gene analysis for all QTLs identified, but one point about the QTL on Chr 13 is worth mentioning. From the work of other investigators, we have learned that the B6 strain has a missing gene (Nnt), which is involved in mitochondrial ATP production. Its absence may reduce the ability of mitochondria (in brown adipocytes and other cell types) to create heat and thus partially account for dietary obesity (Freeman et al. 2006). Nnt is inside one QTL confidence interval reported here (for fat and lean weight), and so this linkage signal may be due to the missing gene in the segregating F2 population. This point raises a general issue for the cross of recently wild-caught and laboratory mice: Genetically distinct strains are often originally from different parts of the world (i.e., Europe, PWK and North America, B6) with different histories of inbreeding. Given that the PWK and B6 mouse strains are so different that they have started the process of speciation (some F1 males are sterile), large genome variations like missing or relocated genes, large duplications, or rearrangements probably deserve as much consideration as do single nucleotide polymorphisms as the underlying causes of QTLs.
Future directions
A goal of this study and QTL analysis in general is to find the specific genetic variation that creates the linkage peaks and there are several ways to achieve this goal (Abiola et al. 2003). The B6 × PWK cross and the loci identified here have several features that will help support future attempts to identify specific loci. One feature is the existence of a series of chromosome substitution mice based on the B6 and PWD strains (the PWD strain is nearly identical to the PWK strain). These strains can provide a useful starting point for the development of interval-specific congenics. Another feature is the existence of BAC libraries for both strains, which will be useful in the creation of genetically engineered mice, for instance, for allele-swap studies to test candidate genes. With these tools in hand, newly identified QTLs such as Adip19 may lead to the eventual identification of the causal genetic variation.
Web References
International Committee on Standardized Genetic Nomenclature for Mice: http://www.informatics.jax.org/nomen/index.shtml
Mouse Genome Database: http://www.informatics.jax.org
Mouse Obesity Gene Map by German Institute of Human Nutrition Potsdam-Rehbrücke (DIFE): http://www.obesitygenes.org
Obesity Gene Map Database: http://www.obesitygene.pbrc.edu
University of California at Santa Cruz Genome (UCSC) Bioinformatics: http://www.genome.ucsc.edu
Ensembl: http://www.ensembl.org/index.html
Positional Medline Database: http://www.omicspace.riken.jp/index.html
Acknowledgments
This work was supported by NIH grants DK-46791 (MGT) and DK-58797 (DRR). Genotyping services were provided by the Center for Inherited Disease Research, which is funded through NIH contract NO1-HG-65403. We thank Drs. Alexander A Bachmanov, Yutaka Ishiwatari, and Cailu Lin for discussion and Dr. Randy Smith for help with J/qtl and R/qtl. Excellent technical assistance was provided by Diane Pilchak, Laura Alarcon, Fred Ol-linger, Maureen Lawler, Stephanie Craw, and Sara Lehmann.
References
- Abiola O, Angel JM, Avner P, Bachmanov AA, Belknap JK, et al. The nature and identification of quantitative trait loci: a community’s view. Nat Rev Genet. 2003;4:911–916. doi: 10.1038/nrg1206. [DOI] [PMC free article] [PubMed] [Google Scholar]
- Anunciado RV, Nishimura M, Mori M, Ishikawa A, Tanaka S, et al. Quantitative trait loci for body weight in the intercross between SM/J and A/J mice. Exp Anim. 2001;50:319–324. doi: 10.1538/expanim.50.319. [DOI] [PubMed] [Google Scholar]
- Bennett B, Carosone-Link PJ, Lu L, Chesler EJ, Johnson TE. Genetics of body weight in the LXS recombinant inbred mouse strains. Mamm Genome. 2005;16:764–774. doi: 10.1007/s00335-005-0002-6. [DOI] [PubMed] [Google Scholar]
- Bogue MA, Grubb SC. The Mouse Phenome Project. Genetica. 2004;122:71–74. doi: 10.1007/s10709-004-1438-4. [DOI] [PubMed] [Google Scholar]
- Brockmann GA, Haley CS, Renne U, Knott SA, Schwerin M. Quantitative trait loci affecting body weight and fatness from a mouse line selected for extreme high growth. Genetics. 1998;150:369–381. doi: 10.1093/genetics/150.1.369. [DOI] [PMC free article] [PubMed] [Google Scholar]
- Brockmann GA, Kratzsch J, Haley CS, Renne U, Schwerin M, et al. Single QTL effects, epistasis, and pleiotropy account for two-thirds of the phenotypic F(2) variance of growth and obesity in DU6i × DBA/2 mice. Genome Res. 2000;10:1941–1957. doi: 10.1101/gr.gr1499r. [DOI] [PMC free article] [PubMed] [Google Scholar]
- Brockmann GA, Karatayli E, Haley CS, Renne U, Rottmann OJ, et al. QTLs for pre- and postweaning body weight and body composition in selected mice. Mamm Genome. 2004;15:593–609. doi: 10.1007/s00335-004-3026-4. [DOI] [PubMed] [Google Scholar]
- Broman KW, Wu H, Sen S, Churchill GA. R/qtl: QTL mapping in experimental crosses. Bioinformatics. 2003;19:889–890. doi: 10.1093/bioinformatics/btg112. [DOI] [PubMed] [Google Scholar]
- Bultman SJ, Michaud EJ, Woychik RP. Molecular characterization of the mouse agouti locus. Cell. 1992;71:1195–1204. doi: 10.1016/s0092-8674(05)80067-4. [DOI] [PubMed] [Google Scholar]
- Carlborg O, Brockmann GA, Haley CS. Simultaneous mapping of epistatic QTL in DU6i × DBA/2 mice. Mamm Genome. 2005;16:481–494. doi: 10.1007/s00335-004-2425-4. [DOI] [PubMed] [Google Scholar]
- Cheverud JM, Routman EJ, Duarte FAM, van Swinderen B, Cothran K, et al. Quantitative trait loci for murine growth. Genetics. 1996;142:1305–1319. doi: 10.1093/genetics/142.4.1305. [DOI] [PMC free article] [PubMed] [Google Scholar]
- Cheverud JM, Vaughn TT, Pletscher LS, Peripato AC, Adams ES, et al. Genetic architecture of adiposity in the cross of LG/J and SM/J inbred mice. Mamm Genome. 2001;12:3–12. doi: 10.1007/s003350010218. [DOI] [PubMed] [Google Scholar]
- Chiu S, Kim K, Haus KA, Espinal GM, Millon LV, et al. Identification of positional candidate genes for body weight and adiposity in subcongenic mice. Physiol Genomics. 2007;31:75–85. doi: 10.1152/physiolgenomics.00267.2006. [DOI] [PubMed] [Google Scholar]
- Churchill GA, Airey DC, Allayee H, Angel JM, Attie AD, et al. The Collaborative Cross, a community resource for the genetic analysis of complex traits. Nat Genet. 2004;36:1133–1137. doi: 10.1038/ng1104-1133. [DOI] [PubMed] [Google Scholar]
- Collin GB, Maddatu TP, Sen S, Naggert JK. Genetic modifiers interact with Cpe(fat) to affect body weight, adiposity, and hyperglycemia. Physiol Genomics. 2005;22:182–190. doi: 10.1152/physiolgenomics.00208.2003. [DOI] [PubMed] [Google Scholar]
- Danforth C. Hereditary adiposity in mice. J Hered. 1927;18 doi: 10.1002/j.1550-8528.1996.tb00518.x. [DOI] [PubMed] [Google Scholar]
- Diament AL, Farahani P, Chiu S, Fisler J, Warden CH. A novel mouse Chromosome 2 congenic strain with obesity phenotypes. Mamm Genome. 2004;15:452–459. doi: 10.1007/s00335-004-2352-x. [DOI] [PubMed] [Google Scholar]
- Ewart-Toland A, Mounzih K, Qiu J, Chehab FF. Effect of the genetic background on the reproduction of leptin-deficient obese mice. Endocrinology. 1999;140:732–738. doi: 10.1210/endo.140.2.6470. [DOI] [PubMed] [Google Scholar]
- Farber CR, Medrano JF. Fine mapping reveals sex bias in quantitative trait loci affecting growth, skeletal size and obesity-related traits on mouse chromosomes 2 and 11. Genetics. 2007;175:349–360. doi: 10.1534/genetics.106.063693. [DOI] [PMC free article] [PubMed] [Google Scholar]
- Farber CR, Corva PM, Medrano JF. Genome-wide isolation of growth and obesity QTL using mouse speed congenic strains. BMC Genomics. 2006;7:102. doi: 10.1186/1471-2164-7-102. [DOI] [PMC free article] [PubMed] [Google Scholar]
- Freeman HC, Hugill A, Dear NT, Ashcroft FM, Cox RD. Deletion of nicotinamide nucleotide transhydrogenase: a new quantitive trait locus accounting for glucose intolerance in C57BL/6J mice. Diabetes. 2006;55:2153–2156. doi: 10.2337/db06-0358. [DOI] [PubMed] [Google Scholar]
- Gregorova S, Forejt J. PWD/Ph and PWK/Ph inbred mouse strains of Mus m. musculus subspecies—a valuable resource of phenotypic variations and genomic polymorphisms. Folia Biol (Praha) 2000;46:31–41. [PubMed] [Google Scholar]
- Guenet JL, Bonhomme F. Wild mice: an ever-increasing contribution to a popular mammalian model. Trends Genet. 2003;19:24–31. doi: 10.1016/s0168-9525(02)00007-0. [DOI] [PubMed] [Google Scholar]
- Hitzemann R, Malmanger B, Cooper S, Coulombe S, Reed C, et al. Multiple cross mapping (MCM) markedly improves the localization of a QTL for ethanol-induced activation. Genes Brain Behav. 2002;1:214–222. doi: 10.1034/j.1601-183x.2002.10403.x. [DOI] [PubMed] [Google Scholar]
- Hubbard TJ, Aken BL, Beal K, Ballester B, Caccamo M, et al. Ensembl 2007. Nucleic Acids Res. 2007;35:D610–D617. doi: 10.1093/nar/gkl996. [DOI] [PMC free article] [PubMed] [Google Scholar]
- Ishikawa A, Namikawa T. Mapping major quantitative trait loci for postnatal growth in an intersubspecific backcross between C57BL/6J and Philippine wild mice by using principal component analysis. Genes Genet Syst. 2004;79:27–39. doi: 10.1266/ggs.79.27. [DOI] [PubMed] [Google Scholar]
- Ishikawa A, Matsuda Y, Namikawa T. Detection of quantitative trait loci for body weight at 10 weeks from Philippine wild mice. Mamm Genome. 2000;11:824–830. doi: 10.1007/s003350010145. [DOI] [PubMed] [Google Scholar]
- Ishikawa A, Hatada S, Nagamine Y, Namikawa T. Further mapping of quantitative trait loci for postnatal growth in an inter-sub-specific backcross of wild Mus musculus castaneus and C57BL/6J mice. Genet Res. 2005;85:127–137. doi: 10.1017/S001667230500738X. [DOI] [PubMed] [Google Scholar]
- Ishimori N, Li R, Kelmenson PM, Korstanje R, Walsh KA, et al. Quantitative trait loci that determine plasma lipids and obesity in C57BL/6J and 129S1/SvImJ inbred mice. J Lipid Res. 2004;45:1624–1632. doi: 10.1194/jlr.M400098-JLR200. [DOI] [PubMed] [Google Scholar]
- Jansa P, Divina P, Forejt J. Construction and characterization of a genomic BAC library for the Mus m. musculus mouse subspecies (PWD/Ph inbred strain) BMC Genomics. 2005;6:161. doi: 10.1186/1471-2164-6-161. [DOI] [PMC free article] [PubMed] [Google Scholar]
- Jerez-Timaure NC, Eisen EJ, Pomp D. Fine mapping of a QTL region with large effects on growth and fatness on mouse chromosome 2. Physiol Genomics. 2005;21:411–422. doi: 10.1152/physiolgenomics.00256.2004. [DOI] [PubMed] [Google Scholar]
- Keightley PD, Hardge T, May L, Bulfield G. A genetic map of quantitative trait loci for body weight in the mouse. Genetics. 1996;142:227–235. doi: 10.1093/genetics/142.1.227. [DOI] [PMC free article] [PubMed] [Google Scholar]
- Keightley PD, Morris KH, Ishikawa A, Falconer VM, Oliver F. Test of candidate gene—quantitative trait locus association applied to fatness in mice. Heredity. 1998;81(Pt 6):630–637. doi: 10.1046/j.1365-2540.1998.00450.x. [DOI] [PubMed] [Google Scholar]
- Kent WJ, Sugnet CW, Furey TS, Roskin KM, Pringle TH, Zahler AM, et al. The human genome browser at UCSC. Genome Res. 2002;12:996–1006. doi: 10.1101/gr.229102. [DOI] [PMC free article] [PubMed] [Google Scholar]
- Komatsu S, Kiyosawa H, Yoshiki A, Okazaki Y, Yoshino M, et al. Identification of seven loci for static glucokinesis and dynamic glucokinesis in mice. Mamm Genome. 2002;13:293–298. doi: 10.1007/s00335-001-2134-7. [DOI] [PubMed] [Google Scholar]
- Lander E, Kruglyak L. Genetic dissection of complex traits: guidelines for interpreting and reporting linkage findings. Nat Genet. 1995;11:241–247. doi: 10.1038/ng1195-241. [DOI] [PubMed] [Google Scholar]
- Lander ES, Green P, Abrahamson J, Barlow A, Daly MJ, et al. MAPMAKER: an interactive computer package for constructing primary genetic linkage maps of experimental and natural populations. Genomics. 1987;1:174–181. doi: 10.1016/0888-7543(87)90010-3. [DOI] [PubMed] [Google Scholar]
- Lang DH, Sharkey NA, Lionikas A, Mack HA, Larsson L, et al. Adjusting data to body size: a comparison of methods as applied to quantitative trait loci analysis of musculoskeletal phenotypes. J Bone Miner Res. 2005;20:748–757. doi: 10.1359/JBMR.041224. [DOI] [PMC free article] [PubMed] [Google Scholar]
- Le Roy I, Perez-Diaz F, Cherfouh A, Roubertoux PL. Preweanling sensorial and motor development in laboratory mice: quantitative trait loci mapping. Dev Psychobiol. 1999;34:139–158. doi: 10.1002/(sici)1098-2302(199903)34:2<139::aid-dev7>3.0.co;2-h. [DOI] [PubMed] [Google Scholar]
- Li R, Tsaih SW, Shockley K, Stylianou IM, Wergedal J, et al. Structural model analysis of multiple quantitative traits. PLoS Genet. 2006;2:e114. doi: 10.1371/journal.pgen.0020114. [DOI] [PMC free article] [PubMed] [Google Scholar]
- Masinde GL, Li X, Gu W, Davidson H, Hamilton-Ulland M, et al. Quantitative trait loci (QTL) for lean body mass and body length in MRL/MPJ and SJL/J F(2) mice. Funct Integr Genomics. 2002a;2:98–104. doi: 10.1007/s10142-002-0053-7. [DOI] [PubMed] [Google Scholar]
- Masinde GL, Li X, Gu W, Hamilton-Ulland M, Mohan S, et al. Quantitative trait loci that harbor genes regulating muscle size in (MRL/MPJ × SJL/J) F(2) mice. Funct Integr Genomics. 2002b;2:120–125. doi: 10.1007/s10142-002-0067-1. [DOI] [PubMed] [Google Scholar]
- Masinde GL, Li X, Gu W, Wergedal J, Mohan S, et al. Quantitative trait loci for bone density in mice: the genes determining total skeletal density and femur density show little overlap in F2 mice. Calcif Tissue Int. 2002c;71:421–428. doi: 10.1007/s00223-001-1113-z. [DOI] [PubMed] [Google Scholar]
- McDaniel AH, Li X, Tordoff MG, Bachmanov AA, Reed DR. A locus on mouse Chromosome 9 (Adip5) affects the relative weight of the gonadal but not retroperitoneal adipose depot. Mamm Genome. 2006;17:1078–1092. doi: 10.1007/s00335-006-0055-1. [DOI] [PMC free article] [PubMed] [Google Scholar]
- Melanitou E, Joly F, Lathrop M, Boitard C, Avner P. Evidence for the presence of insulin-dependent diabetes-associated alleles on the distal part of mouse chromosome 6. Genome Res. 1998;8:608–620. doi: 10.1101/gr.8.6.608. [DOI] [PMC free article] [PubMed] [Google Scholar]
- Moody DE, Pomp D, Nielsen MK, Van Vleck LD. Identification of quantitative trait loci influencing traits related to energy balance in selection and inbred lines of mice. Genetics. 1999;152:699–711. doi: 10.1093/genetics/152.2.699. [DOI] [PMC free article] [PubMed] [Google Scholar]
- Naggert JK, Fricker LD, Varlamov O, Nishina PM, Rouille Y, et al. Hyperproinsulinaemia in obese fat/fat mice associated with a carboxypeptidase E mutation which reduces enzyme activity. Nat Genet. 1995;10:135–142. doi: 10.1038/ng0695-135. [DOI] [PubMed] [Google Scholar]
- Noben-Trauth K, Naggert JK, North MA, Nishina PM. A candidate gene for the mouse mutation tubby. Nature. 1996;380:534–538. doi: 10.1038/380534a0. [DOI] [PubMed] [Google Scholar]
- Petkov PM, Ding Y, Cassell MA, Zhang W, Wagner G, et al. An efficient SNP system for mouse genome scanning and elucidating strain relationships. Genome Res. 2004;14:1806–1811. doi: 10.1101/gr.2825804. [DOI] [PMC free article] [PubMed] [Google Scholar]
- Rance KA, Fustin JM, Dalgleish G, Hambly C, Bunger L, et al. A paternally imprinted QTL for mature body mass on mouse chromosome 8. Mamm Genome. 2005;16:567–577. doi: 10.1007/s00335-005-0012-4. [DOI] [PubMed] [Google Scholar]
- Reed DR, McDaniel AH, Li X, Tordoff MG, Bachmanov AA. Quantitative trait loci for individual adipose depot weights in C57BL/6ByJ × 129P3/J F(2) mice. Mamm Genome. 2006;17:1065–1077. doi: 10.1007/s00335-006-0054-2. [DOI] [PMC free article] [PubMed] [Google Scholar]
- Reed DR, Bachmanov AA, Tordoff MG. Forty mouse strain survey of body composition. Physiol Behav. 2007;91:593–600. doi: 10.1016/j.physbeh.2007.03.026. [DOI] [PMC free article] [PubMed] [Google Scholar]
- Reifsnyder PC, Churchill G, Leiter EH. Maternal environment and genotype interact to establish diabesity in mice. Genome Res. 2000;10:1568–1578. doi: 10.1101/gr.147000. [DOI] [PMC free article] [PubMed] [Google Scholar]
- Rocha JL, Eisen EJ, Van Vleck LD, Pomp D. A large-sample QTL study in mice: I. Growth. Mamm Genome. 2004a;15:83–99. doi: 10.1007/s00335-003-2312-x. [DOI] [PubMed] [Google Scholar]
- Rocha JL, Eisen EJ, Van Vleck LD, Pomp D. A large-sample QTL study in mice: II. Body composition. Mamm Genome. 2004b;15:100–113. doi: 10.1007/s00335-003-2308-6. [DOI] [PubMed] [Google Scholar]
- Silver LM. Mouse Genetics Concept and Applications. Oxford: Oxford University Press; 1995. [Google Scholar]
- Solberg LC, Baum AE, Ahmadiyeh N, Shimomura K, Li R, et al. Sex- and lineage-specific inheritance of depression-like behavior in the rat. Mamm Genome. 2004;15:648–662. doi: 10.1007/s00335-004-2326-z. [DOI] [PMC free article] [PubMed] [Google Scholar]
- Srivastava AK, Mohan S, Masinde GL, Yu H, Baylink DJ. Identification of quantitative trait loci that regulate obesity and serum lipid levels in MRL/MpJ × SJL/J inbred mice. J Lipid Res. 2006;47:123–133. doi: 10.1194/jlr.M500295-JLR200. [DOI] [PubMed] [Google Scholar]
- Storchova R, Gregorova S, Buckiova D, Kyselova V, Divina P, et al. Genetic analysis of X-linked hybrid sterility in the house mouse. Mamm Genome. 2004;15:515–524. doi: 10.1007/s00335-004-2386-0. [DOI] [PubMed] [Google Scholar]
- Stylianou IM, Korstanje R, Li R, Sheehan S, Paigen B, et al. Quantitative trait locus analysis for obesity reveals multiple networks of interacting loci. Mamm Genome. 2006;17:22–36. doi: 10.1007/s00335-005-0091-2. [DOI] [PubMed] [Google Scholar]
- Svenson KL, Von Smith R, Magnani PA, Suetin HR, Paigen B, et al. Multiple trait measurements in 43 inbred mouse strains captures the phenotypic diversity characteristic of human populations. J Appl Physiol. 2007;102:2369–2378. doi: 10.1152/japplphysiol.01077.2006. [DOI] [PubMed] [Google Scholar]
- Tartaglia LA, Dembski M, Weng X, Deng N, Culpepper J, et al. Identification and expression cloning of a leptin receptor, OB-R. Cell. 1995;83:1263–1271. doi: 10.1016/0092-8674(95)90151-5. [DOI] [PubMed] [Google Scholar]
- Truett GE, Heeger P, Mynatt RL, Truett AA, Walker JA, et al. Preparation of PCR-quality mouse genomic DNA with hot sodium hydroxide and tris (HotSHOT) Biotechniques. 2000;29:52–54. doi: 10.2144/00291bm09. [DOI] [PubMed] [Google Scholar]
- Vitarius JA, Sehayek E, Breslow JL. Identification of quantitative trait loci affecting body composition in a mouse intercross. Proc Natl Acad Sci U S A. 2006;103:19860–19865. doi: 10.1073/pnas.0609232103. [DOI] [PMC free article] [PubMed] [Google Scholar]
- Wade CM, Kulbokas EJ, 3rd, Kirby AW, Zody MC, Mullikin JC, et al. The mosaic structure of variation in the laboratory mouse genome. Nature. 2002;420:574–578. doi: 10.1038/nature01252. [DOI] [PubMed] [Google Scholar]
- Wang Y, Kim KA, Kim JH, Sul HS. Pref-1, a preadipocyte secreted factor that inhibits adipogenesis. J Nutr. 2006;136:2953–2956. doi: 10.1093/jn/136.12.2953. [DOI] [PubMed] [Google Scholar]
- Witmer PD, Doheny KF, Adams MK, Boehm CD, Dizon JS, et al. The development of a highly informative mouse Simple Sequence Length Polymorphism (SSLP) marker set and construction of a mouse family tree using parsimony analysis. Genome Res. 2003;13:485–491. doi: 10.1101/gr.717903. [DOI] [PMC free article] [PubMed] [Google Scholar]
- Wuschke S, Dahm S, Schmidt C, Joost HG, Al-Hasani H. A meta-analysis of quantitative trait loci associated with body weight and adiposity in mice. Int J Obes (Lond) 2006;31:829–841. doi: 10.1038/sj.ijo.0803473. [DOI] [PubMed] [Google Scholar]
- Yang X, Schadt EE, Wang S, Wang H, Arnold AP, et al. Tissue-specific expression and regulation of sexually dimorphic genes in mice. Genome Res. 2006;16:995–1004. doi: 10.1101/gr.5217506. [DOI] [PMC free article] [PubMed] [Google Scholar]
- Yi N, Diament A, Chiu S, Kim K, Allison DB, et al. Characterization of epistasis influencing complex spontaneous obesity in the BSB model. Genetics. 2004;167:399–409. doi: 10.1534/genetics.167.1.399. [DOI] [PMC free article] [PubMed] [Google Scholar]
- Yi N, Yandell BS, Churchill GA, Allison DB, Eisen EJ, et al. Bayesian model selection for genome-wide epistatic quantitative trait loci analysis. Genetics. 2005;170:1333–1344. doi: 10.1534/genetics.104.040386. [DOI] [PMC free article] [PubMed] [Google Scholar]
- Yi N, Zinniel DK, Kim K, Eisen EJ, Bartolucci A, et al. Bayesian analyses of multiple epistatic QTL models for body weight and body composition in mice. Genet Res. 2006;87:45–60. doi: 10.1017/S0016672306007944. [DOI] [PMC free article] [PubMed] [Google Scholar]
- Zhang Y, Proenca R, Maffei M, Barone M, Leopold L, et al. Positional cloning of the mouse obese gene and its human homologue. Nature. 1994;372:425–432. doi: 10.1038/372425a0. [DOI] [PubMed] [Google Scholar]