

Abstract
We used an improved cryosectioning technique in combination with immunogold cytochemistry and morphometric analysis to study the convergence of the autophagic and endocytic pathways in isolated rat hepatocytes. The endocytic pathway was traced by continuous uptake of gold tracer for various time periods, up to 45 min, while the cells were incubated in serum-free medium to induce autophagy. Endocytic structures involved in fusion with autophagic vacuoles (AV) were categorized into multivesicular endosomes (MVE) and vesicular endosomes (VE). Three types of AV—initial (AVi), intermediate (AVi/d), and degradative (AVd)—were defined by morphological criteria and immunogold labeling characteristics of marker enzymes.
The entry of tracer into AV, manifested as either tracer-containing AV profiles (AV+) or fusion profiles (FP+) between AV and tracer-positive endosomal vesicles/vacuoles, was detected as early as 10 min after endocytosis. The number of AV+ exhibited an exponential increase with time. FP+ between MVE or VE and all three types of AV were observed. Among the 112 FP+ scored, 36% involved VE. Of the AV types, AVi and AVi/d were found five to six times more likely to be involved in fusions than AVd. These fusion patterns did not significantly change during the period of endocytosis (15–45 min). We conclude that the autophagic and endocytic pathways converge in a multistage fashion starting within 10 min of endocytosis. The nascent AV is the most upstream and preferred fusion partner for endosomes.
The autophagic and endocytic pathways represent branches of the lysosomal digestive system, the former being responsible for degradation of cytoplasmic constituents and the latter being responsible for degradation of exogenous substances. Although there is no direct evidence to disprove that autophagic and endocytic pathways can indeed run in parallel, both biochemical and morphological evidence has supported the convergence view (Høyvik et al., 1987; Rabouille et al., 1993).
The formation of the autophagic vacuoles (AV)1 begins with segregation of portions of cytoplasm by a lipid-rich membranous apparatus called phagophore (Seglen, 1987), generating nascent or immature autophagic vacuoles (AVi). Through acquisition of lysosomal membrane proteins, acidic pH, and hydrolases, the AVi becomes degradative (AVd) (Dunn, 1990b , 1994). Its limiting membrane becomes one of uniform width and the contents appear to be disintegrating. From the standpoint of autophagy, the classical view has been that AV fuse with preexisting lysosomes (Aristila and Trump, 1968) while receiving acid hydrolases and encountering exogenous materials. That is, the autophagic and endocytic pathways converge at the lysosomal level. However, the biochemical study of carbohydrate degradation by Gorden and Seglen (1988) provided the first indication that AV might encounter endosomes before undergoing transformation through fusion with lysosomes: when autophagic–lysosomal fusion was blocked by asparagine, autophagocytosed [14C]lactose could still be degraded by endocytosed β-galactosidase. The term “amphisome” was then proposed for this functional compartment where the two pathways first meet and wherein endogenous β-galactosidase, a lysosomal marker enzyme, was missing. Later, amphisomes were proved to be acidic (Strømhaug and Seglen, 1993).
During the past decades, efforts to unravel the biogenesis of lysosomes have revealed that endosomes are also endowed with lysosomal characteristics, including lysosomal membrane proteins and lytic activities. Using the mannose-6-phosphate receptor (MPR) as a prelysosomal marker, several immunocytochemical studies have documented the presence of MPR in AV (Dunn, 1990b ; Tooze et al., 1990; Punnonen et al., 1992, 1993). Although substantiating the view of prelysosomal convergence, these studies did not provide morphological proof of the existence of amphisomes because a significant amount of lysosomal enzymes was always present together with MPR in the same autophagic compartment.
Also not clear is whether the coalescence of AV with either lysosomes or endosomes is a random event or instead exhibits (temporal) preferential fusion combinations. Lawrence and Brown (1992) used a double-pulse labeling strategy to separately mark lysosomes and endosomes in an effort to determine which compartment initially merges with AV. They found that soon after the induction of autophagy and the onset of endocytosis, the preloaded lysosomal tracers readily labeled the AVd, whereas AVi received neither tracers even after 2 h. Yokota and colleagues (1995) approached the issue by quantifying the fusion profiles (FP) between different types of endosomes and AV. Similar to Lawrence and Brown (1992), they used leupeptin to deter the disappearance of AV. The most frequently (64.2%) observed fusion occurred between lysosomal marker–positive AV (i.e., AVd) and late endosomes, but they did observe fusions between newly formed AV and late endosomes, though only in rare cases (Yokota et al., 1995).
In an attempt to trace the earliest point of convergence between autophagic and endocytic pathways, Tooze and colleagues (1990) used HRP as an endocytic tracer in CoCl2-treated exocrine pancreatic cells. They found that Type I AV, the intermediate AV type (AVi/d) in their classification, were first accessed by HRP after a 30-min lag. Although FP as such were not studied, these authors indirectly suggested that the endocytic and autophagic pathways converge immediately after the formation of the first compartments, i.e., early endosomes and nascent AV, of each pathway, respectively.
The mainstay of our current study has been to follow the delivery of interiorized tracer to AV. A time-sequential FP analysis in the absence of drugs has been chosen to resolve the issue of convergence. We asked: (a) How soon after the endocytosis can convergence be detected? (b) Is the convergence of single-point or multistage nature? (c) If fusion takes place at various levels of each pathway, does it occur to the same extent or do preferred sites exist? We have used an improved cryosectioning technique that greatly enhanced the fine structural preservation of AV (Liou et al., 1996). Not only were fusion profiles better retained structurally, but the morphometric analysis and the designation of AV maturation stages, as defined before (Rabouille et al., 1993), were also greatly facilitated. Our data indicate that the autophagic pathway coalesces with the endocytic pathway as soon as the AVi are formed.
Materials and Methods
Chemicals and Equipment
Obtained from Boehringer Mannheim Corp. (Indianapolis, IN): protein A; from Dulbecco: Dulbecco's minimal essential medium (DMEM, Gibco, Paisley, UK); from Fluka (Buchs, Switzerland): polyvinylpyrrolidone (PVP, mol wt 10,000; from Sigma Chemical Co. (St, Louis, MO): methyl cellulose 25 cP; from Leica (Vienna, Austria): Reichert ultracut S/Reichert FCS equipped with an antistatic device from Diatome (Biel, Switzerland); and from Drukker International (Cuijk, The Netherlands): diamond knives.
The Preparation of Protein A Gold Conjugates
Colloidal gold solutions were prepared by the tannic acid reducing method. We used H2O2 to oxidize the residual tannic acid after the gold solution was formed (Slot and Geuze, 1985). H2O2 was added to a final concentration of 0.2% to the gold solution after the reducing reaction was complete. It was boiled for another 5 min. Protein A was added to this gold solution to make complexes (Roth et al., 1978). 5-nm gold particles were used as endocytic tracers, whereas 10- and 15-nm gold particles were used on cryosections as immunolocalization markers. The H2O2 reduction and the choice of protein A to stabilize the gold for uptake experiments reduced the stickiness of the endocytosis marker to the surface of the living cells, thus providing an uncompromised fluid-phase marker.
Animals, Cells, and Incubation
Four male Wistar rats weighing 200–250 g were fasted overnight and their hepatocytes were isolated according to Seglen (1976) with modifications described previously (Geelen et al., 1978). The cells were suspended in DMEM supplemented with 10% FCS and plated, 3 × 10⁶ cells each, on 6-cm diameter collagen-coated, vented culture dishes. After 15 min of settlement at room temperature, the cells were transferred into a 37°C chamber with a gas phase of 5% CO2/95% air and incubated for 1 h. The DMEM was then replaced with suspension buffer (in mg/1,000 ml of final solution: NaCl, 4,000; KCl, 400; CaCl2·2H2O, 180; MgCl2·6H2O, 130; KH2PO4, 150; Na2SO4, 100; Hepes, 7,200; TES, 6,900; Tricine, 6,500; and 52.5 ml of 1 M NaOH, pH 7.6; Seglen, 1976) to induce autophagy for at least another hour before commencement of tracer uptake.
Endocytosis of Gold Tracer
Small gold was dialyzed against 0.9% NaCl for at least 2 h before use. It was diluted in suspension buffer to a final OD520nm of 5. In the hepatocyte cultures, the plain suspension buffer was replaced by a gold-containing one, in such a way that at the end of an endocytosis experiment, all the cells were starved for 1.75 h in suspension buffer but had been exposed to tracer for 10 to 45 min. Endocytosis was terminated by fixation with 0.8% glutaraldehyde, 0.5% acrolein buffered at pH 6.3 according to Small and Celis (1978).
Ultracryotomy and Immunocytochemistry
After 1 h of fixation at room temperature, the cells were rinsed with 0.1 M Pipes, pH 7.2, scraped off from the plate using a rubber policeman, transferred into Eppendorf tubes, and centrifuged. Cell pellets were then resuspended in 10% gelatin and pelleted again. The tubes were plunged into icy water to quickly solidify the gelatin with cells. In a cold room, the tip of the Eppendorf tube was cut open and the cell pellet retrieved into a drop of PVP-sucrose (15%/1.7 M), in which the pellet was cut into 1-mm3 blocks. Blocks were suspended and rotated in PVP-sucrose for at least 2 h in the cold and then mounted onto the specimen stubs and stored in liquid nitrogen.
Ultrathin cryosections were prepared and immunolabeled as previously described (Liou et al., 1996). The sections on the knife surface were transferred to 100-mesh hexagonal formvar-carbon–coated grids with methyl cellulose–uranyl acetate (MU; 1.8%/2.5%) droplets. Single immunolabeling was performed with antibodies against CuZn superoxide dismutase (SOD), type III carbonic anhydrase (CAIII), lysosomal glycoprotein 120 (LGP-120), cathepsin D (Rabouille et al., 1993), or the asialoglycoprotein receptor (ASGP-R) (Geuze et al., 1983). Some sections were not immunolabeled but were air-dried immediately after retrieval from the knife for direct viewing as described (Liou et al., 1996).
Quantitations
AV/Cell and AVi/AV.
Profile counting was directly performed in an electron microscope (model 1200 EX; JEOL, Tokyo, Japan) operating at 60 kV using an objective aperture of 20 μm. Cell profiles were randomly chosen and the number of AV profiles therein scored. The profile number of AV per cell (AV/cell) was averaged from seven time points studied (441 cells in total). Sections from all seven time points were likewise randomly searched for AV (1,684 in total), and the numerical profile fraction of AVi (AVi/AV) was determined.
Tracer-containing AV Profiles/Cell.
To estimate the extent to which AV were reached by endocytosed tracers, we conducted a time course investigation on tracer-containing AV profiles (AV+) per cell profile (AV+/cell). We considered an AV as AV+ either when tracer was seen integrated into the AV or when the AV was in fusion state with another tracer-containing structure, most of the time an endosome but sometimes an AV+. Individual cell profiles were randomly picked at low magnification (e.g., 6,000×) and searched for AV+ at 25,000×. At least 10 AV+ profiles were scored for each time point and the kinetic appearance of AV+ per cell profile was established (see Fig. 3).
Figure 3.

Appearance of tracer in AV. Cells were allowed to endocytose tracer particles continuously for the designated periods of time. At each time, random sections were searched for AV+, and AV+/500 cell profiles were plotted. The number of cell profiles examined (denominator) and the respective number of AV+ scored (numerator) are listed above the graph.
SOD Labeling of AV Types.
Standard morphometric analysis on micrographs (Weibel, 1969) was carried out on five SOD-labeled samples; ∼100 AV per sample were randomly micrographed. On the print (final magnification 45,000×), every AV was first designated as AVi, AVi/d, or AVd according to morphological criteria (see Results). The numerical profile distribution of each AV type was expressed as percentage of the total AV (Table I, row 2). A transparent sheet of a single lattice of 1 cm2 per grid area was then superimposed on the prints and the points (P; reflecting volume) and the intersections (I; reflecting surface area) were scored for every AV. The P and I counts belonging to the same AV types were added up and expressed as percentages of the total P and I counts (Table I, rows 3 and 4).
Table I.
Endosome–AV Fusion Preference
| AVi | AVi/d | AVd | ||||||
|---|---|---|---|---|---|---|---|---|
| 1 | Percentage of AV types in fusion | 63.0 ± 3.6 | 18.1 ± 2.3 | 18.9 ± 2.3 | ||||
| profiles with endosomes | ||||||||
| 2 | Percentage of AV types | 30.2 ± 2.7 | 9.0 ± 0.7 | 60.8 ± 3.0 | ||||
| encountered | ||||||||
| 3 | Relative volume density | 34.9 ± 2.9 | 9.8 ± 0.5 | 55.3 ± 3.1 | ||||
| of AV types | ||||||||
| 4 | Relative surface density | 33.9 ± 3.9 | 10.0 ± 0.5 | 56.1 ± 4.0 | ||||
| of AV types | ||||||||
| 5 | Fusion preference factor | 5.5 | 5.4 | 1.0 |
Row 1: averaged from data given in Fig. 7 (n = 7, ± SEM). Rows 2, 3, and 4: results of morphometrical analysis as described in Materials and Methods (n = 5, ± SEM). Row 5: calculated as the ratio of values in row 1/values in row 4, normalized to the value of AVd set as 1.
To determine the vacuolar versus cytoplasmic SOD-labeling density, we first scored the immunogold counting of each AV. Then a constant cytoplasmic area of 1.24 μm2 (i.e., 25 cm2 on print), most of the time at the upper right hand corner on each print, was also scored for its immunogold numbers. The total SOD counts belonging to the same AV type or cytoplasm were divided by the volume (i.e., total P) they occupied. This gave the SOD-labeling per volume, i.e., labeling density. The labeling density of AVs were normalized to that of the cytoplasm to compare the degree of SOD accumulation in each of the AV types.
Distribution of Endocytosed Gold in AV Types.
A random search for AV+ at each time point was conducted. The number of cell profiles that have been examined varied from 2,500 of the 15-min group to 200 of the 45-min group. Whenever an AV+ was seen, its image was recorded on a micrograph. The endocytic tracer particles in every AV+ were also counted and the relative distribution of tracer in each AV+ category were expressed as percentage of the total (see Fig. 4).
Figure 4.

Tracer distribution in AV+ types. Cells were allowed to endocytose tracer particles continuously for the designated periods of time. At each time, random sections were searched for AV+. The results are categorized according to AV types and plotted for the relative distribution of tracers. The total tracer counts are given on top of each bar. The number in each block represents the actual number of AV profiles, from which tracer counts are scored.
Fusion Profile Analysis.
To find out whether preferential fusion sites exist along the autophagic pathway, fusion profiles between AV and tracerpositive endosomes (FP+) were singled out from the AV+ and analyzed separately. The FP+ were categorized according to the endosomal types involved (see Fig. 6) or AV types involved (see Fig. 7). Since the FP+ distribution remained relatively constant during the 45 min of uptake, the average fusion frequency of each AV type (Table I, row 1) was deduced from summarized data of all time points measured. This was then normalized to the relative surface area ratio of each respective AV type (Table I, row 4). These values serve as indicators of fusion preference (Table I, row 5).
Figure 6.

Endosome types involved in FP+. The FP+ were classified according to MVE and VE involved. The actual numbers of FP+ analyzed are given above the bars.
Figure 7.

ASGP-R labeling in FP+ and endosomes. Cells exposed for 40 min to 5-nm gold tracer. Section immunolabeled for ASGP-R with 10-nm gold. (a) Low ASGP-R labeling in tracer-carrying endocytic vesicles (arrowheads), adjacent to (top) or fusing with (bottom) an AVi/d. (b) ASGP-R labeling at the plasma membrane and in endosomal elements near the cell surface (ex, extra cellular space). Vesicles of the MVE (asterisk) and VE (arrowhead) type, containing endocytosed gold, are present in the same area. (c) As b. A VE-like vesicle with endocytosed gold and low ASGP-R labeling (arrowhead) is shown connected to an ASGP–R rich element (arrow), possibly a recycling endosome. Bars, 200 nm.
Results
Characterization of AV Types
The cryosection is a most favorable substrate for immunoelectron microscopy. However, in its application to the study of autophagy, this advantage is often offset by the lack of structural integrity of AV (Fig. 1 a). A morphometric analysis of AV parameters, in particular, has been extremely cumbersome (Punnonen et al., 1992; Rabouille et al., 1993; Fengsrud et al., 1995). Recently, we have overcome this obstacle by replacing the conventional section retrieval medium, sucrose, by MU (Liou et al., 1996). This modification greatly improves the preservation of AV and allows reliable recognition of structural details in defining AV types (Fig. 1 b). We tentatively defined three types of AV by morphological criteria as follows: (1) AVi are surrounded by multiple membranes and contain unaltered cytoplasmic constituents. Probably because of the scarcity of proteins and enrichment of lipids (Reunanen et al., 1985), the enveloping membranes of AVi are often indistinctive. These characteristics together with the presence of electron lucent material between the sequestered contents and the surrounding cytoplasm were used as convenient diagnostic features for AVi. (2) AVd are enclosed by a single distinctive membrane and contain components at various stages of degradation. This category also includes those AV exhibiting electron-opaque, homogenous matrices (i.e., residual body type of lysosomes). (3) AVi/d have a single limiting membrane and their contents show no (or only early) signs of degradation.
Figure 1.
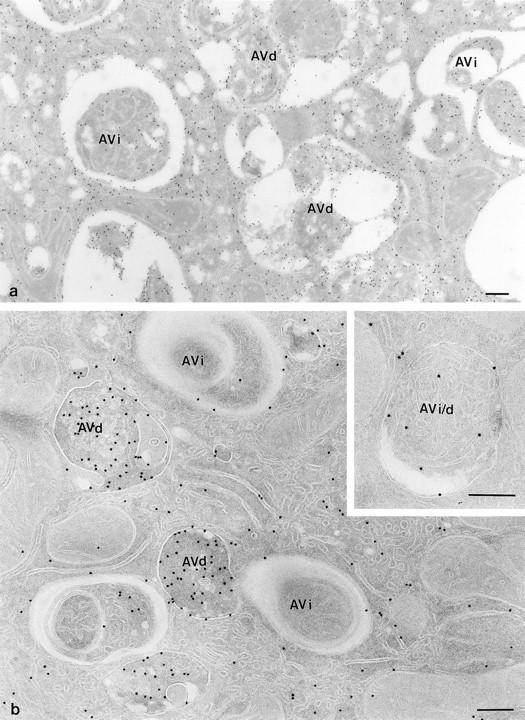
Comparison of structural preservation in cryosections picked up with sucrose (a) and MU (b). In isolated hepatocytes, autophagy was induced for 30 min in suspension buffer before fixation. (a) Cryosection picked up with 2.3 M sucrose and labeled for SOD. Note the presence of large, “empty” gaps between sequestered contents of the AV and the surrounding cytoplasm. (b) A similar section as a, but picked up with an MU mixture. The AV are no longer distorted and the overall membranous structures are sharply delineated. The SOD-labeling density of AVi is as that of the cytosol, whereas AVd show much more intense labeling. (Inset) An AVi/d that is distinct from AVi by its single limiting membrane. The highly pleiomorphic AVd are also bound by a distinctive single membrane, but in contrast to AVi/d, their contents are characterized by debris of digested material. Bars, 250 nm.
To validate these tentative morphological criteria of AV classification, we first studied the immunolabeling patterns of SOD, CAIII, and cathepsin D in the improved cryosections. In a previous study, we defined AV types using the presence of SOD and CAIII as discriminating immunocytochemical markers (Rabouille et al., 1993). Both are cytosolic enzymes and are randomly autophagocytosed into AV. The AVi exhibit SOD- and CAIII-labeling densities similar to that of the adjacent cytosol. In AVi/d, CAIII labeling is less than in the cytosol because of degradation, whereas the SOD, being degradation resistant, is slightly concentrated. The AVd show hardly any CAIII but do show dense labeling of SOD. In the present study, we first used a quantitative approach to verify the SOD-labeling pattern. In each of five cell preparations, ∼100 AV profiles were randomly selected and classified solely on the basis of the above morphological criteria. Subsequently, the vacuolar versus cytosolic SOD-labeling densities of each AV type was determined. The SOD concentration ratios (± SEM) in AVi, AVi/d, and AVd over the cytoplasm were 1.39 ± 0.15, 2.35 ± 0.13, and 4.29 ± 0.67, respectively. These values are in good agreement with those reported before from rat liver tissue (Rabouille et al., 1993). In addition, the immunolabeling features of cathepsin D (Fig. 2 a) and CAIII (Fig. 2, b and c) in the three AV types were in accordance with the earlier observations (Rabouille et al., 1993). Therefore, in the following experiments, we used only the morphological criteria to define AVi, AVi/d, and AVd. Cathepsin D labeling was low or absent in AVi and low in AVi/d. Virtually all AVd showed high labeling for cathepsin D (Fig. 2 a) and were the exclusive sites where significant cathepsin D labeling was observed. The same holds for another lysosomal marker, LGP-120 (not shown). Since all lysosomes showed high SOD labeling, it seems that all lysosomes are involved in autophagy.
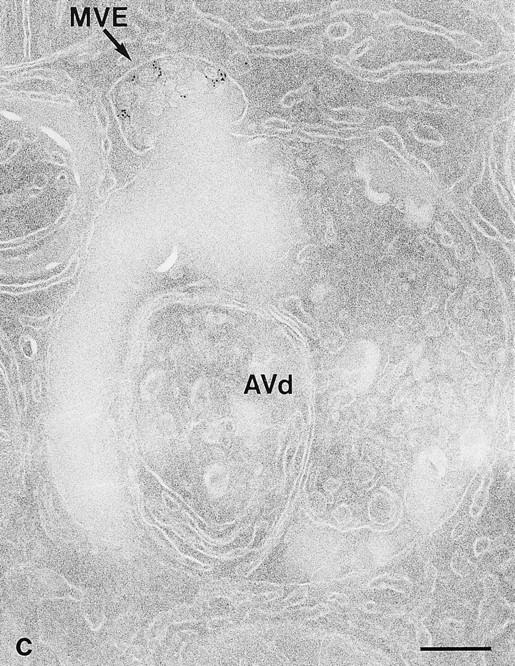
Figure 2.
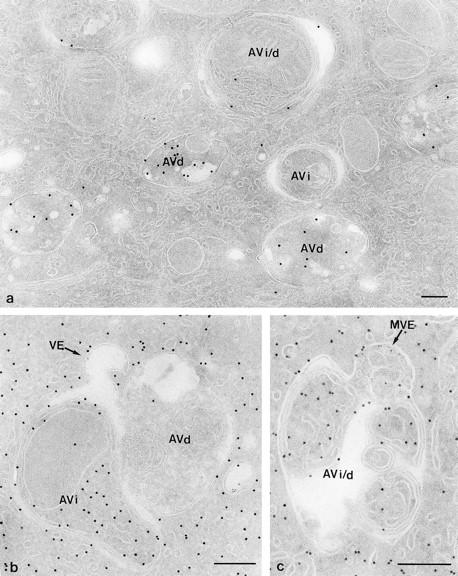
Labeling patterns of cathepsin D and CAIII in MU picked-up cryosections. (a) Cells treated as in Fig. 1 b, but the section was immunolabeled for cathepsin D, which is not detectable in the AVi, moderately present in the AVi/d, and abundant in AVd. Cells in b and c had endocytosed 5-nm gold tracer for 20 and 40 min, respectively, before fixation and CAIII labeling. (b) Complex fusion profile of a CAIII-positive AVi, an AVd which is without CAIII labeling, and a VE that contains an endocytosed gold probe (arrow). Close to the AVd is another tracer-bearing VE. (c) Fusion profile of a tracer-bearing MVE and an AVi/d that exhibits a single limiting membrane and a CAIII-labeling concentration similar to that of the cytoplasm. Bars, 200 nm.
Entrance of Endocytosed Tracers into AV
As early as 10 min after endocytosis, AV+ profiles were detected, suggesting that the convergence of the two pathways starts within 10 min of endocytosis. Since the incidence was low, i.e., <1 per 100 cell profiles, the AV+ profiles counted after 10 min of uptake would not appear in graphic data. The occurrence of AV+ increased exponentially with time (Fig. 3): after 45 min of continuous tracer uptake, virtually every cell profile exhibited at least one AV+ profile. At that time, 30.0% (±2.4%, SEM of five measurements) of the endocytosed gold was present in AV. Therefore, although the earliest appearance of the tracer in AV was observed already after 10 min, the average time to reach AV is much longer. Considering the continuous uptake and assuming that the major part of endocytosed gold ends up in lysosomes, we estimated the average arrival time at ∼30 min after internalization. Tracer uptake per se did not seem to induce AV formation or alter the composition of the AV population: the profile number of AV per cell profile (6.14 ± 0.57 [SEM]) or the proportion of AVi (∼30%; see Table I) did not change with time of endocytosis.
AV+ profiles exhibited, on average, six tracer particles, which were often not randomly dispersed throughout the AVi+, but rather appeared as small peripheral clusters, probably still at the site of delivery. The endocytosed gold was only rarely found inside small vesicles contained in the AVi. In such AVi, gold-containing vesicles had probably been engulfed by the AVi together with sequestered cytoplasm. In the majority of AVi+, gold particles occurred not in internal vesicles, indicating that they usually enter AV by vesicular fusion. Within the first 20 min of uptake, >60% of the tracers was found to reside in AVi (Fig. 4). However, this dominance occurred only transiently. With time, gradually more tracer was found in AVd. The number of AV+ profiles, as indicated in the bars of Fig. 4, exhibited a parallel trend. The acquisition of tracers by the AV is not solely due to fusions with endosomes but is also due to mutual fusion events of AV. To investigate the delivery of tracer to AV by endosomes in more detail, we performed an analysis on fusion profiles between AV and endosomes that contained endocytosed gold (FP+).
Fusion Profile Analysis
The fusion profile approach was feasible in the present study because of the improved structural integrity with the modified cryosectioning technique. Occasionally, we observed a gold-carrying endocytic vesicle and an AV in what might be the initial phase of fusion, exhibiting a V-shaped membrane apposition (Fig. 5 b, arrowhead). The AV surface displayed a protrusion, and the endosome showed a corresponding indentation. The AV–endosome fusion profiles depicted in Figs. 2, b and c, and 5, b and c, respectively, may represent successive stages through which the fusion partners become confluent. Several fusion combinations were noticed. Of the 112 FP+ recorded, the tracerbearing fusion partner for AV involved: (a) multivesicular endosomes (MVE, 64%), characterized by internal vesicles and a diameter of 200–500 nm (Figs. 2 c and 5 c), and (b) vesicular endosomes (VE, 36%), including small vesicles of the size of the earliest endocytic vesicles (Figs. 5 a and 7 a) and intermediate-sized electron lucent endosomes (100–250 nm in diameter), whose internalized gold tracers are affixed to the rim (Fig. 2 b). At all time points examined, both MVE and VE were seen to be involved in fusion (Fig. 6). In an attempt to further identify the endosomal elements involved in FP+, we screened around 20 fusion profiles in sections labeled for several endosomal and lysosomal markers, such as cathepsin D, MPR, and LGP-120. None of the markers used was abundant in the fusing MVE or VE, which made reliable quantitation cumbersome. However, the early endosomal marker, ASGP-R, labeled more prominently, occurring in ∼65% of the fusing endosomes (Fig. 7 a). ASGP-R–positive MVE as well as VE were encountered (Fig. 7 a). ASGP-R was most abundant at the plasma membrane and in adjacent early endosomal elements (Geuze et al., 1983; Fig. 7 b). In this area, MVE- and VE-like structures containing endocytosed gold (Fig. 7 b) sometimes seemed to be involved in lateral sorting of the ASGP-R (Fig. 7 c) as described before (Geuze et al., 1983). Cathepsin D (Fig. 2 a) could not be detected in the endosomal part of FP+, but 40–45% of them were positive for LGP-120. In contrast to ASGP-R, LGP-120 is almost absent at the cell surface (Geuze et al., 1988). These observations are concomitant with the idea that the endosomal partners do undergo some maturation before their fusion with AV.
Figure 5.

Fusion profiles. Cells exposed to 5-nm gold tracers for 20 (a and c) and 25 min (b) before fixation. Sections were picked up by MU and air-dried (c) or underwent immunolabeling with anti-SOD antibodies (a and b). (a) Fusion between a small VE (arrow) and an AVi. A cluster of two gold particles (arrowhead) is also seen at another location. (b) Fusion between an electron lucent MVE (arrow) and an AVd. (c) Fusion between an MVE (arrow) and an AVd. Bars, 200 nm.
When FP+ were categorized according to the AV types, AVi, AVi/d, and AVd all were seen to be involved in fusion (Fig. 8). This indicates multiple entrance sites for endocytosed material. A further analysis of fusion frequencies did not show any apparent change in the types of AV and endosomes involved in fusions with time (Figs. 6 and 8) as opposed to the foregoing results of AV+ profile/ tracer accumulation analysis (Fig. 4). For each time point, an average of ∼ 60, 20, and 20% of FP+ involved AVi, AVi/d, and AVd, respectively (Table I, row 1). By far, the majority of FP+ occurred with AVi, suggesting that AVi represent the preferred site of tracer entry. To investigate whether this apparent fusion preference of AVi is merely due to the fact that there were more AVi than AVi/d and AVd available for fusion, we determined the relative number, volume, and surface densities of the AV types by morphometric analysis. The relative numerical, volume, and surface densities of AVi, AVi/d, and AVd were approximately the same, i.e., around 35, 10, and 55%, respectively (Table I, rows 2, 3, and 4). By normalizing the fusion frequencies according to these values, we found a fusion preference of endocytic vesicles equal for AVi and AVi/d, but five to six times less for AVd (Table I, row 5). This clearly indicates that the preference of early AV as fusion partners for endocytic vesicles does not result from random encountering events, but rather may be governed by some specific recognition mechanism.
Figure 8.

AV types involved in FP+. The same FP+ data as used in Fig. 6 were classified according to the AV types.
As to the frequency of FP+ in the sections, at the 40-min time point we screened 200 cell profiles and encountered 90 AV+ (Fig. 4) in a total of ∼1,200 AV. Among these were 12 FP+. About the same number of FP lacking tracer was found at this time. Thus, the fusion frequency may be as much as one per 50 AV profiles observed. Considering the sampling limitations of the 50-nm thick sections, we took this as an indication that endosome–AV fusions are common events.
Discussion
The main achievements of our present study are a more detailed definition of AV stages than was possible before and the identification of the sites where the endocytic and autophagic pathways merge. Both contributions relied on a better morphological resolution in cryosections processed according to a recently improved technique (Liou et al., 1996).
Improved AV Morphology
In previous studies on autophagy, we took advantage of the differential resistance to proteolysis of two cytosolic enzymes, SOD and CAIII, to determine the sequence of AV formation in hepatocytes, using quantitative immunoEM. Those AV with a SOD/CAIII-labeling ratio similar to the cytosol were classified as AVi, those with a relatively high ratio, because of low CAIII and concentrated SOD, were termed AVd, while AVi/d took an intermediate position in CAIII/SOD ratio (Rabouille et al., 1993). Thus, CAIII rapidly disappears and SOD gradually accumulates in the maturation sequence AVi, AVi/d, and AVd. However, as in most cytochemical studies in plastic sections (Dunn 1990a ; Yokota et al., 1995), the morphology of the AV in the cryosections was unsatisfactory (see also Tooze et al., 1990; Liou et al., 1993; Fengsrud et al., 1995), which hampered further investigations on the possible interactions of the autophagic and endocytic degradative pathways. In previous studies, we used the so-called sucrose pick-up method (Tokuyasu, 1973), in which dry cryosections are retrieved from the cryotome knife by letting them adhere to a drop of nearly saturated sucrose. A systematic search for the factors that caused the structural damage as observed in AV indicated that the high surface tension of the sucrose induced most of the damage. This could be circumvented by adding surface tension–lowering (methyl cellulose) and/or lipid-stabilizing (uranyl acetate) compounds to the cryosection retrieval solution. A significantly improved preservation of vulnerable cell structures, like AV, Golgi complexes, and endosomes was achieved by that modified method (Liou et al., 1996).
With this improved technique, the periphery of AV is left intact, revealing the multimembranous envelope of AVi. In addition, we found that the empty cleft between the sequestering membrane of AVi and its content, as shown in most studies so far, contains a lipid-like material (Fig. 1 b; Liou et al., 1996). This may relate to observations on the enrichment of unsaturated fatty acids (Reunanen et al., 1985) and the deprivation of intramembrane particles in the wall of the AV (Punnonen et al., 1989). Most likely this material is derived from partial degradation of the multiple membranes or other membranes engulfed by the AV and suggests delivery of hydrolytic enzymes to AV as early as the AVi stage. This would be in accordance with our finding that AVi are capable of fusing with endosomes and lysosomes. The improved AV morphology allowed us to distinguish AVi, AVi/d, and AVd on morphological criteria. The immunolabeling characteristics for CAIII, SOD, and cathepsin D, as well as the SOD concentration ratios, were as described before (Rabouille et al., 1993).
Convergence of Autophagic and Endocytic Pathways
The notion that the autophagic and endocytic/degradative pathways interconnect stems from the work of Høyvik and colleagues (1987) and has been accepted widely. However, uncertainty remained on the precise site(s) where the pathways come together. Biochemical evidence for fusion of AV with the endosomal route at prelysosomal stage (Gordon and Seglen, 1988) found only limited support from morphological observations, which mostly indicated that late, degradative stages of autophagic structures are the most upstream sites in the autophagic route where the endocytotic route merges (Dunn, 1990b ; Lawrence and Brown, 1992; Yokota et al., 1995).
With the new cryosectioning technique, fusion profiles between autophagic and endocytic compartments, although not numerous, could easily be identified. Membrane continuities between tracer-containing endosomes and AV were considered to reflect fusion events. Two lines of evidence indicated that endocytosed gold tracer is delivered primarily to early AV. First, at early time points after the onset of endocytosis, <10% of tracer particles encountered in AV occurred in AVd. This increased to around 50% within the 45-min period that we studied. The particles contained in the AVi were often clustered at their periphery, reminiscent of delivery there. Second, when actual fusion profiles of AV and endocytic vesicles showing tracer (FP+) were quantitatively analyzed over 45 min of continuous uptake, FP+ including AVi prevailed with 60% of all FP+. The frequency of FP+ with either AV type did not change over time and averaged at ∼75% for AVi and AVi/d together. Only a minority of the FP+ occurred with AVd. Thus, all AV stages are capable of taking up endocytosed tracer. Morphometric measurements of volume and surface densities of AV types further indicated that AVi and AVi/d have at least a fivefold greater chance to fuse with endosomes than AVd. Usually we observed different AV types mixed together in the same cell region. Therefore, the fivefold preference is probably not due to some topographical advantage of the earliest AV stages for meeting endosomes, but rather suggests specific transport and recognition mechanisms.
Together, our data show that the autophagic and endocytic pathways merge in a multiport fashion with a main role for newly formed AV to fuse with endocytic structures. This is the first time that AVi have been shown to have this capacity. Even in a similar liver cell system, with BSA–gold complex as tracer, Lawrence and Brown (1992) did not find AVi as fusion partners for endosomes/lysosomes. Since AVi were similarly defined as multiple membrane bound, we reason that this inconsistency may be due to differences in the extent of profile search and/or their use of leupeptin, a cysteine proteinase inhibitor. The only other study concentrating on FP to our knowledge is that of Yokota et al. (1995), a study on liver cells in which the proliferation and autophagy of excess peroxisomes was enhanced by in vivo drug application. Fusion of endocytosed HRP-positive endosomes with peroxisome-containing AV was analyzed, both morphologically and in cell fractions. In contrast to our results, the authors found a clear preference of endosomes and lysosomes to fuse with late AV (92%). However, the morphological characterization of AV types was probably hampered by the enzyme cytochemical procedure and lack of sufficient morphological resolution. Together with prolonged drug treatment, this might have caused the apparent discrepancy.
In the present study, a solid systematical analysis of the endocytic compartments involved in fusion with AV was not feasible for two reasons. First, the endosomal system does not show a conspicuous morphological distinction between the various subcompartments. Second, we lack a reliable marker system, like SOD/CAIII for the autophagic route, allowing definition of endocytic subcompartments. The endosomal partners involved in FP+ were lucent VE of variable size and MVE. The relative contribution of these endosome types to the FP+ did not change with time of gold uptake. We observed FP+ already after 10 min of endocytosis, indicating that early stages of endosomes can fuse with AV. This is supported by our finding that ASGPR–positive endosomal vesicles were involved in FP+. The earliest timepoint of convergence between endosomes and AV reported so far was 30 min after uptake of HRP (Tooze et al., 1990; Punnonen et al., 1993). This discrepancy may be due to differences in the cell types studied or to insufficient morphology of autophagic compartments and FP in these earlier studies.
Acknowledgments
We thank René Scriwanek, Maurits Niekerk, and Tom van Rijn for excellent photographic assistance, Agnes Lee for correcting the manuscript, and Drs. Monica Fengsrud and Per Seglen (Oslo), Fred Meyer (Amsterdam), Catharine Rabouille, and Willem Stoorvogel (Utrecht) for constructive advice.
Abbreviations used in this paper
- +
indicates an endocytic tracer positive structure
- ASGP-R
asialoglycoprotein receptor
- AV
autophagic vacuole(s)
- AVd
degradative AV
- AVi
initial AV
- AVi/d
intermediate AV
- CAIII
carbonic anhydrase type III
- DMEM
Dulbecco's minimal essential medium
- FP
fusion profile(s)
- LGP-120
lysosomal glycoprotein
- MPR
manose-6-phosphate receptor(s)
- MU
methyl cellulose–uranyl acetate mixure
- MVE
multivesicular endosome(s)
- PVP
polyvinylpyrrolidone
- SOD
CuZn superoxide dismutase
- VE
vesicular endosome(s)
Footnotes
The present work was made possible by a three-year research fellowship from the National Science Council, Republic of China in Taiwan, and a study grant from the Chang Gung College of Medicine and Technology to W. Liou.
Address all correspondence to Jan W. Slot, Department of Cell Biology, AZU H02.314, Heidelberglaan 100, 3584 CX Utrecht, The Netherlands. Tel.: (31) 30 2506543. Fax: (31) 30 2541797. E-mail: J.W.Slot@LAB. AZU.NL
References
- Aristila AU, Trump BF. Studies on cellular autophagocytosis. The formation of autophagic vacuoles in the liver after glucagon administration. Am J Pathol. 1968;53:687–733. [PMC free article] [PubMed] [Google Scholar]
- Dunn WA., Jr Studies on the mechanism of autophagy: formation of the autophagic vacuole. J Cell Biol. 1990a;110:1923–1933. doi: 10.1083/jcb.110.6.1923. [DOI] [PMC free article] [PubMed] [Google Scholar]
- Dunn WA., Jr Studies on the mechanism of autophagy: maturation of the autophagic vacuole. J Cell Biol. 1990b;110:1935–1945. doi: 10.1083/jcb.110.6.1935. [DOI] [PMC free article] [PubMed] [Google Scholar]
- Dunn WA., Jr Autophagy and related mechanisms of lysosome-mediated protein degradation. Trends Cell Biol. 1994;4:139–143. doi: 10.1016/0962-8924(94)90069-8. [DOI] [PubMed] [Google Scholar]
- Fengsrud M, Ross N, Berg T, Liou W, Slot JW, Seglen PO. Ultrastructural and immunocytochemical characterization of autophagic vacuoles in isolated hepatocytes: effects of vinblastine and asparagine on vacuole distributions. Exp Cell Res. 1995;221:504–519. doi: 10.1006/excr.1995.1402. [DOI] [PubMed] [Google Scholar]
- Geelen MJH, Beynen AC, Christiansen RZ, Lepreau-Jose MJ, Gibson DM. Short-term effects of insulin and glucagon on lipid synthesis in isolated rat hepatocytes. FEBS Lett. 1978;95:326–330. doi: 10.1016/0014-5793(78)81022-9. [DOI] [PubMed] [Google Scholar]
- Geuze HJ, Slot JW, Strous GJAM, Lodish HF, Schwartz AL. Intracellular site of asialoglycoprotein receptor-ligand uncoupling: doublelabel immunoelectron microscopy during receptor-mediated endocytosis. Cell. 1983;32:277–287. doi: 10.1016/0092-8674(83)90518-4. [DOI] [PubMed] [Google Scholar]
- Geuze HJ, Stoorvogel W, Strous GJ, Slot JW, Bleekemolen JE, Mellman I. Sorting of mannose 6-phosphate receptors and lysosomal membrane proteins in endocytic vesicles. J Cell Biol. 1988;107:2491–2501. doi: 10.1083/jcb.107.6.2491. [DOI] [PMC free article] [PubMed] [Google Scholar]
- Gordon PB, Seglen PO. Prelysosomal convergence of autophagic and endocytic pathways. Biophys Res Commun. 1988;151:40–47. doi: 10.1016/0006-291x(88)90556-6. [DOI] [PubMed] [Google Scholar]
- Høyvik H, Gordon PB, Seglen PO. Convergence of autophagic and endocytic pathways at the level of the lysosome. Biochem Soc Trans. 1987;15:964–965. [Google Scholar]
- Lawrence BP, Brown WJ. Autophagic vacuoles rapidly fuse with preexisting lysosomes in cultured hepatocytes. J Cell Sci. 1992;102:515–526. doi: 10.1242/jcs.102.3.515. [DOI] [PubMed] [Google Scholar]
- Liou W, Chang L-Y, Geuze HJ, Strous GJ, Crapo JD, Slot JW. Distribution of Cu Zn superoxide dismutase in rat liver. Free Radical Biol Med. 1993;14:201–207. doi: 10.1016/0891-5849(93)90011-i. [DOI] [PubMed] [Google Scholar]
- Liou W, Geuze HJ, Slot JW. Improving structural integrity of cryosections for immunogold labeling. Histochem Cell Biol. 1996;106:41–58. doi: 10.1007/BF02473201. [DOI] [PubMed] [Google Scholar]
- Punnonen E-L, Pihakaski K, Mattila K, Lounatmaa K, Hirsimäki P. Intramembrane particles and filipin labelling on the membranes of autophagic vacuoles and lysosomes in mouse liver. Cell Tissue Res. 1989;258:269–276. doi: 10.1007/BF00239447. [DOI] [PubMed] [Google Scholar]
- Punnonen E-L, Autio S, Marjomäki VS, Reunanen H. Autophagy, cathepsin L transport, and acidification in cultured rat fibroblasts. J Histochem Cytochem. 1992;40:1579–1587. doi: 10.1177/40.10.1326577. [DOI] [PubMed] [Google Scholar]
- Punnonen E-L, Autio S, Kaija H, Reunanen H. Autophagic vacuoles fuse with the prelysosomal compartment in cultured rat fibroblasts. Eur J Cell Biol. 1993;61:54–66. [PubMed] [Google Scholar]
- Rabouille C, Strous GJ, Crapo JD, Geuze HJ, Slot JW. The differential degradation of two cytosolic proteins as a tool to monitor autophagy in hepatocytes by immunocytochemistry. J Cell Biol. 1993;120:897–908. doi: 10.1083/jcb.120.4.897. [DOI] [PMC free article] [PubMed] [Google Scholar]
- Reunanen H, Punnonen E-L, Hirsimäki P. Studies on vinblastineinduced autophagocytosis in mouse liver. V. A cytochemical study on the origin of membranes. Histochemistry. 1985;83:513–517. doi: 10.1007/BF00492453. [DOI] [PubMed] [Google Scholar]
- Roth J, Bendayan M, Orci L. Ultrastructural localization of intracellular antigens by the use of protein A-gold complex. J Histochem Cytochem. 1978;26:1074–1081. doi: 10.1177/26.12.366014. [DOI] [PubMed] [Google Scholar]
- Seglen PO. Preparation of isolated rat liver cells. Methods Cell Biol. 1976;13:29–83. doi: 10.1016/s0091-679x(08)61797-5. [DOI] [PubMed] [Google Scholar]
- Seglen, P.O. 1987. Regulation of autophagic protein degradation in isolated liver cells. In Lysosomes: Their Role in Protein Breakdown. H. Glaumann and F.J. Ballard, editors. Academic Press, London. 369–414.
- Slot JW, Geuze HJ. A new method of preparing gold probes for multiple-labeling cytochemistry. Eur J Cell Biol. 1985;38:87–93. [PubMed] [Google Scholar]
- Small JV, Celis JE. Filament arrangements in negatively stained cultured cells: the organization of actin. Eur J Cell Biol. 1978;16:308–325. [PubMed] [Google Scholar]
- Stømhaug PE, Seglen PO. Evidence for acidity of prelysosomal autophagic/endocytic vacuoles (amphisomes) Biochem J. 1993;291:115–121. doi: 10.1042/bj2910115. [DOI] [PMC free article] [PubMed] [Google Scholar]
- Tokuyasu KT. A technique for ultracryotomy of cell suspensions and tissues. J Cell Biol. 1973;57:551–565. doi: 10.1083/jcb.57.2.551. [DOI] [PMC free article] [PubMed] [Google Scholar]
- Tooze J, Hollinshead M, Ludwig T, Howell K, Hoflack B, Kern H. In exocrine pancreas, the basolateral endocytic pathway converges with the autophagic pathway immediately after the early endosome. J Cell Biol. 1990;111:329–345. doi: 10.1083/jcb.111.2.329. [DOI] [PMC free article] [PubMed] [Google Scholar]
- Weibel ER. Stereological principles for morphometry in electron microscopic cytology. Int Rev Cytol. 1969;26:235–302. doi: 10.1016/s0074-7696(08)61637-x. [DOI] [PubMed] [Google Scholar]
- Yokota S, Himeno M, Kato K. Formation of autophagosomes during degradation of excess peroxisomes induced by di-(2-ethylhexyl)-phthalate treatment. III. Fusion of early autophagosomes with lysosomal compartments. Eur J Cell Biol. 1995;66:15–24. [PubMed] [Google Scholar]