Abstract
We describe a method allowing quantitative determination of the interaction range and association rate of individual surface-attached molecules. Spherical beads (1.4 μm radius) were coated with recombinant outer domains of the newly described classical type II cadherin 11, a cell adhesion molecule. Beads were driven along cadherin-coated surfaces with a hydrodynamic force of ≈1 pN, i.e., much less than the mechanical strength of many ligand-receptor bonds. Spheres displayed periods of slow motion interspersed with arrests of various duration. Particle position was monitored with 50 Hz frequency and 0.025 μm accuracy. Nearly 1 million positions were recorded and processed. Comparison between experimental and computer-simulated trajectories suggested that velocity fluctuations might be related quantitatively to Brownian motion perpendicular to the surface. The expected amplitude of this motion was of order of 100 nm. Theoretical analysis of the relationship between sphere acceleration and velocity allowed simultaneous determination of the wall shear rate and van der Waals attraction between spheres and surface. The Hamaker constant was estimated at 2.9 × 10⁻²³ J. The frequency of bond formation was then determined as a function of sphere velocity. Experimental data were consistent with the view that the rate of association between a pair of adhesion molecules was ≈1.2 × 10⁻³ s−1 and the interaction range was ≈10 nm. It is concluded that the presented methodology allows sensitive measurement of sphere-to-surface interactions (with ≈10 fN sensitivity) as well as the effective range and rate of bond formation between individual adhesion molecules.
Many authors studied the lifetime and force dependence of association between surface-bound molecules, using hydrodynamic flow (1–5), atomic force microscopy (6–8), or soft vesicle manipulation (9–10). However, there is no well established method for measuring the rate and distance dependence of bond formation between surface-attached molecules. Hinterdorfer et al. (11) reported on the frequency of bond formation between antibody-coated atomic force microscope tips and albumin-coated surfaces. They estimated the association constant at ≈5 × 10⁴ M−1 s−1. Dustin et al. (12, 13) monitored the concentration of fluorescence molecules in the region of contact between cells expressing rat or human CD2 receptors and planar lipid bilayers containing mobile fluorescent ligands. They derived two-dimensional affinity constants with a clever modification of Scatchard plots (13). Pierres et al. (14) studied the rate of bond formation between CD2-derivatized surfaces and flowing spheres coated with CD48, a ligand for CD2. They tentatively estimated at 0.03 s−1 the rate of association between individual molecules at 10-nm distance. However, as acknowledged by the authors, the significance of this estimate was hampered by a lack of account of thermal fluctuations responsible for variations of sphere-to-surface distance.
The aim of the present work was to determine the distance dependence of the association rate of bound adhesion molecules. Recombinant cadherin molecules (15) were used as an important example of homotypic adhesion receptors. Molecularly smooth mica surfaces were coated with hexahistidine-tagged two-domain moieties of the recently characterized cadherin 11 molecule (16). These sheets were then used as the floor of a laminar flow chamber in which cadherin-coated spheres were driven with a hydrodynamic force of ≈1 pN, i.e., much less than the mechanical strength of many ligand-receptor bonds (1–11). A computer-assisted procedure was used to track particles with respective spatial and temporal resolution of 0.025 μm and 20 ms. Approximately 106 positions were recorded. First, experimental values of free particle acceleration were plotted vs. particle velocity, yielding excellent agreement with computer-generated curves. This plot allowed to derive both the local shear rate and Hamaker constant for the interaction between spheres and surface. Then the frequency of bond formation was plotted vs. particle velocity. Comparison with calculated curves generated by analysis of simulated trajectories yielded a quantitative estimate of the absolute range and frequency of bond formation between surface-attached cadherin molecules. Thus, the presented methodology allows quantitative determination of bonding probability and femtoforce interactions between surfaces separated by nanometer distances.
METHODS
Molecules.
The cDNA of mouse cadherin 11 (17) was kindly provided by R. Balling (Institut fur Saugetier-Genetik, Oberschleis-Sheim, Germany). The cDNA was used as a template for PCR amplification of DNA fragments coding for the first two domains designated as EC1–2 of cadherin 11. The decision on domain boundaries was guided by the assignment of repeats in the cadherin 11 sequence obtained from SwissProt Data Base (CAD11 mouse, accession no. 2119631). The amplified product of cadherin 11 EC1–2 was cloned in a pQE60 expression vector (Qiagen, France) containing a sequence encoding for a stretch of six histidines downstream of the cloning site used. From this expression vector, a 229-aa polypeptide was produced. The recombinant cadherin 11 fragment corresponding to the N-terminal cadherin motives EC1 and EC2 and tagged with C-terminal hexahistidine was overexpressed in Escherichia coli XL1 blue cells and purified on Ni-nitrilotriacetic acid-Sepharose beads. The recombinant protein was released from the beads with 0.25 M imidazole, and the purity of protein preparations was checked on Coomassie blue-stained SDS-polyacrylamide gels.
Surfaces.
Streptavidin-coated beads (2.8 μm diameter and 1,300 kg/m3 density; Dynabeads M280) were from Dynal. They were coated with biotinylated rat anti-mouse Ig mAb (PharMingen) and then coated with mouse anti-hexahistidine mAb (clone 13/45/31, DIA 900, Dianova, Hamburg, Germany) and recombinant molecules made of the outer two domains of cadherin 11 tagged with an hexahistidine moiety (referred to as EC1–2). Previous quantitative fluorescence determinations showed that the beads could adsorb ≈1,730 molecules of biotinylated Ig per μm2 (18). Freshly cleaved mica surfaces (Muskovite mica, Metafix, Montdidier, France) were coated with adhesion molecules as described (19) by incubation with 1 mM NiCl2 (Merck) and then with hexahistidine tagged EC1–2.
Flow Chamber.
We used a modification of a previously described apparatus. Mica surfaces were pressed (with a screwed steel plate) against a drilled plexiglas block bearing a cavity of 0.1 × 6 × 20 mm3 surrounded by a toric gasket (Satim, Evenos, France). The chamber was set on the stage of an inverted microscope (IX, Olympus, France) equipped with a long distance 40X dry objective (Olympus, n.a. 0.55) and a CCD camera (SPT-M 108CE, Sony, Tokyo) connected to a videotimer (VTG 33, Mussetta, Marseille) and a videotape recorder for delayed analysis. In a typical experiment, 2 ml of bead suspension (3 × 10⁶/ml) were driven through the chamber with a wall shear rate between 10 and 20 s−1. The suspending medium was PBS (pH 7.2) supplemented with 1 mg/ml bovine albumin (Sigma).
Determination of Particle Trajectories and Processing of Experimental Data.
The basis of our method was previously described (5). In brief, an image-processing system allowed particle tracking with 50 Hz frequency and 0.025 μm spatial accuracy. The particle velocity at any time was calculated as the mean velocity during the 160-ms period preceding this time. Further, the mean acceleration at any position was calculated with the following formula:
 |
1 |
 |
Data Analysis and Computer Simulation.
Under our experimental conditions, the Reynold’s number estimated for studied spheres of radius 1.4 μm and typical velocities of ≈20 μm/s was <10−4, thus allowing to view the motion as a linear combination of four simple processes.
1. Displacement Generated by the Shear Flow.
The motion of a neutrally buoyant sphere near a plane surface in a laminar shear flow was described by Goldman et al. (20). The sphere velocity U vanishes very slowly when the width δ of the gap between the sphere and the plane surface approaches zero. Further, if the wall shear rate G and sphere radius a are known, the dimensionless ratio δ/a can be derived from U/aG. As previously shown (14), under our experimental conditions, δ can be determined with a relative error of ≈50%, 20%, and 15% when its absolute value is 1.2, 26.5, and 63.7 nm, respectively. Numerical data reported by Goldman et al. (20) were approximated with the following cubic approximation:
 |
2 |
 |
2. Sedimentation.
Spheres are subjected to a sedimentation force (i.e., weight minus Archimedes force) of ≈34 fN. The sedimentation velocity at high distance from the surface would be 1280 nm/s in a medium of 0.001 Pa × second viscosity, such as water. However, near the chamber floor, the viscous drag generated by any motion perpendicular to the surface is increased by a factor Fz* as compared with Stoke’s force. Combining numerical results from Brenner (21) and a simple approximation from Dimitrov (22), we used the following approximate expression for Fz*:
 |
3 |
 |
As an example, at high distance from the chamber floor, a particle is expected to fall by 0.20 μm during a time interval of 160 ms. The corresponding velocity change is 2 μm/s if the wall shear rate G is 10 s−1, which is easily detectable with our apparatus. When δ decreases, Fz* is expected to increase as (a/δ) (22).
3. Brownian Motion.
Spheres also are expected to display Brownian motion: at high distance from the surface, the diffusion coefficient D is simply kT/6πμa (where k is Boltzmann’s constant, T the absolute temperature, and μ the medium viscosity), yielding a numerical value of 1.57 × 10⁻¹³ m2/s. The mean displacement (2 Dt)1/2 along any direction during a time interval t of 160 ms is 224 nm. However, near a plane surface, the effective diffusion coefficient is divided by a factor Fz* and Fx* along directions perpendicular and parallel to the plane respectively. Using Goldman’s results (20), we approximated Fx* with the following formula:
 |
4 |
 |
Because the concentration c(x, t) at time t and point x of a population of particles diffusing along Ox and concentrated at point x = 0 at time zero is:
 |
5 |
The random displacement along Ox of a Brownian particle during a time interval t of the order of 1 ms or more (i.e., much higher than correlation time of Brownian fluctuations) was simulated as the product between (2Dt)1/2 and a normally distributed random variable. The diffusion coefficient perpendicular and parallel to the chamber wall was respectively D/Fz* and D/Fx*.
4. Electrodynamic Interaction.
The numerical value of particle velocities was indicative of a gap δ of order of several tens of nanometers. Because experiments were performed in concentrated ionic solution (Debye Hückel length was ≈0.8 nm), electrostatic repulsion was considered as negligible as compared with London attraction. Using Derjaguin approximation, the attraction between a sphere of radius a and a semi-infinite medium at distance δ can be approximated as (23):
 |
6 |
where A is the Hamaker constant. Constant A between two material bodies embedded in water is often of the order of 10−20 J, yielding a force of ≈233 fN as 10-nm separation. Electrodynamic interaction might thus strongly influence the sedimentation of flowing spheres.
Simulated particles trajectories were obtained by adding the contributions of the above four processes and dividing the motion in time intervals of 1.6 ms each where parameters Fx* and Fz* were considered as constant. A strong repulsive barrier at 1-nm separation was added to ensure that the gap δ remain in the range of validity of Eqs. 3 and 4.
Binding Rate.
The following model was used: the rate of association between individual molecules anchored at two points separated by a distance d was written as kon when d was lower than a threshold range R, and zero at higher distance. Thus, the probability that a receptor at distance z from the cadherin-coated mica surface became bound during a time interval dt was
 |
7 |
where ρ1 is the binding site density on the mica surface. Thus, the probability that a bond occurred during time dt between the surface and a sphere of radius a coated with a receptor density ρ2 and separated from the plane by a distance δ is
 |
8 |
 |
The probability of bond formation between moving spheres and the surface between a time interval dt was then determined by summation of dt × (2/3 − δ/R + (δ/R)3/3) during sequential time intervals of 1.6 ms. This yielded a “corrected time” that might be plotted vs. average particle velocity for different values of the range R.
RESULTS
Main Features of Particle Motion.
The motion of cadherin-coated spheres moving along cadherin-derivatized surfaces in the flow chamber was studied. Three characteristic patterns were observed:
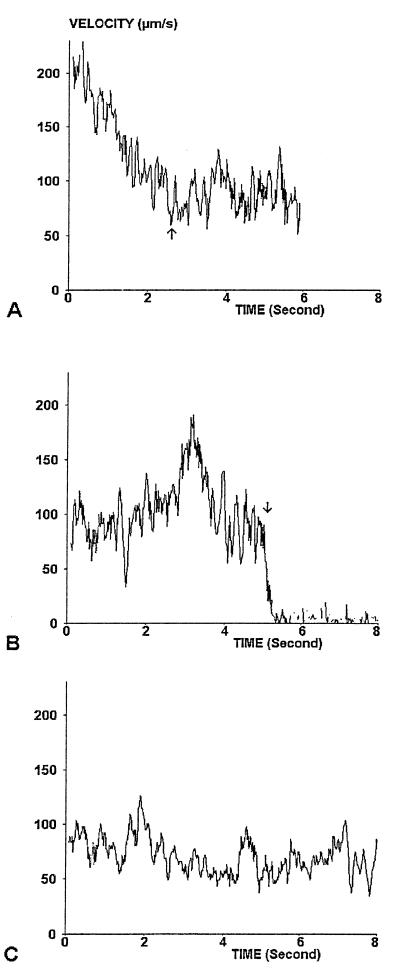
(i) A minority of particles exhibited rather high velocity with average negative acceleration superimposed on velocity fluctuations (see first part of the trajectory displayed on Fig. 1A). This pattern was strongly suggestive of incompletely sedimented particles that slowed down while they approached the chamber floor.
Figure 1.
Sample trajectories. Actual (A and B) or simulated (C) trajectories are shown. (A) The motion of a particle that entered the observation field with high velocity and displayed progressive slowing (until arrow) before displaying velocity fluctuations around a constant value. (B) The motion of a particle that displayed a typical binding event (arrow) resulting in immediate stop. (A) Simulated trajectory that was qualitatively similar to the motion of real particles.
(ii) Most particles exhibited fairly slow motion. Average acceleration was zero, but definite velocity fluctuations were clearly apparent on velocity plots (see second part of the trajectory displayed on Fig. 1A). That velocity fluctuations were caused by Brownian motion was suggested by the qualitative similarity between experimental data (Fig. 1 A and B) and simulated plots (Fig. 1C).
(iii) In some cases, spheres exhibited sharp arrests of widely varying duration (Fig. 1B). In a series of 159 arrests, the duration ranged from 0.08 to 4.82 s (median 0.32 s). Note that the velocity fluctuations appeared negligible on arrested spheres (see right side of Fig. 1B). Most of these arrests seemed caused by cadherin–cadherin interactions because the arrest frequency dropped by a factor of 5 (from 0.01–0.02 arrest/μm to 0.002–004 arrest/μm) when the chamber floor was not coated with cadherin (see below) or when calcium was removed (because cadherin–cadherin interactions are known to be calcium-dependent).
Experimental Determination of the Wall Shear Rate and Hamaker Constant Can Be Achieved by Analyzing Particle Acceleration.
The basis of our method consisted of using the experimental relationship between particle velocity and arrest frequency and theoretical relationship between particle velocity (U) and distance to the wall (δ) to derive a quantitative expression of the distance dependence of binding frequency. It became rapidly obvious that a practical completion of this scheme required knowing the wall shear rate G with high accuracy. Indeed, when the sphere to surface gap increases from 7 to 25 nm, the theoretical ratio U/G increases by only 17% (i.e., from ≈0.48 to 0.56). However, when experiments were repeated with identical flow rate, the mean particle velocity varied by at least 20% (the reasons for these variations will be discussed below). Because in our hands optical methods proved insufficiently accurate to measure bead-to-particle distance on any region of the observation field (24), we devised a quantitative method of deriving the wall shear rate from motion analysis. The basic idea consisted of considering the experimental relationship between average acceleration and velocity.
Experimental Curves.
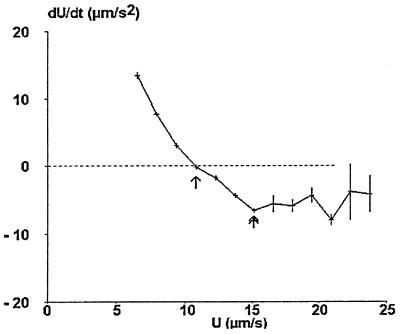
A typical plot is displayed on Fig. 2. This was obtained by pooling ≈20,000 experimental determinations of velocity and acceleration. The main features of this curve are as follows:
Figure 2.
Velocity dependence of mean particle acceleration (actual curve). A representative series of particle trajectories was used to determine the mean particle acceleration and velocity at ≈22,000 positions. Mean values are shown. Vertical bar length is twice the SEM. The curve allows accurate determination of the velocity U0 corresponding to zero average acceleration (arrow). A clearcut minimum of the acceleration was reproducibly found in the interval [U0, 1.5 U0] (double arrow).
At low velocity (5–10 μm/s), particle acceleration is positive and decreases when velocity increases. Interestingly, measured values are quite reproducible, as reflected by the low size of error bars. A qualitative interpretation would be that thermal fluctuations are damped by hydrodynamic forces near the wall. Further, particles are expected to increase their velocity if their distance to the wall is lower than some equilibrium value that might be of order of kT/P, where k is Boltzmann’s constant, T is the absolute temperature, and P is the sedimentation force.
The point where the mean acceleration is zero (Fig. 2, arrow) may be determined with fairly high accuracy because of the slope of the curve and low error. This feature is useful because the ratio between the velocity at this point (U0) and the shear rate G is expected to be a constant, independent of G.
A minimum of the acceleration was reproducibly detected in the velocity range [U0, 1.5 U0] (Fig. 2, double arrow).
At higher velocity (U > 15 μm/s), the particle acceleration was negative with wide variations as reflected by the length of error bars. This was likely caused by sedimentation at high distance from the wall, combined with Brownian motion.
Computer Simulation.
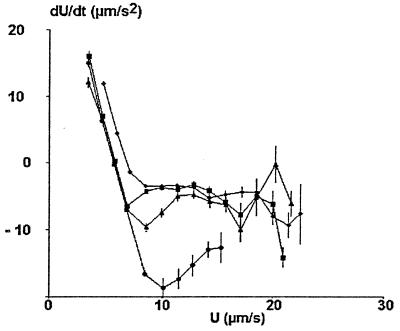
As shown on Fig. 3 (Upper curve, diamonds), computer simulation yielded an acceleration plots quite similar to experimental ones. However, the local minimum exemplified on Fig. 2 could not be reproduced unless van der Waals attraction was considered. As shown on Fig. 3, the depth of the minimum was highly dependent on the Hamaker constant A, whereas velocity U0 displayed only moderate variation when A was varied between 0 and 10−20 J. It was checked that the overall shape of acceleration curves was essentially unaffected when the shear rate was varied between 10 and 30 s−1 (not shown).
Figure 3.
Velocity dependence of mean particle acceleration (simulated curves). Series of ≈60 simulated trajectories (800 positions each) were generated with a Hamaker constant of 0 (diamonds), 10−22 (squares), 10−21 (triangles), or 10−20 (circles) J and a wall shear rate of 10 s−1. The mean acceleration was determined for 10–20 velocity groups and displayed vs. velocity (vertical bar length is twice the SEM). Remarkable points of the curve were the velocity U0 corresponding to zero value of dU/dt and the first minimum of dU/dt (in the interval [U0, 1.5 U0]). Note that the SEM is fairly low when U is lower than ≈1.5U0. This minimum exhibited a sharp decrease when the Hamaker constant increased.
Experimental Determination of G and A.
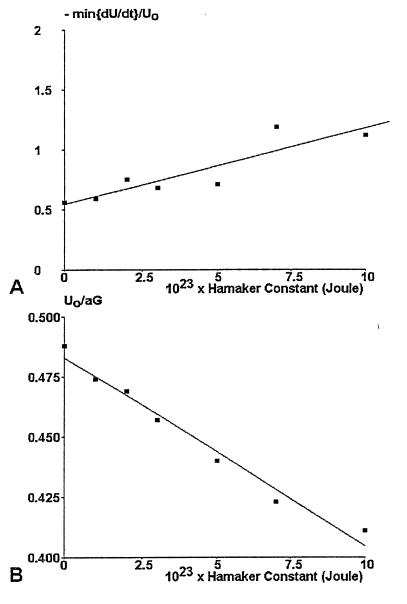
The following scheme was used: computer simulations were used to obtain regression lines for the dependence of Hamaker constant on (i) the local minimum of d(U/U0)/dt (Fig. 4A) and (ii) the dimensionless velocity U0/aG corresponding to zero acceleration (Fig. 4B). The experimental minimum of d(U/U0/dt) was 0.74 ± 0.058 (SEM, 27 curves), yielding an estimate of 2.9 × 10⁻²³ J for the Hamaker constant (with an estimated SE of 0.9 × 10⁻²³ J, i.e., 0.058 divided by the slope of the regression line). The shear rate G was then determined in each experiments. In some cases, the flow rate was changed by changing the flow rate during a single experiment, and it was checked that the calculated value of G was proportional to the flow rate (not shown).
Figure 4.
Use of trajectory analysis to determine the wall shear rate and Hamaker constant. Seven series of simulated trajectories (48,000 positions each) were generated for a constant shear rate of 10 s−1 and different values of the Hamaker constant. The velocity U0 at zero acceleration and the minimum value of d[U/U0] in the velocity interval [U0, 1.5 U0] were determined and plotted vs. Hamaker constant. These curves were used to determine first the Hamaker constant (A) and second the wall shear rate (B).
Determination of the Range and Rate of Association Between Spheres and Surfaces.
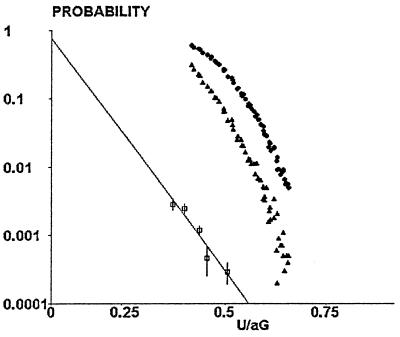
An experimental plot of the variations of the binding probability vs. U/aG was obtained by pooling data obtained in 10 independent experiments and grouping values of U/aG in classes of 0.04 width, starting from 0.36. As shown on Fig. 5, a fairly linear dependence was found between U/aG and the logarithm of binding probability. Simulated binding curves were then constructed for different a priori values of the binding range, using the experimental value of the Hamaker constant. The slope of the binding curve varied from 1.10 to 0.614 when the range was varied from 5 to 40 nm. Fitting experimental and simulated binding curves yielded an adjusted range of 10 nm and binding frequency of 1.2 × 10⁻³ s−1.
Figure 5.
Determination of the range and rate of association between surface-bound molecules. Simulated curves were used to determine the relationship between particle mean velocity (in a 0.16-s interval) and corrected time passed within binding distance with respect to the chamber floor. Typical curves are shown for 5 nm (triangles) and 40 nm (circles) range. Squares represent experimental values of the binding frequency of cadherin-coated particles moving along cadherin-coated surfaces.
The Binding Probability Is Linearly Dependent on the Surface Density of Cadherin Sites.
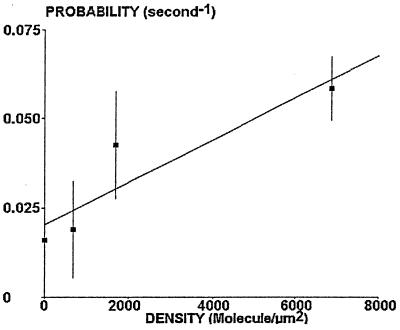
A possible check of our theoretical binding model was to test the dependence of the binding probability on the site density. This was performed by varying the density of EC1–2 molecules between 0 and 6,800 sites/μm2. The binding probability was determined for particles with U/aG ranging between 0.43 and 0.47: as shown on Fig. 6, results were consistent with the prediction of a linear relationship (Eqs. 8 and 9).
Figure 6.
Concentration dependence of binding frequency. Cadherin-coated spheres were driven along surfaces coated with varying density of binding sites. The binding frequency was determined for a ratio U/aG of 0.45 ± 0.02. Mean values are shown (vertical bar length is twice the SEM). In accordance with our crude model, the binding frequency is linearly dependent on the density of binding sites.
DISCUSSION
Previous authors performed quantitative studies of cell adhesion under well defined flow conditions generated in a Couette viscometer (25), a traveling microtube (26), or a flow chamber (27). These experiments yielded useful information on binding efficiency and Hamaker constants. However, the methodology we described represents, to our knowledge, a unique reported way of studying both the range of interaction and binding rate of surface-attached molecules. Indeed, this method required an high amount of detailed positional information and quantitative treatment of Brownian motion. Before we discuss the significance of our results, some technical points deserve being considered.
First, our measurement revealed significant variation (≈20%) of the wall shear rate for a constant flow rate. This cannot be because of a spatial heterogeneity of the flow field because the design of our chamber allows to eliminate any variation of the location of the monitored field. Also, the syringe holder yielded quite stable flow. Microscopical check of the chamber depth suggested that height variations were mainly responsible for the variations of the shear rate. Indeed, a 10-μm height change may result in 20% variation of the shear rate. This amplitude of variation might easily occur with mica sheets or glass coverslips. Thus, quantitative check of the shear rate on the observed field is an essential part of the method.
Second, our method allowed very sensitive determination of electrodynamic interactions between spheres and surfaces. This is not very surprising because the sedimenting force exerted on particles was ≈34 fN. Therefore, a method based on the determination of the sedimentation rate should in principle allow femtonewton sensitivity. We should not be surprised by the low value of estimated Hamaker constant, i.e., 2.9 × 10⁻²³ J as compared with ≈5 × 10⁻²¹ J for phospholipid bilayer interaction in water (28). Indeed, the external parts of beads and mica surfaces must be considered as diluted protein solutions. Thus, if the thickness of the cadherin coating on mica is estimated at 4 nm (i.e., approximately one-half the length of extended molecules), the protein concentration of a layer of 6,470 molecules of approximate molecular weight 20,000 per μm2 is ≈54 g/liter. Using standard formulae, the Hamaker constant for the interaction between two regions containing 36.5 g/liter carbohydrates and 82.5 g/liter proteins was estimated at 10−22 J (23), and the Hamaker constant for the interaction between two solutions of 6 g/liter sugar was found to be ≈4 × 10⁻²³ J (29). Note that if the Hamaker constant had been neglected, the estimate for the binding range would have been 16 nm instead of 10 nm.
A third point concerns the effective binding range of molecular interactions. Although the order of magnitude of our estimate (i.e., 10 nm) is quite reasonable, the sum of the geometrical lengths of the binding structures is ≈48 nm (assuming a typical length of 4 nm for Ig or cadherin domains). There are two possible reasons for the lower experimental value. (i) Molecules may not be extended perpendicular to interacting surfaces. (ii) The streptavidin-binding sites on the sphere surface may be located below the hydrodynamic bead surface because these are stabilized by a fuzzy polymeric coat (whose structure is a property of the supplier). This fuzzy structure was clearly apparent on electron micrographs obtained by C. Foa, in our laboratory.
A fourth point concerns the structure of binding species: The active form of cadherin receptors might be homodimers, and association rates were reported (30–32). In this case, the estimate of the surface concentration of interacting receptors on spheres and mica should be decreased, resulting in proportional increase of estimated association rate. However, the quaternary structure of cadherin 11 has not been established yet ,and we do not know whether these cadherins dimerize spontaneously.
A last point is on the significance of the binding frequency we obtained. Our results suggest that the mean time of bond formation between two EC1–2 molecules maintained within binding range is ≈800 s. This suggests that this molecular species might efficiently induce homotypic adhesion between approaching membranes only if these membrane bore dense arrays of binding sites. Further work is required to determine whether biological evidence might support this hypothesis.
In conclusion, the methods we have described may yield new information on both binding range and intrinsic association rate of receptor-ligand couples. In addition, they may be used to quantify electrodynamic interactions and local shear rate in a flow chamber. Our aim is to compare the behavior of different species of adhesion molecules and assess the influence of their environment and motility on measured parameters.
Acknowledgments
This work was supported by a grant from the Centre National de la Recherche Scientifique (Action incitative Physique et Chimie du Vivant 2C0024) and Institut Curie.
Footnotes
This paper was submitted directly (Track II) to the Proceedings Office.
References
- 1.Tha S P, Shuster J, Goldsmith H L. Biophys J. 1986;50:1117–1126. doi: 10.1016/S0006-3495(86)83556-1. [DOI] [PMC free article] [PubMed] [Google Scholar]
- 2.Kaplanski G, Farnarier C, Tissot O, Pierres A, Benoliel A M, Alessi M C, Kaplanski S, Bongrand P. Biophys J. 1993;64:1922–1933. doi: 10.1016/S0006-3495(93)81563-7. [DOI] [PMC free article] [PubMed] [Google Scholar]
- 3.Alon R, Hammer D A, Springer T A. Nature (London) 1995;374:539–542. doi: 10.1038/374539a0. [DOI] [PubMed] [Google Scholar]
- 4.Tees D F J, Goldstmith H L. Biophys J. 1996;71:1102–1114. doi: 10.1016/S0006-3495(96)79312-8. [DOI] [PMC free article] [PubMed] [Google Scholar]
- 5.Pierres A, Benoliel A M, Bongrand P, van der Merwe P A. Proc Natl Acad Sci USA. 1996;93:15114–15118. doi: 10.1073/pnas.93.26.15114. [DOI] [PMC free article] [PubMed] [Google Scholar]
- 6.Florin E L, Moy V T, Gaub H E. Science. 1994;264:415–417. doi: 10.1126/science.8153628. [DOI] [PubMed] [Google Scholar]
- 7.Lee G U, Kidwell D A, Colton R J. Langmuir. 1994;10:354–357. [Google Scholar]
- 8.Dammer U, Popescu O, Wagner P, Anselmetti D, Güntherodt H J, Misevic G N. Science. 1995;267:1173–1175. doi: 10.1126/science.7855599. [DOI] [PubMed] [Google Scholar]
- 9.Evans E A, Berk D, Leung A. Biophys J. 1991;59:838–848. doi: 10.1016/S0006-3495(91)82296-2. [DOI] [PMC free article] [PubMed] [Google Scholar]
- 10.Merkel R, Ritchie K, Evans E. Biophys J. 1995;68:404. doi: 10.1016/S0006-3495(95)80441-8. (abstr.). [DOI] [PMC free article] [PubMed] [Google Scholar]
- 11.Hinterdorfer P, Baumgartner W, Gruber H J, Schilcher K, Schindler H. Proc Natl Acad Sci USA. 1996;93:3477–3481. doi: 10.1073/pnas.93.8.3477. [DOI] [PMC free article] [PubMed] [Google Scholar]
- 12.Dustin M L, Ferguson L M, Chan P Y, Springer T A, Golan D E. J Cell Biol. 1996;132:465–474. doi: 10.1083/jcb.132.3.465. [DOI] [PMC free article] [PubMed] [Google Scholar]
- 13.Dustin M L, Golan D E, Zhu D M, Miller J M, Meier W, Davies E A, van der Merwe P A. J Biol Chem. 1997;272:30889–30898. doi: 10.1074/jbc.272.49.30889. [DOI] [PubMed] [Google Scholar]
- 14.Pierres A, Benoliel A M, Bongrand P, van der Merwe P A. FEBS Lett. 1997;403:239–244. doi: 10.1016/s0014-5793(97)00060-4. [DOI] [PubMed] [Google Scholar]
- 15.Geiger B, Ayalon O. Annu Rev Cell Biol. 1992;8:307–332. doi: 10.1146/annurev.cb.08.110192.001515. [DOI] [PubMed] [Google Scholar]
- 16.Simonneau L, Kitagawa M, Suzuki S, Thiery J P. Cell Adhes Commun. 1995;3:115–130. doi: 10.3109/15419069509081281. [DOI] [PubMed] [Google Scholar]
- 17.Hoffmann I, Balling R. Dev Biol. 1995;169:337–346. doi: 10.1006/dbio.1995.1148. [DOI] [PubMed] [Google Scholar]
- 18.Pierres A, Benoliel A M, Bongrand P. J Biol Chem. 1995;270:26586–26592. doi: 10.1074/jbc.270.44.26586. [DOI] [PubMed] [Google Scholar]
- 19.Ill C R, Keivens V M, Hale J E, Nakamura K K, Jue R A, Cheng S, Melcher E D, Drake B, Smith M C. Biophys J. 1993;64:919–924. doi: 10.1016/S0006-3495(93)81452-8. [DOI] [PMC free article] [PubMed] [Google Scholar]
- 20.Goldman A J, Cox R G, Brenner H. Chem Eng Sci. 1967;22:653–660. [Google Scholar]
- 21.Brenner H. Chem Eng Sci. 1961;16:242–251. [Google Scholar]
- 22.Dimitrov D S. Prog Surf Sci. 1983;14:295–423. [Google Scholar]
- 23.Israelachvili J N. Intermolecular and Surface Forces. New York: Academic; 1991. pp. 288–311. [Google Scholar]
- 24.Pierres A, Benoliel A M, Bongrand P. J Phys III. 1996;6:807–824. [Google Scholar]
- 25.Curtis A S G. J Embryol Exp Morphol. 1969;23:305–325. [PubMed] [Google Scholar]
- 26.Goldsmith H L, Lichtarge O, Tessier-Lavigne M, Spain S. Biorheology. 1981;18:531–555. doi: 10.3233/bir-1981-183-617. [DOI] [PubMed] [Google Scholar]
- 27.Duszyk M, Karvalec M, Doroszewski J. Cell Biophys. 1986;8:131–139. doi: 10.1007/BF02788477. [DOI] [PubMed] [Google Scholar]
- 28.Bongrand P, Bell G I. In: Cell Surface Dynamics: Concepts and Models. Perelson A S, DeLisi C, Wiegel F W, editors. New York: Dekker; 1984. pp. 459–493. [Google Scholar]
- 29.Yu Z W, Calvert T L, Leckband D. Biochemistry. 1998;37:1540–1550. doi: 10.1021/bi971010o. [DOI] [PubMed] [Google Scholar]
- 30.Shapiro L, Fannon A M, Kwong P D, Thompson A, Lehmann M S, Grubel G, Legrand J F, Als-Nielsen J, Colman D R, Hendrickson W A. Nature (London) 1995;374:327–337. doi: 10.1038/374327a0. [DOI] [PubMed] [Google Scholar]
- 31.Nagar B, Overduin M, Ikura M, Rini J. Nature (London) 1996;380:360–364. doi: 10.1038/380360a0. [DOI] [PubMed] [Google Scholar]
- 32.Kock A W, Pokutta S, Lustig A, Engel J. Biochemistry. 1997;36:7697–7705. doi: 10.1021/bi9705624. [DOI] [PubMed] [Google Scholar]


