Abstract
We have determined the structural organization and dynamic behavior of actin filaments in entire primary locomoting heart fibroblasts by S1 decoration, serial section EM, and photoactivation of fluorescence. As expected, actin filaments in the lamellipodium of these cells have uniform polarity with barbed ends facing forward. In the lamella, cell body, and tail there are two observable types of actin filament organization. A less abundant type is located on the inner surface of the plasma membrane and is composed of short, overlapping actin bundles (0.25–2.5 μm) that repeatedly alternate in polarity from uniform barbed ends forward to uniform pointed ends forward. This type of organization is similar to the organization we show for actin filament bundles (stress fibers) in nonlocomoting cells (PtK2 cells) and to the known organization of muscle sarcomeres. The more abundant type of actin filament organization in locomoting heart fibroblasts is mostly ventrally located and is composed of long, overlapping bundles (average 13 μm, but can reach up to about 30 μm) which span the length of the cell. This more abundant type has a novel graded polarity organization. In each actin bundle, polarity gradually changes along the length of the bundle. Actual actin filament polarity at any given point in the bundle is determined by position in the cell; the closer to the front of the cell the more barbed ends of actin filaments face forward.
By photoactivation marking in locomoting heart fibroblasts, as expected in the lamellipodium, actin filaments flow rearward with respect to substrate. In the lamella, all marked and observed actin filaments remain stationary with respect to substrate as the fibroblast locomotes. In the cell body of locomoting fibroblasts there are two dynamic populations of actin filaments: one remains stationary and the other moves forward with respect to substrate at the rate of the cell body.
This is the first time that the structural organization and dynamics of actin filaments have been determined in an entire locomoting cell. The organization, dynamics, and relative abundance of graded polarity actin filament bundles have important implications for the generation of motile force during primary heart fibroblast locomotion.
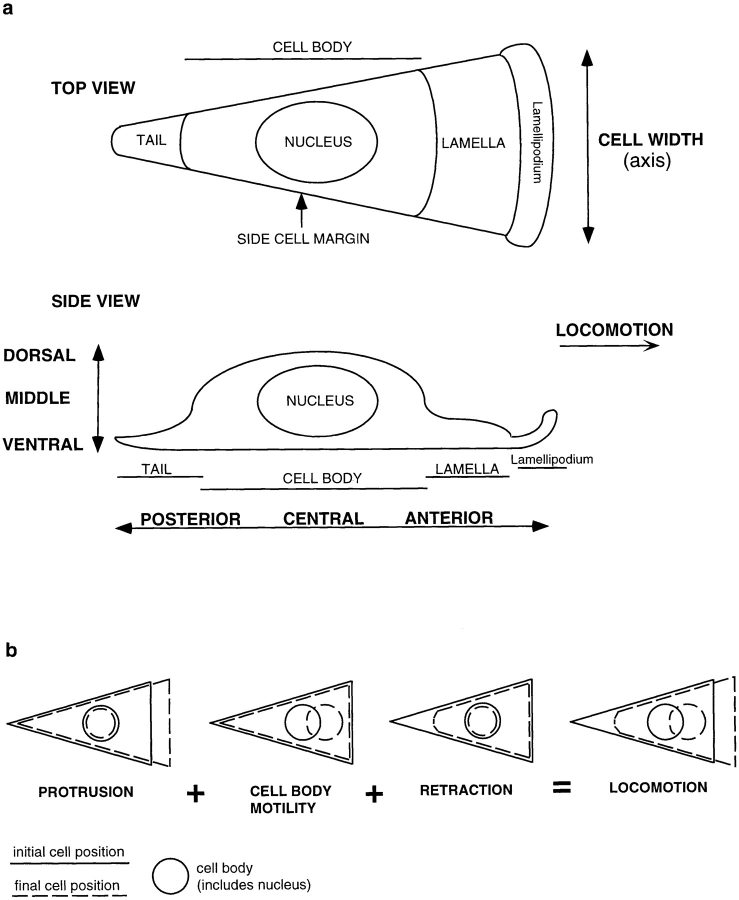
Cell locomotion plays a key role in the development and health of multicellular organisms. Many different types of individual locomoting cells are composed of morphologically distinct regions. These regions are the lamellipodium, lamella, cell body, and tail of the cell (see Fig. 1 a; Heath and Holifield, 1991; Harris, 1994). The lamellipodium and lamella are at the cell anterior. Historically the term lamellipodium was used to describe the tip of the lamella (Abercrombie, 1980). It has now become clear that the lamellipodium is mechanically and spatially distinct from the rest of the lamella. We note that this distinction is not always made in the literature. The loose term lamella is sometimes inaccurately used to describe the lamellipodium and vice versa. For this reason in our paper we wish to make it clear that the lamellipodium is a short, thin band at the extreme cell anterior. The lamella is located immediately behind the lamellipodium and is longer and of intermediate thickness. Behind the lamella, more centrally located is the largest and bulkiest region of the cell comprising the nucleus and most of the organelles. We term this region the cell body. The cell posterior is a rounded or drawn out tail. Very roughly, and varying from cell to cell, the cell body comprises about one half of the cell length and the lamella and tail the other half. The lamellipodium is only a few micrometers in length, <5% of the total cell length. During cell locomotion, as observed by time-lapse microscopy, the lamellipodium, cell body, and tail all move forward roughly with the same vector to a more anterior position. The lamella appears to stay in place as the cell body advances. Forward movement of these distinct cell regions can be tracked separately in the same locomoting cell and have characteristic properties (Heath and Holifield, 1991; Sheetz, 1994). For these reasons they are considered different types of cell motility and are termed lamellipodia protrusion, cell body motility (or traction), and tail retraction/deadhesion (see Fig. 1 b). The detailed mechanism of cell locomotion described by the combination of protrusion, cell body motility, and retraction is complex and poorly understood. It is widely accepted to be driven by activity of the actin cytoskeleton (Grebecki, 1994; Sheetz, 1994; Lauffenburger and Horwitz, 1996; Mitchison and Cramer, 1996).
Figure 1.
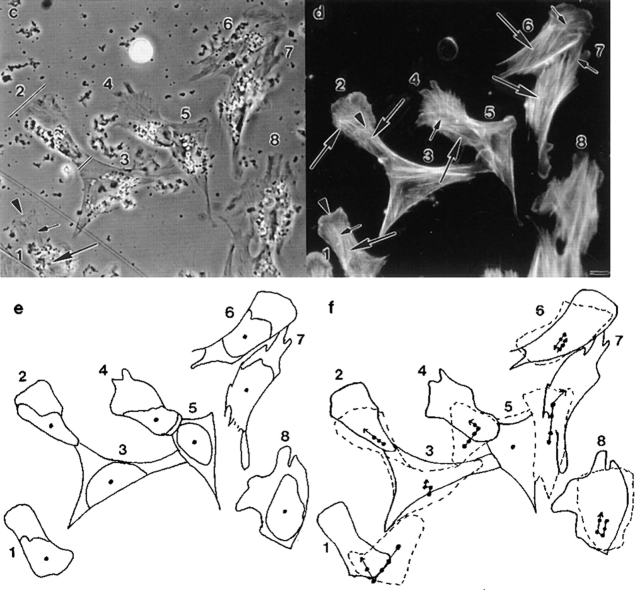
Locomotion analysis of chick heart fibroblasts and spatial orientation of actin filament bundles in the same cells. (a) Diagram of different cell regions and cell locations, in a locomoting cell, which we refer to in this paper (top diagram is a top view and bottom diagram a sideways view). For serial section EM the cells were cut parallel to the substrate from ventral to dorsal. (b) Diagram to illustrate the different types of cell motility that occur during cell locomotion. (c) Phase image of fixed locomoting cells that had previously been filmed. Cells were fixed immediately at the end of filming. Different cell regions are shown in cell 1, a highly polarized cell: lamellipodium (arrowhead), lamella (short arrow), cell body (long arrow) comprising the organelle rich region (above the long arrow), and the nucleus (below the long arrow). In cell 2, another highly polarized cell, the anterior of the cell (long bar) is broader than the posterior of the cell (short bar). (d) Phalloidin staining in the same cells: actin filaments in a lamellipodium (arrowhead, cell 1), longitudinal actin bundles in lamellae (short arrows, cells 1, 4, 6, and 7) and the cell body (long arrows, cells 1, 2, 4, 6, and 7), and a transverse actin bundle (arrowhead, cell 2). (e) Outline of cells and cell bodies of cells imaged in c. The dot is the approximate center of the cell body. (f) Live cell position at the beginning of filming (dashed line, 0 min). Live cell position 77 min later (solid line, same as fixed image shown in c and e). The dots are the approximate center of the cell body at intervals measured between 0–77 min, and the arrowhead (upper arrowhead for cell 6) is the position of the center of the cell body at 77 min. The joined dot-to-dot-to-arrowhead in each cell is the vector of cell body motility during cell locomotion. For cells 1, 2, 4, and 6–8 this vector defines the anterior–posterior axis. Cell 6 reversed back on itself through 180°C midway through the period of observation. Cells 1, 2, 4, and 6–8 are locomoting ∼0.5 μm/min. Bar, 10 μm.
Data collectively taken from a number of laboratories suggest that distinct actin-based motile forces in lamellipodia and the cell body, respectively, drive protrusion and cell body motility during cell locomotion (Cramer et al., 1994; Grebecki, 1994; Sheetz, 1994; Lauffenburger and Horwitz, 1996; Mitchison and Cramer, 1996). It is not known if a distinct force exists for tail retraction. Lamellipodia have been intensely studied over recent years, and the relative roles of actin filament polymerization and unconventional myosin activity in generating actin-based motile force in lamellipodia for protrusion are being tested in different systems (for review see Mitchison and Cramer, 1996). In contrast, the generation of actin-based motile force elsewhere in the cell to drive cell body motility and tail retraction has been less studied and is not well understood. This force is arguably more important for generating overall locomotion. While it is known that myosin II plays a role in cell body motility and tail retraction (Wessels et al., 1988; Doolittle et al., 1995; Jay et al, 1995) the mechanism is not understood at a molecular level. Part of the problem in understanding cell body motility and tail retraction is that in contrast to the lamellipodium, the structural organization of actin in the cell body and tail of a locomoting cell is unknown. This makes it difficult to determine, for example, in what direction myosin would generate force.
In lamellipodia, data on the structural organization of actin filaments and their polarity had important implications for the generation of motile force for protrusion (Small et al., 1978, 1995; Small, 1988). This information was essential for interpreting observed dynamic behavior of actin filaments in lamellipodia (Wang, 1985; Forscher and Smith, 1988; Okabe and Hirokawa, 1991; Theriot and Mitchison, 1991, 1992; Lin and Forscher, 1995; Lin et al., 1996). Similarly, determining the structural and dynamic properties of actin filaments in an entire locomoting cell would undoubtedly have important implications for the generation of motile force for cell body motility and perhaps for tail retraction. Also it would provide essential information about the organization of potential actin substrates for myosin in a locomoting cell.
We are interested in cell body motility and tail retraction during cell locomotion. In this paper we therefore set out to determine the ultrastructural organization, polarity, and dynamic behavior of actin filaments in entire primary locomoting fibroblasts from chick heart explants. We chose these cells because fibroblasts have provided one of the classic models for tissue cell locomotion (Abercrombie, 1980). Also, among primary cell types that locomote in culture, fibroblasts are one of the most amenable to experimental manipulation. When first explanted, heart fibroblasts locomote for ∼2 d in culture, with the most rapid locomotion occurring in the first day. After a few days of primary culture the cells then lose their polar morphology and stop locomoting (Couchman and Rees, 1979). We note that most or all established fibroblast cell lines resemble the latter, nonlocomoting phenotype and are thus poorly suited to studies of cell body motility. What information is there on actin filament organization in the lamella, cell body, and tail of locomoting heart fibroblasts? Actin filament bundles exist, but this has not been well documented. This is partly due to the use of anti-actin antibodies which recognize actin monomers in a diffuse pattern that may mask actin bundles and partly due to earlier indirect studies which relied on detection of a bundle by phase contrast or bright field microscopy. However it is clear to us from images presented in some of these studies that thin actin filament bundles of unknown identity exist in the lamella, cell body, and tail of locomoting heart fibroblasts (Couchman and Rees, 1979; see Fig. 18). Also later studies with phalloidin in a locomoting fibroblast cell model clearly show thin actin bundles of unknown identity in the cell body of the locomoting cell (Dunlevy and Couchman 1993; see Fig. 6 e). In contrast, in the established fibroblast cell lines, as well as in many other cell lines, and in primary cells grown for longer than a few days in culture, actin filament bundles in the lamella, cell body, and tail have been extensively documented. These actin filament bundles are termed stress fibers (for review see Byers et al., 1984). Whether stress fibers are related to the actin bundles in the lamella, cell body, and tail of locomoting fibroblasts or any other locomoting cell type has not previously been directly tested. However the possibility seems unlikely since activity of stress fibers is generally thought to prevent the cell from locomoting (Byers et al., 1984).
Figure 6.
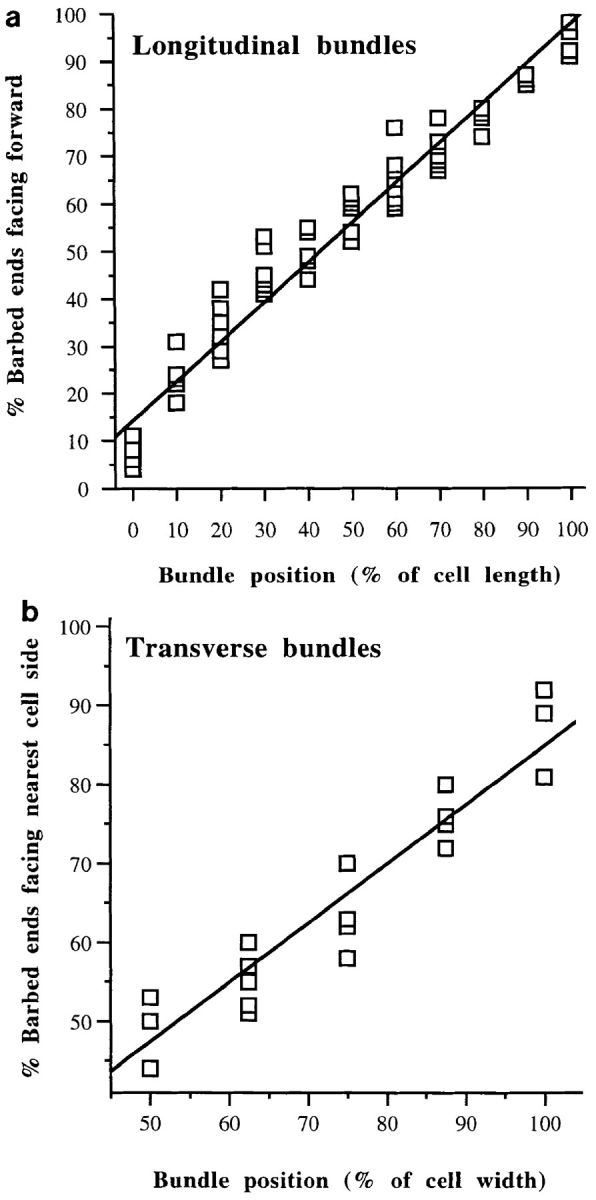
Average graded polarity of longitudinal and transverse actin filament bundles in individual locomoting chick heart fibroblasts as a function of cell position relative to the longest section of that cell. Average data for each individual cell are plotted on the same graph. (a, longitudinal actin bundles) Polarity of actin filaments in all ventral sections of individual cells. 0% is the tip of the tail, and 100% is in the lamellipodium (n = 12 cells; 742 bundle segments; 18, 905 filaments; r = 0.95). (b, transverse actin bundles) Polarity of actin filaments in ventral and middle locations across the width of cells (n = 6 cells; 141 bundle segments; 2, 354 filaments; r = 0.92).
From our ultrastructural and dynamic studies of actin filaments in locomoting heart fibroblasts we have identified a novel type of actin filament organization, the graded polarity actin bundle. We determined that the organization of graded polarity actin bundles in locomoting fibroblasts is distinct from the organization of stress fibers in a nonlocomoting established cell line (Potoroo tridactylis kidney [PtK2] cells)1. We suggest that graded polarity actin filament bundles play a role in the generation of motile force for cell body motility during heart fibroblast locomotion.
Materials and Methods
Primary Fibroblast and PtK2 Cell Culture
Locomoting fibroblasts were obtained from explants of heart tissue from 7- or 8-d-old chick embryos or similarly from embryonic or newborn rat or mouse. For structural studies we used chick explants, and for the other studies we mostly used chick but saw no difference in our data with rat or mouse explants. Explants were carefully placed under media onto glass or aclar (Ted Pella Inc., Redding, CA) coverslips coated with 1 mg/ml polyL-lysine (Sigma Chemical Co., St. Louis, MO) and 125 μg/ml matrigel (Collaborative Research, Inc., Bedford, MA). Explants were incubated in DME-H16 medium with 10% FCS and for the chick fibroblasts, 10% chick sera, streptomycin, and penicillin at 37°C in 5% CO2. Under these conditions fibroblasts will start locomoting away from the explants within 12 h. We did our experiments within 12–20 h, as we detemined that this was the optimal time for enough cells to have locomoted away from the explant for an experiment but before the cells had lost their rapidly locomoting phenotype. For live cell experiments in Fig. 9 we determined the rate of cell body motility by tracking either the displacement of the nucleus or the distinct boundary between the lamella and cell body. We found this to be an efficient method for measuring a large number of cells and in some cells verified that it was the same or very similar to centroid displacement of the cell body.
Figure 9.

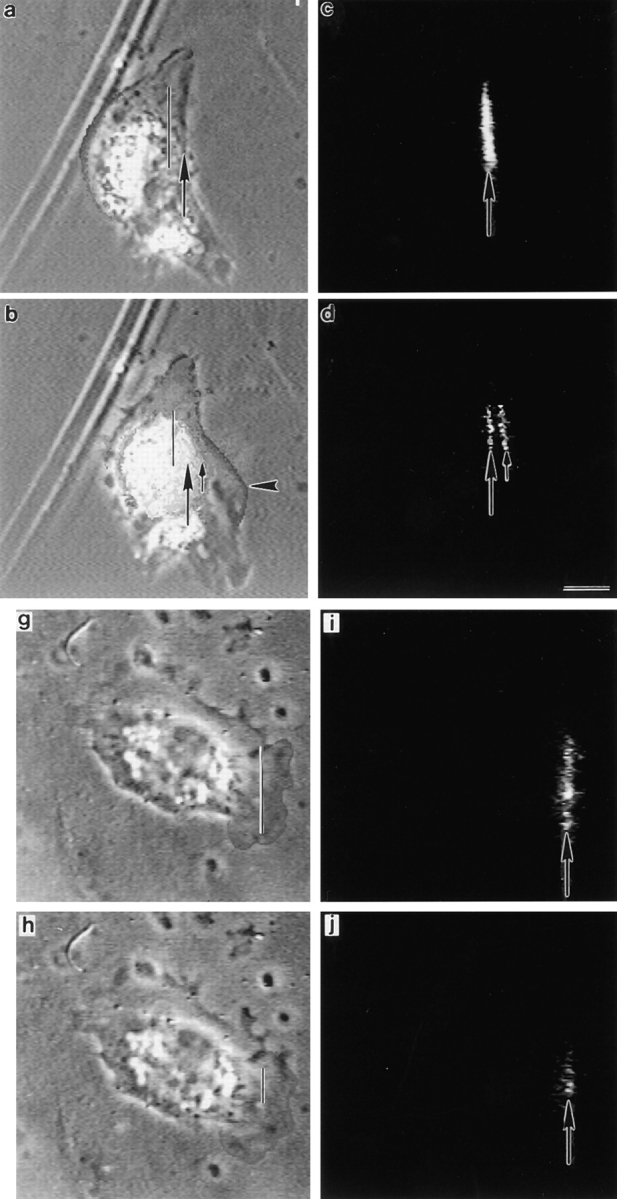
Actin filament dynamics in the cell body, lamella, and lamellipodium of locomoting chick heart fibroblasts marked by photoactivation of fluorescence. Cells were observed by paired phase contrast epifluorescence timelapse video microscopy. Rates are generally slower than in Fig. 1 f, because photoactivation experiments were done at a lower temperature. a–f, Cell body. (a) This image of the cell does not have a classical polar morphology, but it clearly has a single lamellipodium to the right and is clearly locomoting to the right. The arrow marks the front of the cell body 13 s after photoactivation, and the vertical bar marks the location of the original mark. (b) 832 s (14 min) later the front of the cell body has moved to the right from the long arrow to a new position (short arrow) at 0.2 μm/ min. The lamellipodium (arrowhead) protruded at a net rate of 0.32 μm/min. (c) Image of marked actin in the cell body 13 s after photoactivation (long arrow). (d) 832 s later in this cell ∼50% of the total marked actin filaments move forward with respect to substrate to the right of the long arrow to the short arrow at the same rate as the cell body. The other 50% remains stationary (long arrow). (e) The separation of actin filaments into moving and stationary populations is clearly seen in the fluorescence intensity line scans (thin line, 13 s after photoactivation and thick line, 832 s [14 min] later). (f) Forward movement of actin filaments (average rate = 0.29 μm/min, SD = 0.17, n=43 cells) is tightly coupled to the rate of cell body motility in individual locomoting cells (y = x with r 2 of 0.97). g–k, Lamella. (g and h) The vertical bar marks the location of the mark in i and j, respectively. (i) Image of actin filaments marked in lamella 23 s after photoactivation (arrow). (j) 128 s later the mark has not moved (arrow). (k) Line intensity scans 23 s after photoactivation (thin line) and 128 s later (thick line). As determined from high resolution images, during this 128 s, the cell body moves 1.3 μm toward the marked actin from the thin arrow to the thick arrow. This is at least twice the distance of the widest part of the marked actin filaments, which are represented in real terms on the graph. Note that the distance between the cell body and the mark after 128 s (distance between the thick arrow and the thick line) is an actual distance of 4 μm which is not presented in real terms, because the scale of the graph is too big. l, lamellipodium. All marked and observed actin filaments flow rearward with respect to the substrate (thin line, 26 s after photoactivation and thick line, 228 s later in a fibroblast locomoting at an average 0.53 μm/min). Bars: (a–d) 10 μm; (x axis of e, k, and l) 0.65 μm.
PtK2 cells were obtained from the American Type Culture Collection (Rockville, MD) and grown in DME-H16 medium with 10% FCS, streptomycin, and penicillin at 37°C in 5% CO2. 1–3 d before fixing for immunofluorescence or EM they were plated onto plain glass or 1 μg/ml polyL-lysine (Sigma Chemical Co.) coated aclar (Ted Pella Inc.) coverslips, respectively.
Initial Characterization of Live Locomoting Heart Fibroblasts; Locomotion Analysis and Orientation of Actin Filament Bundles
In this paper we refer to different cell regions and cell locations (Fig. 1 a) and different types of cell motility during cell locomotion (Fig. 1 b).
In heart fibroblasts we determined that actin filaments are mostly bundled. For subsequent EM studies of actin filaments in fixed cells, our criteria for identifying individual chick heart fibroblasts that we knew had been locomoting in an unambiguous direction were based on the cells having a certain polar morphology. For subsequent actin filament dynamic studies in fibroblasts our criteria for identifying locomoting cells were also based on the cells having a certain polar morphology. Our criteria however were less stringent than for the EM studies because we would be able to view the time-lapse record. To be able to identify polar morphology we first characterized live chick heart fibroblasts by time-lapse video microscopy (Fig. 1 c and f). To begin to characterize actin filament bundles in the same live fibroblasts we time-lapsed, we then fixed cells and determined the spatial orientation of their bundles with respect to the vector of cell body motility (Fig. 1 c-f). For time-lapse recording, heart fibroblasts on glass coverslips were transferred on the day of observation to an aluminum chamber. Cells were observed at 34-36°C in bicarbonate- and phenol red-free DME, with 10% bovine calf serum and 10% chick sera, 20 mM Hepes, pH 7.4, streptomycin and penicillin. They were recorded in timelapse with a cooled charge-coupled device camera on a Nikon micoscope with a 40X Neofluar 0.75 NA objective. After about an hour of recording, cells were immediately fixed in situ with 4% formaldehyde, then a phase image of the fixed cells was taken (Fig. 1 c) before staining cells for actin filaments with rhodamine-phalloidin (Molecular Probes Inc., Eugene, OR) (Fig. 1 d) as described previously (Cramer and Mitchison, 1993). Cells were not moved during the whole procedure (confirmed by relating the position of cells to scratch marks on the coverslip). Images of phalloidinstained cells that had previously been time-lapsed were obtained with the same charge-coupled device camera.
First, we determined that if a fibroblast is locomoting it has certain morphology. Under our cell culture conditions we found that after plating explants for 12–20 h, ∼90% of cells are locomotory. The gross morphology of the cells varies, but as determined previously (Couchman and Rees, 1979), we discovered that faster-locomoting cells have a distinctive polar phenotype (e.g., Fig. 1 c, cells 1, 2, 4, 6, and 7). These polar cells are easily distinguished from the nonpolar (orthogonal) shape of non- or slowly locomoting cells (e.g., Fig. 1 c, cell 3).
Next, we determined that if a fibroblast is highly polarized, its morphology indicates the direction of locomotion. Polar cells locomote to a more anterior position, away from the posterior, with a vector that approximates the anterior–posterior axis. Since in highly polarized cells the anterior and posterior of the cell is easily recognizable, morphology in these cells indicates the direction of locomotion. These highly polarized cells typically have an anterior (e.g., Fig. 1 c, cell 2, long bar) that is broader than its posterior (e.g., Fig. 1 c, cell 2, short bar). Also the cell anterior is further characterized by a lamellipodium at the cell tip (e.g., Fig. 1 c, cell 1, arrowhead) and a lamella (e.g., Fig. 1 c, cell 1, short arrow) located behind the lamellipodium. Behind the lamella is the cell body (e.g., Fig. 1 c, cell 1, long arrow) which is easily identifiable, comprising the nucleus (e.g., Fig. 1 c, cell 1, below the long arrow) and most of the organelles (e.g., Fig. 1 c, cell 1, above the long arrow). Thus, of the cells we show in Fig. 1 c, the anterior and posterior is clear for highly polarized cells 1, 2, 4, and 6 and was previously clear for cell 7 (Fig. 1 f, dashed outline). It is clear that these cells locomote to a more anterior position (Fig. 1 f, compare solid and dashed lines of cells 1, 2, 4, 6, and 7), with a vector that approximates the anterior–posterior axis (Fig. 1 f, cells 1, 2, 4, 6, and 7, joined dots). Fibroblasts with this type of highly polarized morphology are the types of cells we individually chose from a population of fixed cells for EM studies. Some types of polar cells we would not have chosen at all either for EM or for actin dynamic studies in locomoting cells (e.g., Fig 1 d, cells 5 and 8). We deliberately did not choose any polar cells that were in the center of a group of cells. This is because while these cells can have a polar morphology they are generally contact inhibited from undergoing fast locomotion (e.g., Fig.1 f, cell 5). We also did not choose polar cells which had several distinct sites where there were lamellipodia and lamellae, and thus the location of the anterior, based on morphology alone would always have been unclear (e.g., Fig.1 f, cell 8). Given this analysis we can be confident that all the cells chosen for EM were locomoting in the direction specified by their morphology.
We next determined the spatial orientation of actin bundles in fixed cells (Fig. 1 d), which we had previously time-lapsed live with respect to the vector of live cell body motility (Fig. 1 f). We tracked the cell body because its movement has been little studied with respect to spatial orientation of actin filaments in locomoting cells. The cell body is easily trackable and is also an accurate marker for cell locomotion, in that it continuously moves forward during locomotion of a constant direction but undergoes no net forward translocation in stationary cells. Fig. 1 e shows the outlines of the position of cells and cell bodies at the end of the timelapse when cells were fixed. To determine the vector of cell body motility we determined the approximate center of the cell body at regular intervals (e.g., Fig. 1 e, dots) during the time-lapse which lasted ∼1 h. From the beginning (Fig. 1 f, dashed cell outlines) to the end of filming (Fig. 1 f, solid cell outlines), we plotted the approximate position of the cell body center in temporal order (increasing time is toward the arrowheads in Fig. 1 f). In cells that had a highly polarized morphology we observed that the vector of forward motility of the cell body (e.g., Fig. 1 f, cells 1, 2, 4, 6, and 7, joined dots to arrowhead) is oriented with the long axis of most of the actin filament bundles in the cell body (Fig. 1 d, cells 1, 2, 4, 6, and 7, long arrows) and lamella (Fig. 1 d, cells 1, 2, 4, 6, and 7, short arrows) of the same locomoting cell. We term these bundles longitudinal actin bundles. The axis of a few actin bundles in locomoting cells is perpendicular to the vector of cell body motility. We term these bundles transverse actin bundles (e.g., Fig. 1 d, cell 2, arrowhead). In cells that we would not choose for EM or actin dynamic studies in locomoting cells, either because they had orthogonal (in this case the cell was slowly locomoting, e.g., Fig. 1, d and f, cell 3) or ambiguous morphology (e.g., Fig. 1, d and f, cell 8), the vector of cell body motility changed more frequently and in some cells was also less persistent during the period of observation. Interestingly in these cells the spatial orientation of actin bundles is more mixed, but the vector of cell body motility for each time interval is still correlated with the long axis of a subset of bundles.
Fluorescence Microscopy
We used a fluorescence method that preserves cell structure, which we previously developed for observing actin filaments and myosin II in delicate cells (Cramer and Mitchison, 1995). In brief, fibroblasts or PtK2 cells on glass coverslips were extracted for 45 s in stabilizing buffer, fixed in 4% formaldehyde for 20 min, and permeabilized with TBS and 0.5% Triton X-100 for 10 min. Indirect immunofluorescence was performed using either affinity-purified rabbit anti–human platelet nonmuscle myosin II antibody (Biomedical Technologies, Inc., Stoughton, MA) or a mouse monoclonal IgG1 anti–chicken talin antibody (Sigma Chemical Co.) and cells stained with Texas red–conjugated affinipure goat anti–rabbit IgG (H+L) or FITC-conjugated affinipure goat anti–mouse IgG (H+L) antibody (Jackson ImmunoResearch Labs, Inc., West Grove, PA). Myosin stained cells were then stained with 0.25–0.5 μg/ml FITC–phalloidin (Molecular Probes Inc.). Cells were imaged on a microscope (Optiphot-2; Nikon Inc., Garden City, NY), digitized with a cooled, charge-coupled device camera (Princeton Instruments Inc., Trenton, NJ), or imaged on a Zeiss photomicroscope with hypersensitized Technical Pan film (Alpha Photo Products Inc., Oakland, CA).
Electron Microscopy
Our aim was to determine the ultrastructure of actin filament bundles in the lamella, cell body, and tail of locomoting heart fibroblasts. We optimized conditions to maximally preserve the actin cytoskeleton by staining cells in parallel with rhodamine–phalloidin before the S1 and/ or embedding step and by successive improvements to the whole EM procedure. We chose conditions that were gentle but still allowed access of S1 to the cell body for polarity determination. Since the cell body of a fibroblast is around 30–50× thicker than the lamellipodium, our optimal methods for the cell body did not always preserve the lamellipodium as well as other EM methods that were optimized for lamellipodia (Small, 1981; Lewis and Bridgman, 1992). However, the preservation of fibroblast lamellipodia in our work was sufficient to determine that they had a similar actin filament polarity to these reports. Similarly, to be able to study the entire cell body we had to trade greater than optimal extraction of the dorsal surface to allow optimal visualization of actin deeper in the cell.
For S1 labeling, cells on aclar coverslips were extracted in 0.1% Triton X-100 in phosphate buffer (50 mM phosphate, pH 6.8, 3 mM MgCl2, 1 mM EGTA) and 1 μg/ml phalloidin (Sigma Chemical Co.) for 45–60 s, rinsed fast and gently 2–3× in phosphate buffer with 1 μg/ml phalloidin, and incubated with S1 myosin (gift from Kathy Franks and Roger Cooke, University of California, San Francisco, CA; Tilney et al., 1992) for 15–30 min. S1 was aspirated and cells immediately fixed without prior rinsing and then embedded for EM (McDonald, 1984; Hayat, 1989). We chose individual embedded locomoting fibroblasts to section one at a time and groups of PtK2 cells to section on a dissection microscope (Wild Leitz USA Inc., Rockleigh, NJ). To be chosen, fibroblasts had to fulfill several criteria (Fig. 1, c–f). Cells were sectioned parallel to the substrate from the ventral surface through to the dorsal surface at 40 nm intervals. All sections of one cell were placed in a constant orientation in order on grids. To determine the orientation of these sections with respect to the orientation of the fibroblast, we used ventral sections as a reference, since they mirror the polar morphology of the intact cell. We confirmed this for some of the fibroblasts by making a small indentation in the plastic at the anterior of the cell before sectioning. To determine the location of the cell body we additionally used the nucleus as a reference. The same EM and sectioning procedures were used for cells that were not treated with S1, except cells were permeabilized in cytoskeleton buffer (Small, 1981; Symons and Mitchison, 1991) with 0.34 M sucrose, 0.1% Triton X-100, and 1 μg/ml phalloidin and fixed in a mixture of 50 mM lysine, 3% glutaraldehyde (Boyles et al., 1985) for 10 min, and then 3% glutaraldehyde for 20 min.
EM Quantitation
To determine actin filament polarity we scored filaments in one actin bundle, in one section, in one cell at a time, from 15, 200× negatives viewed through a 4× anastigmatic lupe (Ted Pella Inc.) on a light box. The combination of this method together with optimally prepared cells and an excellent S1 preparation enabled us to typically determine the polarity of 75– 95% of the total actin filaments in any given field of view. Some of this clarity is lost in reproduction of printed images. We measured three individual cells blindly (i.e., without knowing the orientation of the negative relative to the cell and without knowing the orientation of the cell) and got the same results as for the sighted analyses. We reconstructed individual cells from overlapping, high power EM negatives for each photographed serial section, working from overlapping low power negatives of the same section as a guide.
Microinjection and Photoactivation
Microinjection of caged-resorufin actin into fibroblasts, photoactivation of fluorescence, and data collection were performed as previously described for PtK2 cells (Cramer and Mitchison, 1993) but at 31–33°C. At this lower temperature heart fibroblasts locomote more slowly than observed for the initial characterization of these cells described above in Fig. 1. Paired phase contrast and epifluorescence images of live cells were obtained with a silicon-intensified, target-tube camera.
Preparation of Images
Digital images (Fig. 1, c and d and Fig. 2, a, b, e, and f), conventional prints of 35 mm negatives (Fig. 2, c and d) , EM negatives or conventional EM prints (Figs. 3–5, 7, and 8), and the video images in Fig. 9 were imported or scanned into Adobe photoshop (Adobe Systems Inc., Mountain View, CA), digitally processed, and printed on a printer (Phaser 440; Tektronix, Inc., Wilsonville, OR).
Figure 2.
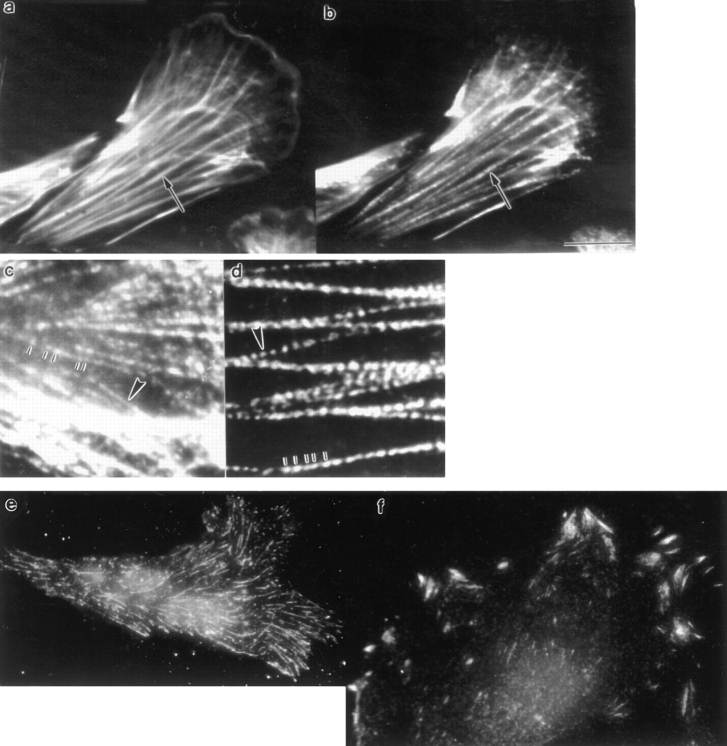
Actomyosin bundles in fixed locomoting chick heart fibroblasts compared to stress fibers in PtK2 cells and talin staining in these two cell types. (a, fibroblast) Phalloidin staining. Note actin filament bundles (arrow). (b, same fibroblast) Anti-myosin II staining. The same bundles costain for myosin II (arrow). (c, fibroblast) Myosin II staining. Actin bundles in locomoting fibroblasts show an irregular punctate pattern from one bundle (e.g., top end of the vertical lines) to another (e.g., arrowhead). (d, PtK2 cell) Myosin II staining. All stress fibers are stained in a regular punctate pattern (bottom end of the vertical lines and arrowhead). (e) Anti-talin staining in a locomoting heart fibroblast is in thin streaks in the whole cell. (f) Anti-talin staining in a PtK2 cell is predominantly in thick streaks at the cell periphery. Bar: (a, b, e, and f) 10 μm; (c and d) 4 μm.
Figure 3.
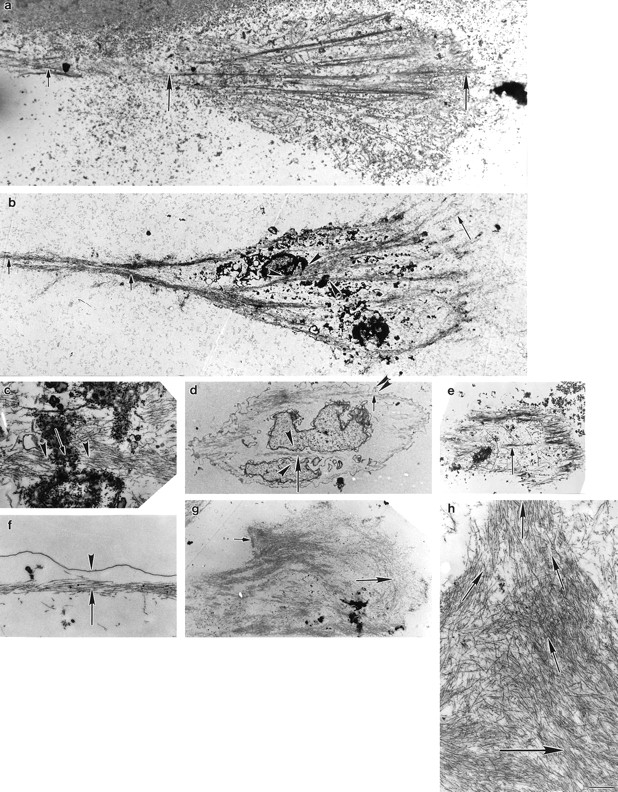
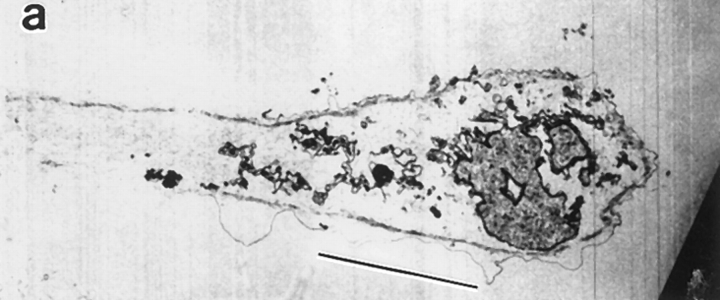
Ultrastructural organization of actin filament bundles in locomoting chick heart fibroblasts. Cells were fixed for optimal actin filament preservation. Micrographs of longitudinal (a–e), transverse (g), and subplasma membrane actin bundles (d and f) are from different cells. All images are presented with the anterior of the cell to the right. (a, ventral surface) Longitudinal actin bundles carpet the entire surface of the cell body and lamella (between the long arrows) and are found in the tail (short arrow). These bundles correspond to those visualized by phalloidin staining (Fig. 1 d, long and short arrows and Fig. 2 a, arrow). (b, middle section toward the bottom of the nucleus) The lamellipodium is just visible (long arrow). Longitudinal actin bundles are observable in the tail (short arrows) and in the cell body are associated with the bottom of the nucleus (arrowheads). (c) Association of longitudinal actin bundles (arrowheads) with the nucleus (arrow) at higher magnification. (d, dorsal region toward the top of the nucleus) Longitudinal actin bundles (long arrow) also appear in close apposition to the nucleus (arrowheads). (e, dorsal surface) Longitudinal actin bundles are shorter (arrow). (f, subplasma membrane actin bundle) An actin bundle (arrow) at higher magnification underneath the plasma membrane (arrowhead) at a side cell margin. For orientation a low magnification view of an actin bundle (short arrow) underneath the plasma membrane (double arrowhead) is shown in d. (g, transverse actin bundles) Transverse actin bundles in the lamella (long arrow) and in a more posterior location (short arrow). (h) Organization of posterior transverse actin bundles (short arrows) shown in g is clearer at higher magnification; the long arrow indicates the vector of locomotion. Bar: (a, b, d, and e) 2 μm; (c, f, and h) 0.4 μm; (g) 9 μm.
Figure 5.
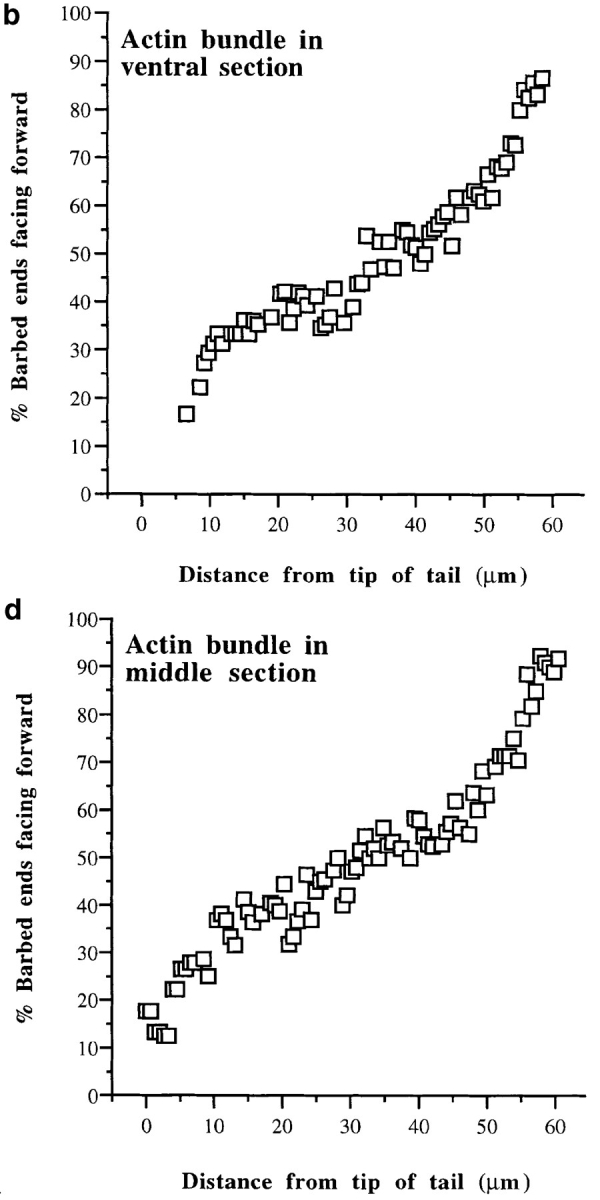
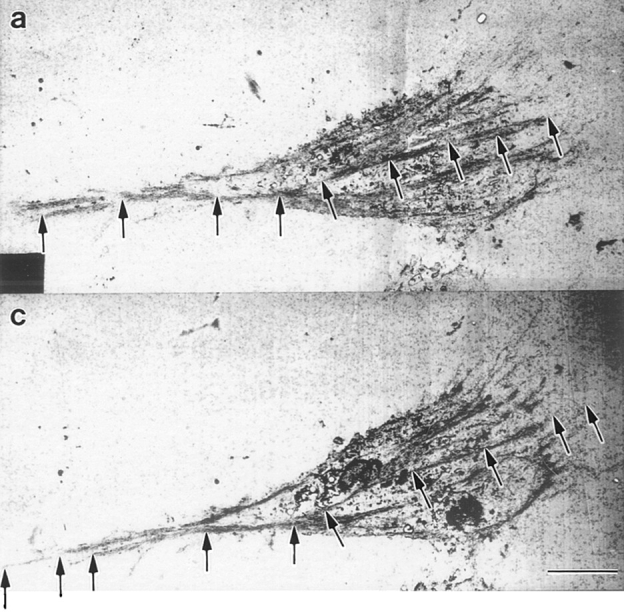
Graded polarity in individual actin bundles at the ventral surface and in a middle section of the same locomoting chick heart fibroblast. In these sections individual actin bundles appear to be very long (up to ∼30 μm) and to consecutively span the length of the section. Polarity was measured every 0.5 μm over the length of each section. (a, ventral surface) Polarity was measured for the continuous, colinear actin bundles joined by the arrows from the tip of the tail to the anterior of the lamella or the back of the lamellipodium. (b, ventral section) Polarity for the actin bundles indicated in a as a function of bundle position relative to the position of the tip of the tail in the middle section (since the middle section was longer). (c, middle section) Polarity was measured for the continuous, colinear actin bundles joined by the arrows from the tip of the tail to the front of the lamellipodium. (d, middle section) Polarity for the actin bundles indicated in c as a function of bundle position relative to the tip of the tail. Bar, 6.6 μm.
Figure 7.
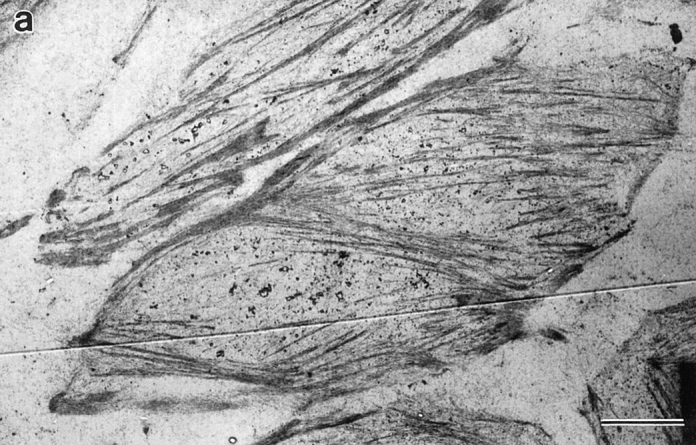
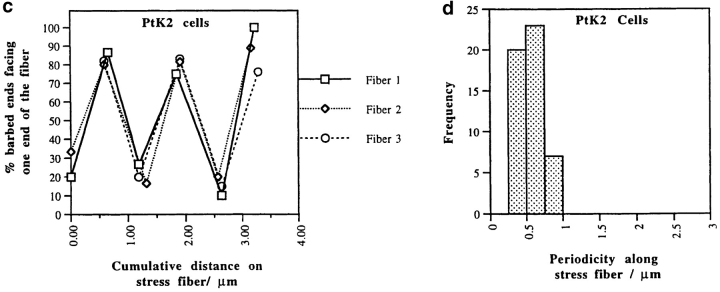
Alternating polarity of stress fibers in PtK2 cells. (a) Micrograph of stress fibers at low magnification. (b) A segment of one stress fiber. Alternating polarity is indicated with ink traces of the chevrons. (c) Polarity alternates at short regular intervals in individual stress fibers from three different PtK2 cells (normalized to 0 μm; n = 5 cells, 37 stress fiber segments, 2, 654 filaments). (d) Histogram of each switch in polarity (periodicity) in stress fibers in the entire PtK2 cell population (average periodicity is 0.6 μm, n = 50, SD = 0.2). Bars: (a) 8.5 μm; (b) 0.2 μm.
Figure 8.
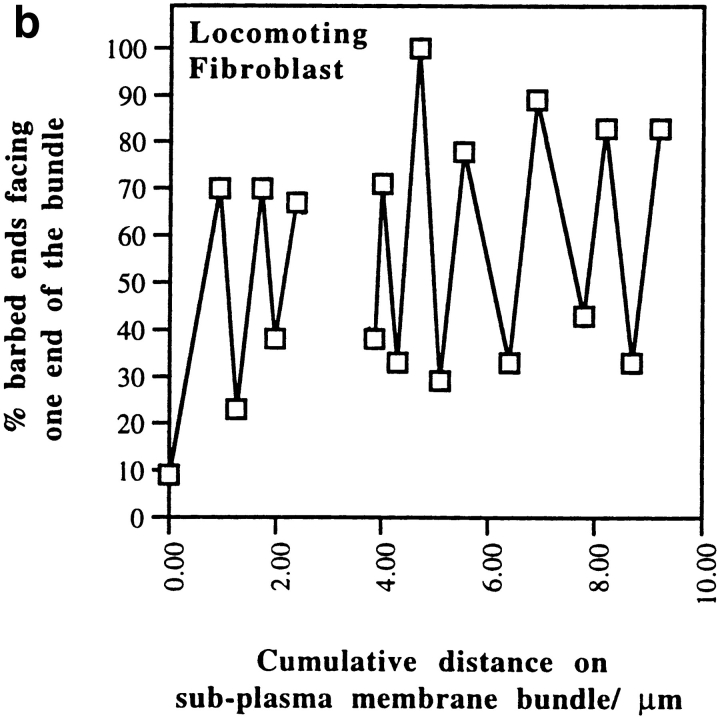
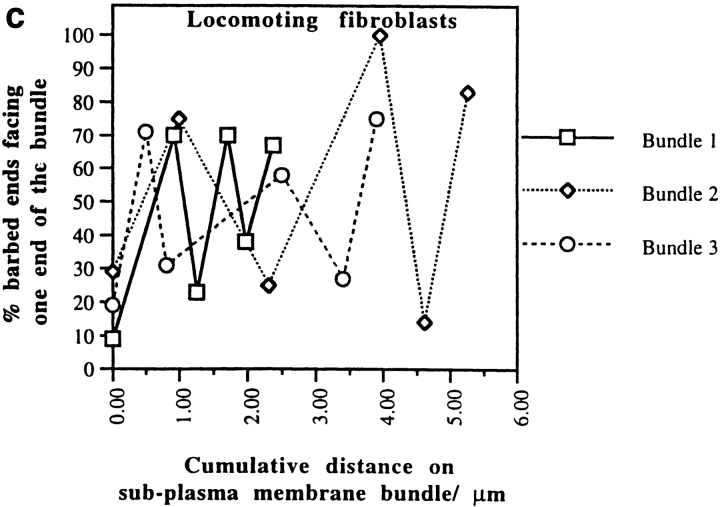
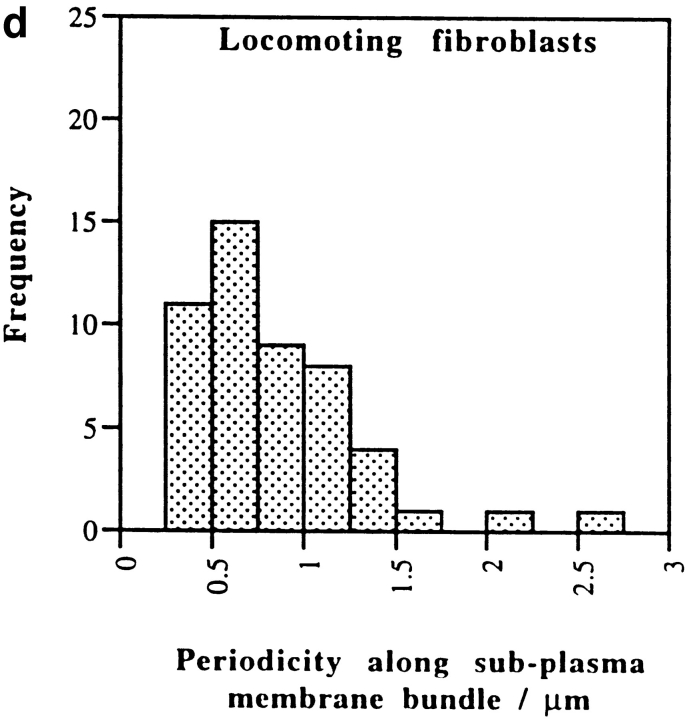
Alternating polarity of subplasma membrane actin filament actin bundles in locomoting chick heart fibroblasts. (a) A micrograph of a middle section at low magnification. The bar indicates a stretch of an actin bundle under the plasma membrane. (b) In the actin bundle shown in a, polarity alternates at short irregular intervals. (c) Polarity alternates at irregular intervals in individual subplasma membrane actin bundles from three different fibroblasts (normalized to 0 μm). (d) Histogram of each switch in periodicity in subplasma membrane actin bundles in the entire fibroblast cell population (average periodicity is 0.8 μm, n = 50, SD = 0.6). Bar, 10 μm.
Results
Initial Characterization of Actin Filament Bundles and Cell Adhesion Sites in Locomoting Fibroblasts
For all our experiments we studied 12–20-h old primary locomoting fibroblasts from heart explants, mostly from chick embryos (see Materials and Methods and Fig. 1, c–f for locomotion analysis).
We determined that actin filament bundles in locomoting fibroblasts (Fig. 2 a, arrow) stain for myosin II (Fig. 2 b, arrow). This myosin staining pattern superficially resembles stress fibers in nonlocomoting cells (PtK2 cells) but on closer inspection is different. The punctate myosin II staining pattern along a single actin bundle and from bundle to bundle is quite irregular in the fibroblasts (Fig. 2 c, compare vertical lines and arrowhead). In contrast, the staining pattern in stress fibers in PtK2 cells is more consistent (Fig. 2 d , compare vertical lines and arrowhead). In fibroblasts that have a nonlocomoting phenotype (cultured for 3–5 d), the myosin II staining pattern is indistinguishable from stress fibers in PtK2 cells (not shown; see staining in Weber and Groeschel-Stewart, 1974; Abercrombie, 1980). That the organization of other aspects of the actin cytoskeleton differs between locomoting fibroblasts and PtK2 cells is also shown by the staining pattern for talin, a protein found in adhesion complexes. In locomoting fibroblasts talin is found in thin streaks in the whole cell at the plane of the substrate with no apparent staining at the cell periphery (Fig. 2 e). In PtK2 cells talin is predominantly found in thicker streaks at the cell periphery (Fig. 2 f). Like Ptk2 cells, stationary or slowly locomoting fibroblasts have thicker talin streaks at the cell periphery and also thick patches in the bulk of the cell (Dunlevy and Couchman, 1993; Crowley and Horwitz, 1995).
Ultrastructural Organization of Actin Filament Bundles in Locomoting Fibroblasts
Next we determined the detailed spatial orientation, distribution, and size of actin filament bundles in locomoting fibroblasts by serial section electron microscopy using conditions that optimally preserve structure of the actin cytoskeleton. We chose only cells we could unambiguously determine were locomoting in a direction specified by their morphology (see Materials and Methods; Fig. 1, c–f). We observed that actin filaments in the lamella and cell body (Fig. 3 a, between the long arrows) and tail (Fig. 3, a and b, short arrows) of locomoting fibroblasts are mostly bundled and that these bundles have several spatial orientations (Fig. 3, a–h). As expected from our light microscope studies in the Materials and Methods section (Fig. 1, c–f), we observed both longitudinal and transverse actin bundles. Longitudinal actin bundles are by far the largest population of bundles in every individual cell we analyzed. We define longitudinal as bundles 0–30°C to the vector of locomotion. This vector is determined from the overall shape of the cell (Fig. 1, c–f). In the whole analysis longitudinal actin bundles comprise an average 75% (631/838) of the total actin bundles scored. Most longitudinal actin bundles (65% of total actin bundles) are located in the ventral region of the cell (Table I). These ventrally located actin bundles are long (average 13 μm) and are comprised of long actin filaments (>2 μm; Table I). On average the actin bundles overlap with each other to span 90% (ranging 67–100% in individual cells) of the ventral cell surface. In some cells individual longitudinal actin bundles appear very long (30–60 μm), individually spanning 50–75% of the cell surface (Fig. 3, a and b and Fig. 5, a and c). The remaining longitudinal actin bundles are about equally distributed between the middle and dorsal regions of the cell (Table I). Longitudinal actin bundles in ventral, middle, and dorsal cell regions (Fig. 3, b and c, arrowheads) are associated with the nucleus (Fig. 3 c, arrow) in the cell body. The length of longitudinal actin bundles is on average shorter in the middle (Table I) and dorsal regions (Fig. 3, d, long arrow, and e, arrow) of the cell. However with respect to the middle region, in sections toward the bottom of the nucleus (Fig. 3 b), longitudinal actin bundles can be as long as those on the ventral surface. Actin bundles are typically quite narrow (∼0.3 μm, Table I), but in some cells we saw wider actin mats ranging 1–7 μm wide (Fig. 3 h). Across their width, narrow bundles contain ∼10–30 actin filaments and wider mats up to ∼300 filaments.
Table I.
Quantitation of Actin Filament Bundles in Locomoting Fibroblasts
| Cell region (see Fig. 1 a) | Ventral | Middle | Dorsal | |||
|---|---|---|---|---|---|---|
| (percent total actin bundles) | ||||||
| Distribution of actin bundles | ||||||
| Longitudinal bundles | 65 | 6 | 4 | |||
| Transverse bundles | 6 | 5 | No bundles | |||
| Sub-plasma membrane bundles | 2* | 6 | 6 | |||
| μm (SD, n) | μm (SD, n) | μm (SD, n) | ||||
| Individual actin bundle length | ||||||
| Longitudinal bundles | 12.9 (3.8, 205) | 6.8 (2.4, 35) | 2.9 (0.7, 24) | |||
| Transverse bundles | 6.5 (2.8, 22) | 6.2 (3.2, 32) | No bundles | |||
| Sub-plasma membrane bundles | 13.2 (5.8, 13) | 8.7 (5.2, 20) | 3.5 (1.2, 13) | |||
| Minimum actin filament length in bundles‡ | ||||||
| Longitudinal bundles | 2.3 (0.7, 68) | 1.4 (0.8, 69) | 0.4 (0.2, 185) | |||
| Transverse bundles | 1.0 (0.4, 30) | 0.8 (0.3, 55) | No bundles | |||
| Sub-plasma membrane bundles | 0.8 (0.3, 31) | 0.6 (0.3, 58) | 0.6 (0.2, 42) | |||
| Bundle width (transverse and longitudinal) | 0.36 (0.12, 344) | 0.34 (0.08, 70) | 0.29 (0.04, 20) | |||
Not observed in sections at the ventral cell surface.
For longitudinal bundles in ventral and middle cell locations we could generally only determine the location of ends of filaments that were at the side of a bundle. In dorsal sections we also observed apparently short individual actin filaments, and these are included in the average filament length in dorsal longitudinal bundles. Values are overall averages of bundles and filaments observed in 14 individual cells.
Transverse actin bundles are one of two smaller spatial populations of actin filament bundles we observed in the lamella and cell body of locomoting fibroblasts (Fig. 3, g and h). We observed transverse actin bundles in half the cell population (7/14 cells) oriented perpendicular +/− ∼30° to the vector of cell locomotion (Fig. 3 h, lying in the direction of the short arrows). Transverse actin bundles are about equally distributed between the ventral and middle region of the cell (Table I). They represent an average 11% (99/838) of the total actin bundles scored in the cell population.
The other smaller spatial population is found within 0.1– 1 μm of the plasma membrane. We term these subplasma membrane actin bundles (Fig. 3 d, short arrow and at higher magnification in Fig. 3 f, arrow). While the long axis of subplasma membrane actin bundles is also oriented with the vector of cell locomotion, the organization of these bundles (see polarity studies below) differs from longitudinal actin bundles, and so we gave them a different name and scored them separately. Subplasma membrane actin bundles are about equally distributed in the cell (Table I), except they were not observed in sections at the ventral surface. For clarity, sections at the ventral surface comprise a sheet of plasma membrane that lies on the substrate. Longitudinal actin bundles cover this membrane sheet. In higher sections the plasma membrane forms a thin ribbon circumscribing the section. In these higher sections subplasma membrane actin bundles lie on the inner surface of the membrane ribbon, and longitudinal actin bundles are more internal from the membrane ribbon.
Polarity of Longitudinal Actin Bundles in Locomoting Fibroblasts
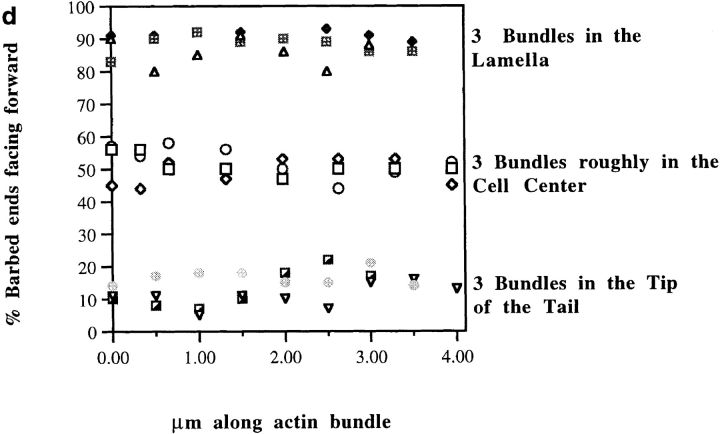
We next determined the polarity of actin filaments in locomoting fibroblasts by S1 decoration and serial section EM. First we looked at longitudinal actin bundles (Figs. 4–6), the largest population of actin bundles in individual cells. We observed that the polarity of these actin bundles from the ventral surface through to the dorsal surface depends on their anterior–posterior location in the cell. We first exemplify this for actin bundles on the ventral surface in extreme cell locations (Fig. 4, a–d). In the anterior of the lamella, barbed ends of actin filaments (Fig. 4 a, chevrons traced in ink) mostly face forward (Fig. 4 a, the vector of locomotion is shown by the arrow). Roughly in the cell center actin bundles have mixed polarity (50% barbed, 50% pointed) as a function of bundle length (Fig. 4 b, chevrons traced in ink). We estimate that actin polarity alternates across the width of a mixed polarity actin bundle every one to three filaments. In the tip of the tail, pointed ends of actin filaments (Fig. 4 c, chevrons traced in ink) mostly face forward (Fig. 4 c, the vector of locomotion is shown by the arrow). The uniform polarity of these actin bundles in the anterior of the lamella and tip of the tail and the mixed polarity of the actin bundles roughly in the cell center, are clearly shown in Fig. 4 d. For all these actin bundles, average polarity does not change over short distances (3–5 μm for a cell typically 40–60 μm long).
Figure 4.
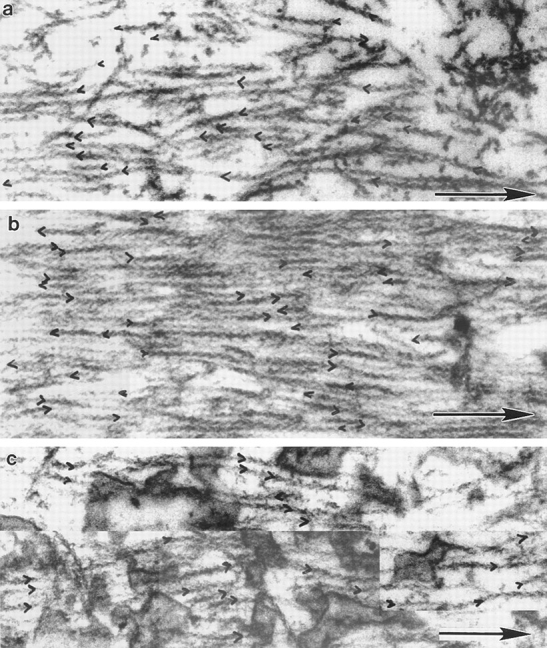
Polarity of actin filaments in longitudinal actin bundles in extreme cell locations of locomoting chick heart fibroblasts using S1 decoration. Examples of polarity from different cells are highlighted with ink traces of the chevrons. The vector of locomotion in a–c is to the right (arrow). c was spliced together. (a, anterior of the lamella) The barbed ends of actin filaments face forward. (b, approximate cell center) Actin bundles have mixed polarity. (c, tip of the tail) The pointed ends of actin filaments face forward. (d) Polarity is quantitated at regular intervals along each of three representative longitudinal actin bundles located in the anterior of the lamella, approximate cell center, and tip of tail, respectively. Bar (shaft of arrow in c), 0.2 μm.
What happens to the polarity of actin bundles between the extreme sites shown in Fig. 4? To analyze the polarity of actin filaments in individual longitudinal actin bundles in individual cells in more detail, we scored polarity as a function of position across the whole cell. This confirmed our original analysis (Fig. 4, a–d) but also revealed that longitudinal actin bundles have graded polarity (Fig. 5). Regardless of their ventral–dorsal location, the closer actin filaments are to the anterior margin of the cell, the more their barbed ends face forward. To illustrate this we show graded polarity for consecutive, colinear, long (up to ∼30 μm) longitudinal actin bundles which span the length of the cell, on the ventral surface (Fig. 5, a and b) and in a middle section (Fig. 5, c and d) respectively, of the same locomoting fibroblast. We scored polarity along these actin bundles every 0.5 μm over the length of the cell (∼60 μm long). As observed in Fig. 4, average polarity in the actin bundles does not change over short distances. In contrast over the length of an individual actin bundle, polarity gradually changes. In this cell the polarity gradient across individual actin bundles ∼20–30 μm in length is ∼25–50%. In the cell population in an actin bundle of average length of 13 μm, the polarity gradient is ∼15–20%. The actual actin polarity at any given point in an actin bundle is determined by position in the cell. Over the 60 μm of total cell length shown in Fig. 5, polarity gradually changes with a gradient of ∼85%, from 10–15 to 90–95% barbed ends facing forward from the back to the front of the cell. This is not due to actin filaments having a more random orientation toward the posterior of the cell, because nearly every filament we observed in the cell posterior was oriented 0–30° to the vector of locomotion. Nor is it due to an inability to distinguish the polarity of a filament. We were typically able to score the polarity of 75–95% of the filaments in any given field of view (see Materials and Methods). Interestingly, the slope of the graphs in Fig. 5, b and d appears steeper at each end. We do not yet know if this is significant.
Next we present the average data that we compiled for individual longitudinal actin bundles in all the individual cells we analyzed. To do this we determined polarity as in Fig. 5, but in larger increments, every 10% of cell length (0% is at the tail tip and 100% is in the lamellipodium; Fig. 6 a). This allowed us to compare data between cells that varied in length. A 10% increment represents 2–10 μm of cell length depending on the length of that cell (range 20– 100 μm, but typically 40–60 μm). Once we had obtained a measure of polarity for individual longitudinal actin bundles at each increment in an individual cell, we determined the average polarity of all the individual longitudinal actin bundles in that cell for each increment (i.e., different individual longitudinal actin bundles would have the same position as a function of cell length, but would be located at varying positions on the cell width axis). Then we plotted these average values versus cell position for each individual cell on the same graph (Fig. 6 a). The tight correlation between filament polarity and cell position, both within a single actin bundle (Fig. 5, b and d), between individual actin bundles (compare Fig. 5, b and d), and in all the cells we analyzed (Fig. 6 a), appears to be a fundamental and previously unrecognized aspect of actin cytoskeletal organization. We therefore term these structures graded polarity actin bundles. The same observations were confirmed in sections that were scored blindly. Also, Fig. 6 a confirms that the polarity of actin filaments in the lamellipodium of locomoting fibroblasts (100% of cell length) is identical to that of actin filaments in lamellipodia of other motile cells, i.e., all barbed ends forward (Small, 1988; Small et al., 1995).
Transverse actin bundles in both ventral and middle sections also have graded polarity; the closer actin filaments are to one side of the cell the more their barbed ends face the nearest side cell margin (Fig. 6 b). However there is one subtle difference between transverse and longitudinal graded polarity actin bundles. Analogous to longitudinal actin bundles, mixed polarity is observed in transverse actin bundles halfway across the width of the cell, but only in ventral sections; in middle sections at this location we observed disorganized alternating polarity as a function of bundle length (below). Graded polarity actin bundles account for ∼85% of the total actin bundles observed in the cell population and 100% of the actin bundles on the ventral surface.
Polarity of Stress Fibers in PtK2 Cells
Once we had determined the organization of graded polarity actin filament bundles in the lamella, cell body, and tail of locomoting fibroblasts, we compared this organization to that of stress fibers in the cell body of nonlocomoting cells (Fig. 7 a–d, PtK2 cells). Stress fibers are thought to be organized like muscle sarcomeres (Sanger and Sanger, 1980; Sanger et al., 1983). Thus like muscle sarcomeres, we expected stress fibers to have alternating polarity as a function of fiber length. While there have been some previous studies on stress fiber polarity in PtK2 cells and other cell types, measurements were not made as a function of fiber length, and the reports did not include detailed quantitation of polarity (Begg et al., 1978; Sanger and Sanger, 1980). Here we show that in single stress fibers (Fig. 7, b and c) and in the stress fiber population in PtK2 cells (Fig. 7 d), filament polarity alternates as a function of fiber length. The distance between each alternate polarity (periodicity) is short and regular (average 0.6 μm). This is a very different organization to graded polarity actin bundles, which do not alternate or change polarity over short distances (compare Fig. 7 c to Fig. 4 d and to Fig. 5, b and d).
Polarity of Subplasma Membrane Actin Bundles in Locomoting Fibroblasts
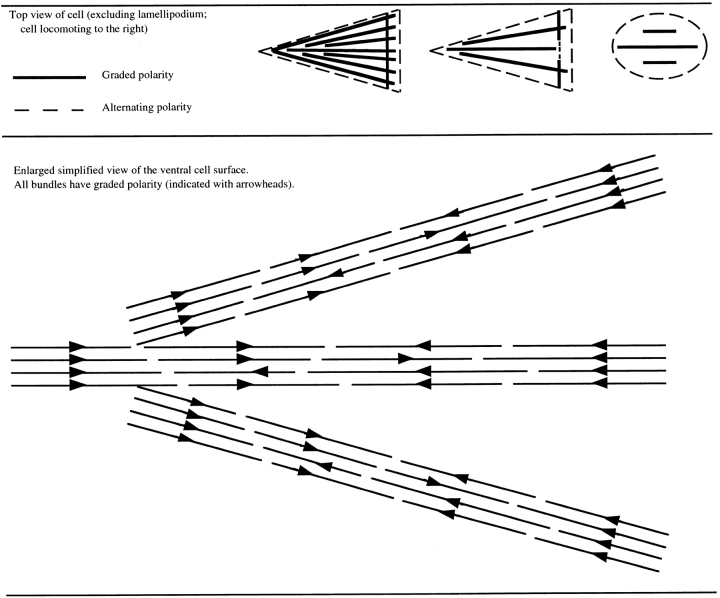
In locomoting fibroblasts we observed that subplasma membrane actin bundles in all cell sections and transverse actin bundles located halfway across the width of the cell in middle sections are similarly organized to stress fibers in PtK2 cells. Like stress fibers in PtK2 cells, the polarity of subplasma membrane actin bundles in locomoting fibroblasts (Fig. 8) also alternates at short intervals along the length of the bundle, but in a less regular way than stress fibers (single bundles are shown in Fig. 8, b and c, and the bundle population is shown in Fig. 8 d). Of the transverse actin bundles that have alternating polarity, the periodicity is also more variable (not shown). On average, periodicity is 0.8 μm for subplasma membrane actin bundles and 0.9 μm for alternating polarity transverse actin bundles. This agrees well with the independent measurements of average filament length in these bundles of 0.7 and 0.8 μm, respectively (Table I). The number of filaments with the same polarity across the width of one half of an alternating polarity actin bundle is slightly less in fibroblasts (75%, SD = 11, n = 148) than in PtK2 cells (83%, SD = 9, n = 149). From these data we consider alternating polarity actin filament bundles in locomoting fibroblasts to be basically similar to stress fibers but to be more disorganized. We estimate that disorganized alternating polarity actin bundles represent ∼15% of the total actin bundles in the locomoting fibroblast cell population (14% as subplasma membrane actin bundles plus 1% as transverse actin bundles). In individual fibroblasts this value ranges 5–19%. The other 81–95% are graded polarity actin bundles. Table II summarizes the distribution of graded polarity and alternating polarity actin filament bundles in locomoting fibroblasts.
Table II.
Polarity of Actin Filament Bundles in the Lamella, Cell Body, and Tail of Locomoting Fibroblasts
Actin Filament Dynamics in the Cell Body, Lamella, and Lamellipodium of Locomoting Fibroblasts
Having established the structural organization and polarity of actin filaments in locomoting fibroblasts we investigated their dynamic behavior in live fibroblasts by photoactivation of fluorescence. Actin filament marking experiments in the cell body and lamella of a cell have not previously been reported. We also report dynamic actin behavior in lamellipodia of locomoting fibroblasts since previous reports for fibroblasts have been restricted to stationary cells. The dynamic behavior of actin filaments we observed depended on the location of the marked filaments in the cell. Within the cell body there are two dynamic populations of actin filaments. One moves forward at the same rate as the cell body, and the other remains stationary with respect to substrate, regardless of the anterior–posterior location of the mark in the cell body (Fig. 9, a–f). This bar splitting occurred in 43/51 locomoting cells; in 3/51 cells, actin filaments were observed to only move forward, and in 5/51 cells all observed filaments remained stationary. We estimate that stationary actin comprises an average 70% of the total actin marked, ranging 50–100% in 48 individual cells (excluding the three marked cells in which all the actin moved forward). Forward movement of actin filaments does not occur in stationary fibroblasts (not shown). Actin filaments are relatively stable in the cell body with an average turnover of 576 s (9.6 min). Within lamella all the marked and observed actin filaments are stationary (observed for 1–15 min in 23 locomoting cells) during fibroblast locomotion (Fig. 9, g–k).
As observed in lamellipodia of stationary fibroblasts (Wang, 1985; Theriot and Mitchison, 1992) and of other motile cell types (Okabe and Hirokawa, 1991; Lin and Forscher, 1995), actin filaments in the lamellipodia of locomoting fibroblasts flow rearward with respect to substrate (Fig. 9 l; n = 26 marks in 23 cells). Neither lamellipodia protrusion (r 2 is 0.14, n = 34) nor rearward flow of actin filaments in lamellipodia (Table III) directly correlates with the rate of forward motility of the cell body in locomoting fibroblasts. This implies that at least over shorter periods of time, protrusion and cell body motility operate independently. Over longer periods there must be some global control because there is some correlation between net protrusion and speed of the whole fibroblast (correlation = 0.56; Abercrombie et al., 1970). Table III summarizes the type of dynamic actin filament behavior we observed in locomoting fibroblasts and any correlation between this behavior and either forward motility of the cell body or protrusion.
Table III.
Correlation Between Actin Filament Dynamics and Types of Cell Motility in Locomoting Fibroblasts
| Actin filament dynamics (with respect to substrate) | Type of cell motility (see Fig. 1 b) | |||
|---|---|---|---|---|
| Cell body forward | Lamellipodium protrusion | |||
| Forward (in cell body) | 0.97, n = 43 | 0.13, n = 33 | ||
| Rearward (in *lamellipodium) | 0.07, n = 21 | 0.08, n = 26 | ||
| ‡0.19, n = 15 | ||||
Note that the lamellipodium is distinct from the lamella (see Fig. 1 a). In lamellae actin filaments are stationary with respect to substrate (see Fig. 9, g–k) and so are not included in this table.
Value for protuding lamellipodia of stationary fibroblasts. Values are coefficient of correlation (r 2). For n individual marked locomoting fibroblasts, the respective rates of actin filament movement and cell motility were calculated. These rates were plotted on the same graph for the n individual cells. A linear curve was fitted and r 2 for the curve obtained from a graphing program (Cricket Graph).
Discussion
Structural Organization of Actin Filaments in Locomoting Fibroblasts
In locomoting heart fibroblasts we observed three different types of actin filament organization: sheets of expected uniform polarity in the lamellipodium, graded polarity actin bundles, and disorganized alternating polarity actin bundles in the cell body, lamella, and tail. The uniform polarity and alternating polarity actin bundles were expected from previous work (Small, 1988). The graded polarity actin bundles, which were the major population of actin bundles, were unexpected. Since detailed information on the organization of actin filament bundles in entire locomoting cells has not previously been reported, we first compare the actin bundles we have characterized in locomoting fibroblasts to stress fibers that we further characterized in nonlocomoting cells (PtK2 cells).
The term stress fiber was first used over 70 yr ago to describe cytoplasmic fibers visible by light microscopy in the cell body of nonmuscle cells (Lewis and Lewis, 1924). This description was used before the protein composition or organization of the cytoplasmic fibers was known. By this criterion alone then the term stress fiber could potentially be applied to many different types of cytoplasmic fibers, irrespective of protein composition or organization. However later it was established from studies in cells with a nonlocomoting phenotype that stress fibers are actin filament bundles (for review see Byers et al., 1984). Whether the term stress fiber can also be used to describe actin filament bundles in locomoting cells in our opinion requires characterization of the organization of both stress fibers and the actin bundles in question.
We have determined that the organization of graded polarity actin bundles in locomoting fibroblasts is distinct from that of stress fibers in several respects. Individual actin filaments in graded polarity actin bundles (Table I) are at least fourfold longer than in stress fibers in PtK2 cells (Sanger and Sanger, 1980, which we confirmed). Most surprisingly, polarity of graded polarity actin bundles varies smoothly as a function of fiber length and cell position over relatively large length scales (Figs. 5 and 6). This is quite different to stress fibers in PtK2 cells where polarity varies alternately as a function of fiber length over small length scales (Fig. 7 c). From these criteria we conclude that graded polarity actin bundles and stress fibers are different types of actin filament bundle. Thus we believe that the term stress fiber can not be used to describe graded polarity actin filament bundles in locomoting fibroblasts. Graded polarity actin bundles also differ from actin filament bundles of uniform polarity in protrusive structures of motile cells including filopodia and microspikes (Small et al., 1978; Lewis and Bridgman, 1992). Thus the graded polarity actin bundles we observe in the cell body, lamella, and tail of locomoting fibroblasts appear to be a novel type of actin filament organization.
The organization of alternating polarity actin filament bundles in locomoting fibroblasts is similar to that of stress fibers (compare Figs. 7 c and 8 b). By this criterion alone an alternating polarity actin filament bundle in a locomoting fibroblast could be termed a stress fiber. However we think it more likely that these bundles are separate subtypes of actin filament structures which have alternating polarity. This structural group would also include muscle sarcomeres. We suggest separate subtypes because the alternating polarity in the locomoting fibroblasts is more disorganized than in stress fibers, and the two bundles have different spatial locations in their respective cell types and may be differentially organized. Alternating polarity actin bundles are in close apposition to the plasma membrane, whereas stress fibers are located within the body of the cell. Stress fibers are associated with focal adhesions, but while locomoting heart fibroblasts have some type of adhesion site (Fig. 2 e) they lack focal adhesions (Couchman and Rees, 1979).
How do Graded Polarity Actin Bundles Form, and Are They Present in Other Locomoting Cell Types?
We do not yet have much information on how graded polarity actin bundles form. They are unlikely to be formed by frequent nucleation, because actin filaments in the cell body have a slow turnover rate. A recent careful analysis of the formation of actin bundles in the transition zone (lamella) between the lamellipodium and cell body has shown that there is progressive zipping together of actin filaments mediated by myosin II (Verkhovsky et al., 1995). However this study was performed in non- or slowly moving cells, where the cell body bundles are stress fibers rather than graded polarity actin bundles, so its relevance to graded polarity actin bundles is unclear. In another study a mathematical model is presented for myosin II– mediated organization of actin filaments into a bundle based on frictional drag and polarity (Nakazawa and Sekimoto, 1996). Whether this is relevant for graded polarity actin bundles is not known because the model is based on in vitro observations that myosin II can sort actin filaments into an aternating polarity actin filament bundle. Certain bundling proteins are thought to preferentially bundle parallel actin filaments (i.e., oriented in the same direction; DeRosier et al., 1977; Bretscher, 1981; Matsudaira et al., 1983). Some of these may be important in the genesis of graded polarity actin bundles in extreme anterior and posterior cell locations where neighboring filaments usually have the same orientation. In preliminary cell staining experiments fimbrin does not localize to graded polarity actin bundles and thus is unlikely to bundle graded polarity actin bundles. α-Actinin on the other hand is localized to graded polarity actin bundles in all cell locations where it may function to bundle actin filaments.
Whether graded polarity actin bundles exist in other locomoting cell types is not yet known. We do have some partial information on the structural organization of actin filaments in certain neuronal growth cones (Lewis and Bridgman, 1992). In these growth cones the distribution of actin bundles is similar to the overall spatial organization and size of longitudinal graded polarity actin bundles we observe in locomoting fibroblasts. We do not know if the actin bundles in the growth cones are graded polarity actin bundles, because in the growth cones polarity was determined along the ventral–dorsal but not anterior–posterior axis. We can not compare our polarity data directly to the growth cone study because it is unclear, where on the anterior–posterior axis the ventral and dorsal polarity measurements were made in the growth cones.
Actin Filament Dynamics in Locomoting Fibroblasts
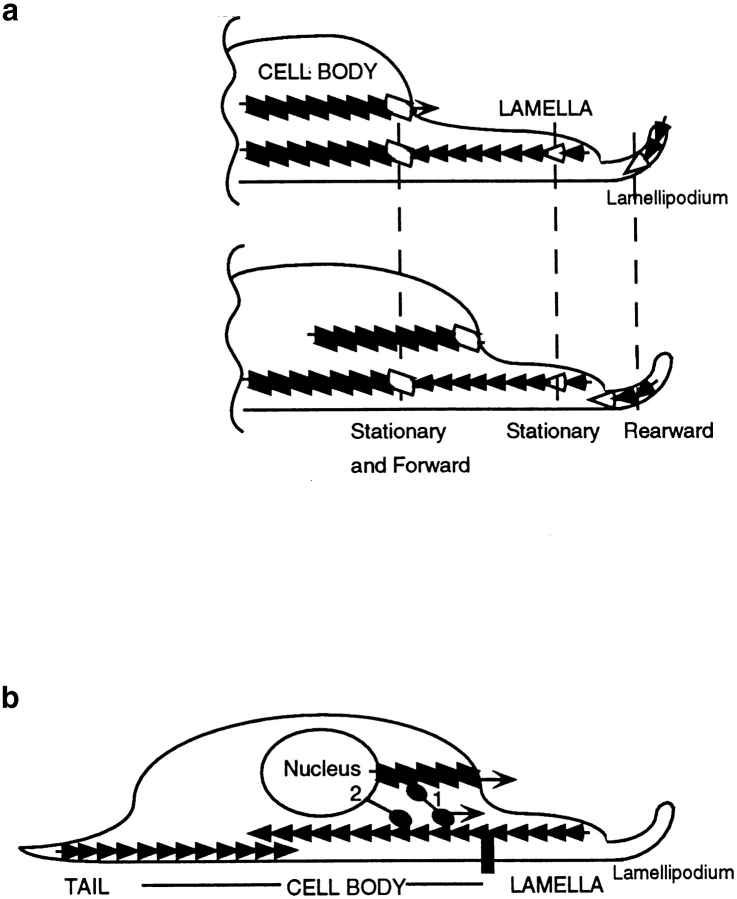
In locomoting heart fibroblasts we observed three different types of actin filament dynamics with respect to substrate: retrograde flow in the lamellipodium, stationary in the lamella, and stationary and forward moving in the cell body (all illustrated in Fig. 10 a). In lamellipodia of locomoting fibroblasts, as with other studies in fibroblasts, the mechanism and function of the observed retrograde actin filament flow is unknown. In Aplysia growth cones, retrograde actin filament flow is coupled to lamellipodia protrusion (Lin and Forscher, 1995) and requires myosin (Lin et al., 1996). In contrast in both locomoting (this study) and stationary (Theriot and Mitchinson, 1992) fibroblasts there is no such coupling, and retrograde flow is insensitive (Cramer, L.P., and T.J. Mitchinson, unpublished observations) to the low affinity myosin inhibitor BDM (Cramer and Mitchison, 1995).
Figure 10.
Model for the generation of motile force for forward motility of the cell body during heart fibroblast locomotion. (a) Observed dynamic behavior and polarity of actin filaments in locomoting fibroblasts. Actin filaments (rows of consecutive solid parallelograms and triangles) are marked with zones of fluorescence (open parallelograms and triangles). Actin filament polarity (in a and b) is simplified. Barbed ends are the broad ends of triangles (e.g. in a this is to the right). Polarity is not represented for parallelograms. In the cell body in graded polarity actin bundles (parallelograms) we do not know the spatial location of the forward moving and stationary actin filament populations. We suspect that on the ventral surface of the cell body, a proportion of or all filaments in graded polarity actin bundles are stationary, because this is the behavior of all the filaments in the lamella, and graded polarity actin bundles in the lamella (triangles) are continuous with those in the cell body (e.g., Fig. 3, a and b, and Fig. 5, a and b). In the lamellipodium, actin filaments have uniform polarity and flow rearward with respect to substrate. (b) We suggest that (1) in graded polarity actin bundles myosin (two balls and one stick) moving in the direction of (lower arrow) the barbed end of a population of stationary actin filaments (row of triangles attached to substrate by a vertical black bar) pulls a second population of actin filaments (row of parallelograms) forward, and this drives the cell body forward (upper arrow). (2) Myosin (one ball and stick) may also directly move the nucleus forward. Both mechanisms 1 and 2 may exist in cells.
In the lamella of primary locomoting heart fibroblasts the observation of stationary actin filaments is perhaps initially surprising for two reasons. The first is that a type of actin bundle (an arc) has been observed to flow rearward in the lamella of primary heart fibroblasts (Heath, 1983), yet we did not detect this behavior in lamella marking experiments here. We note that arcs were only observed in 6% of the total heart fibroblast population and were studied in 24–48-h old fibroblasts (Heath, 1983). We marked 23 12–20-h old heart fibroblasts. If arcs also exist in these younger, faster locomoting fibroblasts we would only expect to find arcs in one or two of the marked cells. The second reason is that surface-attached particles have been observed to flow rearward with respect to substrate over the lamella toward the nucleus and tail of locomoting heart fibroblasts, a process dependent on actin filaments (for review see Harris, 1973; Heath and Holifield 1991). This is not immediately reconcilable with either the observed dynamics (Fig. 9, g–k) or overall polarity (Figs. 4 a, 5, and 6) of actin filaments in lamellae. It is possible that a small proportion of actin does flow rearward in lamellae to transport the particles but is not readily detected in our system. Consistent with this, on two occasions we did detect faint marked actin filaments moving rearward in the lamella at the same time as most of the actin filaments remained stationary. Alternatively perhaps some types of particle flow are driven by different actin-dependent mechanisms. Possibilities are a theoretical minus end directed, actin-based motor (Cramer and Mitchison, 1997) or tensiondriven lipid flow (Dai and Sheetz, 1995). A similar problem for finding an explanation for actin-dependent particle flow is also found in lamellipodia of keratocytes (Kucik et al., 1990, 1991; Theriot and Mitchison, 1991) and in retraction fibers of mitotic cells (Cramer and Mitchison, 1997).
In the cell body of locomoting fibroblasts the observation of both stationary and forward moving actin filaments is not surprising to us. We have made the same observation in spreading edges of postmitotic cells (Cramer and Mitchison, 1993). Perhaps this indicates that this type of actin filament behavior will turn out to be more widespread and may be a general feature of certain types of cell motility.
Role for Graded Polarity Actin Filament Bundles in Fibroblast Locomotion
We think that graded polarity actin bundles are important for generating motile force during fibroblast locomotion for the following reasons: (a) they are the largest population of actin bundles in these cells, (b) many of them are located on the ventral surface of the cell, a surface against which motile force is expected to be generated, and (c) they are specific to locomoting cells. What type of cell motility is likely driven by graded polarity actin bundle–based motile force during cell locomotion? We know that the vector of cell body motility is oriented along the long axis of actin bundles in the cell (Fig. 1, compare d and f). We also know from our EM studies that most of these bundles have graded polarity. Thus we conclude that one role for graded polarity actin bundles is to generate motile force for cell body motility during cell locomotion.
We suspect that one role of the graded polarity actin bundles is to interact with myosins to generate motile force for cell body motility. There are many literature precedents for a role for myosin II in generating force for cell body motility. Early biochemical studies established that individual locomoting cells contain myosin II (Huxley, 1971). This led to the idea that in locomoting cells, as in muscle, myosin II interacts with actin to generate force. Later, genetics showed that myosin II plays a role in generating force for at least cell body motility but not protrusion during amoeba cell locomotion (Wessels et al., 1988; Doolittle et al., 1995; Jay et al., 1995). In heart fibroblasts in an unpublished study we make a similar observation using the low affinity myosin inhibitor, BDM. In fibroblasts an actin–myosin interaction seems likely, because in these cells a strong motile force is required to work against a relatively strong adhesive force (Oliver et al., 1994). In heart fibroblasts myosin II is localized to actin bundles (Fig. 2, a–c) which from their position we know are mostly graded polarity actin bundles. Thus myosin II may interact with actin in graded polarity actin bundles to generate motile force for cell body motility.
But how might this occur? Some clues are provided by our structural and dynamic studies of actin in these bundles. We observe in the cell body of locomoting fibroblasts that a population of actin filaments moves forward with respect to substrate at the same rate as the cell body, and that another actin filament population remains stationary (Fig. 9, a–f and Fig. 10 a). We suggest that myosin moves one population of actin filaments forward over a second stationary population to generate motile force for forward movement of the cell body and nucleus during cell locomotion (Fig. 10 b). What is the nature of this motile force? While determining this goes beyond the scope of this paper, there are two extreme possibilities. The first is that it is analogous to muscle contraction, where within a single muscle sarcomere, interdigitating actin filaments of opposite polarity slide in opposite directions. In this case within a single graded polarity actin bundle, filaments of opposite polarity would have the potential to slide. An alternate model which we prefer is that myosin acts on the surface of the graded polarity actin bundle, pulling other actin over this surface. In this view the graded polarity actin bundle is acting more like a transport bundle rather than a sarcomere. To distinguish between these possibilities several types of experiments are required. In particular we need to correlate the dynamic with the structural actin populations in the cell body. Also the ultrastructure and dynamics of myosin in graded polarity actin bundles need to be investigated.
Actin filaments in graded polarity actin bundles in the cell anterior have on average reverse polarity to those in the cell posterior (barbed ends of filaments face the nearest cell margin, as drawn in Fig. 10 b). Thus motile force in graded polarity actin bundles could potentially be generated toward either the anterior or posterior of the cell. This fits Harris's idea that fibroblast locomotion is a continual tug-of-war between opposing forces (Harris et al., 1980; Harris, 1991, 1994). Opposing motile force in graded polarity actin bundles would help the cell maintain a spread morphology during cell locomotion, preventing the cell from bunching up. We do not yet know what limits a fibroblast to locomotion in one direction. One possibility is that there is a bias for the total number of filaments that have barbed ends facing the anterior of the cell, over the cell as a whole. This is because the anterior half of the cell is wider with relatively more actin bundles than the posterior. Adhesion and its reversal may also limit the direction of locomotion. We note that in locomoting fibroblasts there are more contacts with the substrate in the cell anterior than the cell posterior (Heath and Dunn, 1978; Couchman and Rees, 1979).
Possible Roles for Alternating Polarity Actin Bundles in Locomoting Fibroblasts
The less abundant group of actin filaments in locomoting cells has alternating polarity, the same organization known for muscle sarcomeres. This organization suggests that these bundles generate contractile force, as in muscle. Thus actin filaments are expected to move in opposite directions as filaments of opposite polarity slide past each other. In preliminary marking experiments on side cell margins in locomoting fibroblasts where most of the alternating polarity subplasma membrane actin bundles reside (Table II) we found that the actin mark moves in opposite directions (actin marks shear in 4/5 cells).
What is the function of alternating polarity actin bundles in locomoting fibroblasts? They may contribute to the generation of motile force for cell body motility. We think any contribution is likely to be minor because alternating polarity actin bundles comprise a small fraction of the total actin bundles in the cell, are not well organized, and are not directly connected to the ventral surface. A more compelling possibility is that since almost all the alternating polarity actin bundles are found on the inner surface of the plasma membrane they are primarily responsible for generating cortical tension and maintaining the overall shape of the cell body during cell locomotion. This provides structural evidence for the genetic data that myosin II is required for cortical tension (Pasternak et al., 1989).
Another possibility is that contractile force in alternating polarity actin bundles contributes to tail retraction in locomoting fibroblasts. This idea has been proposed for fibroblasts in the past (Chen, 1981; Small, 1989) and in general for locomoting cells (Lauffenburger and Horwitz, 1996). The possibility is consistent with a role for myosin II in retracting tails of amoeba (Jay et al., 1995). Contractile force alone is probably insufficient to drive retraction, because in preliminary studies in locomoting fibroblasts we note that the rate of shearing of subplasma membrane alternating polarity actin bundles is slower than tail retraction. Other possible contributing forces for retraction are: forward motility of the cell body which may simply pull the tail forward, a notion supported by some correlation between the rates of traction and retraction in individual fibroblasts (Cramer, L.P., and T.J. Mitchison, unpublished data) and/or regulation of adhesion.
Footnotes
We thank: Marc Symons, Matthew Welch, and the reviewers for thoughtfully reading the manuscript and for excellent suggestions, and also Marc for encouragement thoughout the course of this work; Aneil Mallavarapu for help on the cooled-charged coupled device microscope system and for good ideas to present Fig. 1, e and f; Kathy Franks and Roger Cooke for providing us with excellent S1 myosin preparations; Anthony Bretscher for kindly sending us anti-fimbrin antibodies, and Arshad Desai for instruction on the Nikon microscope.
This study was funded by grant GM48027 from the National Institutes of Health and a fellowship from the Packard Foundation to T.J. Mitchison, and a senior postdoctoral fellowship from the American Cancer Society, California Division to L.P. Cramer.
1. Abbreviation used in this paper: PtK2, potoroo tridactylis kidney.
Please address all correspondence to L.P. Cramer, The Randall Institute, Kings College London, University of London, 26-29 Drury Lane, London WC2B 5RL, UK. Tel.: (44)171-465-5377, Fax.: (44) 171-497-9078. E-mail: louise.cramer@kcl.ac.uk
References
- Abercrombie M. The crawling movements of metazoan cells. Proc R Soc Lond Ser B. 1980;207:129–147. [Google Scholar]
- Abercrombie M, Heaysman JE, Pegrum SM. The locomotion of fibroblasts in culture. II “Ruffling”. Exp Cell Res. 1970;60:437–444. doi: 10.1016/0014-4827(70)90537-9. [DOI] [PubMed] [Google Scholar]
- Begg DA, Rodewald R, Rebhun LI. The visualization of actin filament polarity in thin sections. J Cell Biol. 1978;79:846–852. doi: 10.1083/jcb.79.3.846. [DOI] [PMC free article] [PubMed] [Google Scholar]
- Boyles J, Anderson L, Hutcherson P. A new fixative for the preservation of actin filaments: fixation of pure actin filament pellets. J Histochem Cytochem. 1985;33:1116–1128. doi: 10.1177/33.11.3902963. [DOI] [PubMed] [Google Scholar]
- Bretscher A. Fimbrin is a cytoskeletal protein that crosslinks F-actin in vitro. Proc Natl Acad Sci USA. 1981;78:6849–6853. doi: 10.1073/pnas.78.11.6849. [DOI] [PMC free article] [PubMed] [Google Scholar]
- Byers, H.R., G.E. White, and K. Fujiwara. 1984. Organization and function of stress fibers in cells in vitro and in situ. In Cell and Motility. Vol. 5. J.W. Shay, editor. Plenum Publishing Corp., New York. 83–137. [DOI] [PubMed]
- Chen WT. Mechanism of retraction of the trailing edge during fibroblast movement. J Cell Biol. 1981;90:187–200. doi: 10.1083/jcb.90.1.187. [DOI] [PMC free article] [PubMed] [Google Scholar]
- Couchman JR, Rees DA. The behavior of fibroblasts migrating from chick heart explants: changes in adhesion, locomotion, and growth in the distribution of actomyosin and fibronectin. J Cell Sci. 1979;39:149–165. doi: 10.1242/jcs.39.1.149. [DOI] [PubMed] [Google Scholar]
- Cramer LP, Mitchison TJ. Moving and stationary actin filaments are involved in spreading of postmitotic PtK2 cells. J Cell Biol. 1993;122:833–843. doi: 10.1083/jcb.122.4.833. [DOI] [PMC free article] [PubMed] [Google Scholar]
- Cramer LP, Mitchison TJ. Myosin is involved in postmitotic cell spreading. J Cell Biol. 1995;131:179–189. doi: 10.1083/jcb.131.1.179. [DOI] [PMC free article] [PubMed] [Google Scholar]
- Cramer LP, Mitchison TJ. Investigation of the mechanism of retraction of the cell margin and rearward flow of nodules during mitotic cell rounding. Mol Biol Cell. 1997;8:109–119. doi: 10.1091/mbc.8.1.109. [DOI] [PMC free article] [PubMed] [Google Scholar]
- Cramer LP, Mitchison TJ, Theriot JA. Actin-dependent motile forces and cell motility. Curr Opin Cell Biol. 1994;6:82–86. doi: 10.1016/0955-0674(94)90120-1. [DOI] [PubMed] [Google Scholar]
- Crowley E, Horwitz AF. Tyrosine phosphorylation and cytoskeletal tension regulate the release of fibroblast adhesions. J Cell Biol. 1995;131:525–537. doi: 10.1083/jcb.131.2.525. [DOI] [PMC free article] [PubMed] [Google Scholar]
- Dai J, Sheetz MP. Axon membrane flows from the growth cone to the cell body. Cell. 1995;83:693–701. doi: 10.1016/0092-8674(95)90182-5. [DOI] [PubMed] [Google Scholar]
- DeRosier D, Mandelkow E, Silliman A, Tilney L, Kane R. Structure of actin-containing filaments from two types of non-muscle cells. J Mol Biol. 1977;113:679–695. doi: 10.1016/0022-2836(77)90230-3. [DOI] [PubMed] [Google Scholar]
- Doolittle KW, Reddy I, McNally JG. 3D analysis of cell movement during normal and myosin-II-null cell morphogenesis in dictyostelium. Dev Biol. 1995;167:118–129. doi: 10.1006/dbio.1995.1011. [DOI] [PubMed] [Google Scholar]
- Dunlevy JR, Couchman JR. Controlled induction of focal adhesion disassembly and migration in primary fibroblasts. J Cell Sci. 1993;105:489–500. doi: 10.1242/jcs.105.2.489. [DOI] [PubMed] [Google Scholar]
- Forscher P, Smith SJ. Actions of cytochalasins on the organization of actin filaments and microtubules in a neuronal growth cone. J Cell Biol. 1988;107:1505–1516. doi: 10.1083/jcb.107.4.1505. [DOI] [PMC free article] [PubMed] [Google Scholar]
- Grebecki A. Membrane and cytoskeletal flow in motile cells with emphasis on the contribution of free-living amoeba. Int Rev Cytol. 1994;148:37–79. [Google Scholar]
- Harris, A.K. 1973. Cell surface movements related to cell locomotion. In Locomotion of Tissue Cells. CIBA Foundation Symposium. Vol. 14. R. Porter and D. W. Fitzsimmons, editors. Elsevier, Amsterdam. pp. 3–26. [DOI] [PubMed]
- Harris, A.K. 1991. Physical forces and pattern formation in limb development. In Developmental Patterning of the Vertebrate Limb. J.R. Hinchliffe, editor. Plenum Publishing Corp., New York. pp. 203–210.
- Harris AK. Locomotion of tissue culture cells considered in relation to ameboid locomotion. Int Rev Cytol. 1994;150:35–68. doi: 10.1016/s0074-7696(08)61536-3. [DOI] [PubMed] [Google Scholar]
- Harris AK, Wild P, Stopak D. Silicone rubber substrata: a new wrinkle in the study of cell locomotion. Science (Wash DC) 1980;208:177–179. doi: 10.1126/science.6987736. [DOI] [PubMed] [Google Scholar]
- Hayat, M.A. 1989. Principles and Techniques of Electron Microscopy. Biological Applications. Van Nostrand Reinhold Company, New York. pp. 313–315.
- Heath JP. Behavior and structure of the leading lamella in moving fibroblasts. I. Occurrence and centripetal movement of arc-shaped microfilament bundles beneath the dorsal cell surface. J Cell Sci. 1983;60:331–354. doi: 10.1242/jcs.60.1.331. [DOI] [PubMed] [Google Scholar]
- Heath JP, Dunn GA. Cell to substratum contacts of chick fibroblasts and their relation to the microfilament system. A correlated interference-reflexion and high-voltage electron microscope study. J Cell Sci. 1978;29:197–212. doi: 10.1242/jcs.29.1.197. [DOI] [PubMed] [Google Scholar]
- Heath JP, Holifield BF. Cell locomotion: New research tests old ideas on membrane and cytoskeletal flow. Cell Motil Cytoskeleton. 1991;18:245–257. doi: 10.1002/cm.970180402. [DOI] [PubMed] [Google Scholar]
- Huxley HE. Muscular contraction and cell motility. Nature (Lond) 1973;243:445–449. doi: 10.1038/243445a0. [DOI] [PubMed] [Google Scholar]
- Jay PY, Pharm PA, Wong SA, Elson EL. A mechanical function of myosin-II in cell motility. J Cell Sci. 1995;108:387–393. doi: 10.1242/jcs.108.1.387. [DOI] [PubMed] [Google Scholar]
- Kucik DF, Elson EL, Sheetz MP. Cell migration does not produce membrane flow. J Cell Biol. 1990;111:1617–1622. doi: 10.1083/jcb.111.4.1617. [DOI] [PMC free article] [PubMed] [Google Scholar]
- Kucik DF, Kuo SC, Elson EL, Sheetz MP. Preferential attachment of membrane glycoproteins to the cytoskeleton at the leading edge of lamella. J Cell Biol. 1991;114:1029–1036. doi: 10.1083/jcb.114.5.1029. [DOI] [PMC free article] [PubMed] [Google Scholar]
- Lauffenburger DA, Horwitz AF. Cell migration: a physically integrated molecular process. Cell. 1996;84:359–369. doi: 10.1016/s0092-8674(00)81280-5. [DOI] [PubMed] [Google Scholar]
- Lewis, W.H., and M.R. Lewis. 1924. Behavior of cells in tissue cultures. In General Cytology. E.V. Cowdry, editor. The University of Chicago Press, Chicago, IL. 385–447.
- Lewis AK, Bridgman PC. Nerve growth cone lamellipodia contain two populations of actin filaments that differ in organization and polarity. J Cell Biol. 1992;119:1219–1243. doi: 10.1083/jcb.119.5.1219. [DOI] [PMC free article] [PubMed] [Google Scholar]
- Lin C-H, Forscher P. Growth cone advance is inversely proportional to retrograde F-actin flow. Neuron. 1995;14:763–771. doi: 10.1016/0896-6273(95)90220-1. [DOI] [PubMed] [Google Scholar]
- Lin C-H, Espreafico EM, Mooseker MS, Forscher P. Myosin drives retrograde F-actin flow in neuronal growth cones. Neuron. 1996;16:769–782. doi: 10.1016/s0896-6273(00)80097-5. [DOI] [PubMed] [Google Scholar]
- McDonald K. Osmium ferricyanide fixation improves microfilament preservation and membrane preservation in a variety of animal cell types. J Ultrastruct Res. 1984;86:107–118. doi: 10.1016/s0022-5320(84)80051-9. [DOI] [PubMed] [Google Scholar]
- Matsudaira P, Mandelkow E, Renner W, Weber K. Role of fimbrin and villin in determining the interfilament distances of actin bundles. Nature (Lond) 1983;301:209–214. doi: 10.1038/301209a0. [DOI] [PubMed] [Google Scholar]
- Mitchison TJ, Cramer LP. Actin based cell motility and cell locomotion. Cell. 1996;84:371–379. doi: 10.1016/s0092-8674(00)81281-7. [DOI] [PubMed] [Google Scholar]
- Nakazawa H, Sekimoto K. Polarity sorting in a bundle of actin filaments by two-headed myosins. J Phys Soc Jpn. 1996;65:2404–2407. [Google Scholar]
- Okabe S, Hirokawa N. Actin dynamics in growth cones. J Neurosci. 1991;11:1918–1929. doi: 10.1523/JNEUROSCI.11-07-01918.1991. [DOI] [PMC free article] [PubMed] [Google Scholar]
- Oliver T, Lee J, Jacobson K. Forces exerted by locomoting cells. Semin Cell Biol. 1994;5:139–147. doi: 10.1006/scel.1994.1018. [DOI] [PubMed] [Google Scholar]
- Pasternak C, Spudich JA, Elson EL. Capping of surface receptors and concomitant cortical tension are generated by conventional myosin. Nature (Lond) 1989;341:549–551. doi: 10.1038/341549a0. [DOI] [PubMed] [Google Scholar]
- Sanger JM, Sanger JW. Banding and polarity of actin filaments in interphase and cleaving cells. J Cell Biol. 1980;86:568–575. doi: 10.1083/jcb.86.2.568. [DOI] [PMC free article] [PubMed] [Google Scholar]
- Sanger JW, Sanger JM, Jockusch BM. Differences in the stress fibers between fibroblasts and epithelial cells. J Cell Biol. 1983;96:961–969. doi: 10.1083/jcb.96.4.961. [DOI] [PMC free article] [PubMed] [Google Scholar]
- Sheetz MP. Cell migration by graded attachment to substrates and contraction. Semin Cell Biol. 1994;5:149–155. doi: 10.1006/scel.1994.1019. [DOI] [PubMed] [Google Scholar]
- Small JV. Organization of actin in the leading edge of cultured cells: influence of osmium tetroxide and dehydration on the ultrastructure of actin meshworks. J Cell Biol. 1981;91:695–705. doi: 10.1083/jcb.91.3.695. [DOI] [PMC free article] [PubMed] [Google Scholar]
- Small JV. The actin cytoskeleton. Electron Microsc Rev. 1988;1:155–174. doi: 10.1016/s0892-0354(98)90010-7. [DOI] [PubMed] [Google Scholar]
- Small JV. Microfilament-based motility in non-muscle cells. Curr Opin Cell Biol. 1989;1:75–79. doi: 10.1016/s0955-0674(89)80040-7. [DOI] [PubMed] [Google Scholar]
- Small JV, Isneberg G, Celis JE. Polarity of actin at the leading edge of cultured cells. Nature (Lond) 1978;272:638–639. doi: 10.1038/272638a0. [DOI] [PubMed] [Google Scholar]
- Small JV, Herzog M, Anderson K. Actin filament organization in the fish keratocyte lamellipodium. J Cell Biol. 1995;129:1275–1286. doi: 10.1083/jcb.129.5.1275. [DOI] [PMC free article] [PubMed] [Google Scholar]
- Symons MH, Mitchison TJ. Control of actin polymerization in live and permeabilized fibroblasts. J Cell Biol. 1991;114:503–513. doi: 10.1083/jcb.114.3.503. [DOI] [PMC free article] [PubMed] [Google Scholar]
- Theriot JA, Mitchison TJ. Actin microfilament dynamics in locomoting cells. Nature (Lond) 1991;352:126–131. doi: 10.1038/352126a0. [DOI] [PubMed] [Google Scholar]
- Theriot JA, Mitchison TJ. Comparison of actin and cell surface dynamics in motile fibroblasts. J Cell Biol. 1992;118:367–377. doi: 10.1083/jcb.119.2.367. [DOI] [PMC free article] [PubMed] [Google Scholar]
- Tilney LG, DeRosier DJ, Weber A, Tilney MS. How Listeria exploits host cell actin to form its own cytoskeleton. II. Nucleation, actin filament polarity, filament assembly, and evidence for a pointed end capper. J Cell Biol. 1992;118:83–93. doi: 10.1083/jcb.118.1.83. [DOI] [PMC free article] [PubMed] [Google Scholar]
- Verkhovsky AB, Svitkina TM, Borisy GG. Myosin II filament assemblies in the active lamella of fibroblasts: their morphogenesis and role in the formation of actin filament bundles. J Cell Biol. 1995;131:989–1002. doi: 10.1083/jcb.131.4.989. [DOI] [PMC free article] [PubMed] [Google Scholar]
- Wang Y-L. Exchange of actin subunits at the leading edge of living fibroblasts: possible role of treadmilling. J Cell Biol. 1985;101:597–602. doi: 10.1083/jcb.101.2.597. [DOI] [PMC free article] [PubMed] [Google Scholar]
- Weber K, Groeschel-Stewart U. Antibody to myosin: the specific visualization of myosin-containing filaments in nonmuscle cells. Proc Natl Acad Sci USA. 1974;71:4561–4564. doi: 10.1073/pnas.71.11.4561. [DOI] [PMC free article] [PubMed] [Google Scholar]
- Wessels D, Soll DR, Knecht D, Loomis WF, De Lozanne A, Spudich J. Cell motility and chemotaxis in Dictyostelium amebae lacking myosin heavy chain. Dev Biol. 1988;128:164–177. doi: 10.1016/0012-1606(88)90279-5. [DOI] [PubMed] [Google Scholar]


