Abstract
The Golgi apparatus of HeLa cells was fluorescently tagged with a green fluorescent protein (GFP), localized by attachment to the NH2-terminal retention signal of N-acetylglucosaminyltransferase I (NAGT I). The location was confirmed by immunogold and immunofluorescence microscopy using a variety of Golgi markers. The behavior of the fluorescent Golgi marker was observed in fixed and living mitotic cells using confocal microscopy. By metaphase, cells contained a constant number of Golgi fragments dispersed throughout the cytoplasm. Conventional and cryoimmunoelectron microscopy showed that the NAGT I–GFP chimera (NAGFP)-positive fragments were tubulo-vesicular mitotic Golgi clusters. Mitotic conversion of Golgi stacks into mitotic clusters had surprisingly little effect on the polarity of Golgi membrane markers at the level of fluorescence microscopy. In living cells, there was little self-directed movement of the clusters in the period from metaphase to early telophase. In late telophase, the Golgi ribbon began to be reformed by a dynamic process of congregation and tubulation of the newly inherited Golgi fragments. The accuracy of partitioning the NAGFP-tagged Golgi was found to exceed that expected for a stochastic partitioning process. The results provide direct evidence for mitotic clusters as the unit of partitioning and suggest that precise regulation of the number, position, and compartmentation of mitotic membranes is a critical feature for the ordered inheritance of the Golgi apparatus.
The interphase Golgi apparatus in a typical mammalian cell occupies a juxtanuclear, usually pericentriolar location (Farquhar and Palade, 1981). Each unit comprises a stack of disk-shaped membranes, termed cisternae, bounded on each face by extensive tubular– reticular networks termed the cis-Golgi network (CGN) and the trans-Golgi network (TGN) (Mellman and Simons, 1992). Units are linked laterally, through tubules that join equivalent cisternae in the adjacent stacks, forming a ribbon that bifurcates and rejoins, yielding a compact, interconnected reticulum (Lucocq et al., 1987; Rambourg et al., 1987).
The Golgi apparatus contains the enzymes required for selective, sequential modification of protein- and lipidbound oligosaccharides en route from the ER (Roth, 1987). The CGN, at the entry face, is also involved in protein folding and quality control, as well as the recycling of proteins between the ER and Golgi apparatus (Hauri and Schweizer, 1992; Hurtley and Helenius, 1989; Pelham, 1995). The TGN, at the exit face, is involved in sorting and packaging proteins and lipids for different destinations (Griffiths and Simons, 1986). Because of its intricate architecture, restricted cellular location, and extensive compartmentation, the Golgi apparatus represents a unique challenge to understanding how cells coordinate the maintenance of organelle structure and function with the need to propagate low–copy number organelles during the cell division cycle (Warren, 1993; Warren and Wickner, 1996).
Extensive ultrastructural observations provided the initial insight into how the mitotic HeLa cell accomplished the inheritance of Golgi membranes. Fragmentation of the Golgi ribbon commences during prophase (Burke et al., 1982), and by metaphase, Golgi stacks are uniformly converted into a collection of vesicles and tubules (Lucocq et al., 1987). These were termed Golgi clusters, and quantitative stereology suggested that by telophase there was nearly equal partitioning of these clusters between the two daughter cells (Lucocq and Warren, 1987). Further microscopic studies showed that in metaphase cells, there was an inverse relationship between the volume occupied by clusters of Golgi membrane and that occupied by vesicles (Lucocq et al., 1989). This suggested that Golgi clusters shed vesicles into the surrounding mitotic cytoplasm as mitosis proceeded.
Cell-free assays that mimicked the disassembly of the Golgi apparatus gave further insight into this process. Disassembly occurs by two distinct pathways (Misteli and Warren, 1994; Misteli and Warren, 1995b ). The first interrupts the normal flow of COP I transport vesicles as they carry cargo and receptors both forwards and backwards through the Golgi stack (Letourneur et al., 1994; Rothman, 1994). Vesicle budding from the cisternal rims continues, but fusion appears to be inhibited. The vesicle docking protein p115 (Waters et al., 1992; Barroso et al., 1995) binds less avidly to mitotic Golgi membranes in vitro (Levine et al., 1996), suggesting that the docking of vesicles with their target membrane is the inhibited step. Continued budding in the absence of docking (and hence fusion) consumes up to two-thirds of Golgi membrane (Misteli and Warren, 1995b ), and the vesicles that form are depleted in resident Golgi enzymes (Sönnichsen et al., 1996). The second disassembly pathway consumes the remaining membrane, containing the bulk of the resident enzymes (Sönnichsen et al., 1996). Cisternae become increasingly fenestrated, forming tubular networks that variably break down into tubules and a heterogeneous population of vesicles larger then those produced by the COP I–dependent pathway (Misteli and Warren, 1995b ). These membrane fragments are most likely derived from the central, core regions of stacked cisternae (Warren et al., 1995).
Fragmentation of the Golgi apparatus is thought to facilitate the partitioning process (Warren, 1993). Accurate cytokinetic mechanisms exist to divide the mother cell into two equally sized daughters (Rappaport, 1986) so that any organelle, present in multiple copies, could be inherited by a stochastic process (Birky, 1983). The accuracy of this process would be dependent on two key features of the organelle: the number of organelle units and how evenly the units are dispersed throughout the cytoplasm. The more units there are and the more evenly they are dispersed, the higher the accuracy of stochastic partitioning. For the Golgi apparatus, there are two candidates for the partitioning unit: the Golgi cluster or the shed vesicles. Stereological estimates put the number of Golgi clusters between 150 and 250 (Lucocq and Warren, 1987; Lucocq et al., 1989). In contrast, interpolation of the EM data suggests that up to 10,000 Golgi-derived vesicles could be released into the mitotic cell cytoplasm (Lucocq et al., 1989), resulting in a theoretical accuracy of partitioning of 50 ± 1.5% (Warren, 1993). Moreover, if passive diffusion were the only distribution process, then vesicles should randomize more rapidly than Golgi stacks or clusters. Together, these data suggested that the Golgi-derived vesicle represented the unit of stochastic partitioning.
It has proven difficult to test this hypothesis rigorously using microscopic methods. Unless single, thin sections are routinely assembled into three-dimensional, whole cell images, ultrastructural techniques provide a limited perspective from which to evaluate the relationship between vesicles and tubules within the clusters and the spatial arrangement of the clusters within the cell during mitosis. Earlier attempts were also limited by the difficulty in identifying clusters and vesicles unambiguously (Lucocq and Warren, 1987; Lucocq et al., 1989). Furthermore, analysis of fixed cells does not provide a direct means of observing the progress of Golgi partitioning; in particular, the behavior and fate of individual Golgi components cannot be assessed.
These problems would be solved if the Golgi apparatus could be visualized in the living cell. Short chain fluorescent ceramides have been used, but the limited time they spend in the Golgi and their susceptibility to bleaching (Lipsky and Pagano, 1985) has precluded studies during the cell cycle. This problem has been overcome by exploiting the properties of the green fluorescent protein (GFP)1 (Chalfie et al., 1994), which has recently been used as a tag to study the membrane mobility of resident Golgi proteins (Cole et al., 1996b ). We have prepared stable HeLa cell lines expressing GFP attached to the retention domain of the resident Golgi enzyme, N-acetylglucosaminyltransferase I (NAGT I). Using confocal microscopy, we have been able to study the behavior of the GFP-tagged Golgi apparatus during mitosis.
Materials and Methods
cDNA Encoding the NAGT I–GFP Chimera
A modified GFP cDNA (Cormack et al., 1996; GFP mutant 2, kindly provided by Brendan Cormack, Stanford University, CA, and containing the following amino acid substitutions: S65A, V68L, S72A) was placed downstream of sequences encoding the cytoplasmic, transmembrane, and stalk region of human NAGT I. Briefly, the termini of the GFP coding region (amino acids 2–238) were altered to incorporate MluI sites and an NH2terminal myc epitope by PCR (Saiki et al., 1988). The myc-GFP PCR fragment was inserted in-frame into a unique MluI site placed downstream of sequences encoding amino acids 1–103 of NAGT I to yield the NAGT I–GFP (NAGFP) chimera. Finally, a BamHI fragment, encoding the fulllength NAGFP chimera, was subcloned into the mammalian expression vector pRcCMV (InVitrogen, San Diego, CA) to yield the plasmid pCNG2. This construct places the NAGFP chimera under the control of the cytomegalovirus (CMV) promoter/enhancer and permits stable selection of cell clones using G418.
HeLa Cell Lines
HeLa cells were grown as monolayers in DME/high glucose (GIBCO BRL, Gaithersburg, MD) supplemented with 10% FCS (Sigma Chemical Co., St. Louis, MO), penicillin/streptomycin (100 μg/ml), and 2 mM glutamine. Subconfluent cells were transfected with 25 μg of highly purified (Qiagen, Chatsworth, CA) pCNG2 plasmid DNA using a calcium phosphate precipitation protocol (Ponnambalam et al., 1994). 24 h after removal of the precipitate, cells were trypsinized, plated at clonal density, and selected in 0.50–1.0 mg/ml Geneticin. After 10 d, surviving cell colonies were isolated and screened visually for Golgi-localized fluorescence. No positive clones were obtained after screening ∼200 G418-selected colonies. However, when the same population of clones was rescreened after overnight incubation with 5 mM sodium butyrate to enhance transgene transcription levels (Gorman and Howard, 1983; Olson et al., 1995), several positive clones were identified and expanded into cell lines for further analysis.
FACS® Analysis
Analysis of baseline and butyrate-stimulated fluorescence in living cells was performed by the Imperial Cancer Research Fund (ICRF) FACS® Laboratory using a FACScan® analyzer (Becton-Dickinson Immunocytometry Sys., Mountain View, CA) and data were analyzed and plotted using CellQuest software.
SDS-PAGE and Western Blotting
Cells were extracted on ice for 30 min in 50 mM Tris-Cl, pH 8.0, 200 mM NaCl, 0.5% Triton X-100, 1.0 mM EDTA, 1.0 mM PMSF, 1 μg/ml leupeptin and benzamidine. After a 1,000-g centrifugation at 4°C, the concentration of total protein in the supernatant fractions was quantitated using the BCA colorimetric assay (Pierce, Rockford, IL), and 10 μg of total protein was resolved by SDS-PAGE under reducing conditions. Proteins were transferred to nitrocellulose using a semidry electroblotter (Millipore Corp., Bedford, MA), filters were blocked, and antibodies were applied in a solution of PBS, 0.2% Tween-20, and 5% nonfat milk protein (Marvel Premier Brands, Stafford, UK). Affinity-purified antisera recognizing GFP was kindly provided by Dr. Ken Sawin (Cell Cycle Laboratory, ICRF), and monoclonal antibodies recognizing human p97 were originally raised against Xenopus laevis p97 and were kindly provided by Dr. JanMichael Peters (Institute of Molecular Pathology, Vienna, Austria). Primary antibodies were detected using HRP-conjugated secondary antibodies and chemiluminescent detection (ECL; Amersham Corp., Arlington Heights, IL).
Fluorescence Microscopy
Fixed Cells.
Cells on coverslips were fixed for 6 min in −20°C methanol, washed in Ca2+-Mg2+-free PBS and either mounted in glycerol/PBS (90: 10) and visualized for GFP fluorescence or processed for immunocytochemistry as described (Nilsson et al., 1994). After staining, fixed samples were incubated in 200 ng/ml of Hoechst 33342, washed extensively in PBS, and mounted as above. Antibodies used in this study were: affinitypurified rabbit antisera to rat GM130 (Nakamura et al., 1995; kindly provided by Dr. Nobuhiro Nakamura, Cell Biology Laboratory, ICRF); affinity-purified rabbit antisera to human giantin (Seelig et al., 1994; kindly provided by Prof. Manfred Renz, Institute of Immunology and Molecular Genetics, Karlsruhe, Germany); rabbit antisera to rat mannosidase II (Moremen et al., 1991; kindly provided by Dr. Kelly Moremen, University of Georgia, Athens, GA); rabbit antisera to human TGN 46 (Ponnambalam et al., 1996; provided by Dr. Vas Ponnambalam, University of Dundee, Scotland); a monoclonal antibody raised to bovine p115 (Waters et al., 1992; kindly provided by Dr. Gerry Waters, Princeton University, Princeton, NJ); and antibodies to GFP (see above). Rhodamine- and fluorescein-conjugated secondary antibodies were obtained from Tago Immunochemicals (Burlingame, CA), and Cy5-conjugated secondary antibodies were obtained from Jackson ImmunoResearch (West Grove, PA).
To permit comparison of the distribution of TGN46 and GM130 (both localized using rabbit antisera), an IgG fraction of GM130 antisera was directly conjugated to a mono-functional amine reactive Cy3 fluorophore (1:3 final ratio of antibody to fluorophore) according to the manufacturers protocol (CyDye; Amersham Corp.). Immunocytochemistry was carried out as described above, except the Cy3-labeled GM130 IgG was applied after incubation of fixed specimens with TGN46 antisera, a fluoresceinconjugated secondary antibody, and a 10-min incubation in 100 μg/ml rabbit sera to quench free binding sites found on the secondary antibody.
Primary human keratinocytes (kindly provided by Christiana Ruhrberg, ICRF) were fixed as above and viewed by laser scanning confocal microscopy as described above.
Images were collected using a laser scanning confocal microscope (model MRC-1000; BioRad Labs, Hercules, CA) (60× Plan-Apo 1.4 NA phase objective lens). Unless otherwise noted, each interphase and mitotic fixed cell image represents a single Kalman-averaged (8 scan) image obtained with a 1–2-mm-diam iris aperture. All images were collected within a linear range of fluorescence intensity based on the values of a standardized look-up table provided with the Comos confocal imaging software (BioRad Labs). Image overlays are representative examples of samples acquired using either the sequential or simultaneous collection mode for double-label image collection. The integrity of the image merge function was confirmed by the consistent ability to align the GFP-based fluorescence of the NAGFP protein and the rabbit antisera to GFP visualized with a rhodamine-conjugated secondary antibody (see Figs. 5 and 8). For determination of average apparent mitotic cluster number and size distribution, mitotic cells were enriched in the population by a double G1/S block and release protocol (see below), fixed, and mounted as described. Metaphase cells were identified by visualizing DNA with Hoechst 33342; serial optical sections (images collected at 0.5-μm intervals) in the z-axis of the cell were collected and overlaid, and the number of fluorescent Golgi clusters was counted. Fluorescent structures >0.2 μm in apparent diameter were scored as a Golgi fragment. Apparent size distribution was estimated for the same collection of metaphase cells by measuring the long axis of fluorescent structures within a randomly selected cytoplasmic field.
Figure 5.
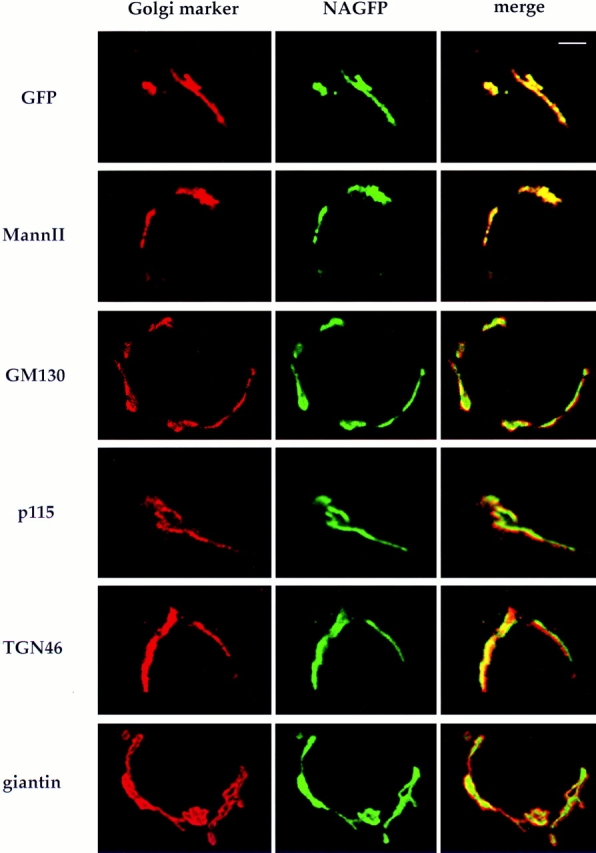
Localization of NAGFP with Golgi markers by immunofluorescence microscopy. NAGFP-HeLa cells were fixed and labeled with antibodies to the indicated Golgi proteins (left) followed by secondary antibodies coupled to rhodamine. The corresponding images for GFP fluorescence are shown in the middle panels and the overlays in the right panels. Yellow indicates the region of overlap. Bar, 5 μm.
Figure 8.
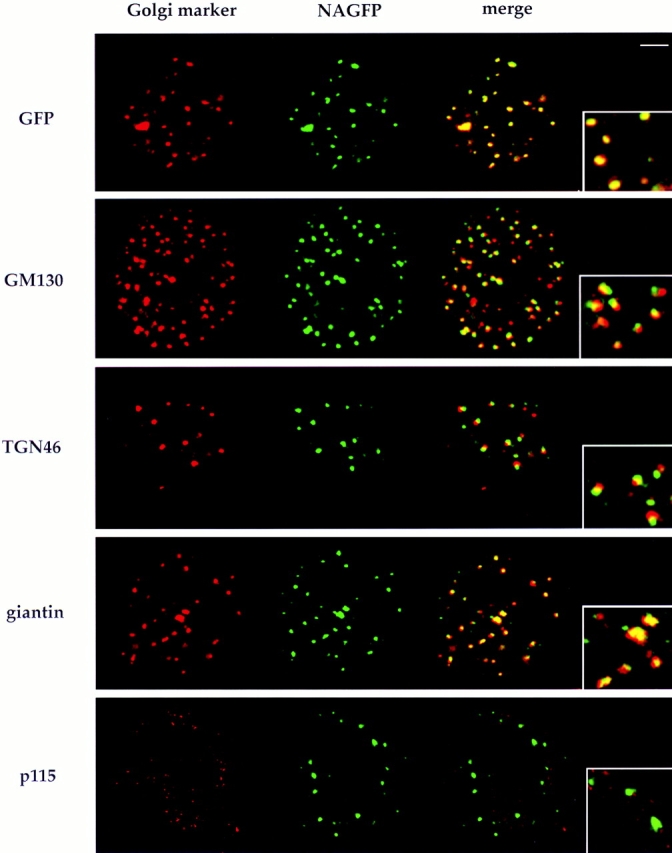
Polarity of mitotic Golgi clusters. NAGFP-HeLa cells were fixed and labeled with antibodies to the indicated Golgi proteins (left) followed by secondary antibodies coupled to rhodamine. The corresponding images for GFP fluorescence are shown in the middle images and the overlays in the right images. Metaphase cells are shown in all images. The insets show a 2.5-fold–magnified view derived from a region of the overlaid images. Bar, 5 μm.
Comparison of relative fluorescence intensity in telophase daughter cells was accomplished using National Institutes of Health Image v. 1.6 software (Bethesda, MD). Serial sections through the z-axis of a late telophase daughter cell pair (n = 13 pairs) were collected and overlaid, and then the threshold level of analysis was adjusted to specifically highlight fluorescent Golgi fragments in the daughter cell pair. The fluorescence intensity was determined for highlighted Golgi fragments in each individual cell. The mean fluorescence intensities from three distinct measurements for each cell pair were compared, and these data were used to calculate the standard deviation and variation of accuracy values relative to the theoretical optimum of a 1:1 partitioning of mitotic Golgi membranes.
Living Cells.
Cells were plated on No. 1.5 coverglass thickness glassbottomed dishes (Bioptechs), equilibrated, and visualized in phenol redfree, low bicarbonate (0.35 g/liter) media supplemented with 20 mM Hepes, pH 7.4, and 10% FCS, overlaid with high-grade mineral oil (Sigma Chemical Co.). A constant 37°C environment was maintained using a Bioptechs live-cell chamber and temperature controller. Serial sections (at 1.25–1.5-μm intervals) in the z-axis of cells were collected using a laser scanning confocal microscope (model MRC-1000; BioRad Labs). A combination of low laser power settings (⩽1%), a 4–5-mm-diam aperture, and rapid scanning (5 Kalman-averaged images over a 384 × 256-pixel field) permitted sufficient visualization of fluorescent structures while also allowing progression of cells through M-phase.
All fixed and live cell images were processed using Adobe Photoshop 3.0 and printed at ⩾300 dpi.
Enrichment for Mitotic Cells
Cells were pulsed with 2.5 mM thymidine (Sigma Chemical Co.) for 14 h, washed, allowed to progress through S-phase for 8 h, and then accumulated a second time at the G1/S border with 2.5 μg/ml aphidicolin (Calbiochem, La Jolla, CA) for 14 h (Heintz et al., 1983). Cells were washed extensively and incubated in normal media supplemented with 5.0 mM butyrate for 11–12 h, at which time cells were processed for either electron or confocal light microscopy. Quantitation of Hoechst-stained DNA confirmed that 12 h after aphidicolin washout, ∼50% of cells were in the M-phase of the cell cycle.
Electron Microscopy
Interphase and mitotic cells were prepared for Epon embedding or processed for cryo-immuno–EM as previously described (Rabouille et al., 1995). Cryo-immuno–EM was performed using affinity-purified antisera to GFP (see above) followed by secondary antibodies conjugated to 10nm gold particles. Metaphase cells (enriched as described above) were identified at low power by their rounded morphology, the absence of a nuclear envelope, and the appearance of condensed chromatin (Lucocq et al., 1987). To compare the number of Golgi mitotic clusters and stacks present in metaphase NAGFP-HeLa cells, metaphase cells were identified by systematic searching and photographed at low power, and the number of Golgi profiles was determined for 40 cell images. Based on previously defined morphological features (Lucocq et al., 1989; Misteli and Warren, 1995), each Golgi profile was categorized as either a cluster or a stack.
Results
NAGFP-HeLa Cells
A fluorescent tag for the Golgi apparatus was generated by fusing the NH2-terminal 103 amino acids of the medial/ trans-Golgi enzyme, NAGT I, to a modified GFP. The NH2-terminal portion of NAGT I comprised the cytoplasmic tail, the membrane-spanning domain, and the stalk region. These domains are both necessary and sufficient for retention in the Golgi apparatus (Nilsson et al., 1996). The stalk region is normally followed by the lumenal, catalytic domain of NAGT I, which was, in effect, replaced by GFP. The modified version of GFP differed by three amino acids from the wild-type sequence, resulting in a 30–50-fold increase in fluorescence intensity (Cormack et al., 1996).
Stable HeLa cell lines expressing NAGFP were difficult to obtain. Several hundred G418-resistant clones were screened visually for Golgi fluorescence without success. Similar results were obtained using various promoter/enhancer sequences to drive expression. Eventually, G418resistant clones generated using the CMV-based expression cassette were rescreened after stimulating gene expression levels with 5 mM sodium butyrate for 16 h (Gorman and Howard, 1983; Olson et al., 1995). Several clones were selected for their intense Golgi-like fluorescence, and one of these, designated NAGFP-HeLa, was chosen for more detailed study.
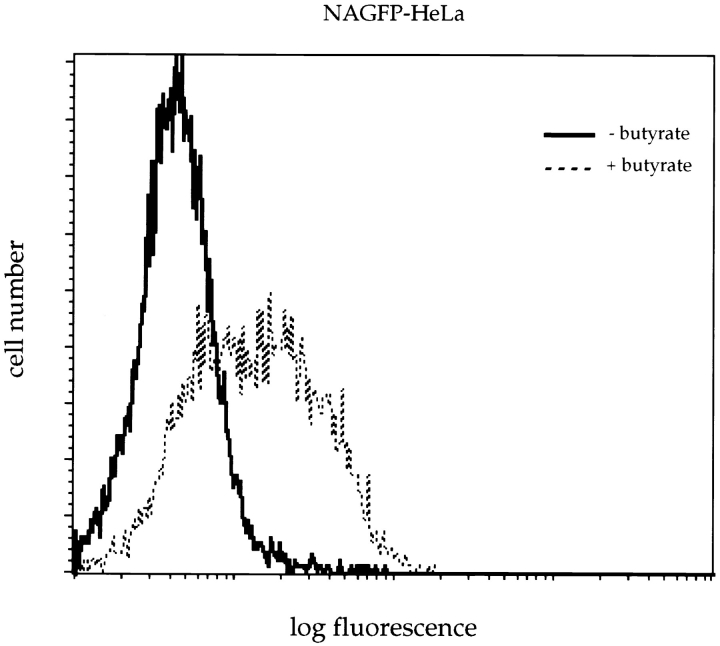
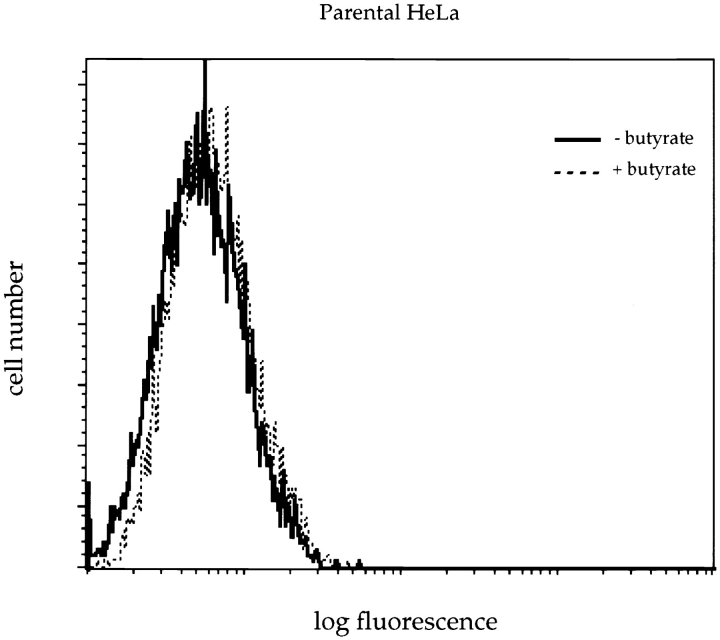
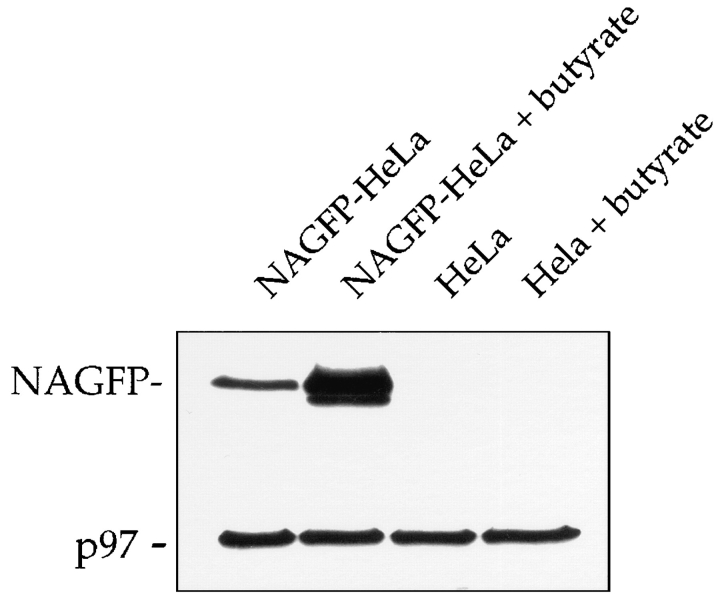
Flow cytometric studies showed that, in the absence of butyrate treatment, the background fluorescence profile of NAGFP-HeLa cells was very similar to that of the parental HeLa cell line (Fig. 1). Although butyrate had no effect on the parental HeLa cells, there was an approximate fivefold increase in the peak fluorescence levels of the NAGFP-HeLa cell line. Butyrate (5 mM) stimulation of fluorescence required a minimum of 10 h of exposure and was completely abolished in the presence of the protein synthesis inhibitor cycloheximide (data not shown), suggesting an effect of butyrate on the synthesis of NAGFP. To confirm this suggestion, expression of NAGFP was analyzed by Western blotting after fractionation of Triton X-100–soluble proteins by SDS-PAGE (Fig. 2). Affinity-purified polyclonal antibodies revealed a protein of the predicted molecular mass (39 kD) in NAGFP but not in parental HeLa cells. Treatment with butyrate increased the expression of NAGFP at least fivefold without obvious change in the levels of Triton-soluble proteins, as determined by Coomassie blue staining (data not shown), or cellular proteins, such as p97 (Peters et al., 1990) (Fig. 2). Consistent with previous reports (Darnell, 1984), treatment of HeLa cells with 5 mM butyrate for 10–16 h also had no effect on cell cycle kinetics, as measured by flow cytometric analysis of DNA content (data not shown); butyrate pretreatment should not, therefore, interfere with our analysis of the Golgi during mitosis. To stimulate Golgi fluorescence, all subsequent experiments were carried out after pretreatment of cells with 5 mM butyrate for 11–16 h.
Figure 1.
FACS® analysis of NAGFP-HeLa cells. NAGFP- (top) and parental (bottom) HeLa cells were incubated in the presence or absence of 5 mM butyrate for 16 h before preparation for FACS® analysis. Note the increased fluorescence of NAGFPHeLa cells in the presence of butyrate.
Figure 2.
Expression of NAGFP after butyrate treatment. NAGFP- and parental HeLa cells were incubated in the absence or presence of 5 mM butyrate for 16 h, then lysed, fractionated by SDS-PAGE, and Western blotted using antibodies to GFP and p97, the latter to ensure equal loadings of cellular proteins. Note the increased expression of NAGFP after butyrate treatment of NAGFP-HeLa cells. The faint lower molecular weight species is likely to represent a degradation product.
The location of NAGFP in the stable cell line was determined using live-cell confocal fluorescence microscopy (Fig. 3) and immunogold microscopy (Fig. 4). Fluorescence microscopy revealed a compact juxtanuclear reticulum in more than 90% of the cells, a structure characteristic of the Golgi apparatus (Louvard et al., 1982). This location was confirmed by immunoelectron microscopy using thin, frozen sections labeled with polyclonal antibodies to GFP followed by secondary antibodies coupled to 10-nm gold. Almost all of the gold particles were restricted to the Golgi apparatus, and the majority of these were found over a subset of one or two of the stacked cisternae on one side of the Golgi stack.
Figure 3.
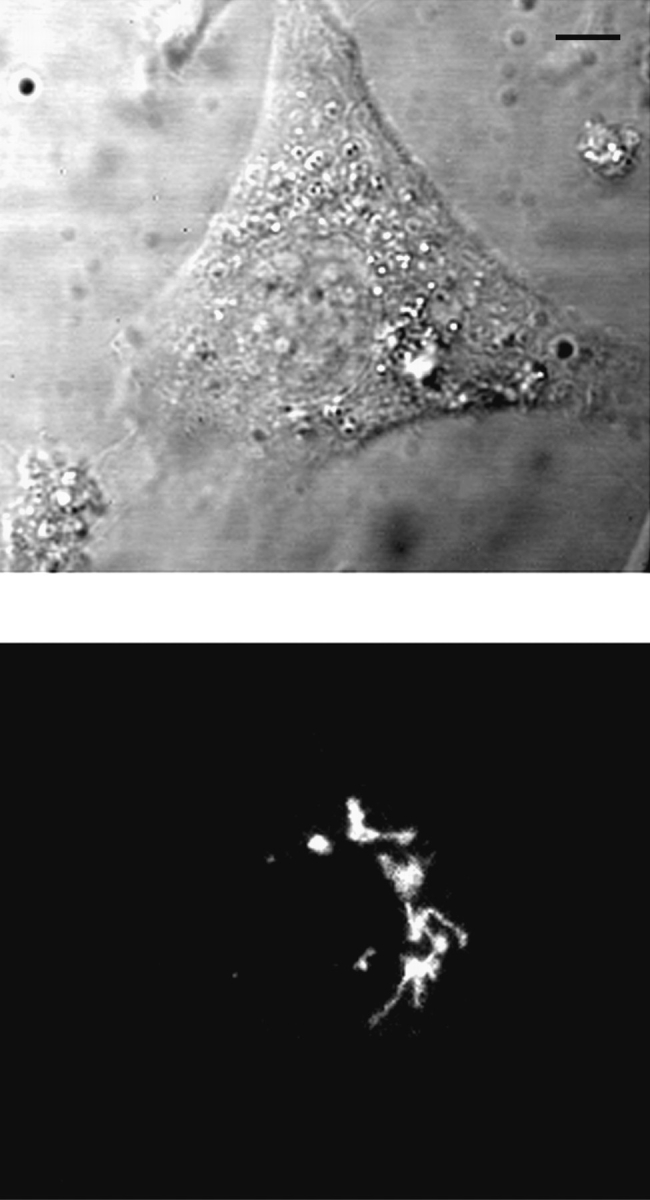
Localization of NAGFP by fluorescence microscopy. NAGFP-HeLa cells were directly examined by phase (top) and fluorescence (bottom) microscopy. Fluorescence was restricted to a juxtanuclear reticulum. Bar, 5 μm.
Figure 4.
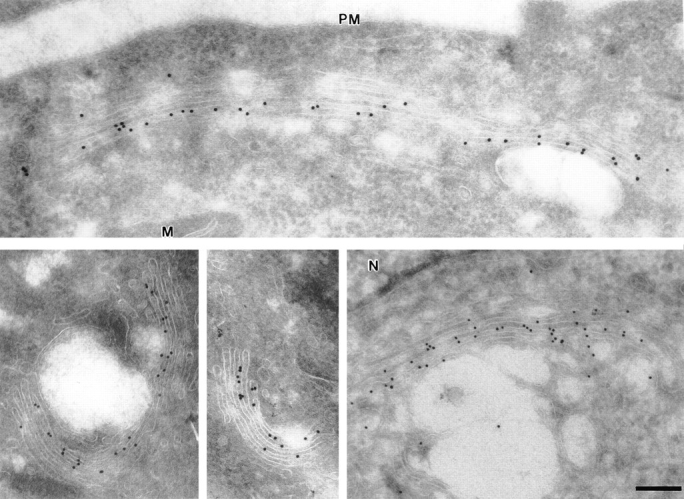
Localization of NAGFP by immunogold microscopy. NAGFP-HeLa cells were fixed and frozen, and sections were labeled with affinity-purified antibodies to GFP, followed by secondary antibodies coupled to 10-nm gold. A gallery of images is presented. Note that labeling was mostly restricted to one or two adjacent cisternae on one side of the stack. N, nucleus; PM, plasma membrane; M, mitochondria. Bar, 0.2 μm.
Laser scanning confocal microscopy was used to compare the location of NAGFP with other well-characterized Golgi markers. This method can be used to distinguish relative distributions within the Golgi apparatus (Antony et al., 1992; Nilsson et al., 1993), which can then be assigned to particular cisternae if the markers have been characterized at the EM level (Nilsson et al., 1993). Cells were fixed and labeled with appropriate primary and secondary antibodies, and optical sections were sampled (Fig. 5, left). Each image represents a single optical section (theoretical depth of field is ∼0.5 μm) through an interphase cell. The pattern of labeling was then compared with that of the fluorescent NAGFP (Fig. 5, middle), and differences in distribution were revealed by overlaying the two images (Fig. 5, right). To eliminate the possibility that differences in relative protein distributions might be artefactually created during image acquisition, an internal control was carried out for each set of experiments using polyclonal antibodies to GFP. As shown in Fig. 5 (top row), there was virtually complete overlap between the inherent NAGFP fluorescence and that observed by indirect immunofluorescence microscopy.
Mann II has been shown to reside in the same medial/ trans cisternae in HeLa cells as NAGT I (Rabouille et al., 1995). As shown in Fig. 5 (second row), there was almost complete overlap between Mann II and NAGFP. In contrast, GM130, a cis-Golgi matrix protein (Nakamura et al., 1995), could be readily distinguished from NAGFP. The images in Fig. 5 (third row) show that the two proteins run in parallel along the Golgi ribbon, suggesting that they reside in adjacent compartments. It is not clear whether the small region of overlap (yellow) represents partial colocalization of the two proteins or represents the failure to resolve two close, but distinct fluorescent signals. The same distribution relative to NAGFP was obtained using antibodies to the vesicle docking protein p115 (Waters et al., 1992) (Fig. 5, fourth row). p115 appears to be on the cisside of the Golgi apparatus since it colocalizes with GM130 by immunofluorescence microscopy (data not shown), and biochemical data suggest a functional interaction between the two proteins (Nakamura et al., 1997). The TGN marker, TGN46 (Ponnambalam et al., 1996), was also found adjacent to NAGFP, especially when a long, continuous stretch of Golgi ribbon was viewed (Fig. 5, fifth row). Lastly, a peripheral Golgi marker was compared with NAGFP. Giantin is an unusually large membrane protein with most of its mass on the cytoplasmic face of Golgi membranes (Linstedt and Hauri, 1993). ImmunoEM suggests that it is located mostly around the periphery of Golgi stacks (Seelig et al., 1994). Immunofluorescence microscopy showed that giantin mostly surrounded NAGFP (Fig. 5, bottom row).
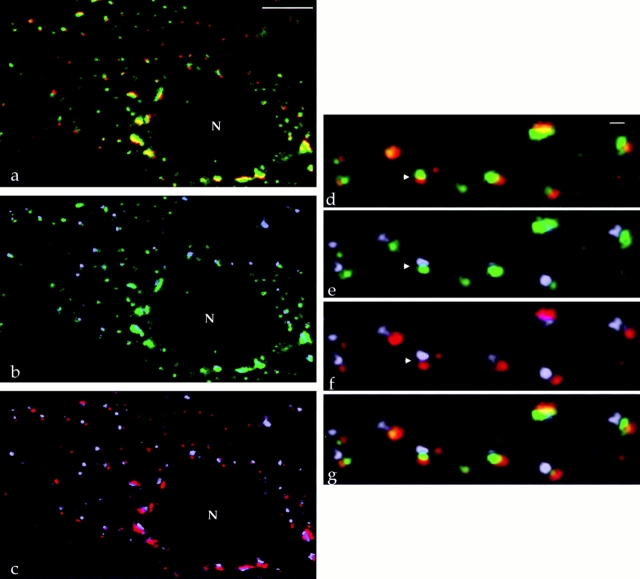
Because the compartmentation of the NAGFP and the ability to discern biochemical polarity with the light microscope are central issues for our analysis of the mitotic Golgi, we performed triple-labeling experiments to further substantiate our findings. Treatment of cells with the microtubule depolymerizing agent nocodazole results in the accumulation of dispersed Golgi stacks in the cytoplasm (Thyberg and Moskalewski, 1989; Cole et al., 1996a ). We found that this fragmentation of the convoluted interphase Golgi ribbon facilitated the analysis of polarity by permitting the visualization of individual stacks. Fig. 6 shows the results of triple-label analysis using the NAGFP (green) and antibodies to p115 (red) and TGN46 (gray). As shown in the double-label images, NAGFP was again found adjacent to TGN46 and p115 (Fig. 6, a and b). Furthermore, overlaying the images for p115 and TGN46 antibodies showed that the distance between the two labels was greater than when either labeling was compared to NAGFP (Fig. 6, c and f). This was confirmed by the three-image merge (Fig. 6 g), which demonstrates the location of the majority of NAGFP in a compartment(s) between the cis and TGN markers, presumably the medial/trans cisternae.
Figure 6.
Triple labeling of Golgi stacks. NAGFP-HeLa cells were treated with 5 μg/ml nocodazole for 2 h, fixed, and labeled with antibodies to the cis marker p115 (red) and the TGN marker TGN46 (gray). Double-image overlays show localizations of (a and d) p115 and NAGFP (green), (b and e) TGN46 and NAGFP, and (c and f) p115 and TGN46. The upper left corners of a–c are magnified in d–f. Note the distance between fluorescent signals within a stack is greatest for the TGN and cis markers (f). The triple image overlay is shown in g and clearly shows that NAGFP is sandwiched between the cis and TGN markers. Bars: (a–c) 5 μm; (d–g) 0.45 μm.
Together, these microscopic techniques provide strong evidence that the polarity of Golgi residents can be readily distinguished using confocal immunofluorescence microscopy.
Mitotic Golgi Clusters in NAGFP-HeLa
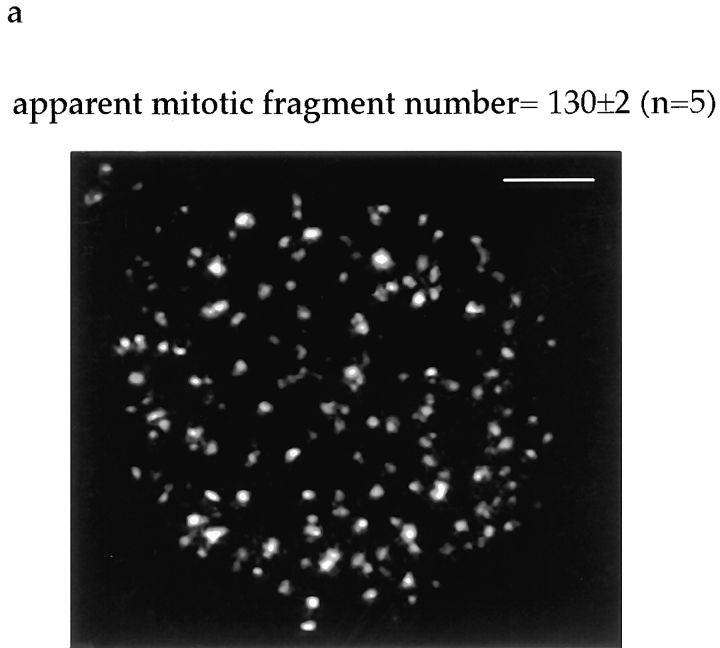
The distribution of fluorescent NAGFP during mitosis was studied in fixed populations of NAGFP-HeLa cells. Metaphase cells were enriched by a G1/S block/release protocol (see Materials and Methods) and located by the appearance of Hoechst-stained chromatin. Serial optical sections were sampled using a laser scanning confocal microscope, and the sections were overlaid and visualized in two dimensions. The example shown in Fig. 7 a emphasizes the dramatic changes that occur to the Golgi apparatus when animal cells enter mitosis. The juxtanuclear ribbon of interphase cells is replaced by large numbers of small fragments that appear to be distributed throughout the peripheral cell cytoplasm.
Figure 7.
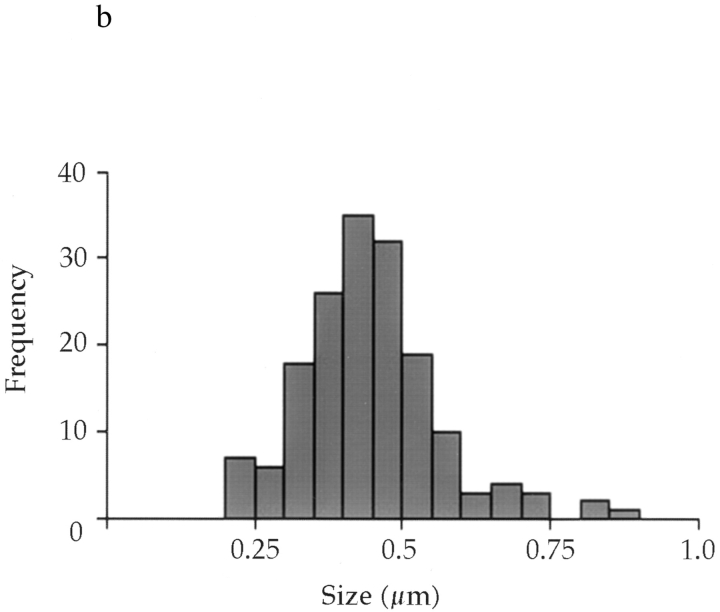
Number, size, and distribution of mitotic Golgi fragments. (a) NAGFP-HeLa cells were fixed, cells in metaphase were optically sectioned by confocal microscopy, and the sections were projected as a two-dimensional image. The example shown is of a metaphase cell. The average apparent number of clusters/ metaphase cell was 130 ± 2 (n = 5). Bar, 5 μm. (b) The apparent diameter of each cluster was measured and plotted as a distribution.
The number of fragments in metaphase NAGFP-HeLa cells proved to be remarkably constant. Five randomly chosen cells from the population were counted, and the mean number of fragments (defined as fluorescent structures >0.2 μm in apparent diameter) was determined to be 130 ± 2 (SEM). In other words, there is a 95% probability that the metaphase fragment number will be between 124 and 135. Their apparent sizes ranged in diameter from 0.2 to 0.9 μm, with a peak at 0.45 μm (Fig. 7 b). These fluorescence-based estimates of size and number are consistent with those obtained from EM analysis of mitotic Golgi clusters (Lucocq et al., 1987; Lucocq and Warren, 1987).
The NAGFP-positive fragments from populations of metaphase cells were examined for their content of Golgi markers, and the results are presented in Fig. 8. Each image represents a single optical section (theoretical depth of field is ∼0.5 μm) through a metaphase cell. With one exception (see below), all Golgi markers examined were present in the mitotic fragments. Surprisingly, the distribution of NAGFP relative to other Golgi markers was remarkably similar to that seen in interphase cells. GM130 and TGN46 were consistently located adjacent to NAGFP in the majority of fragments examined, whereas giantin overlapped, often enveloping the NAGFP. These differences were validated using antibodies to GFP that exactly colocalized with the endogenous GFP fluorescence.
In contrast, few if any of the mitotic fragments were labeled for the vesicle docking protein p115, which appeared to be distributed throughout the cell cytoplasm and often had a punctate appearance. We have previously shown that the affinity of p115 for purified Golgi membranes decreases 10- to 20-fold after pretreatment of membranes with mitotic cytosol (Levine et al., 1996). The absence of p115 from mitotic fragments provides evidence that this is also true in vivo.
The polarized distribution of markers in the mitotic fragments was unexpected since earlier EM studies had shown that, by metaphase, Golgi stacks were converted to mitotic clusters, collections of small vesicles, tubules, and tubular networks (Lucocq and Warren, 1987; Lucocq et al., 1987; Lucocq et al., 1989; Misteli and Warren, 1995a ). Therefore, it was important to confirm that the fluorescent fragments seen in metaphase NAGFP-HeLa cells were mitotic clusters, not small stacks of cisternae that had failed to undergo mitotic conversion.
NAGFP-HeLa cells were enriched for mitotic cells by sequential G1/S block/release. 12 h after release from the second G1/S block, ∼50% of the cells were undergoing mitosis. This population of cells was fixed and prepared for both conventional Epon microscopy and immunogold microscopy using anti-GFP antibodies. Randomly obtained metaphase cell images were examined for Golgi profiles, and then each profile was scored as a mitotic cluster or stack. In total, 90 Golgi profiles were found in 40 different metaphase cell sections. Of the 90 Golgi profiles, none contained stacked cisternae; instead, all contained tubular and vesicular profiles and thus were scored as mitotic Golgi clusters.
A typical example of a mitotic cluster is shown in Fig. 9 a. Immunogold microscopy confirmed the presence of NAGFP in these clusters. Distribution of the gold label did not appear to be evenly distributed throughout the cluster, but instead hinted at the organization now revealed by confocal microscopy (Fig. 9, b and c).
Figure 9.
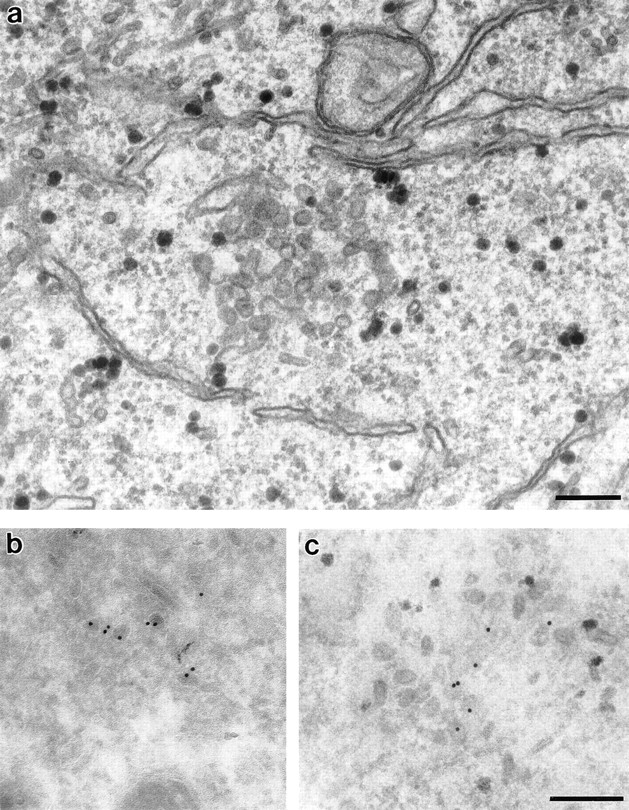
Morphology of mitotic Golgi clusters by electron microscopy. NAGFPHeLa cells were synchronized by sequential blocks with thymidine and aphidicolin to enrich for mitotic cells. After fixation, cells were prepared for (a) Epon or (b and c) immunogold microscopy using antibodies to GFP followed by secondary antibodies coupled to 10-nm gold. The samples in c were postembedded in Epon to better visualize the membranes. Bars, 0.2 μm.
Mitotic Golgi Clusters in Unsynchronized NAGFPHeLa, Parental HeLa, and Primary Keratinocytes
It was important to show that polarized mitotic clusters were not simply the product of the cells and conditions used. Metaphase cells from unsynchronized populations of NAGFP-HeLa cells had dispersed clusters (Fig. 10 a), showing that the synchronization treatment was not responsible for their presence. Unsynchronized parental HeLa cells gave the same pattern of mitotic clusters when labeled with antibodies to giantin (Fig. 10 b), and it is well established that in these cells, Golgi stacks are transformed into mitotic clusters of membranes by metaphase (Lucocq and Warren, 1987; Pypaert et al., 1993; Misteli and Warren, 1995). Lastly, these results were not restricted to the HeLa cells, since similar labeling was also seen in metaphase primary keratinocytes labeled with giantin antibodies (Fig. 10 c).
Figure 10.
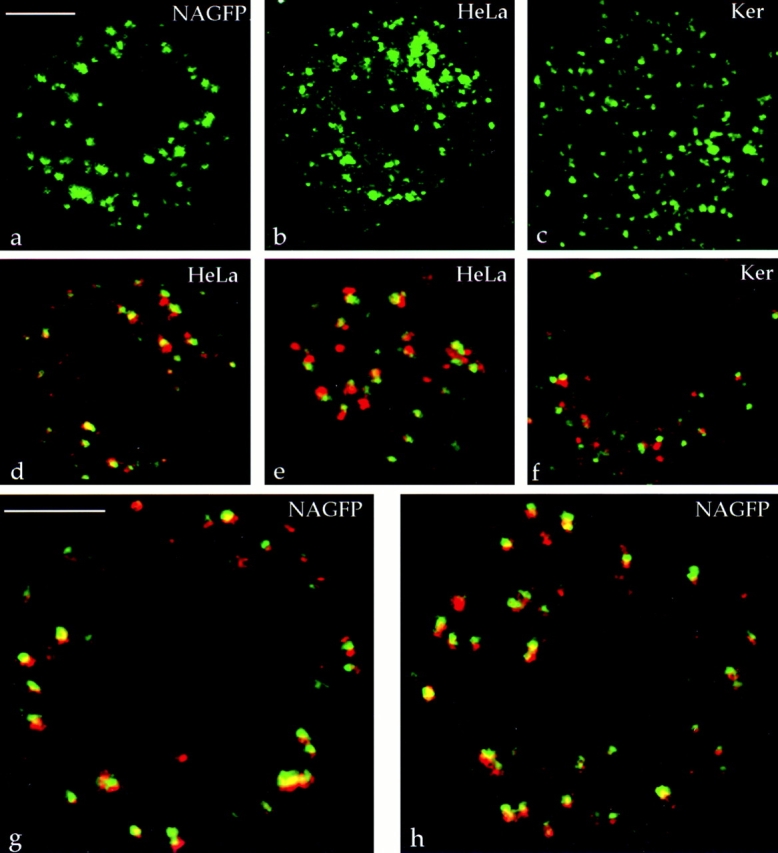
Polarity of mitotic Golgi clusters in other cells. Two-dimensional projections of a confocal z-series showing the presence of metaphase Golgi clusters in unsynchronized NAGFP-HeLa cells (a), parental HeLa cells labeled with antibodies to giantin (b), and primary human keratinocytes labeled with antibodies to giantin (c). Immunolocalization of the cis marker GM130 and the TGN marker TGN46 in parental HeLa cells (d, single optical section at the level of the metaphase plate; e, section through the periphery of a metaphase cell) and a keratinocyte (f). (g and h) Immunolocalization of GM130 and TGN46 in NAGFP-HeLa cells that have not been treated with butyrate to stimulate NAGFP expression. Bar, 5 μm.
The mitotic clusters were also polarized. Double-label immunocytochemistry and confocal analysis were performed using antisera to the cis-Golgi marker GM130 and the TGN marker, TGN46. Depending on the orientation of the individual clusters, staining for GM130 and TGN46 often appeared as adjacent, nonoverlapping fluorescence signals in metaphase HeLa cells (Fig. 10 d, section at the level of the metaphase plate; Fig. 10 e, section at the periphery of a metaphase cell) and metaphase keratinocytes (Fig. 10 f). Similar results were also seen in NAGFP-HeLa cells that had not been treated with butyrate (Fig. 10, g and h). Together, these data show that the transformation of Golgi stacks into polarized mitotic clusters is a general feature of the Golgi inheritance process.
Dynamics of Golgi Clusters
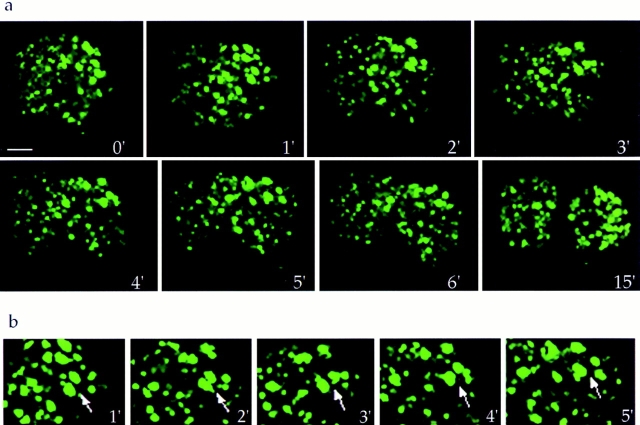
The fate of Golgi clusters during mitosis was followed in individual, living cells. Low laser power (⩽1%) and rapid Kalman scans were used to collect serial optical sections (obtained at 1.25–1.5-μm intervals) in the z-axis of mitotic cells. Since the primary concern was to minimize exposure of mitotic cells to the laser, fewer sections were collected, resulting in a slightly lower quality image for living mitotic cells versus fixed specimens (compare images in Fig. 11 a and Fig. 7). However, with these parameters we have been able to monitor the progression of cells from metaphase through early G1. Approximately 9–11 sections were collected for each time point and are shown in Fig. 11 as twodimensional projections. The ability to observe living cells with confocal microscopy provides a view of the entire cell contents, thereby eliminating the problems associated with visualizing structures in spherical mitotic cells.
Figure 11.
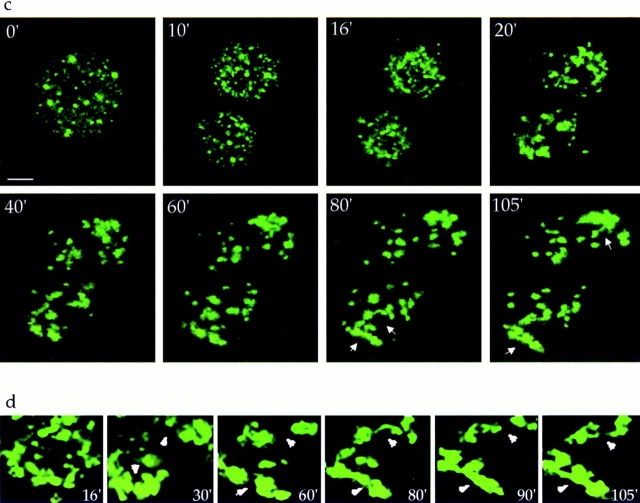
Dynamics of mitotic Golgi clusters. Living NAGFP-HeLa cells were directly examined by fluorescence microscopy. (a) A single metaphase cell was followed through to G1. (b) Enlargement of a region derived from the metaphase cell in a, showing the lack of directed movement of independent mitotic clusters (arrows). (c) A single metaphase cell was monitored through mitosis and as it began to rebuild the interphase Golgi ribbon (arrows). (d) Enlargement of the lower telophase/G1 cell showing tubulation and congregation of inherited Golgi membranes (arrowheads). Ribbon-like structures began to appear coincident with the reattachment and spreading of cells onto the tissue culture dish.
Prophase proved to be the most difficult mitotic phase to study. In contrast to metaphase, when cells are rounded, there were few visual indications that a cell was about to enter prophase. Furthermore, arresting cells at the G2/M boundary using specific drugs conferred no advantage since entry into prophase was slow and very asynchronous once the drug was removed (unpublished observation). More work will be needed to establish conditions to identify and monitor live cells as they leave G2 and enter prophase.
The transition from metaphase to late telophase was easier to study, and an example is presented in Fig. 11 a. The ability to resolve individual clusters using this method provides direct evidence for the partitioning of mitotic clusters into daughter cells. Single cells were routinely observed as they progressed from metaphase through to the G1 phase of the cell cycle, permitting observation and assessment of consistent features of the mitotic clusters during the partitioning process. As seen in an enlargement of the mitotic cell sequence, shown in Fig. 11 b, individual clusters could be followed for minutes at a time. Slight movement of clusters was observed, often appearing as coordinated translocations of the entire cluster population as the cells elongated during mitosis/cytokinesis. In early telophase, the cluster population appeared to move collectively in a poleward direction, coincident with the presumed spindle movement.
Observation of cells for longer periods of time after cytokinesis (Fig. 11 c) shows that only after separation of the two daughter cells did clusters begin consistent, independent, directed movements as they congregated to reform the interphase Golgi apparatus. An enlargement of one daughter cell demonstrates that Golgi clusters initially congregated and surrounded the newly forming nucleus in late telophase, assembling a smaller number of larger, compact, Golgi units (Fig. 11 d; t = 16 min). This early period of Golgi reassembly had previously been examined ultrastructurally, where it had been shown that within a 10-min period in telophase, Golgi clusters were reorganized into discrete stacks of cisternae. This morphological change coincided with the resumption of secretory traffic. The average cisternal length of the Golgi stacks continued to increase slowly as the cells progressed into early G1, consistent with the formation of the larger, compact units now observed using the fluorescently tagged Golgi (Souter et al., 1993).
The creation of a more typical interphase Golgi ribbon was accomplished over 1–2 h after entry into G1 through continued congregation of the fluorescent structures and the extension of tubules, which appeared to emanate and eventually join large Golgi fragments (Fig. 11 d; t = 30– 105 min). Tubules between fragments formed, broke, and reformed (upper arrowhead), whereas others formed and consolidated (lower arrowhead), giving a “beads-on-astring” appearance to the Golgi. Through a process of tubulation and condensation, the Golgi morphology altered from a collection of ∼30–40 large, dispersed fragments (t = 16 min) to a pair of rudimentary Golgi ribbons (t = 105 min).
The accuracy of partitioning the NAGFP Golgi tag during mitosis was determined by comparing the fluorescence intensity between nascent daughter cell pairs. Serial optical sections were collected, images representing the entire cell thickness were overlaid, and then gray values were quantitated for late telophase cell pairs. The observed variance, assuming a theoretical mean of 50% (i.e., the variance of the observed values from a 1:1 outcome for partitioning of Golgi into daughter cells), was calculated to be 13.5, and based on the need to partition 130 Golgi clusters, the accuracy of partitioning for all cells analyzed (n = 26) fell within the range of 50 ± 6%. In contrast, the theoretical variance for a stochastic partitioning of 130 Golgi clusters would be 32.5, and only 5 out of 10 cell pairs would be expected to fall within the 50 ± 6% range of accuracy (Birky, 1983; Lucocq and Warren, 1987). These data argue for the existence of cellular mechanisms to ensure an accuracy better than would be achieved solely through a passive, stochastic partitioning of mitotic Golgi membranes.
Discussion
The Golgi apparatus has been fluorescently tagged using GFP localized on the lumenal side of the membrane by the medial/trans retention signal of NAGT I. The efficacy of this tag was confirmed both by fluorescence and immunoelectron microscopy. Immunogold labeling showed that the hybrid protein was mostly restricted to one or two cisternae on one side of the stack. Confocal microscopy showed that NAGFP was sandwiched between the cisGolgi markers GM130 or p115, and the TGN marker, TGN46. It was often surrounded by the peripheral protein, giantin, and most importantly, colocalized most completely with Mann II. Since Mann II has the same location as NAGT I in HeLa cells (Rabouille et al., 1995), these results strongly suggest that NAGFP is present in the same location as the parent NAGT I, namely the medial and trans cisternae. As such, it provides an excellent vital marker for the Golgi apparatus.
Though transient transfection with the NAGFP cDNA resulted in high levels of Golgi fluorescence in HeLa, NRK, and embryonic stem cells (unpublished observation), significant levels of fluorescence in stable HeLa cell lines were only obtained after treatment with butyrate. A 16-h incubation increased synthesis of the protein by about fivefold, and this was accompanied by a dramatic increase in the level of fluorescence. Treatment with butyrate for less than 24 h had been shown by others to have no effect on cell cycle progression in HeLa cells (Darnell, 1984). This was confirmed for the NAGFP-HeLa cells, which were also shown to be viable and fluorescent for several days after stimulation. This permitted studies of the Golgi apparatus during the cell cycle. The difficulty in obtaining cell lines stably expressing fluorescent GFP has been experienced by others (Cubitt et al., 1995; Olson et al., 1995) and suggests that continuous expression can be toxic. Time could well be saved if initial attempts focused on inducible systems, using either specific promoters or less specific treatments, such as butyrate.
Fluorescent tagging of the Golgi apparatus using GFP has permitted, for the first time, continuous examination of the Golgi apparatus in mitotic cells. Intermediates involved in the partitioning of mitotic Golgi membranes were identified and followed as cells progressed through mitosis. The first important feature to emerge from these studies is that metaphase cells contained a constant number (130 ± 2, n = 5) of dispersed mitotic Golgi fragments, shown by EM to be tubulo-vesicular mitotic clusters. This finding strongly suggests that the end product of Golgi breakdown is not the vesicle but the Golgi cluster.
Earlier EM studies had not resolved this issue. Quantitation of Golgi cluster profiles impregnated with osmium showed that there were ∼140 mitotic clusters/metaphase cell, similar to the number now found using NAGFP (Lucocq and Warren, 1987). Cryo-immuno–EM, however, showed that clusters could shed vesicles into the surrounding cytoplasm, raising the possibility that shedding of vesicles could go to completion, making the vesicle the end product (Lucocq et al., 1989). Immunofluorescence analysis provided no firmer data, in part because of the lack of availability of high-titre, high-affinity antibodies and because of technical difficulties due to high background fluorescence and abundant out-of-focus material in rounded, mitotic cells.
The GFP has helped resolve this problem, providing an invaluable tool for the investigation of subcellular dynamics and organization. In addition to the ability to follow living cells, the GFP tag also provides a level of sensitivity in fixed-cell fluorescence microscopy that cannot be readily achieved with conventional antibody-based methods. The virtual absence of background noise, coupled with the intense fluorescence signal obtained with this particular GFP variant (Cormack et al., 1996), have enabled the investigation of subcellular membranes whose sizes are approaching the limits of resolution for the light microscope. This gain in sensitivity becomes even more significant when examining mitotic cells, whose intracellular structures are difficult to visualize because of the high degree of light scatter and increase in sample thickness (Cheng and Kriete, 1995). The benefits of the increase in sensitivity and resolution are best demonstrated by the highly reproducible quantitation of metaphase cluster number in confocal fluorescence images (see above and Fig. 7). Moreover, as shown in the multiple-label analysis of Golgi polarity, the endogenous fluorescent properties of the polarized NAGFP provide new opportunities for the analysis of Golgi resident organization. Paired with confocal microscopy, the NAGFP tag provides a rapid and simple means to obtain a whole cell overview of Golgi membrane distribution and organization.
A second feature to emerge from these studies is that mitotic clusters contained representatives of all resident markers tested (with the exception of p115; see below), and unexpectedly, these markers had the same distribution, relative to each other, as in the interphase Golgi apparatus. In other words, Golgi residents within the mitotic clusters were polarized. It could be argued that the mitotic NAGFP-HeLa cells represent a unique case. Several experiments were performed to address this concern. First, the transformation of Golgi stacks into mitotic clusters was confirmed by quantitating Golgi profiles in electron micrographs. All Golgi profiles found in metaphase cells were mitotic clusters. At the EM level, these clusters were indistinguishable from those described previously for mitotic cells in the parotid gland (Tamaki and Yamashina, 1991), thyroid epithelium (Zeligs and Wollman, 1979), and the parental HeLa cell line (Lucocq et al., 1987); therefore, by morphological criteria, Golgi membranes in the metaphase NAGFP-HeLa are indistinguishable from those observed during previous studies of mitotic Golgi membranes. In addition, this analysis excludes the possibility that the polarized metaphase Golgi fragments in the NAGFP-HeLa cells are just stacks that have failed to convert into clusters. Second, mitotic clusters were present in NAGFP-HeLa cells that have not been treated with butyrate or aphidicolin, parental HeLa cells, and primary human keratinocytes during all stages of mitosis (Fig. 10 and unpublished observations). This provides strong evidence that mitotic clusters are not an artifact of drug treatments or GFP expression and are not restricted to tumor cell lines, but are a common unit of Golgi partitioning. Lastly, mitotic Golgi membranes in the parental HeLa cell line and primary human keratinocytes were polarized; thus, we conclude that the formation of polarized mitotic clusters is a common element of the Golgi fragmentation process during cell division.
The failure to observe cluster polarity in the past is likely due to the predominantly ultrastructural nature of mitotic Golgi analysis; it was assumed that the loss of cisternal morphology in mitotic Golgi membranes resulted in the loss of biochemical polarity. Furthermore, the loss of cisternal morphology makes it difficult to determine the relative orientation of resident Golgi proteins within the cluster unless cryo-immunolabeled sections (∼60–80-nm thickness) are reconstructed into three-dimensional, double-label images of the cluster (∼500-nm diameter). This is currently not feasible. The analysis of mitotic Golgi by confocal microscopy has avoided this problem since the volume of illumination is approximately the same size or slightly larger than the mitotic clusters. This feature has permitted the visualization of entire clusters within a single optical section and greatly enhances the ability to observe the compartmental nature of Golgi protein distribution.
The maintenance of polarity in the apparently disorganized membranes of the cluster may be explained by the COP I–independent disassembly of the resident-enriched core regions of the Golgi stack. In contrast to the COP I pathway, which appears to convert the transport-specialized cisternal rims into coated vesicles, the COP I–independent pathway results in an increase in Golgi membrane fenestrations and the formation of extensive tubular networks (Misteli and Warren, 1995b ). In thin section electron micrographs, tubular–reticular networks would appear as a heterogeneous collection of vesicles and tubules, similar to the morphology of Golgi membranes in the cluster. Hence, we speculate that during mitosis, extensive tubulation of core Golgi cisternae in situ leads to the transformation of cisternae into tubulo-vesicular membranes without disrupting their distribution relative to other cisternae in the stack.
The polarized distribution of resident proteins in the Golgi clusters suggests the existence of a structural template onto which the Golgi stack is reorganized after mitosis. The membranes themselves may act as the structural template, harboring the information sufficient for self- association and organization of the dispersed Golgi components: perhaps Golgi “adhesion molecules” are responsible for maintaining cluster compartmentation, similar to the proposed role for cell–cell adhesion molecules (e.g., cadherins) in sorting out cell populations into patterned tissues (Steinberg, 1963). Alternatively, mitotic membranes might be organized upon an underlying scaffold that determines Golgi architecture. Cytoskeletal-like Golgi proteins, such as giantin, Golgi spectrin, or GM130, could participate in the construction of such a structure (Barr and Warren, 1996).
The vesicle docking protein p115 is the only Golgi marker so far tested that was absent from the mitotic clusters. We have previously shown that p115 binds with a 10- to 20-fold lower affinity to Golgi membranes after treatment with mitotic cytosol (Levine et al., 1996). The present work provides strong evidence that this also occurs in vivo and supports our hypothesis that the COP I–dependent fragmentation of the Golgi apparatus results from an inability of the COP I vesicles to dock and therefore fuse with their target membranes. In contrast to mitotic clusters, p115 is found on the dispersed Golgi stacks generated by treatment with nocodazole (Fig. 6). This is consistent with the fact that these stacks carry out exocytic transport (Featherstone et al., 1985; Cole et al., 1996a ) and provides a means of distinguishing these small Golgi stacks from mitotic clusters.
The persistence of a constant number of mitotic clusters does not preclude the presence of free vesicles or tubules derived from them. Their size and dilution would hinder detection by current fluorescence techniques. In addition, the products of the COP I–dependent pathway are vesicles depleted in the resident proteins used as markers for the Golgi compartment. The only evidence for loss of membrane from clusters comes from measurements of apparent cluster size. These range from 0.2 to 0.9 μm and suggest that some clusters could lose more membrane (in the form of vesicles) than others. However, shedding of vesicles into the cytoplasm does not go to completion; therefore, clusters are not intermediates on the fragmentation pathway, they are end products.
The accuracy of partitioning will be limited by the Golgi unit present in the least copy number. Such a unit must also be able to seed the regrowth of the complete organelle once mitosis is complete. By these criteria, the mitotic clusters are the unit of Golgi partitioning. They have representatives of all the biochemical compartments of the Golgi, and they are present in the lowest copy number. Shed components and molecules such as p115 are not likely to seed regrowth, and their greater number (and smaller size) means that they would be at least as accurately partitioned as the limiting clusters.
In living cells, individual metaphase clusters displayed no obvious directed movement that could be categorized. Instead, as cells divided, the cluster population appeared to move as a collective in the direction of the spindle poles, suggesting that the clusters may be anchored to an underlying structure such as aster microtubules or the mitotic spindle (Lucocq et al., 1989). In late telophase/G1, the Golgi membranes congregated in the presumed pericentriolar region and, slowly, by an iterative process, reformed the interphase ribbon. Two types of directed movement were noted during this period: condensation of telophase Golgi membranes to form 1–3-μm fragments and extension of tubules to join the fragments into a rudimentary Golgi ribbon. Both cytoplasmic dynein and kinesin have previously been implicated in the directed movement of Golgi membranes along microtubules. Cytoplasmic dynein is necessary for the cell-free movement of Golgi fragments towards the centrosome (Corthesy-Theulaz et al., 1992), and brefeldin A–stimulated formation of ER-directed tubules is kinesin dependent (Lippincott-Schwartz et al., 1995). The ability to track Golgi membranes in living, dividing cells should provide a powerful system for identifying the motor components responsible for rebuilding the interphase Golgi ribbon in vivo.
The orderly and directed breakdown, distribution, and reformation of the Golgi apparatus implies that to facilitate the partitioning of the Golgi, a mechanism more sophisticated than one that simply randomizes the Golgi membranes is required. This raises the question of whether the distribution of Golgi clusters in the metaphase cell serves to increase the accuracy of a partitioning process that relies solely on cytokinesis, or if it reflects a more ordered mechanism of sorting Golgi membranes into daughter cells. Ordered mechanisms for partitioning multicopy organelles were first proposed in the early part of this century when the partitioning of mitochondria during spermatogenesis was shown to be more accurate than that predicted by a simple stochastic mechanism (Wilson, 1916; Birky, 1983). Attempts to analyze the accuracy of Golgi partitioning by EM were originally carried out using osmication to identify Golgi membranes in thick sections. This permitted the number of clusters in each daughter cell to be determined, but the accuracy of the values obtained was limited by the small sample size since the technique required complete serial sectioning of each dividing cell (Lucocq and Warren, 1987). The NAGFP-HeLa cells have provided a more convenient system for determining the accuracy of partitioning. Measurements based on the partitioning of the GFP tag show that the experimentally determined accuracy was ∼2.5-fold better than would be predicted for a stochastic event. These findings provide evidence that the mitotic partitioning of the Golgi occurs through an ordered mechanism; however, definitive proof awaits the characterization of the putative mechanism(s).
Regardless of the nature of the partitioning mechanism, the constant number of clusters in metaphase cells points to a biosynthetic mechanism that accurately maintains this number. The mechanism is unknown, but the level of Golgi membrane in a cell appears to reflect the amount of plasma membrane that it must service. For example, Xenopus oocytes have a low surface area to volume ratio and contain comparatively little Golgi membrane (Colman et al., 1985). Moreover, we found that mitotic cells synchronized with aphidicolin were larger (and therefore had more plasma membrane) than those in unsynchronized populations (compare cell sizes in Figs. 7 a and 10 a). They had a larger (though still constant) number of similarly sized metaphase clusters (130 vs. ∼70). This raises the possibility of a relationship between the area of plasma membrane, volume of the Golgi apparatus, and mitotic cluster number.
The mechanism for maintaining a constant number of Golgi units could operate in one of two ways: either it could rely on the synthesis of new copies of the Golgi apparatus de novo, or it could control the growth and division of preexisting Golgi membranes. The present work has raised the possibility that an underlying Golgi scaffold persists throughout the cell cycle, even when the cisternal membranes themselves are disassembled. If new copies of the Golgi arise de novo, this scaffold would be capable of self-assembly, forming a limiting structure of defined size. Alternatively, the scaffold could act as a template on which another copy would be built. Examination of NAGFPHeLa cells during the period of Golgi biogenesis should provide insight into which of these two mechanisms operates.
Disassembly of the Golgi apparatus into dispersed vesicles and tubules was thought to increase the accuracy of a stochastic partitioning process. The present work, however, suggests a more ordered partitioning mechanism, which raises the question: why locally fragment the stacks into tubulo-vesicular clusters? In plants and fungi, the Golgi exists as discrete, dispersed stacks throughout the cell cycle, suggesting that the stack can function as an effective unit of partitioning (for review see Warren, 1993). The retention of a stacked morphology in plants and fungi could reflect the need for continuous secretion to synthesize new cell wall material during mitosis. In contrast, in animal cells, there is a general cessation of membrane traffic during mitosis (Warren, 1985), so there may not be a requirement to maintain the stacked morphology. Instead, the inhibition of secretory traffic at mitosis might contribute to the local disassembly of stacks into membrane clusters. However, even in this speculative scenario, the functional significance of cluster formation is not obvious.
One possible function of cluster formation is to increase access to an area of membrane equivalent in surface area to that of the plasma membrane (Griffiths et al., 1984). Examination of clusters by EM shows that cluster membranes are separated from each other, much more so than when they are present in stacked cisternae (Misteli and Warren, 1995a ). Such a process could either expose membrane-bound proteins that are stored in the stacked regions during interphase but required during mitosis, or sequester interphase components that might otherwise hinder the mitotic process. A number of signaling molecules have been localized to Golgi membranes, including phospholipase D (Ktistakis et al., 1995) and various isoforms of protein kinase C (Goodnight et al., 1995; Lehel et al., 1995). In addition, proteins that regulate the distribution of their associated kinases during interphase and mitosis are also present on the Golgi. These include the regulatory subunit of protein kinase A (Nigg et al., 1985) and cyclin B2 (Jackman et al., 1995).
In summary, we have devised a means of following the fate of the Golgi apparatus in living cells during the mammalian cell cycle. The system has provided insight into Golgi biogenesis and partitioning and will be of use in investigating various aspects of organelle function during the cellular growth and division process.
Acknowledgments
We would like to thank Tommy Nilsson for supplying NAGT I constructs; Brendan Cormack and Stanley Falkow for supplying the GFP mutant constructs; Kelly Moremen, Nobuhiro Nakamura, Vas Ponnambalam, Ken Sawin, and Gerry Waters for antibodies; Peter Jordan for assistance with confocal microscopy; Derek Davies for performing FACS® analyses; Thomas Kreis for advice concerning the technical aspects and interpretation of the live cell microscopy; and Francis Barr, Catherine Rabouille, Christiana Ruhrberg, and Birte Sonnichsen for helpful advice and critical reading of this manuscript.
Abbreviations used in this paper
- CMV
cytomegalovirus
- GFP
green fluorescent protein
- NAGFP
NAGT I–GFP chimera
- NAGT I
N-acetylglucosaminyltransferase I
Footnotes
D.T. Shima is a Hitchings-Elion Fellow, funded by the Burroughs Wellcome Fund. This work was partly supported by a Network Grant (No. ERB4050PL932029) from the European Union.
Address all correspondence to Dr. Graham Warren, Cell Biology Laboratory, Imperial Cancer Research Fund, 44 Lincoln's Inn Fields, London WC2A, 3PX, UK. Tel.: 0171-269-3561. Fax: 0171-269-3417. E-mail: g.warren@europa.lif.icnet.uk
References
- Antony C, Cibert C, Geraud G, Santa A, Maria, Maro B, Mayau V, Goud B. The small GTP-binding protein rab6p is distributed from medial Golgi to the trans-Golgi network as determined by a confocal microscopic approach. J Cell Sci. 1992;103:785–796. doi: 10.1242/jcs.103.3.785. [DOI] [PubMed] [Google Scholar]
- Barr FA, Warren G. Disassembly and reassembly of the Golgi apparatus. Semin Cell Dev Biol. 1996;7:505–510. [Google Scholar]
- Barroso M, Nelson DS, Sztul E. Transcytosis-associated protein (TAP)/p115 is a general fusion factor required for binding of vesicles to acceptor membranes. Proc Natl Acad Sci USA. 1995;92:527–531. doi: 10.1073/pnas.92.2.527. [DOI] [PMC free article] [PubMed] [Google Scholar]
- Birky CW. The partitioning of cytoplasmic organelles at cell division. Int Rev Cytol. 1983;15:49–89. doi: 10.1016/b978-0-12-364376-6.50009-0. [DOI] [PubMed] [Google Scholar]
- Burke B, Griffiths G, Reggio H, Louvard D, Warren G. A monoclonal antibody against a 135-K Golgi membrane protein. EMBO (Eur Mol Biol Organ) J. 1982;1:1621–1628. doi: 10.1002/j.1460-2075.1982.tb01364.x. [DOI] [PMC free article] [PubMed] [Google Scholar]
- Chalfie M, Tu Y, Euskirchen G, Ward WW, Prasher DC. Green fluorescent protein as a marker for gene expression. Science (Wash DC) 1994;263:802–805. doi: 10.1126/science.8303295. [DOI] [PubMed] [Google Scholar]
- Cheng, P.C., and A. Kriete. 1995. Image contrast in confocal light microscopy. In Handbook of Biological Confocal Microscopy. J.B. Pawley, editor. Plenum Press, London. 281–310.
- Cole NB, Sciaky N, Marotta A, Song J, Lippincott-Schwartz J. Golgi dispersal during microtubule disruption—regeneration of Golgi stacks at peripheral endoplasmic-reticulum exit sites. Mol Biol Cell. 1996a;7:631–650. doi: 10.1091/mbc.7.4.631. [DOI] [PMC free article] [PubMed] [Google Scholar]
- Cole NB, Smith CL, Sciaky N, Teraskai M, Edidin M, LippincottSchwartz J. Diffusional mobility of Golgi proteins in membranes of living cells. Science (Wash DC) 1996b;273:797–801. doi: 10.1126/science.273.5276.797. [DOI] [PubMed] [Google Scholar]
- Colman A, Jones EA, Heasman J. Meiotic maturation in Xenopusoocytes: a link between the cessation of protein secretion and the polarized disappearance of Golgi apparati. J Cell Biol. 1985;101:313–318. doi: 10.1083/jcb.101.1.313. [DOI] [PMC free article] [PubMed] [Google Scholar]
- Cormack BP, Valdivia RH, Falkow S. FACS-optimized mutants of the green fluorescent protein. Gene. 1996;173:33–38. doi: 10.1016/0378-1119(95)00685-0. [DOI] [PubMed] [Google Scholar]
- Corthesy-Theulaz I, Pauloin A, Pfeffer S. Cytoplasmic dynein participates in the centrosomal localization of the Golgi complex. J Cell Biol. 1992;118:1333–1345. doi: 10.1083/jcb.118.6.1333. [DOI] [PMC free article] [PubMed] [Google Scholar]
- Cubitt AB, Heim R, Adams SR, Boyd AE, Gross LA, Tsien RY. Understanding, improving and using green fluorescent proteins. Trends Biochem Sci. 1995;20:448–455. doi: 10.1016/s0968-0004(00)89099-4. [DOI] [PubMed] [Google Scholar]
- Darnell RB. Independent regulation by sodium butyrate of gonadotropin alpha gene expression and cell cycle progression in HeLa cells. Mol Cell Biol. 1984;4:829–839. doi: 10.1128/mcb.4.5.829. [DOI] [PMC free article] [PubMed] [Google Scholar]
- Farquhar MG, Palade GE. The Golgi apparatus (complex)— (1954–1981)—from artifact to center stage. J Cell Biol. 1981;91:77–103. doi: 10.1083/jcb.91.3.77s. [DOI] [PMC free article] [PubMed] [Google Scholar]
- Featherstone C, Griffiths G, Warren G. Newly synthesized G protein of vesicular stomatitis virus is not transported to the Golgi complex in mitotic cells. J Cell Biol. 1985;101:2036–2046. doi: 10.1083/jcb.101.6.2036. [DOI] [PMC free article] [PubMed] [Google Scholar]
- Goodnight J, Mischak H, Kolch W, Mushinski JF. Immunocytochemical localization of 8 protein-kinase-C isozymes overexpressed in NIH 3T3 fibroblasts—isoform-specific association with microfilaments, Golgi, endoplasmic-reticulum, and nuclear and cell-membranes. J Biol Chem. 1995;270:9991–10001. doi: 10.1074/jbc.270.17.9991. [DOI] [PubMed] [Google Scholar]
- Gorman CM, Howard BH. Expression of recombinant plasmids in mammalian cells is enhanced by sodium butyrate. Nucleic Acids Res. 1983;11:7631–7648. doi: 10.1093/nar/11.21.7631. [DOI] [PMC free article] [PubMed] [Google Scholar]
- Griffiths G, Simons K. The trans Golgi network: sorting at the exit site of the Golgi complex. Science (Wash DC) 1986;234:438–443. doi: 10.1126/science.2945253. [DOI] [PubMed] [Google Scholar]
- Griffiths G, Warren G, Quinn P, Mathieu O, Costello, Hoppeler H. Density of newly synthesized plasma membrane proteins in intracellular membranes. I. Stereological studies. J Cell Biol. 1984;98:2133–2141. doi: 10.1083/jcb.98.6.2133. [DOI] [PMC free article] [PubMed] [Google Scholar]
- Hauri HP, Schweizer A. The endoplasmic reticulum-Golgi intermediate compartment. Curr Opin Cell Biol. 1992;4:600–608. doi: 10.1016/0955-0674(92)90078-Q. [DOI] [PMC free article] [PubMed] [Google Scholar]
- Heintz N, Sive HL, Roeder RG. Regulation of human histone gene expression: kinetics of accumulation and changes in the rate of synthesis and in the half-lives of individual histone mRNA's during the HeLa cell cycle. Mol Cell Biol. 1983;3:539–550. doi: 10.1128/mcb.3.4.539. [DOI] [PMC free article] [PubMed] [Google Scholar]
- Hurtley SM, Helenius A. Protein oligomerization in the endoplasmic reticulum. Annu Rev Cell Biol. 1989;5:277–307. doi: 10.1146/annurev.cb.05.110189.001425. [DOI] [PubMed] [Google Scholar]
- Jackman M, Firth M, Pines J. Human cyclins B1 and B2 are localized to strikingly different structures—B1 to microtubules, B2 primarily to the Golgi apparatus. EMBO (Eur Mol Biol Organ) J. 1995;14:1646–1654. doi: 10.1002/j.1460-2075.1995.tb07153.x. [DOI] [PMC free article] [PubMed] [Google Scholar]
- Ktistakis NT, Brown HA, Sternweis PC, Roth MG. Phospholipase-D is present on Golgi-enriched membranes and its activation by ADPribosylation factor is sensitive to brefeldin-A. Proc Natl Acad Sci USA. 1995;92:4952–4956. doi: 10.1073/pnas.92.11.4952. [DOI] [PMC free article] [PubMed] [Google Scholar]
- Lehel C, Olah Z, Jakab G, Anderson WB. Protein-kinase C-epsilon is localized to the Golgi via its zinc-finger domain and modulates Golgi function. Proc Natl Acad Sci USA. 1995;92:1406–1410. doi: 10.1073/pnas.92.5.1406. [DOI] [PMC free article] [PubMed] [Google Scholar]
- Letourneur F, Gaynor EC, Hennecke S, Demolliere C, Duden R, Emr SD, Riezman H, Cosson P. Coatomer is essential for retrieval of dilysine-tagged proteins to the endoplasmic–reticulum. Cell. 1994;79:1199–1207. doi: 10.1016/0092-8674(94)90011-6. [DOI] [PubMed] [Google Scholar]
- Levine TP, Rabouille C, Kieckbusch RH, Warren G. Binding of the vesicle docking protein p115 to Golgi membranes is inhibited under mitotic conditions. J Biol Chem. 1996;271:17304–17311. doi: 10.1074/jbc.271.29.17304. [DOI] [PubMed] [Google Scholar]
- Linstedt AD, Hauri HP. Giantin, a novel conserved Golgi membrane-protein containing a cytoplasmic domain of at least 350-kda. Mol Biol Cell. 1993;4:679–693. doi: 10.1091/mbc.4.7.679. [DOI] [PMC free article] [PubMed] [Google Scholar]
- Lippincott-Schwartz J, Cole NB, Marotta A, Conrad PA, Bloom GS. Kinesin is the motor for microtubule-mediated Golgi-to-ER membrane traffic. J Cell Biol. 1995;128:293–306. doi: 10.1083/jcb.128.3.293. [DOI] [PMC free article] [PubMed] [Google Scholar]
- Lipsky NG, Pagano RE. A vital stain for the Golgi apparatus. Science (Wash DC) 1985;228:745–747. doi: 10.1126/science.2581316. [DOI] [PubMed] [Google Scholar]
- Louvard D, Reggio H, Warren G. Antibodies to the Golgi complex and the rough endoplasmic reticulum. J Cell Biol. 1982;92:92–107. doi: 10.1083/jcb.92.1.92. [DOI] [PMC free article] [PubMed] [Google Scholar]
- Lucocq JM, Warren G. Fragmentation and partitioning of the Golgi apparatus during mitosis in HeLa cells. EMBO (Eur Mol Biol Organ) J. 1987;6:3239–3246. doi: 10.1002/j.1460-2075.1987.tb02641.x. [DOI] [PMC free article] [PubMed] [Google Scholar]
- Lucocq JM, Pryde JG, Berger EG, Warren G. A mitotic form of the Golgi apparatus in HeLa cells. J Cell Biol. 1987;104:865–874. doi: 10.1083/jcb.104.4.865. [DOI] [PMC free article] [PubMed] [Google Scholar]
- Lucocq JM, Berger EG, Warren G. Mitotic Golgi fragments in HeLa cells and their role in the reassembly pathway. J Cell Biol. 1989;109:463–474. doi: 10.1083/jcb.109.2.463. [DOI] [PMC free article] [PubMed] [Google Scholar]
- Mellman I, Simons K. The Golgi complex: in vitro veritas? . Cell. 1992;68:829–840. doi: 10.1016/0092-8674(92)90027-A. [DOI] [PMC free article] [PubMed] [Google Scholar]
- Misteli T, Warren G. COP-coated vesicles are involved in the mitotic fragmentation of Golgi stacks in a cell-free system. J Cell Biol. 1994;125:269–282. doi: 10.1083/jcb.125.2.269. [DOI] [PMC free article] [PubMed] [Google Scholar]
- Misteli T, Warren G. Mitotic disassembly of the Golgi apparatus in vivo. J Cell Sci. 1995a;108:2715–2727. doi: 10.1242/jcs.108.7.2715. [DOI] [PubMed] [Google Scholar]
- Misteli T, Warren G. A role for tubular networks and a COP I–independent pathway in the mitotic fragmentation of Golgi stacks in a cell-free system. J Cell Biol. 1995b;130:1027–1039. doi: 10.1083/jcb.130.5.1027. [DOI] [PMC free article] [PubMed] [Google Scholar]
- Moremen KW, Touster O, Robbins PW. Novel purification of the catalytic domain of Golgi α-mannosidase II. Characterization and comparison with the intact enzyme. J Biol Chem. 1991;266:16876–16885. [PubMed] [Google Scholar]
- Nakamura N, Rabouille C, Watson R, Nilsson T, Hui N, Slusarewicz P, Kreis T E, Warren G. Characterization of a cis-Golgi matrix protein, GM130. J Cell Biol. 1995;131:1715–1726. doi: 10.1083/jcb.131.6.1715. [DOI] [PMC free article] [PubMed] [Google Scholar]
- Nakamura N, Lowe M, Levine TP, Rabouille C, Warren G. The vesicle docking protein p115 binds GM130, a cis-Golgi matrix protein, in a mitotically regulated manner. Cell. 1997;89:445–455. doi: 10.1016/s0092-8674(00)80225-1. [DOI] [PubMed] [Google Scholar]
- Nigg EA, Hilz H, Eppenberger HM, Dutly F. Rapid and reversible translocation of the catalytic subunit of cAMP-dependent protein kinase type II from the Golgi complex to the nucleus. EMBO (Eur Mol Biol Organ) J. 1985;4:2801–2806. doi: 10.1002/j.1460-2075.1985.tb04006.x. [DOI] [PMC free article] [PubMed] [Google Scholar]
- Nilsson T, Pypaert M, Hoe MH, Slusarewicz P, Berger EG, Warren G. Overlapping distribution of two glycosyltransferases in the Golgi apparatus of HeLa cells. J Cell Biol. 1993;120:5–13. doi: 10.1083/jcb.120.1.5. [DOI] [PMC free article] [PubMed] [Google Scholar]
- Nilsson T, Hoe MH, Slusarewicz P, Rabouille C, Watson R, Hunte F, Watzele G, Berger EG, Warren G. Kin recognition between medial Golgi enzymes in HeLa cells. EMBO (Eur Mol Biol Organ) J. 1994;13:562–574. doi: 10.1002/j.1460-2075.1994.tb06294.x. [DOI] [PMC free article] [PubMed] [Google Scholar]
- Nilsson T, Rabouille C, Hui N, Watson R, Warren G. The role of the membrane-spanning domain and stalk region of N-acetylglucosaminyltransferase-I in retention, kin recognition and structural maintenance of the Golgi-apparatus in HeLa cells. J Cell Sci. 1996;109:1975–1989. doi: 10.1242/jcs.109.7.1975. [DOI] [PubMed] [Google Scholar]
- Olson KR, McIntosh JR, Olmsted JB. Analysis of MAP 4 in living cells using green fluorescent protein (GFP) chimeras. J Cell Biol. 1995;130:639–650. doi: 10.1083/jcb.130.3.639. [DOI] [PMC free article] [PubMed] [Google Scholar]
- Pelham HRB. Sorting and retrieval between the endoplasmic reticulum and Golgi apparatus. Curr Opin Cell Biol. 1995;7:530–535. doi: 10.1016/0955-0674(95)80010-7. [DOI] [PubMed] [Google Scholar]
- Peters JM, Walsh MJ, Franke WW. An abundant and ubiquitous homo-oligomeric ring-shaped ATPase particle related to the putative vesicle fusion proteins, Sec18p and NSF. EMBO (Eur Mol Biol Organ) J. 1990;9:1757–1767. doi: 10.1002/j.1460-2075.1990.tb08300.x. [DOI] [PMC free article] [PubMed] [Google Scholar]
- Ponnambalam S, Rabouille C, Luzio JP, Nilsson T, Warren G. The TGN38 glycoprotein contains two nonoverlapping signals that mediate localization to the trans-Golgi network. J Cell Biol. 1994;125:253–268. doi: 10.1083/jcb.125.2.253. [DOI] [PMC free article] [PubMed] [Google Scholar]
- Ponnambalam S, Girotti M, Yaspo ML, Owen CE, Perry ACF, Suganuma T, Nilsson T, Fried M, Banting G, Warren G. Primate homologues of rat TGN38: primary structure, expression and functional implications. J Cell Sci. 1996;109:675–685. doi: 10.1242/jcs.109.3.675. [DOI] [PubMed] [Google Scholar]
- Pypaert M, Nilsson T, Berger EG, Warren G. Mitotic Golgi clusters are not tubular endosomes. J Cell Sci. 1993;104:811–818. doi: 10.1242/jcs.104.3.811. [DOI] [PubMed] [Google Scholar]
- Rabouille C, Hui N, Hunte F, Kieckbusch R, Berger EG, Warren G, Nilsson T. Mapping the distribution of Golgi enzymes involved in the construction of complex oligosaccharides. J Cell Sci. 1995;108:1617–1627. doi: 10.1242/jcs.108.4.1617. [DOI] [PubMed] [Google Scholar]
- Rambourg A, Clermont Y, Hermo L, Segretain D. Tridimensional structure of the Golgi apparatus of non-ciliated epithelial cells of the ductuli efferentes in rat: an electron microscopic stereoscopic study. Biol Cell. 1987;60:103–116. doi: 10.1111/j.1768-322x.1987.tb00550.x. [DOI] [PubMed] [Google Scholar]
- Rappaport R. Establishment of the mechanisms of cytokinesis in animal cells. Int Rev Cytol. 1986;105:245–281. doi: 10.1016/s0074-7696(08)61065-7. [DOI] [PubMed] [Google Scholar]
- Roth J. Subcellular organisation of glycosylation in mammalian cells. Biochim Biophys Acta. 1987;906:405–436. doi: 10.1016/0304-4157(87)90018-9. [DOI] [PubMed] [Google Scholar]
- Rothman JE. Mechanisms of intracellular protein transport. Nature (Lond) 1994;372:55–63. doi: 10.1038/372055a0. [DOI] [PubMed] [Google Scholar]
- Saiki RK, Gelfand DH, Stoffel S, Scharf SJ, Higuchi R, Horn GT, Mullis KB, Erlich HA. Primer-directed enzymatic amplification of DNA with a thermostable DNA polymerase. Science (Wash DC) 1988;239:487–491. doi: 10.1126/science.2448875. [DOI] [PubMed] [Google Scholar]
- Seelig HP, Schranz P, Schroter H, Wiemann C, Griffiths G, Renz M. Molecular genetic analyses of a 376-kilodalton Golgi complex membrane protein (giantin) Mol Cell Biol. 1994;14:2564–2576. doi: 10.1128/mcb.14.4.2564. [DOI] [PMC free article] [PubMed] [Google Scholar] [Retracted]
- Sönnichsen B, Watson R, Clausen H, Misteli T, Warren G. Sorting by COP I vesicles under interphase and mitotic conditions. J Cell Biol. 1996;134:1411–1425. doi: 10.1083/jcb.134.6.1411. [DOI] [PMC free article] [PubMed] [Google Scholar]
- Souter E, Pypaert M, Warren G. The Golgi stack reassembles during telophase before arrival of proteins transported from the endoplasmic reticulum. J Cell Biol. 1993;122:533–540. doi: 10.1083/jcb.122.3.533. [DOI] [PMC free article] [PubMed] [Google Scholar]
- Steinberg MS. Reconstruction of tissues by dissociated cells. Science (Wash DC) 1963;141:401–408. doi: 10.1126/science.141.3579.401. [DOI] [PubMed] [Google Scholar]
- Tamaki H, Yamashina S. Changes in cell polarity during mitosis in rat parotid acinar cells. J Histochem Cytochem. 1991;39:1077–1087. doi: 10.1177/39.8.1856456. [DOI] [PubMed] [Google Scholar]
- Thyberg J, Moskalewski S. Subpopulations of microtubules with differential sensitivity to nocodazole: role in the structural organization of the Golgi complex and the lysosomal system. J Submicrosc Cytol Pathol. 1989;21:259–274. [PubMed] [Google Scholar]
- Warren G. Membrane traffic and organelle division. Trends Biochem Sci. 1985;10:439–443. [Google Scholar]
- Warren G. Membrane partitioning during cell division. Annu Rev Biochem. 1993;62:323–348. doi: 10.1146/annurev.bi.62.070193.001543. [DOI] [PubMed] [Google Scholar]
- Warren G, Wickner W. Organelle inheritance. Cell. 1996;84:395–400. doi: 10.1016/s0092-8674(00)81284-2. [DOI] [PubMed] [Google Scholar]
- Warren G, Levine T, Misteli T. Mitotic disassembly of the mammalian Golgi-apparatus. Trends Cell Biol. 1995;5:413–416. doi: 10.1016/s0962-8924(00)89094-7. [DOI] [PubMed] [Google Scholar]
- Waters MG, Clary DO, Rothman JE. A novel 115-kD peripheral membrane protein is required for intercisternal transport in the Golgi stack. J Cell Biol. 1992;118:1015–1026. doi: 10.1083/jcb.118.5.1015. [DOI] [PMC free article] [PubMed] [Google Scholar]
- Wilson EB. The distribution of the chondriosomes to the spermatozoa in scorpions. Proc Natl Acad Sci USA. 1916;2:321–324. doi: 10.1073/pnas.2.6.321. [DOI] [PMC free article] [PubMed] [Google Scholar]
- Zeligs JD, Wollman SH. Mitosis in rat thyroid epithelial cells in vivo.I. Ultrastructural changes in cytoplasmic organelles during the mitotic cycle. J Ultrastruct Res. 1979;66:53–77. doi: 10.1016/s0022-5320(79)80065-9. [DOI] [PubMed] [Google Scholar]


