

Abstract
We have used clonal analysis and time-lapse video recording to study the proliferative behavior of purified oligodendrocyte precursor cells isolated from the perinatal rat optic nerve growing in serum-free cultures. First, we show that the cell cycle time of precursor cells decreases with increasing concentrations of PDGF, the main mitogen for these cells, suggesting that PDGF levels may regulate the cell cycle time during development. Second, we show that precursor cells isolated from embryonic day 18 (E18) nerves differ from precursor cells isolated from postnatal day 7 (P7) or P14 nerves in a number of ways: they have a simpler morphology, and they divide faster and longer before they stop dividing and differentiate into postmitotic oligodendrocytes. Third, we show that purified E18 precursor cells proliferating in culture progressively change their properties to resemble postnatal cells, suggesting that progressive maturation is an intrinsic property of the precursors. Finally, we show that precursor cells, especially mature ones, sometimes divide unequally, such that one daughter cell is larger than the other; in each of these cases the larger daughter cell divides well before the smaller one, suggesting that the precursor cells, just like single-celled eucaryotes, have to reach a threshold size before they can divide. These and other findings raise the possibility that such stochastic unequal divisions, rather than the stochastic events occurring in G1 proposed by “transition probability” models, may explain the random variability of cell cycle times seen within clonal cell lines in culture.
Controls on mammalian cell division and differentiation are complex and difficult to analyze. Time-lapse video recording of cells in culture provides a powerful way of simplifying the analysis, as one can follow every moment of a cell's growth, division, death, and differentiation in a controlled environment. Most of such studies have been done either with cell lines that are abnormal in at least some aspects of proliferation and differentiation control or with primary fibroblasts that are usually an undefined mixture of cell types. We have used time-lapse video recording to study purified oligodendrocyte precursor cells isolated from the perinatal rat optic nerve. These normal cells have the advantage that they can be grown in serum-free medium at clonal density under conditions where they go through a limited number of divisions before they stop and differentiate, on a schedule that closely resembles that in vivo (Barres et al., 1994).
Oligodendrocytes myelinate axons in the vertebrate central nervous system (CNS).1 In the rat optic nerve they develop from precursor cells that migrate into the nerve from the brain, beginning at about embryonic day 15 (E15; Small et al., 1987). It is not known how many precursor cells enter the nerve or how long the immigration process continues for. After a limited number of divisions, the precursor cells stop dividing and terminally differentiate (Temple and Raff, 1986). Oligodendrocytes first develop in the nerve around birth (Miller et al., 1985) and continue to increase in number for six postnatal weeks (Skoff et al., 1976; Barres et al., 1992). The mechanisms that control the number of oligodendrocytes in the nerve have been extensively studied (for review see Barres and Raff, 1994).
Clonal analyses performed on single (Temple and Raff, 1986) or purified (Barres et al., 1994) precursor cells isolated from postnatal day 7–8 (P7–8) rat optic nerve indicate that the cells divide about once a day and are heterogeneous in the number of times they divide before they differentiate, varying between zero and eight times. The progeny of an individual precursor cell, however, tend to stop dividing and differentiate into oligodendrocytes at about the same time; even when the two daughter cells of a single precursor cell division are cultured separately, they tend to divide the same number of times before they differentiate (Temple and Raff, 1986). These findings suggest that an intrinsic clock operates in each precursor cell to help control when it stops dividing and differentiates.
The normal operation of the intracellular clock, however, depends on at least three types of extracellular signaling molecules: (a) survival signals, which suppress the intrinsic suicide program present in most animal cells (Barres et al., 1992, 1993; Weil et al., 1996); (b) mitogens, especially PDGF (Noble et al., 1988; Raff et al., 1988; Richardson et al., 1988), which stimulates cell proliferation; and (c) hydrophobic signals such as thyroid hormone (TH) or retinoic acid (RA), which help the cells stop dividing when the appropriate time is reached (Barres et al., 1994). In the absence of survival signals, the cells undergo programmed cell death (Barres et al., 1992); in the absence of mitogens, they rapidly stop dividing and prematurely differentiate (Raff et al., 1983; Noble and Murray, 1984; Temple and Raff, 1985), and, in the absence of TH and RA, most of the cells fail to withdraw from the cell cycle and fail to differentiate (Barres et al., 1994).
In the present study we have examined the proliferative behavior of precursor cells purified from E18, P7, and P14 rat optic nerve, in both clonal-density and higher density cultures, by periodic counting of clone size or by continuous time-lapse video recording. Our main aim was to determine why precursor cells in the same age nerve differ in their proliferative properties. We show that the younger precursor cells have shorter cell cycle times and tend to divide more times before they differentiate than the older precursor cells. This finding suggests that the precursor cells progressively mature as they proliferate and that differences in precursor cell maturation are largely responsible for the heterogeneous proliferative behavior of the precursor cells in the postnatal optic nerve. Our finding that purified embryonic precursor cells mature in culture suggests that maturation is an intrinsic property of the cells. We show that, although the two daughter cells of single precursor cells tend to have similar cell cycle times, this is not always the case; and when there is a large difference in these times, it is because the two cells were produced by an unequal division, with the larger cell always dividing first. This finding suggests that the cells have to reach a threshold size before they can divide. Such unequal divisions occur more frequently in older precursor cells, apparently because older cells tend to extend longer and more complex processes and sometimes fail to withdraw them before dividing; the daughter cell that inherits the processes is substantially larger than the one that does not. We also show that the cell cycle time of the precursor cells varies inversely with the concentration of PDGF, suggesting that PDGF levels regulate cell cycle time during precursor cell development.
Materials and Methods
Animals and Chemicals
Sprague/Dawley rats were obtained from the Animal Facility at University College London (London, UK). Chemicals were purchased from Sigma Chemical Co. (St. Louis, MO), except where indicated. Recombinant human PDGF-AA and neurotrophin-3 (NT-3) were purchased from Peprotech (Rocky Hill, NJ).
Preparation of Optic Nerve Cells
Optic nerves were removed from E18, P7, or P14 rats, minced, and incubated at 37°C for 75 min in papain solution (165 U; Boehringer Mannheim, Indianapolis, IN) in Hepes-buffered minimal Eagle's medium (MEM/HEPES). Cells were dissociated by trituration, using a Gilson Pipetman set at 500 μl, and filtered through Nitex mesh (20-μm pore size; Tetko, London, UK). They were washed sequentially in a low concentration of ovomucoid and BSA (1.5 mg/ml of each) in MEM/HEPES and then a high concentration of ovomucoid and BSA (6 mg/ml of each).
Purification of Oligodendrocyte Precursor Cells
Oligodendrocyte precursor cells were purified by sequential immunopanning, as described previously (Barres et al., 1992). In brief, dissociated optic nerve cells were resuspended in 10 ml of L15 Air Medium (GIBCO BRL, Gaithersburg, MD), containing 0.2 mg/ml BSA and 10 μg/ml bovine insulin, and plated on a 100-mm bacteriological petri dish (Falcon) coated with monoclonal anti-galactocerebroside (GC) antibody (supernatant diluted 1:3; Ranscht et al., 1982). The dish was kept for 45 min at room temperature, and it was gently shaken every 15 min. The nonadherent cells were transferred to a second dish coated with the A2B5 monoclonal antibody (ascites fluid diluted 1:2000; Eisenbarth et al., 1979) and incubated for another 45 min. The final dish was then washed five to eight times with 6 ml of MEM/HEPES, and the remaining adherent oligodendrocyte precursor cells were dislodged by trypsin treatment (0.012% in EBSS) and washed in L15 Air Medium containing 20% FCS.
Clonal Cultures of Precursor Cells
The purified oligodendrocyte precursor cells were counted and plated at clonal density (800–1,000 P7 or P14 cells or 2,000 E18 cells in 3 ml of culture medium) in poly-d-lysine (PDL)-coated 25-cm2 flasks (Falcon). In cultures of P7 or P14 cells, after 4 d in vitro, there were <2 contaminating cells per flask, and in cultures of E18 cells, there were <50 contaminating cells per flask; these did not divide and tended to die. In some cases they were cultured in PDL-coated, slide flasks (400 cells in 1.5 ml of medium, Nunc, Roskilde, Denmark). The cells were cultured in DME containing bovine insulin (10 μg/ml), human transferrin (100 μg/ml), BSA (100 μg/ ml), progesterone (60 ng/ml), putrescine (16 μg/ml), sodium selenite (40 ng/ml), N-acetyl-cysteine (60 μg/ml), forskolin (5 μM), trace minerals (GIBCO BRL), and penicillin and streptomycin (GIBCO BRL). Depending on the specific experiment, PDGF (usually at 10 ng/ml), NT-3 (5 ng/ ml), or triiodothyronine (TH, 30 ng/ml) were added.
Cultures were maintained in a 5% CO2 incubator at 37°C. If cultures were maintained for >4 d, 50% of the medium was replaced with freshly made medium every 4 d. Oligodendrocytes and oligodendrocyte precursor cells were identified by their characteristic morphologies (Temple and Raff, 1986) and, in some cases, by immunostaining with A2B5 or anti-GC antibodies (see below). Clones were scored as oligodendrocyte or precursor cell clones according to the predominant cell type present in the clone. In most cases, >90% of the cells in a clone were of the same type.
Immunofluorescence Assays
Immunofluorescence assays were carried out with cells on either PDL-coated coverslips or PDL-coated slide flasks. For staining surface antigens, the cells were fixed with 2% paraformaldehyde for 2 min at room temperature and incubated for 30 min in blocking solution consisting of 50% goat serum in Tris buffer (pH 7.4) containing 1% BSA and 150 mM l-lysine. The cells were then incubated in either anti-GC antibody (supernant diluted 1:1) followed by Texas red-conjugated goat anti–mouse IgG (diluted 1:100; Jackson ImmunoResearch Laboratory, West Grove, PA), or A2B5 antibody (ascites fluid diluted 1:100) followed by fluorescein-conjugated goat anti–mouse IgM (diluted 1:100; Jackson ImmunoResearch Laboratory). The coverslips were mounted in Citifluor mounting medium (CitiFluor, London, UK), sealed with nail polish, and examined with a fluorescence microscope (Axioskop; Zeiss, Inc., Thornwood, NY).
Time-Lapse Video Recording
Time-lapse analysis was performed as previously described (Gao et al., 1997). Briefly, purified oligodendrocyte precursor cells were cultured at clonal density in 25-cm2 flasks, as described above. Individual clones were continuously followed on a heated stage of an inverted phase-contrast microscope (Zeiss, Inc.) coupled to an Sony CCD video camera and time-lapse video cassette recorder. Cell cycle times were determined by measuring the time between mitotic telophases. Images were captured from the video recorder using an image grabber.
Results
As previously described, when purified P7 precursor cells were cultured at clonal density in plateau concentrations of mitogens and TH, the cells divided a variable number of times (from zero to eight) before they stopped and differentiated (Barres et al., 1994). Moreover, as expected, when the cells were cultured in the presence of mitogens but in the absence of TH, very few cells stopped dividing and differentiated (Barres et al., 1994), but the cell cycle times, either deduced from the sizes of the clones at various times or measured directly by time-lapse video recording, varied greatly. The following experiments were performed mainly to determine the origins of this heterogeneity in proliferative capacity and cell cycle times in precursor cells isolated from the same age nerves.
Cell Cycle Times Decrease as the Concentration of PDGF Is Increased
Before examining the origins of proliferative heterogeneity, we examined the influence of PDGF concentration on cell cycle time. We cultured purified P7 precursor cells at clonal density for 4 d in varying concentrations of PDGF, from 0.1 to 10 ng/ml. TH was omitted to prevent most of the cells from exiting the cell cycle and differentiating (Barres et al., 1994). As shown in Fig. 1, the number of cells per clone progressively increased with increasing concentrations of PDGF. At 0.1 ng/ml most of the cells had stopped dividing and had become oligodendrocytes by 4 d, as without adequate mitogen stimulation, precursor cells differentiate even in the absence of TH (Barres et al., 1994). At 0.3 ng/ml only a few clones had become oligodendrocyte clones, and at 1.0 and 10 ng/ml none of the clones had done so, even when the cells were cultured up to 8 d (not shown). Decreased cell death seemed not to be responsible for the increased number of cells per clone with increasing concentrations of PDGF, as very few dead cells were seen by 4 d at any of the PDGF concentrations used; it was shown previously that 0.1 ng/ml of PDGF is saturating for precursor cell survival (Barres et al., 1993). The increased cell cycle time at low PDGF concentration was also confirmed by time-lapse video recording (data not shown). Our findings, therefore, suggest that the cell cycle time progressively decreases as PDGF concentration is increased from 0.3 to 1.0 ng/ml and from 1.0 to 10 ng/ml. In the following experiments, PDGF was used at 10 ng/ml, which was saturating for cell proliferation in our clonal assay (not shown); 10 ng/ml PDGF was previously shown to be on a plateau for the induction of DNA synthesis in oligodendrocyte precursor cells (Barres et al., 1993).
Figure 1.

Increasing clonal size with increasing concentrations of PDGF. Purified P7 precursor cells were cultured at clonal density for 4 d in varying concentrations of PDGF and in the absence of TH, and the number of cells in each clone was counted in an inverted phase-contrast microscope. Half the medium was replaced at 2 d. The results are expressed as mean ± SEM of at least 100 clones. As judged by morphology (Temple and Raff, 1986), at 0.1 ng/ml PDGF, most clones were oligodendrocyte clones; at 0.3 ng/ ml most were still precursor clones and at 1.0 and 10 ng/ml all were still precursor clones.
Embryonic Precursor Cells Divide More Times before Differentiating Than Do Postnatal Ones
One possible explanation for the heterogeneity in the proliferative capacity of P7 precursor cells in the presence of plateau concentrations of mitogens and TH is that the cells differ in maturity, perhaps because their ancestors migrated into the optic nerve at different times. To explore this possibility, we studied the behavior of precursor cells purified from either E18 optic nerves (which would be expected to be less mature and more homogeneous in proliferation potential than P7 precursors) or P14 nerves (which would be expected to be more mature than P7 precursors). The cells were cultured at clonal density in the presence of mitogens and TH to allow the normal clock mechanism to operate, and the size of each clone was determined after 3, 6, 9, or 11 d in culture. As shown in Fig. 2, the average number of cells per clone was much greater for E18 cells than for P7 or P14 cells at 6 and 9 d; by 9 d, when most P7 cells had stopped dividing and had differentiated, the average clone size for P7 and P14 cells was <40 cells, whereas the average clone size for E18 cells was >160 cells, and many of these clones were still growing. Furthermore, as shown in Fig. 3, whereas only 1% of the P7 cells divided seven times by 6 d in vitro, ∼70% of the E18 cells did so. On average, P14 cells divided even fewer times than P7 cells (not shown). After 11 d in vitro, some E18 cell clones contained >1,024 cells, indicating that the cells had divided up to 10 or 11 times, whereas no P7 clones contained >256 cells (eight divisions) and no P14 clones contained >128 cells (seven divisions; not shown). Moreover, by 11 d almost all of the P7 and P14 cells had become oligodendrocytes, whereas many of the E18 cells were still dividing precursor cells. Thus the number of times a precursor cell divides before differentiating seems to decrease progressively with maturation. In addition, as shown in Fig. 3, E18 cells were much more homogeneous in their proliferative capacity than P7 cells. The finding that E18 precursor cells are more homogeneous and divide more times before they differentiate than P7 or P14 precursor cells suggests that one important source of heterogeneity in the proliferative behavior of P7 precursor cells is that the cells are heterogeneous in terms of their maturation.
Figure 2.

Clonal size in cultures of purified E18, P7, or P14 precursor cells in the presence of both mitogens and TH. The number of cells in each clone was counted on days 3, 6, and 9 in vitro, and 50–100 clones were averaged for each E18 time point and at least 100 clones for each P7 and P14 time point. By day 9 most of the P7 and P14 cells had stopped dividing and differentiated into oligodendrocytes, while many E18 cells were still precursor cells. The results are expressed as mean ± SEM.
Figure 3.


Proliferative capacity of purified P7 (A) and E18 (B) precursor cells cultured for 6 d at clonal density in the presence of both mitogens and TH. The cell number in each clone was recorded, and 50–100 clones were analyzed for each age. Clones containing 2 cells were classified as having gone through 1 division, 3–4 cells as 2 divisions, 5–8 cells as 3 divisions, and so on.
Embryonic Precursor Cells Divide Faster Than Do Postnatal Ones
To compare the cell cycle times of E18, P7, and P14 precursor cells, the cells were cultured at clonal density in the presence of mitogens but in the absence of TH. When clone sizes were assessed after 2 and 4 d in vitro, the calculated average cell cycle times were 21 h for E18 cells, 28 h for P7 cells, and 42 h for P14 cells (Fig. 4). Thus the cell cycle times of precursor cells seem to increase progressively with maturation in vivo, suggesting that differences in maturation may also be an important source of heterogeneity in the cell cycle times of P7 precursor cells.
Figure 4.

Clone size (A) and cell cycle time (B) in cultures of purified E18, P7, or P14 precursor cells cultured for 4 d at clonal density in the presence of mitogens but in the absence of TH to inhibit differentiation. The number of cells in each clone was counted; 50–100 clones were averaged for E18 cells and at least 100 clones for P7 and P14 cells. The cell cycle times were calculated from the average clone sizes. The results are expressed as mean ± SEM.
Unequal Cell Divisions Are Another Source of Cell Cycle-Time Heterogeneity
When purified P7 precursor cells were studied by time-lapse video recording while growing at clonal density in mitogens in the absence of TH, the time between mitoses ranged from 13 to 43 h, with an average of 27 ± 1 h (mean ± SEM, n = 60), which was similar to the calculated average cell cycle time shown in Fig. 4. Although some of this heterogeneity presumably reflected variation in the maturity of the precursor cells, this was not the only source of heterogeneity in cell cycle times, as even within a single clone there could be substantial heterogeneity. When the two daughter cells produced by the division of a precursor cell were followed, for example, they usually divided again at almost exactly the same time, but this was not always the case: in about 30% of the cases, one daughter divided well before the other (Table I). In all of these cases, the unequal behavior of the two daughter cells could be traced to their production by an unequal cell division in which the dividing cell failed to retract all of its processes before cytokinesis, so that one daughter inherited the processes and was therefore significantly larger than its sibling (Fig. 5). In each case the larger cell divided first, presumably because it attained a sufficient size to pass through the restriction point R in the G1 phase of the cell cycle (Pardee, 1974) earlier than did its smaller sibling. Thus unequal cell divisions is an additional cause of cell cycle-time heterogeneity among P7 precursors cells.
Table I.
Time of Sister Cell Divisions
| Symmetric divisions | Asymmetric divisions | |||
|---|---|---|---|---|
| 20.4/21.0 | 36.0/38.2 | 24.8/40.4 | ||
| 36.2/37.4 | 24.3/24.8 | 19.6/28.6 | ||
| 16.0/16.8 | 17.2/18.0 | 13.4/29.6 | ||
| 34.8/36.2 | 13.0/12.8 | 25.6/40.8 | ||
| 17.7/18.0 | 32.8/32.5 | 22.4/32.5 | ||
| 40.6/41.0 | 16.0/16.1 | 28.2/32.2 | ||
| 28.0/29.1 | 31.2/31.0 | 18.9/34.2 | ||
| 16.7/17.8 | 18.0/18.2 | 18.2/26.2 | ||
| 15.1/15.0 | 14.9/15.0 | 19.8/42.9 | ||
| 30.1/30.2 | 27.3/27.5 | 21.6/36.8 | ||
Purified P7 precursor cells were grown at clonal density in the presence of mitogens but in the absence of TH. Individual cells were followed by time-lapse video recording to determine when two sister cells produced by a cell division next divided. The results are shown as time of next division for sister cell 1/time of next division for sister cell 2 (both in hours).
Figure 5.

An unequal cell division and its consequences observed by time-lapse video recording. Purified P7 precursor cells were cultured as in Fig. 4. The cells shown at −1.5 and −0.5 h divided unequally at 0 h, with one daughter cell (cell 1) inheriting the two cell processes that failed to withdraw before cytokinesis occurred. Cell 1 went on to divide at +13.4 h, while its sister (cell 2) divided at +29.6 h.
Unequal Divisions Increase with Precursor Cell Maturity
When cells within individual clones of freshly purified P7 precursor cells were followed by time-lapse video recording in cultures containing mitogens but not TH, the first two divisions usually produced daughter cells that divided after about the same length of time, whereas many of the subsequent divisions produced daughter cells that divided after different lengths of time. A typical clone is diagrammed in Fig. 6. Thus cell cycle-time heterogeneity within P7 clones increased with time.
Figure 6.

Time-lapse video analysis of a single P7 precursor cell clone in a culture grown as in Fig. 4. The cells were cultured for 1 d before recording began, so that the first cell cycle was not recorded. Cell cycle times (in hours) were determined by measuring the time between mitotic telophases. One representative experiment is shown here; two other clones were analyzed with similar results. “Out” in this figure and the next refers to a cell that migrated out of the field of observation.
The complexity of the cell processes extended by P7 precursor cells also increased with time within clones (not shown), providing a possible explanation for the increase in unequal cell divisions that occurred with time in culture. To test this possibility we followed individual clones of purified E18 precursor cells by time-lapse video recording. When growing in mitogens in the absence of TH, most of these cells initially had a simple bipolar morphology, with two unbranched processes. Most cells within a clone produced simple bipolar daughter cells that went on to divide at almost the same time. With further divisions, however, the cells tended to have longer and more complex processes, and unequal divisions began to occur more frequently. A typical clone is diagrammed in Fig. 7. Thus, on average, E18 precursors had a simpler morphology and divided more equally than P7 precursor cells, and they only started dividing unequally when they developed more complex processes, supporting the possibility that there is a direct relationship between process complexity and unequal cell division.
Figure 7.
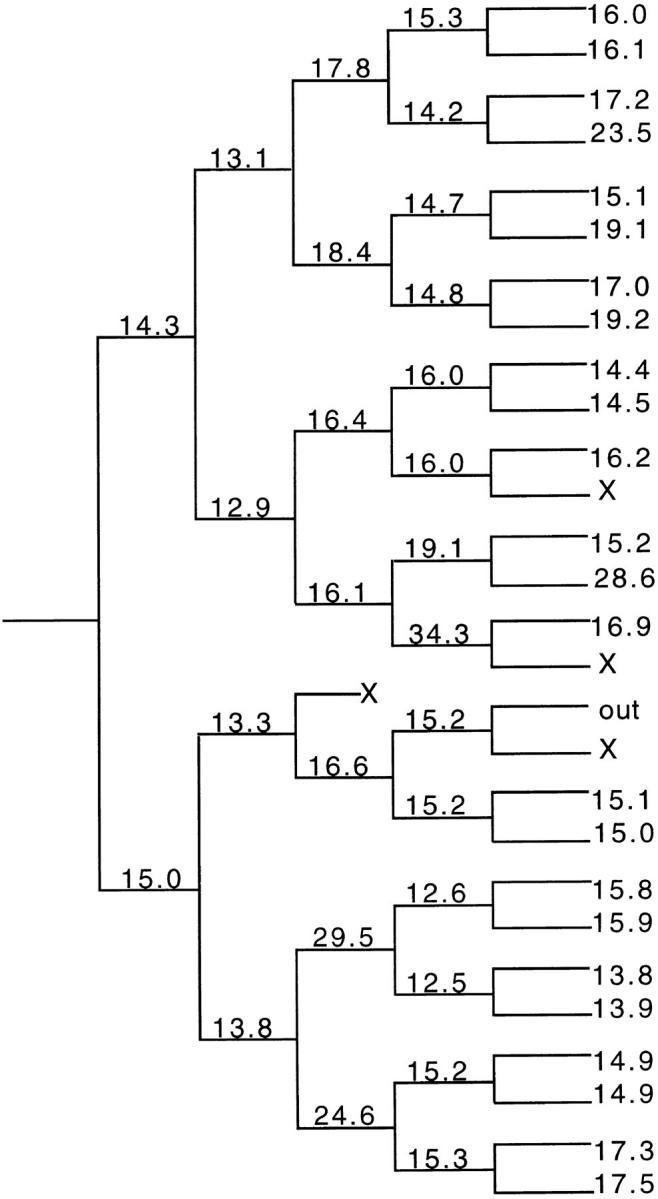
Time-lapse video analysis of a single E18 precursor cell clone in a culture grown and assessed as in Fig. 6. One representative experiment is shown here; one other clone was analyzed with similar results. Each X represents a cell that died (by apoptosis) for unknown reasons.
Cell Cycle Times within Clones Tend to Oscillate from One Generation to the Next
As seen in Figs. 6 and 7, there was a tendency for the cell cycle times of daughter cells produced by precursor cells within a clone to be longer if the previous cycle time was short and to be shorter if the previous cycle time was long. This could be seen more clearly when the average cycle times between divisions two and five in the two clones shown in Figs. 6 and 7 were plotted as shown in Fig. 8. We started video recording after the first cell division in culture, and the first recorded cycle (which was the second division in culture) tended to be longer than the next, possibly because the cells were recovering from the dissociation procedure during the first cycle in culture. The oscillatory behavior is unlikely to have resulted from cell–cell interactions within the clones, as the precursor cells were highly motile, and daughter cells tended to separate after cytokinesis and usually did not interact with each other or with other cells in the clone during the first five divisions. The oscillation of cell cycle times within a clone is consistent with the idea that a precursor cell has an intrinsic mechanism for regulating its size: a cell produced by a cycle that was shorter than average would tend to be smaller than average and would therefore need a longer than average time to grow to produce two daughter cells of average size; the opposite would be the case for a cell produced by a longer than average cycle.
Figure 8.


Oscillations in cell cycle times with each round of division in P7 and E18 clones. The data in A were taken from Fig. 6 and in B from Fig. 7; they are expressed as mean ± SEM for each cell generation.
Purified E18 Precursor Cells Can Mature in the Absence of TH
When the migration rates of purified E18 and P7 precursor cells were measured in clonal cultures by time-lapse video recording, it was found that E18 cells migrated faster than P7 cells (Table II). Thus, E18 precursor cells differed from P7 precursor cells in several ways: they had a simpler morphology, they divided faster, and they migrated faster. To determine whether E18 precursor cells can mature in culture so as to resemble P7 precursor cells in morphology, cell cycle time, and rate of migration, we cultured purified E18 precursor cells in the presence of mitogens and the absence of TH for 10 d. As shown in Fig. 9, the morphology of the E18 cells changed during the 10 d culture period: their processes became longer and more complex, so that the cells resembled P7 precursor cells. Similarly, their migration rate slowed to resemble that of P7 cells (Table II). Moreover, when we removed the E18 cells from the flask after 10 d in vitro and recultured them at clonal density, still in the presence of mitogens and in the absence of TH, their cell cycle times were now indistinguishable from those of P7 (Fig. 10). These findings suggest that E18 precursor cells can mature in culture in the absence of TH and other cell types, much as they do in vivo.
Table II.
The Migration Rates of Oligodendrocyte Precursor Cells In Vitro
| E18 | P7 | E18 + 10 DIV | ||||
|---|---|---|---|---|---|---|
| Migration rate (μm/h) | 30 ± 3 | 22 ± 2 | 20 ± 2 |
Purified P7 or E18 precursor cells, or E18 precursor cells that were passaged after 10 d in culture, were cultured as in Fig. 4 at low density and followed by time-lapse video recording. The migration rates during two 4-h periods between days one and two in culture were calculated for 7 E18 cells, 14 P7 cells, and 13 E18 + 10 DIV cells. The average migration rates are expressed as mean ± SEM.
Figure 9.
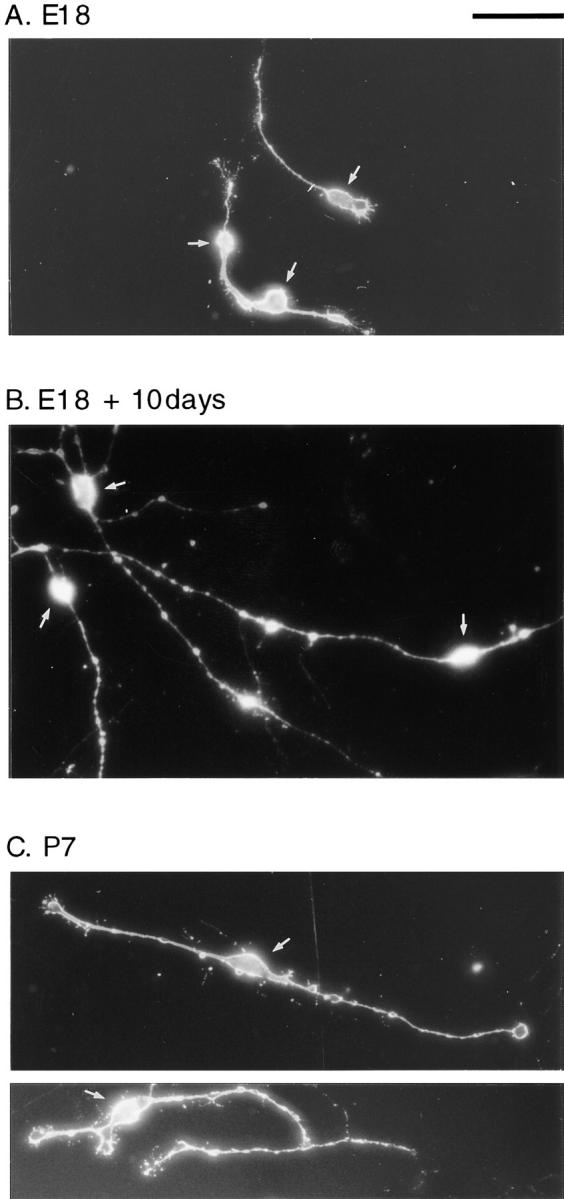
Morphological maturation of E18 precursor cells in culture. Purified E18 (A) and P7 precursor cells (C) were cultured for 2 d in slide flask as in Fig. 4. In B, E18 cells were cultured for 10 d as in Fig. 4 and were then removed with trypsin and recultured in the same conditions for an additional 2 d. The cells were fixed and stained with A2B5 antibody to visualize the cell morphology. The arrows indicate the location of the cell bodies. Bar, 50 μm.
Figure 10.

Maturation of E18 precursor cells in culture. Purified E18 precursor cells were cultured as in Fig. 4. After 10 d, the cells were removed from the culture flask with trypsin and were then recultured at clonal density in the same conditions for an additional 4 d. Clone size (A) and cell cycle time (B) were then compared with those in clonal density cultures prepared from purified, freshly isolated E18 and P7 precursor cells and maintained in the same conditions. 50–100 clones were averaged for each data point, and the results are expressed as mean ± SEM. DIV, days in vitro.
Discussion
Advantages of Oligodendrocyte Precursor Cells for Studying Proliferation Control
Oligodendrocyte precursor cells isolated from the developing rat optic nerve offer a number of advantages for studying the mechanisms that control cell proliferation and the timing of differentiation. First, they can be cultured, either as single cells in microwells (Temple and Raff, 1986) or as purified cells at clonal density (Barres et al., 1994), so that their behavior can be studied in the virtual absence of other cell types. Second, they can be cultured in serum-free medium, so that one can control their extracellular environment (Barres et al., 1994). Third, the precursor cells and differentiated oligodendrocytes have distinctive morphologies, so that they can be readily distinguished, even while still alive (Temple and Raff, 1986). Fourth, unlike cell lines, they are normal cells and, with the addition of the appropriate signaling molecules, purified precursor cells in serum-free clonal culture divide a limited number of times before they stop dividing and terminally differentiate into postmitotic oligodendrocytes, just as they do in vivo (Temple and Raff, 1986; Barres et al., 1992). Fifth, individual clones can be followed by time-lapse cinematography (Small et al., 1987) or video recording (Gao et al., 1997), so that cell migration and every cell division, cell death, and differentiation event can be documented. An important disadvantage of the system is that it is difficult to obtain enough cells to do biochemical analyses.
Progressive Precursor Cell Maturation
In the present study we initially set out to determine why the oligodendrocyte precursor cells isolated from the P7 optic nerve are heterogeneous in the number of times they divide before they stop and differentiate; whereas some cells differentiate without dividing at all, others divide anywhere up to eight times before they stop and differentiate (Temple and Raff, 1986; Barres et al., 1994). It seemed likely that one reason for this heterogeneity is that the precursor cells differ in maturation, perhaps because they have migrated into the nerve at different times, so that some have already gone through most of their divisions before being isolated, while others have many divisions still to go (Temple and Raff, 1986). Our findings are consistent with this interpretation. We show that precursor cells purified from E18 optic nerve, which would be expected to have recently migrated into the nerve (Small et al., 1987), are much more homogeneous in their proliferative capacity than are precursor cells purified from P7 or P14 nerves. Moreover, on average, the E18 precursor cells go through many more divisions before they differentiate than do P7 or P14 cells, with some dividing 10 or 11 times in an 11 d culture period.
E18 precursor cells also differ from P7 and P14 precursor cells in three other ways. They are morphologically less complex with fewer and less branching processes, they divide faster, and they migrate faster. The average cell cycle time in culture for an E18 precursor cell is about 20 h, whereas it is about 28 h for a P7 precursor cell and about 42 h for a P14 precursor cell. The average migration rate for an E18 cell is 30 μm/h, whereas it is 22 μm/h for a P7 cell. This value for P7 is very similar to that previously reported (21.4 μm/h) for these cells by Wolswijk and Noble (1989).
Taken together, these findings suggest that oligodendrocyte precursor cells change progressively during development. This conclusion is consistent with previous findings that with increasing developmental age the precursor cells display a progressively more complex morphology when visualized in situ in the rat optic nerve (Fulton et al., 1992), although in those studies it was unclear whether the changes in morphology reflected changes in the environment, the precursor cells, or both.
A Cell-intrinsic Maturation Program
As our present findings have been obtained with purified precursor cells isolated from nerves of different ages and studied under the same conditions, the differences in morphology, cell cycle time, proliferative capacity, and cell migration rate presumably reflect differences that are intrinsic to the cells themselves, rather than differences in the cells' environment at the different ages. Not only are the differences intrinsic to the cells, but the program of progressive change seems to be intrinsic as well, as purified E18 precursor cells maintained in culture for 10 d in mitogens and in the absence of TH come to resemble P7 precursor cells in their morphology, cell cycle time, and rate of migration, even though they are maintained in constant culture conditions. That is not to say that signals from other cells are unimportant: without survival signals the cells undergo programmed cell death (Barres et al., 1992), and without mitogens they stop dividing and prematurely differentiate (Temple and Raff, 1985); both survival signals and mitogens were always added to our cultures.
Moreover, we show here that the cell cycle time varies inversely with the concentrations of PDGF, suggesting that the levels of PDGF in the developing optic nerve may regulate the rate of cell cycle progression in the precursor cells. For this reason, we used 10 ng/ml of PDGF when comparing the cell cycle times of precursor cells from nerves of different ages; this concentration was shown previously to be on a plateau for the induction of DNA synthesis in cultures of purified P8 precursor cells (Barres et al., 1993). Changing properties with development seems to be a common feature of vertebrate precursor cells: retinal precursor cells, for example, progressively change in their developmental potential (Watanabe and Raff, 1990) and response to growth factors (Lillien and Cepko, 1992), and haematopoietic stem cells change their developmental potential over time (Morrison et al., 1994). In none of these cases, however, has it been shown that purified precursor cells in culture change their properties over time.
It has been shown previously that oligodendrocyte precursor cells are also present in the adult rat optic nerve (french-Constant and Raff, 1986; Wolswijk and Noble, 1989), although these cells have a number of properties that distinguish them from the precursor cells present in the perinatal nerve: they have an altered antigenic phenotype, for example, and they divide, migrate, and differentiate more slowly than perinatal precursor cells (Wolswijk and Noble, 1989). Wren et al. (1992) have provided evidence that the adult precursor cells develop from perinatal ones: in time-lapse microcinematographic studies several cells with a perinatal phenotype were seen to give rise to cells with an adult phenotype, although this transition sometimes occurred gradually over two or more cell divisions. Our observations extend these findings in two ways: first, they suggest that oligodendrocyte precursor cells progressively change their properties over time, beginning early in development; second, they indicate that these changes can occur in purified precursor cells in culture, as long as mitogens are present and TH is not, so that the cells continue to proliferate and do not differentiate, suggesting that maturation reflects the operation of an intrinsic developmental program in each precursor cell. It remains to be determined whether purified prenatal precursor cells in culture can develop all of the properties of adult precursor cells. Most important, it remains to be demonstrated whether the precursor cells in the adult optic nerve are maintained by continual self-renewal (Wren et al., 1992) or by continual generation from a separate population of stem cells in the nerve or brain (french-Constant and Raff, 1986).
Unequal Cell Divisions and Cell Size Control
Whereas maturation differences between the precursor cells are likely to be an important source of the cell cycle-time heterogeneity in our cultures, it is not the only source. When studied by time-lapse video recording, the daughter cells produced by individual P7 precursor cells usually divide again within an hour or so of each other, but in ∼30% of the cases, one daughter divides many hours before the other. In each instance this is the result of an unequal cell division, in which the mother cell fails to withdraw one or more of its processes when it rounds up at mitosis; as a result of inheriting the process(es), one of the daughter cells is substantially larger than its sibling, and it is always this daughter cell that divides first. This finding strongly suggests that oligodendrocyte precursor cells, just like yeast cells (Fantes, 1977), amoebae (Prescott, 1956), Tetrahymena (Prescott, 1959), and some mammalian cell lines (Killander and Zetterberg, 1965), have to grow to a critical size before they can divide. Not surprisingly, unequal cell divisions occur much more frequently in mature oligodendrocyte precursor cells, which have long and complex processes, than in immature E18 precursor cells, which have short, simple processes. Cell size controls, however, also seem to operate in E18 precursor cells, as the cell cycle times within an E18 clone tend to be longer if the previous cell cycle time is short and shorter if the previous cycle is long; cycles that are shorter than average would tend to produce cells that are smaller than average and therefore need a longer time in the next cycle to grow, so that it could produce two daughter cells of average size; the reverse would be the case for cells produced by cycles that are longer than average. The molecular basis of such size control is still uncertain, although there is evidence that it may involve, in part at least, the regulation of the retinoblastoma protein Rb (Nasmyth, 1996), which normally acts to suppress the transcription of genes required for DNA replication (Riley et al., 1994) as well as genes involved in protein synthesis (Cavanaugh et al., 1995; White et al., 1996).
Time-lapse cinematographic studies of cloned cell lines have shown that the cells of an individual line display a wide range of cell cycle times, even when growing under uniform conditions; it has been argued from such studies that cell-cycle progression in G1 depends on one or more probabilistic, or stochastic, events (Smith and Martin, 1973; Brooks et al., 1980). The remarkable similarity in cell cycle times of sister cells produced by the early divisions of E18 oligodendrocyte precursor cells in our cultures, however, are hard to reconcile with such “transition probability” models. An attractive, alternative explanation for the random variability of cell cycle times within clones is that it reflects the uneven segregation of cytoplasmic contents at cytokinesis, as suggested by a number of previous experiments (Prescott, 1959; Riley and Hola, 1983; Sennerstam, 1988), as well as by the present study. Such unequal cell divisions would seem even more likely to occur in vivo, where the environment is much more complex than the two-dimensional substratum of a culture dish. Whatever the mechanism, the tendency for initially synchronous cell populations to rapidly become asynchronous may help to ensure that cells within clones do not all divide at the same time; as cells tend to round up and lose their attachments during mitosis, synchronous divisions could disrupt the integrity of a tissue.
Acknowledgments
We thank B. Durand, M. Jacobson, and V. Wallace for comments on the manuscript and Robert Brooks for helpful suggestions on cell cycle time analyses.
Footnotes
F.-B. Gao is supported by a Hitchings-Elion Fellowship from the Burroughs Wellcome Fund. The work is supported by Medical Research Council, UK.
Please address all correspondence to Fen-Biao Gao, Medical Research Council Laboratory for Molecular Cell Biology, University College London, London WC1E 6BT, United Kingdom. Tel.: (44) 171-419-3538; Fax: (44) 171-380-7805.
1. Abbreviations used in this paper: CNS, central nervous system; RA, retinoic acid; TH, thyroid hormone.
References
- Barres B, Raff M. Control of oligodendrocyte number in the developing rat optic nerve. Neuron. 1994;12:935–942. doi: 10.1016/0896-6273(94)90305-0. [DOI] [PubMed] [Google Scholar]
- Barres B, Hart I, Coles H, Burne JF, Voyvodic J, Richardson W, Raff M. Cell death and control of cell survival in the oligodendrocyte lineage. Cell. 1992;70:31–46. doi: 10.1016/0092-8674(92)90531-g. [DOI] [PubMed] [Google Scholar]
- Barres B, Schmid R, Sendtner M, Raff M. Multiple extracellular signals are required for long term oligodendrocyte survival. Development. 1993;118:283–295. doi: 10.1242/dev.118.1.283. [DOI] [PubMed] [Google Scholar]
- Barres B, Lazar M, Raff M. A novel role for thyroid hormone, glucocorticoids and retinoic acid in timing oligodendrocyte development. Development. 1994;120:1097–1108. doi: 10.1242/dev.120.5.1097. [DOI] [PubMed] [Google Scholar]
- Brooks RF, Bennett DC, Smith JA. Mammalian cell cycles need two random transitions. Cell. 1980;19:493–504. doi: 10.1016/0092-8674(80)90524-3. [DOI] [PubMed] [Google Scholar]
- Cavanaugh AH, Hempel WM, Taylor LJ, Rogalsky V, Todorov G, Rothblum LI. Activity of RNA polymerase I transcription factor UBF blocked by Rb gene product. Nature (Lond) 1995;374:177–180. doi: 10.1038/374177a0. [DOI] [PubMed] [Google Scholar]
- Eisenbarth GS, Walsh FS, Nirenburg M. Monoclonal antibodies to a plasma membrane antigen of neurons. Proc Natl Acad Sci USA. 1979;76:4913–4916. doi: 10.1073/pnas.76.10.4913. [DOI] [PMC free article] [PubMed] [Google Scholar]
- Fantes PA. Control of cell size and cycle time in Schizosaccharomyces pombe. . J Cell Sci. 1977;24:51–67. doi: 10.1242/jcs.24.1.51. [DOI] [PubMed] [Google Scholar]
- french-Constant C, Raff MC. Proliferating bipotential glial progenitor cells in adult rat optic nerve. Nature (Lond) 1986;319:499–502. doi: 10.1038/319499a0. [DOI] [PubMed] [Google Scholar]
- Fulton BP, Burne JF, Raff MC. Visualization of O-2A progenitor cells in developing and adult rat optic nerve by quisqualate-stimulated cobalt uptake. J Neurosci. 1992;12:4816–4833. doi: 10.1523/JNEUROSCI.12-12-04816.1992. [DOI] [PMC free article] [PubMed] [Google Scholar]
- Gao F-B, Durand B, Raff M. Oligodendrocyte precursor cells count time but not cell divisions before differentiation. Curr Biol. 1997;7:152–155. doi: 10.1016/s0960-9822(06)00060-1. [DOI] [PubMed] [Google Scholar]
- Killander D, Zetterberg A. A quantitative cytochemical investigation of the relationship between cell mass and initiation of DNA synthesis in mouse fibroblasts in vitro. . Exp Cell Res. 1965;40:12–20. doi: 10.1016/0014-4827(65)90285-5. [DOI] [PubMed] [Google Scholar]
- Lillien L, Cepko C. Control of proliferation in the retina: temporal changes in responsiveness to FGF and TGF α. Development. 1992;115:253–266. doi: 10.1242/dev.115.1.253. [DOI] [PubMed] [Google Scholar]
- Miller RH, David S, Patel R, Abney ER, Raff MC. A quantitative immunohistochemical study of macroglial cell development in the rat optic nerve: in vivoevidence for two distinct astrocyte lineages. Dev Biol. 1985;111:35–41. doi: 10.1016/0012-1606(85)90432-4. [DOI] [PubMed] [Google Scholar]
- Morrison SJ, Uchida N, Weissman IL. The biology of hematopoietic stem cells. Annu Rev Cell Dev Biol. 1994;11:35–71. doi: 10.1146/annurev.cb.11.110195.000343. [DOI] [PubMed] [Google Scholar]
- Nasmyth K. Retinoblastoma protein: another role rolls in. Nature (Lond) 1996;382:28–29. doi: 10.1038/382028a0. [DOI] [PubMed] [Google Scholar]
- Noble M, Murray K. Purified astrocytes promote the in vitrodivisions of a bipotential glial progenitor cell. EMBO (Eur Mol Biol Organ) J. 1984;3:2243–2247. doi: 10.1002/j.1460-2075.1984.tb02122.x. [DOI] [PMC free article] [PubMed] [Google Scholar]
- Noble M, Murray K, Stroobant P, Waterfield MD, Riddle P. PDGF promotes division and motility and inhibits premature differentiation of the oligodendrocyte-type-2 astrocyte progenitor cell. Nature (Lond) 1988;333:560–562. doi: 10.1038/333560a0. [DOI] [PubMed] [Google Scholar]
- Pardee AB. A restriction point for control of normal animal cell proliferation. Proc Natl Acad Sci USA. 1974;71:1286–1290. doi: 10.1073/pnas.71.4.1286. [DOI] [PMC free article] [PubMed] [Google Scholar]
- Prescott DM. Relation between cell growth and cell division. Exp Cell Res. 1956;11:86–98. doi: 10.1016/0014-4827(56)90192-6. [DOI] [PubMed] [Google Scholar]
- Prescott DM. Variations in the individual generation times of Tetrahymena Geleii Exp. . Cell Res. 1959;16:279–284. doi: 10.1016/0014-4827(59)90255-1. [DOI] [PubMed] [Google Scholar]
- Raff MC. Glial cell diversification in the rat optic nerve. Science (Wash DC) 1989;243:1450–1455. doi: 10.1126/science.2648568. [DOI] [PubMed] [Google Scholar]
- Raff MC, Miller RH, Noble M. A glial progenitor cell that develops in vitrointo an astrocyte or an oligodendrocyte depending on culture medium. Nature (Lond) 1983;303:390–396. doi: 10.1038/303390a0. [DOI] [PubMed] [Google Scholar]
- Raff MC, Abney ER, Fok-Seang J. Reconstitution of a developmental clock in vitro: a critical role for astrocytes in the timing of oligodendrocyte differentiation. Cell. 1985;42:61–69. doi: 10.1016/s0092-8674(85)80101-x. [DOI] [PubMed] [Google Scholar]
- Raff MC, Lillien L, Richardson W, Burne JF, Noble M. Platelet-derived growth factor from astrocytes drives the clock that times oligodendrocyte development in culture. Nature (Lond) 1988;333:562–565. doi: 10.1038/333562a0. [DOI] [PubMed] [Google Scholar]
- Ranscht B, Clapshaw P, Price J, Noble M, Seifert W. Development of oligodendrocytes and schwann cells studied with a monoclonal antibody against galactocerebroside. Proc Natl Acad Sci USA. 1982;79:2709–2713. doi: 10.1073/pnas.79.8.2709. [DOI] [PMC free article] [PubMed] [Google Scholar]
- Riley PA, Hola M. Transient intraclonal variation in interdivision time in relation to orientation at cytokinesis of GPK cells in layer culture. Cell Tissue Kinet. 1983;16:189–198. [PubMed] [Google Scholar]
- Riley DJ, Lee EY, Lee WH. The retinoblastoma protein: more than a tumor suppressor. Annu Rev Cell Biol. 1994;10:1–29. doi: 10.1146/annurev.cb.10.110194.000245. [DOI] [PubMed] [Google Scholar]
- Richardson WD, Pringle N, Mosley MJ, Westermark B, Dubois-Dalcq M. A role for platelet-derived growth factor in normal gliogenesis in the central nervous system. Cell. 1988;53:309–319. doi: 10.1016/0092-8674(88)90392-3. [DOI] [PubMed] [Google Scholar]
- Skoff RP, Price DL, Stocks A. Electron microscopic autoradiographic studies of gliogenesis in rat optic nerve. I. Cell proliferation. J Comp Neurol. 1976;169:291–312. doi: 10.1002/cne.901690303. [DOI] [PubMed] [Google Scholar]
- Sennerstam R. Partition of protein (mass) to sister cell pairs at mitosis: a re-evaluation. J Cell Sci. 1988;90:301–306. doi: 10.1242/jcs.90.2.301. [DOI] [PubMed] [Google Scholar]
- Small R, Riddle P, Noble M. Evidence for migration of oligo-oligodendrocyte-type-2 astrocyte progenitor cells into the developing rat optic nerve. Nature (Lond) 1987;328:155–157. doi: 10.1038/328155a0. [DOI] [PubMed] [Google Scholar]
- Smith JA, Martin L. Do cells cycle? . Proc Natl Acad Sci USA. 1973;70:1263–1267. doi: 10.1073/pnas.70.4.1263. [DOI] [PMC free article] [PubMed] [Google Scholar]
- Temple S, Raff M. Differentiation of a bipotential glial progenitor cell in single cell microculture. Nature (Lond) 1985;313:223–225. doi: 10.1038/313223a0. [DOI] [PubMed] [Google Scholar]
- Temple S, Raff M. Clonal analysis of oligodendrocyte development in culture: evidence for a developmental clock that counts cell divisions. Cell. 1986;44:773–779. doi: 10.1016/0092-8674(86)90843-3. [DOI] [PubMed] [Google Scholar]
- Watanabe T, Raff MC. Rod photoreceptor development in vitro: intrinsic properties of proliferating neuroepithelial cells change as development proceeds in the rat retina. Neuron. 1990;4:461–467. doi: 10.1016/0896-6273(90)90058-n. [DOI] [PubMed] [Google Scholar]
- Weil M, Jacobson MD, Coles HS, Davies TJ, Gardner RL, Raff KD, Raff MC. Constitutive expression of the machinery for programmed cell death. J Cell Biol. 1996;133:1053–1059. doi: 10.1083/jcb.133.5.1053. [DOI] [PMC free article] [PubMed] [Google Scholar]
- White RJ, Trouche D, Martin K, Jackson SP, Kouzarides T. Repression of RNA polymerase III transcription by the retinoblastoma protein. Nature (Lond) 1996;382:88–90. doi: 10.1038/382088a0. [DOI] [PubMed] [Google Scholar]
- Wolswijk G, Noble M. Identification of an adult-specific glial progenitor cell. Development. 1989;105:387–400. doi: 10.1242/dev.105.2.387. [DOI] [PubMed] [Google Scholar]
- Wren D, Wolswijk G, Noble M. In vitro analysis of the origin and maintenance of O-2Adult progenitor cells. J Cell Biol. 1992;116:167–176. doi: 10.1083/jcb.116.1.167. [DOI] [PMC free article] [PubMed] [Google Scholar]