Abstract
Confocal laser-scanning and digital fluorescence imaging microscopy were used to quantify the mitochondrial autofluorescence changes of NAD(P)H and flavoproteins in unfixed saponin-permeabilized myofibers from mice quadriceps muscle tissue. Addition of mitochondrial substrates, ADP, or cyanide led to redox state changes of the mitochondrial NAD system. These changes were detected by ratio imaging of the autofluorescence intensities of fluorescent flavoproteins and NAD(P)H, showing inverse fluorescence behavior. The flavoprotein signal was colocalized with the potentiometric mitochondria-specific dye dimethylaminostyryl pyridyl methyl iodide (DASPMI), or with MitoTracker™ Green FM, a constitutive marker for mitochondria. Within individual myofibers we detected topological mitochondrial subsets with distinct flavoprotein autofluorescence levels, equally responding to induced rate changes of the oxidative phosphorylation. The flavoprotein autofluorescence levels of these subsets differed by a factor of four. This heterogeneity was substantiated by flow-cytometric analysis of flavoprotein and DASPMI fluorescence changes of individual mitochondria isolated from mice skeletal muscle. Our data provide direct evidence that mitochondria in single myofibers are distinct subsets at the level of an intrinsic fluorescent marker of the mitochondrial NAD–redox system. Under the present experimental conditions these subsets show similar functional responses.
NADH plays an important role in oxidative phosphorylation. It is the main source of reducing equivalents for the respiratory chain. Therefore, the redox state of the mitochondrial NAD system reflects the rate of oxidative phosphorylation and activity of mitochondria. There have been numerous attempts to determine the NAD–redox state in cellular systems by NADH fluorescence measurements (Estabrook, 1962; Franke et al., 1979; Katz et al., 1987), or by the detection of the fluorescence of α-lipoamide dehydrogenase, a mitochondrial flavoprotein (Scholz et al., 1969; Mayevsky and Chance, 1982; Vourinen et al., 1995). These investigations were performed with perfused tissues or cells in suspension. Much less information is available on the distribution of the mitochondrial redox states at the single cell level. The latter, however, appears to be especially important for skeletal and cardiac muscle fibers. These cell types contain subsarcolemmal mitochondria (SSM)1 and intermyofibrillar mitochondria (IMM) that differ in size and histochemical staining properties. SSM and IMM might be differentially involved in neurophysiological and pathological processes of the muscle cell. Attempts have been undertaken to isolate mitochondria from their different subcellular sites by pure mechanical disruption (SSM isolation) or by protease treatment (IMM isolation). The results of these investigations are contradictory, varying from strict biochemical heterogeneity (Palmer et al., 1986; Cogswell et al., 1993; Philippi and Sillau, 1994; Takahashi and Hood, 1996) to homogeneity (McKean, 1991; Chemnitius et al., 1993; Manneschi and Frederico, 1995) of SMM and IMM. The latter differences may be due to variations in the isolation procedure. Therefore, the existence and the functional implications of mitochondrial heterogeneity remain obscure. To clarify this issue, the application of imaging techniques for mitochondria within single skeletal muscle fibers is required.
Hitherto microscopic investigation of mitochondria have been performed mainly using Δψ-dependent fluorescent dyes, like rhodamine 123 (Chen, 1989) or dimethylaminostyryl pyridyl methyl iodide (Horster et al., 1983; Bereiter-Hahn and Voth, 1994). There are only a few reports describing the application of fluorescence microscopy for the measurement of the redox state of the mitochondrial NADH at the cellular level (Eng et al., 1989; Piston et al., 1995).
It is well documented that the functional properties of mitochondria in cardiac and skeletal muscles can be studied using saponin-permeabilized muscle fibers (Veksler et al., 1987; Kunz et al., 1993). The treatment of muscle fibers with low concentrations of saponin causes a selective perforation of the sarcolemma, leaving mitochondria and the sarcoplasmic reticulum intact. This selective action of saponin can be explained by the different lipid compositions of cellular membranes. Saponin has a high affinity for cholesterol and preferentially extracts it from cholesterol-rich membranes like sarcolemma (Glauert et al., 1962). Ultrastructural studies of permeabilized preparations revealed good overall morphology (Altschuld et al., 1985; Veksler et al., 1987; Lin et al., 1990). Moreover, the saponin treatment of muscle fibers allows the study of the function of the total mitochondrial population without isolating mitochondria from the tissue. The method can be applied to extremely small pieces of tissue, which makes it possible to study the mitochondrial function in cases where the amount of material is limited as in human muscle biopsy samples (Kunz et al., 1993, 1994).
At 488-nm argon ion laser excitation, these saponin-permeabilized muscle fibers show a considerable green autofluorescence (Kunz et al., 1994). It was demonstrated that the major constituent of this fluorescence signal in skeletal muscle fibers is the flavine adenine dinucleotide of mitochondrial α-lipoamide dehydrogenase. As it is well known that the flavin moiety of this NAD-linked flavoprotein is fluorescent only in the fully oxidized state (Hassinen and Chance , 1968), this signal is an indicator of changes in the respiratory chain-linked redox state of the mitochondrial NAD system.
In the present work we quantified both the fluorescence of NAD(P)H and of fluorescent flavoproteins to visualize the distribution and functional changes of mitochondria in saponin-permeabilized muscle fibers. We provide direct evidence for two different topological subsets of mitochondria. The observed microscopic heterogeneity of mice skeletal muscle mitochondria was confirmed by flow-cytometric investigations of flavoprotein and 2-(p-dimethylaminostyryl)-pyridyl methyl iodide (DASPMI) fluorescence changes in isolated mitochondria.
Materials and Methods
Materials and Solutions
Saponin, ADP, ATP, phosphocreatine, octanoylcarnitine, malate, imidazole, EGTA, taurine, and the buffer substances were purchased from Sigma-Aldrich Chemie GmbH (Deisenhofen, Germany). DASPMI was obtained from Koch-Light LTD (Haverhill, UK). Mannitol, glutamate, and inorganic salts were purchased from Merck KGaA (Darmstadt, Germany). MitoTracker™ Green FM was obtained from Molecular Probes, Inc. (Eugene, OR). The uncoupler TTFB (4,5,6,7-tetrachloro-2-trifluoromethyl-benzimidazole) is a gift of B. Beechey (Univeristy of Wales, Aberystwyth, UK). The relaxing solution contained 10 mM Ca–EGTA buffer, free concentration of calcium 0.1 μM, 20 mM imidazole, 20 mM taurine, 49 mM K-2-(N-morpholino)-ethanesulfonic acid, 3 mM KH2PO4, 9.5 mM MgCl2, 5 mM ATP, 15 mM phosphocreatine, pH 7.1. The measurements were performed in a medium consisting of 110 mM mannitol, 60 mM KCl, 10 mM KH2PO4, 5 mM MgCl2, 0.5 mM Na2EDTA, and 60 mM Tris-HCl, pH 7.4.
Preparation of Muscle Fibers and Isolated Mitochondria
The musculus quadriceps of C57BL/10ScSn mice (Harlan UK, Ltd., Blacktown, UK) was rapidly removed, washed, and then placed in an ice-cold isotonic NaCl solution. Approximately 50 mg of m. quadriceps tissue was used for the isolation of saponin-permeabilized fibers. Mice skeletal muscle mitochondria from ∼1 g of the total hindlimb skeletal muscle were isolated by applying trypsin treatment according to a procedure developed for rat skeletal muscle (Wisniewski et al., 1993). Using 10 mM glutamate and 5 mM malate as substrates, respiratory control ratios higher than 6 were routinely obtained. The histochemical analysis of the m. quadriceps portions used in the experimental work revealed 45 ± 8% oxidative fibers (succinate dehydrogenase staining). Bundles of muscle fibers containing three single fibers were isolated from m. quadriceps by mechanical dissection. The saponin treatment was performed by a 30-min incubation of the fiber bundles in relaxing solution (see composition above) containing 50 μg/ml saponin as described in Kunz et al. (1993).
Fluorescence Spectroscopy
For the measurements of fluorescence of NAD(P)H and of fluorescent flavoproteins in fiber bundles, the experimental setup described earlier was used (Kunz et al., 1994). Approximately 5 mg of wet weight-permeabilized fibers were immobilized (by the attachment to glass wool) in a light-screened quartz tube and then perfused at 1 ml/min with the medium for measurements. The NAD(P)H fluorescence was excited at 325 nm using the 8-mW beam of a dual-wavelength laser (model OMI-2056 HeCd; Omnichrome, Chino, CA). The flavoprotein and DASPMI fluorescences were excited at 488 nm using a 75-mW argon ion laser (model OMI-532 AP; Omnichrome). The excitation light was guided to the immobilized sample using a quartz fiber. The fluorescence light was monitored by a spectrofluorometer (model RF 5001; Shimadzu, Kyoto, Japan) connected at 90° (with respect to the excitation beam) with a quartz light guide (6-mm inner diameter; Schott, Mainz, Germany) to the perifusion chamber at the emission wavelength's 450 (NAD[P]H fluorescence) or 520 nm (flavoprotein fluorescence).
Fluorescence Microscopy
Isolated fiber bundles were fixed at both ends in a Heraeus flexiperm chamber (Hanau, Germany) and then incubated in the medium for measurements. The digital video images were acquired with a microscope (model IX-70; Olympus, Tokyo, Japan) equipped with a charge-coupled device camera (model CF 8/1 DXC CCD; Kappa, Gleichen, Germany). The NAD(P)H fluorescence image was obtained using 366-nm excitation and 450-nm long-path emission (NU [narrow band U excitation cube]), and the flavoprotein fluorescence image was obtained using 470-nm excitation and 525-nm emission (NIBA [narrow band IB excitation cube]). The digital ratio images were calculated using the laser-scanning microscopy software (model LSM version 3.81, Carl Zeiss, Jena, Germany). For the calculation of redox states, the fluorescence values of individual single fibers, expressed as the average gray value of a selected region of interest, were determined from the unprocessed digital video images.
Confocal Microscopy
The confocal images of the isolated fiber bundles were acquired with Noran Instrument Odyssey XL CLSM (Middleton, WI) supported with Intervision 1.4.1 software; excitation, 488 nm; barrier filter, 514 nm LP (long path). 40–130 images (step size 0.72 μm) were acquired using the UApo/ 340 20× (see Fig. 4) or 40× (see Fig. 6) objectives (Olympus) with the numeric apertures of 0.75 or 0.9, respectively.
Figure 4.
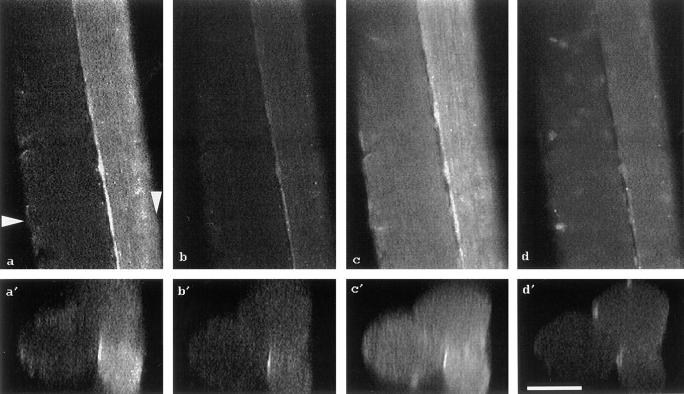
Confocal laser-scanning micrographs showing the autofluorescence of flavoproteins (a, b, a′, b′) and the fluorescence signal of the mitochondrial marker DASPMI (c, d, c′, d′) within three different saponin-permeabilized mouse quadriceps muscle fibers. One single confocal plane across these fibers is illustrated in (a–d); one cross-section, reconstructed from a stack of 130 different confocal planes (z-stack), is shown in (a′–d′). The arrowheads in a indicate the site of the reconstructed cross-section. a and a′, oxidized state; b and b′, addition of 10 mM glutamate and 5 mM malate; c and c′, addition of 5 μM DASPMI; d and d′, addition of 5 μM TTFB. To visualize the DASPMI signal (c and c′, d and d′) the laser excitation energy was reduced to 30%. Bar, 50 μm.
Figure 6.
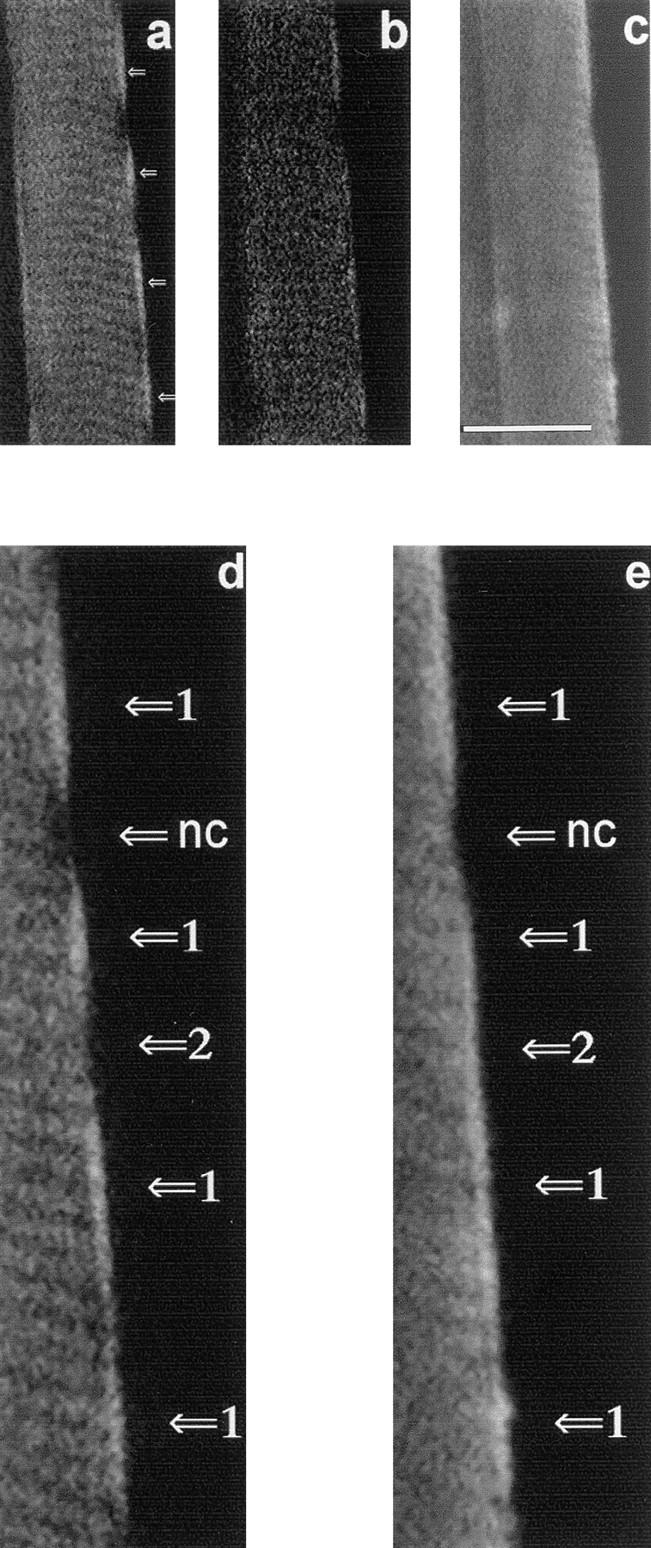
Confocal laser-scanning micrographs illustrating topological subsets of mitochondria by colocalization of the flavoprotein autofluorescence and the fluorescence of the mitochondrial marker MitoTracker™ Green FM. A confocal plane across one single mouse quadriceps muscle fiber is shown. (a) Flavoprotein autofluorescence in the oxidized state; (b) flavoprotein autofluorescence after addition of 10 mM glutamate and 5 mM malate; and (c) fluorescence signal obtained after 40 min of incubation with 250 nM of MitoTracker™ Green FM using reduced laser excitation (to 30%). The highest flavoprotein fluorescence in the subsarcolemmal area is indicated in a (arrows). A 2.2-fold magnification of the subsarcolemmal area (a and c) is illustrated in d and e. Different fluorescence signal combinations are indicated by arrows. Arrows 1, flavoprotein fluorescence–positive/MitoTracker™ Green FM fluorescence–positive mitochondria; arrows 2, flavoprotein fluorescence–negative/MitoTracker™ Green FM fluorescence–positive mitochondria. Note that a subsarcolemmal area containing a myonucleus is spared for both fluorescence signals (arrows nc). Bar, 25 μm.
Flow Cytometry
The autofluorescence changes in mitochondria were recorded with a FACSort™ flow cytometer (Becton Dickinson, Sparks, MD) using 488-nm excitation and a 530 ± 15-nm fluorescence emission filter. For the flow-cytometric determinations, the mitochondria were suspended in the medium for measurements at a final concentration of 0.3 mg/ml. The sample flow rate was adjusted to ∼1,000 events/s. For one single analysis the fluorescence properties of 100,000 mitochondria were collected. The data were analyzed using the CELLQuest software (Becton Dickinson) for Macintosh.
Results
Autofluorescence Responses of Skeletal Muscle Fiber Bundles
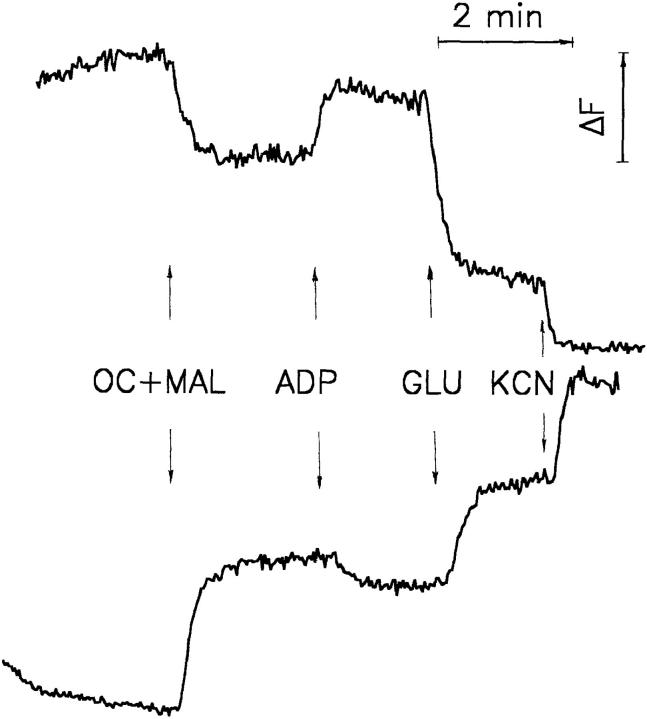
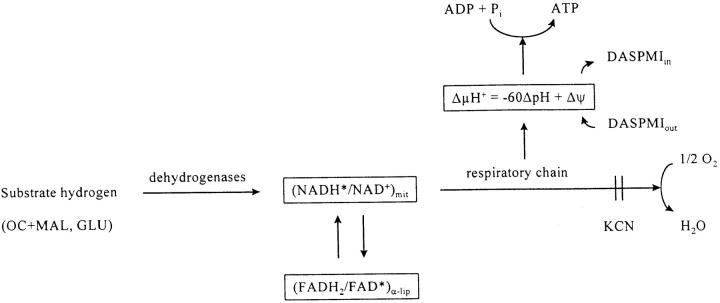
Fig. 1 illustrates the characteristic fluorescent response both of NAD[P]H (bottom trace) and of flavoproteins (top trace) to octanoylcarnitine + malate, ADP, glutamate, and cyanide of a bundle of saponin-permeabilized mice quadriceps muscle fibers. The addition of substrates (1 mM octanoylcarnitine and 5 mM malate, OC + MAL) leads to an increase in the NAD(P)H fluorescence and a decrease in the flavoprotein fluorescence signal. Subsequent ADP addition (1 mM) causes a reoxidation of the mitochondrial NAD system that is directly indicated by a decrease in the NAD(P)H fluorescence and an increase in the flavoprotein fluorescence. This type of response is the result of the stimulation of the electron flow through the mitochondrial respiratory chain due to the dissipation of ΔμH + related to ATP synthesis. The further improvement of the supply of reducing equivalents by the addition of 10 mM glutamate causes an increase in the reduction level of the mitochondrial NAD system, which is visualized by an increase in NAD(P)H fluorescence and a decrease in the flavoprotein fluorescence. The highest level of reduction of the NAD system can be reached by the inhibition of the respiratory chain with the inhibitor of cytochrome c oxidase cyanide (4 mM). Under these circumstances, the highest NAD(P)H fluorescence and the lowest flavoprotein fluorescence is observed. An overview of the redox behavior described above is given in Fig. 2. This figure illustrates the correlation of the redox states of the mitochondrial NAD system and the FAD of α-lipoamide dehydrogenase with the electrochemical proton gradient (ΔμH +), the mitochondrial membrane potential (Δψ), and the phosphorylation of ADP (the fluorescent forms are marked with asterisks). Fluorescence signals were calibrated for the purpose of quantification. The calibration was made by assigning the 0% reduction to the fluorescence signal in the endogenous oxidized state. 100% reduction was assigned to the fluorescence in the presence of 10 mM glutamate and 4 mM cyanide. This approach allowed the detection of rate variations of mitochondrial oxidative phosphorylation at a well-defined influx of reducing equivalents (constant activity of primary dehydrogenases): an increase in the respiration rate leads to a lowered redox state of the mitochondrial NAD system (decrease in NAD[P]H fluorescence and increase in flavoprotein fluorescence) and vice versa.
Figure 1.
Plot of the fluorescence changes of NAD(P)H and flavoproteins in bundles of saponin-permeabilized mouse quadriceps muscle fibers. Top trace: flavoprotein fluorescence obtained by 488-nm argon ion laser excitation and registration of the 525-nm emission signal. Bottom trace: NAD(P)H fluorescence obtained by 325-nm HeCd laser excitation and registration of the 450-nm emission signal. Approximately 5 mg of wet weight muscle fibers were attached to glass wool and perfused as described (Kunz et al., 1994). Additions: OC (octanoylcarnitine), 1 mM; MAL (malate), 5 mM; ADP, 1 mM; GLU (glutamate), 10 mM; KCN, 4 mM.
Figure 2.
Flow diagram of reducing equivalents (the fluorescent forms are marked with asterisks) showing the correlation of the redox states of the mitochondrial NAD system and the FAD of α-lipoamide dehydrogenase with the mitochondrial membrane potential and the phosphorylation of ADP.
Metabolic Redox Ratio Images of Single Muscle Fibers
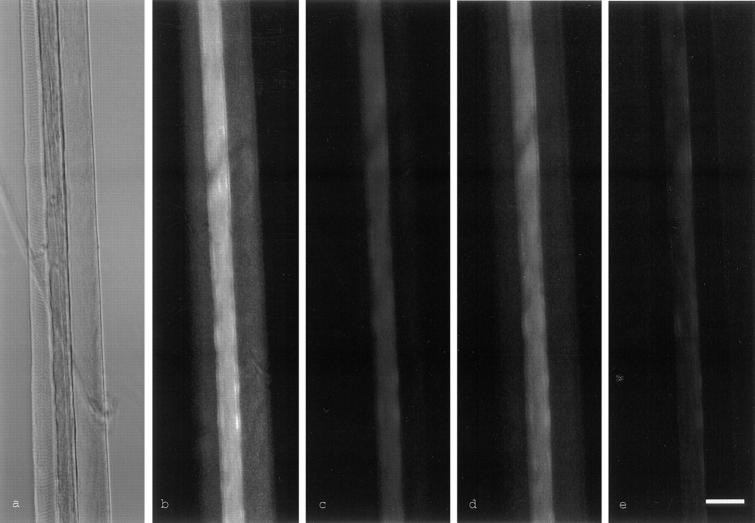
Using fiber bundles, only average reduction levels of the individual fluorophors (NAD[P]H or FAD) in heterogeneous muscle samples can be determined. Therefore, we applied video fluorescence microscopy to measure the redox state of these fluorophors in individual fibers. A typical microscopic imaging experiment with three single fibers is presented in Fig. 3. To visualize mitochondrial metabolic effects the ratios of the individual fluorescence images in the individual states (flavoprotein image; 470-nm excitation, 525-nm emission; NAD[P]H image, 366-nm excitation, 450-nm emission) were used. The inverse fluorescence behavior of NAD(P)H and fluorescent flavoproteins in response to the reduction–oxidation of the mitochondrial NAD system (Figs. 1 and 2) allows the use of these ratios as very sensitive indicators of changes in mitochondrial activity (Mayevsky and Chance, 1982). In the oxidized state, the flavoprotein fluorescence is high and the NAD(P)H fluorescence low, leading to a bright flavoprotein/NAD(P)H ratio image (Fig. 3 b, compare with the respective fluorescence levels in Fig. 1). The intensities of the ratio signals of the three individual fibers are different. Single fibers with bright fluorescence ratios presumably represent oxidative mitochondria-rich fibers. Fibers that are much darker in the same oxidized state most probably contain less mitochondria (Fig. 3 b). As indicated by the corresponding phase contrast image in Fig. 3 a, all fluorescence signals are in the same focal plane. When 1 mM octanoylcarnitine and 5 mM malate were added, a rather uniform decrease in the intensity of the ratio image was observed because of the quenching of the flavoprotein fluorescence, and an increase of the NAD(P)H fluorescence (Fig. 3 c, compare with levels of fluorescence signals in Fig. 1). This uniform, homogeneous quenching of the fluorescence ratio image indicates that the added substrates are metabolized by all mitochondria within all fibers. Afterwards, the application of 1 mM ADP led to a brighter ratio image (Fig. 3 d, compare with respective levels of fluorescence signals in Fig. 1) that shows ADP is phosphorylated by all mitochondria. Finally, 4 mM potassium cyanide and 10 mM glutamate resulted in complete quenching of the flavoprotein fluorescence, but in the highest level of the NAD(P)H fluorescence, led to a dark ratio image (Fig. 3 e, compare with respective fluorescence levels in Fig. 1). Therefore, ratio imaging of flavoprotein and NAD(P)H fluorescence permits a mapping of mitochondrial metabolism at the level of a single muscle fiber and can be used for the investigation of functional heterogeneity.
Figure 3.
Phase contrast and video-autofluorescence ratio images (flavoprotein/ NAD[P]H) of three saponin-permeabilized mouse quadriceps muscle fibers. Digital video images of NAD(P)H and flavoprotein autofluorescences were obtained with an Olympus IX-70 microscope equipped with a Kappa CF 8/1 DXC charge-coupled device camera using 366-nm (NAD[P]H, NU filter) and 470-nm (flavoprotein, NIBA filter) excitation, respectively. To visualize metabolic effects on the mitochondria, the flavoprotein image was divided by the NAD(P)H image. a, phase contrast; b, oxidized state; c, addition of 1 mM octanoylcarnitine and 5 mM malate; d, addition of 1 mM ADP; e, addition of 4 mM KCN and 10 mM glutamate. Bar, 50 μm.
To quantify mitochondrial function in saponin-permeabilized muscle fibers, we measured the fluorescence intensities of the individual fluorophors and then calculated the redox states during active mitochondrial respiration (see above). We quantitatively compared the fluorescence spectroscopy of fiber bundles (according to Kunz et al., 1994) with the autofluorescence imaging of single fibers. The results of these experiments are summarized in Table I. Despite the rather large differences in the individual autofluorescence intensities of the muscle fibers, the redox states of both fluorophors (NAD[P]H, FAD) are statistically in accordance.
Table I.
Redox State of NAD(P)H, RPN, and Fluorescent Flavoproteins, RFP, in Saponin-permeabilized Muscle Fibers from m. quadriceps Determined by Laser Fluorometry and Fluorescence Microscopy
| RPN | RFP | |||
|---|---|---|---|---|
| (%) | (%) | |||
| Fiber bundles | 35 ± 3 | 26 ± 9 | ||
| n = 8 | n = 8 | |||
| High fluorescent fibers (oxidative) | 32 ± 3 | 33 ± 11 | ||
| n = 5 | n = 5 | |||
| Low fluorescent fibers (glycolytic) | 46 ± 8 | 30 ± 13 | ||
| n = 5 | n = 5 |
The redox states, R, are given in % of the fluorescence change between the fully oxidized state, F endo (in the absence of substrates), and the completely reduced state, F KCN (in the presence of substrates and 4 mM cyanide). They were determined from the fluorescence values, F ADP, in the presence of 1 mM ADP and the substrate combination 1 mM octanoylcarnitine + 5 mM malate (experimental protocol of Figs. 1 and 3) using the following formulas: R PN = (F ADP − F endo)/(F KCN − F endo) · 100 R FP = (F endo − F ADP)/(F endo − F KCN) · 100. In the microscopic determinations, the average gray values of high and low fluorescent single fibers in the different metabolic states were used for the calculation of the fluorescence changes. The reproducibility and linearity of the image acquisition was verified using fluorescence standards (uranyl filter glass GG17, Schott). n indicates the number of different animals.
Mitochondrial Heterogeneity within Single Muscle Fibers
In the next step we examined mitochondrial autofluorescence at the level of single muscle fibers using confocal microscopy. Fig. 4 a shows one confocal plane of the flavoprotein autofluorescence image of three single muscle fibers in the fully oxidized state. In Fig. 4 a′ the cross-section of these fibers (marked by arrowheads) obtained by the three-dimensional reconstruction of the image stack is shown. In accordance with the known fiber-type heterogeneity of the mouse quadriceps muscle, the three fibers show considerable differences in autofluorescence intensity. Interestingly, the flavoprotein fluorescence image of the confocal plane shows clear-cut subsarcolemmal mitochondrial fluorescence and longitudinally oriented mitochondrial patterns (Fig. 4 a). This is in line with the ultrastructural localization of mitochondria beneath the sarcolemma and along the myofilaments (O'Gorman et al., 1996). After the addition of the mitochondrial substrates glutamate and malate, the autofluorescence intensity of all three fibers decreased (Fig. 4, b and b′). As outlined in Fig. 2, the autofluorescence quenching is a result of reduction of the mitochondrial NAD system. All mitochondria (SSM and IMM) appear to behave in a uniform manner under the present experimental conditions. In all mitochondria-rich fibers it was consistently possible to distinguish the subsarcolemmal from the intermyofibrillar subcellular mitochondrial sites. In both dark (Fig. 4 a, left) and bright fibers (Fig. 4 a, right), the intensity of the flavoprotein fluorescence in the subsarcolemmal region is higher than in the fiber center. This is in agreement with the routine histochemical succinate dehydrogenase stain of mouse fiber cross-sections (Füchtbauer et al., 1991).
To test if the detected flavoprotein autofluorescence can be spatially colocalized with proven mitochondria-specific fluorescent markers, we applied the fluorescent dyes DASPMI (Horster et al., 1983) and MitoTracker™ Green FM (Hoth et al., 1997). In the first set of experiments we incubated the same fibers described above (Fig. 4, a and b) in the presence of glutamate and malate with 5 μM DASPMI. This cationic dye, having fluorescence properties similar to flavoproteins, is membrane potential– dependent accumulated into the matrix of mitochondria (Bereiter-Hahn and Voth, 1994). Fig. 4 c shows the DASPMI fluorescence recorded under threefold lower excitation intensity. This staining experiment shows a clear-cut subsarcolemmal mitochondrial fluorescence and longitudinally oriented mitochondrial patterns that correspond largely to the flavoprotein fluorescence. Moreover, the levels of the DASPMI fluorescence correspond to the intensity differences of the flavoprotein fluorescence associated with different fiber types (Fig. 4, c′ and a′). The addition of the uncoupler TTFB, leading to a dissipation of the mitochondrial membrane potential, caused a strong decrease in fluorescence. As shown in Fig. 4 d the longitudinal, striated pattern disappeared almost completely. This is caused by the release of the dye from the mitochondrial matrix space.
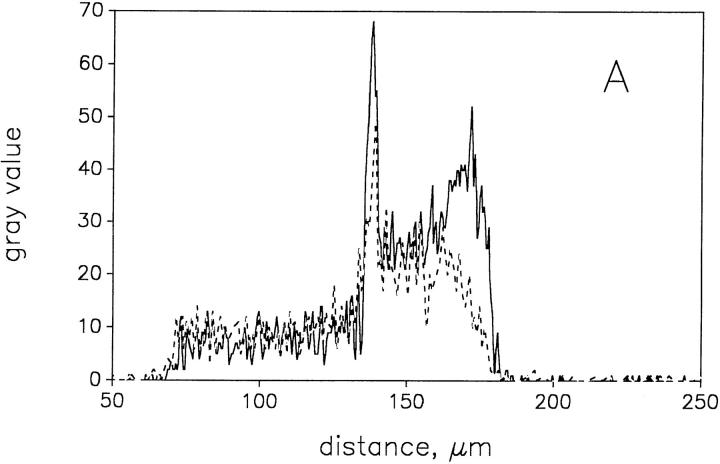
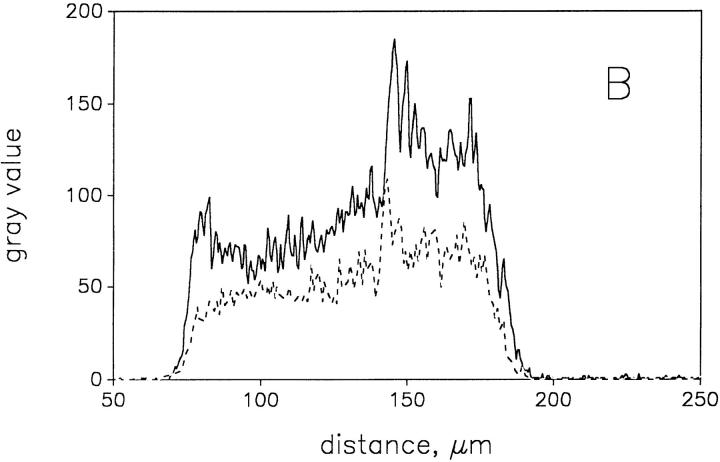
To quantify the metabolic response of the mitochondria, we extracted gray value histograms from the confocal images shown in Fig. 4 (indicated by arrowheads) in the different metabolic states of the fibers. These histograms, presented in Fig. 5, A and B, quantitatively show that the higher fluorescence intensity is associated with the subsarcolemmal region, whereas the fluorescence intensity of the intermyofibrillar region is lower. Interestingly, the changes of the flavoprotein fluorescence intensity in response to substrates are much larger in the subsarcolemmal region than in the intermyofibrillar region (Fig. 5 A, solid and dashed histogram). By contrast, the DASPMI fluorescence quenching upon addition of the uncoupler TTFB is uniform in both fibers (Fig. 5 B, solid and dashed histogram). In summary, we simultaneously detected a uniform DASPMI fluorescence quenching both in the subsarcolemmal and the intermyofibrillar areas, whereas the quenching of the flavoprotein fluorescence occurs predominantly in the subsarcolemmal region. The latter is indicated by a decrease in the flavoprotein signal by ∼50% of the peak of the histogram corresponding to the subsarcolemmal area (Fig. 5 A). Given that DASPMI accumulates equally in all mitochondria, it is possible to calculate from the corresponding flavoprotein fluorescence histograms that the content of the NAD-dependent fluorescent flavoprotein α-lipoamide dehydrogenase is approximately fourfold higher in SSM than in IMM. These results strongly support the idea that IMM and SSM have different biochemical properties.
Figure 5.
Gray value histograms of the confocal planes shown in Fig. 4. The histograms were extracted from the images shown in Fig. 4, a–d, at the site marked by arrowheads in Fig. 4 a. (A) solid line, oxidized state (corresponding to Fig. 4 a); dashed line, addition of 10 mM glutamate and 5 mM malate (corresponding to Fig. 4 b). (B) solid line, addition of 5 μM DASPMI (corresponding to Fig. 4 c); dashed line, addition of 5 μM TTFB (corresponding to Fig. 4 d).
The above results suggest mitochondrial heterogeneity within single muscle fibers. To further examine this possibility, we performed staining experiments with another proven fluorescent mitochondrial marker, MitoTracker™ Green FM, which stains mitochondria regardless of their functional state (Hoth et al., 1997). One confocal plane across a mouse quadriceps muscle fiber simultaneously showing MitoTracker™ Green FM and flavoprotein fluorescence is presented in Fig. 6. The experiments were carried out in the following way. The first step was to acquire the flavoprotein fluorescence image at 100% excitation energy (argon ion laser, 488 nm) (Fig. 6 a) and then quench the signal by addition of the substrates glutamate and malate (Fig. 6 b). Then we incubated the fibers for 40 min with 250 nM of MitoTracker™ Green FM and acquired the image of MitoTracker™ Green FM fluorescence with 30% excitation energy (Fig. 6 c). In the oxidized state of the fiber subsarcolemmal areas with high flavoprotein, fluorescence signals were seen (Fig. 6 a, arrows). These areas and also the adjacent IMM areas are stained with the MitoTracker™ Green FM showing the characteristic subcellular distribution of mitochondria in myofibers. However, some striking differences between the MitoTracker™ Green FM and the flavoprotein signals were present. First, subsarcolemmal flavoprotein–positive areas were identified that showed substantial overlap with the MitoTracker™ Green FM signal (Fig. 6 d and e; arrows 1). Second, subsarcolemmal flavoprotein–negative areas were seen that showed a clear-cut MitoTracker™ Green FM signal (Fig. 6, d and e; arrows 2). Finally, we also identified subsarcolemmal areas showing a spared fluorescence both from the MitoTracker™ Green FM and the flavoprotein signals. The latter areas correspond to the characteristic subcellular sites of myonuclei interrupting the subsarcolemmal array of accumulating mitochondria (Fig. 6, d and e; arrows nc).
These findings provide direct evidence for regionally defined populations of mitochondria characterized by different flavoprotein fluorescence properties. The data are in agreement with the presence of the DASPMI-positive/ flavoprotein fluorescence–negative and the DASPMI-positive/flavoprotein fluorescence–positive mitochondrial subpopulations in the histograms shown in the Fig. 5, A and B.
Flow-cytometric Analysis of Mitochondrial Heterogeneity
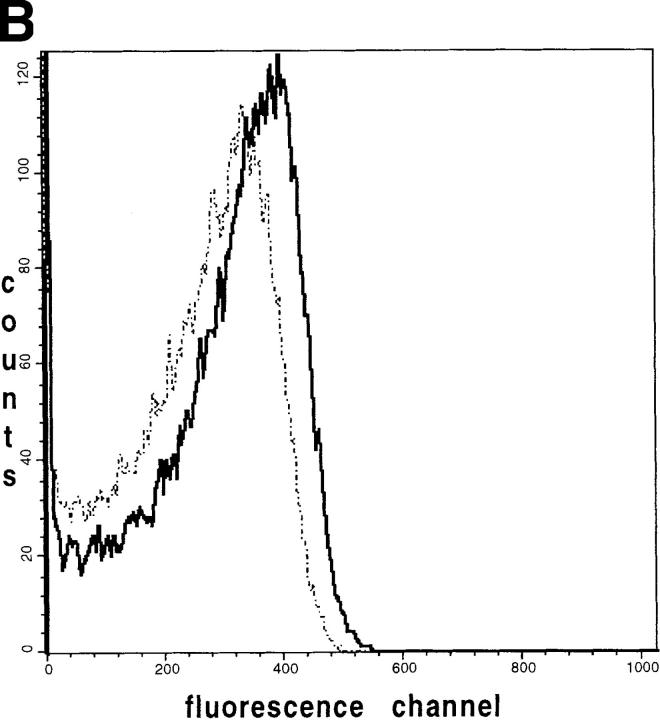
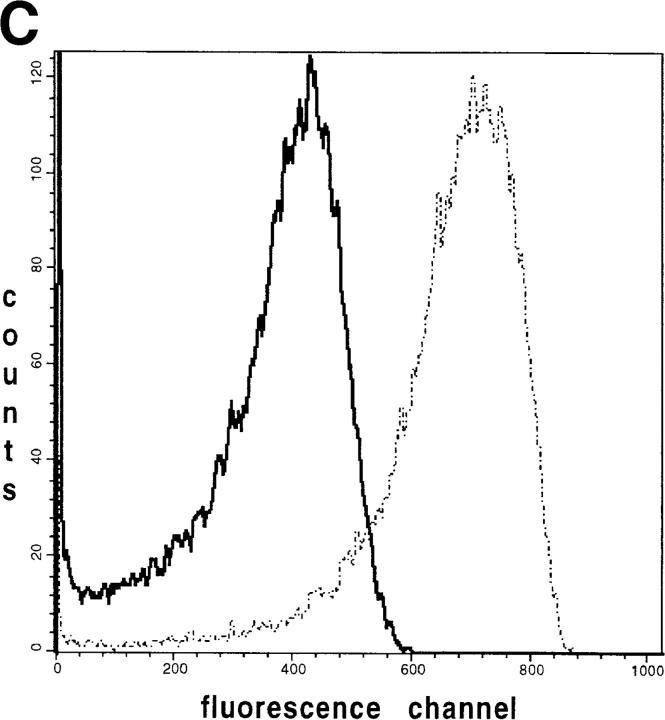
Detection of mitochondrial heterogeneity in single muscle fibers by imaging methods (see above) prompted us to examine suspensions of isolated mice skeletal muscle mitochondria by flow cytometry. We used a similar approach as previously reported for flow-cytometric mitochondrial autofluorescence detection in whole cells (Kunz et al., 1997). We isolated mice skeletal muscle mitochondria by trypsin treatment of the muscle tissue, homogenization, and then differential centrifugation (Wisniewski et al., 1993). A mixture of SSM and IMM was obtained. We examined the flavoprotein/DASPMI fluorescence according to the protocol described above. The fluorescence of individual mitochondria with similar light scattering properties (analyzing gate; Fig. 7 A) was analyzed. In the substrate-free state, the fluorescent flavoproteins in these mitochondria are mainly oxidized (highly fluorescent). However, as shown in Fig. 7 B (solid line), under these conditions a rather heterogeneous distribution of fluorescence intensities of the individual mitochondria was observed. The latter is indicated by the broad asymmetric histogram with a substantial amount of mitochondria at fluorescence channel values <200. The addition of the mitochondrial substrates glutamate + malate (Fig. 7 B, dashed line) induced a mean shift of the peak to lower fluorescence intensities and slightly broadened the histogram. To exclude impurities of the preparation as a possible reason for the observed asymmetry, we added the fluorescent dye DASPMI to the same suspension. As shown in Fig. 7 C (dashed line) the addition of DASPMI shifted the fluorescence of almost all particles within the analyzed gate, indicating that the asymmetry is because of mitochondrial heterogeneity rather than to impurities of the preparation. The addition of the uncoupler TTFB led to a complete release of DASPMI from the mitochondria. As a result, a considerably heterogeneous fluorescence distribution reoccurs, very similar to the autofluorescence histogram in the oxidized state (Fig. 7, C and B, solid lines). Therefore, unspecified staining artifacts, which are mitochondrial membrane potential independent, could be ruled out. Hence, the apparent heterogeneity of the flavoprotein fluorescence distribution of intact mice skeletal muscle mitochondria can be attributed to the presence of different mitochondrial subpopulations.
Figure 7.
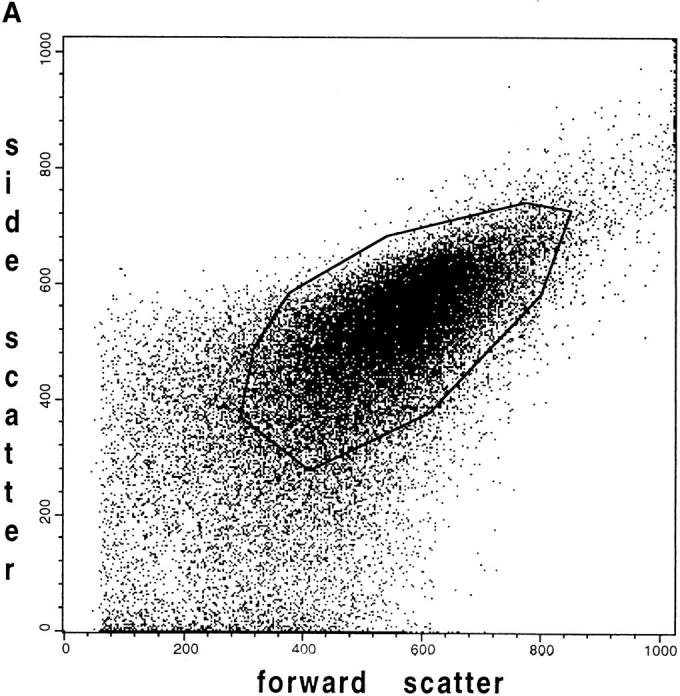
Flow-cytometric analysis showing the fluorescence distribution of flavoproteins and DASPMI in individual mice muscle mitochondria. Mice skeletal muscle mitochondria were isolated according to Wisniewski et al. (1993) and then suspended at 0.3 mg/ml in the medium for measurements. (A) Forward versus side scatter plot of the mitochondrial suspension. Each point is an individual mitochondrion. The mitochondria analyzed in B and C are located within the polygon area (gate). (B) Solid line, distribution of the flavoprotein autofluorescence intensities of individual mitochondria in the oxidized state; dashed line, distribution of the flavoprotein autofluorescence intensities after the addition of 10 mM glutamate and 5 mM malate. (C) Dashed line, distribution of fluorescence intensities of mitochondria after the addition of 5 μM DASPMI; solid line, distribution of fluorescence intensities after the addition of 5 μM TTFB.
Discussion
The muscle fiber is a highly differentiated multinucleated cell that exhibits a characteristic spatial organization of mitochondria. The muscle mitochondria are organized within subsarcolemmal and intermyofibrillar compartments. Many observations suggest there might be a relationship between the subcellular mitochondrial topology and differential mitochondrial functions (Palmer et al., 1986; Cogswell et al., 1993; Philippi and Sillau, 1994; Takahashi and Hood, 1996). Topological analysis of this relationship has not been possible yet because of a lack of methods providing simultaneous measurements of the structural and metabolic compartmentation. Here we have visualized the activity of the mitochondrial oxidative phosphorylation at different levels within single, unfixed muscle fibers.
We used confocal laser-scanning microscopy and digital fluorescence imaging microscopy of muscle tissue (Schubert et. al., 1989; Schubert, 1992) to quantify respiratory chain-linked autofluorescence changes of flavoproteins and NAD(P)H, which are intrinsic biological markers of the mitochondrial NAD–redox system. Saponin-permeabilized fibers from mice quadriceps muscle were used to study these autofluorescences at the single cell level. This preparation method is well documented by previous ultrastructural studies showing good overall morphology and preservation of the mitochondria in their subcellular compartments (Altschuld et al., 1985; Veksler et al., 1987; Lin et al., 1990). Therefore, the technique enables us to address the spatial and functional heterogeneity of the energy metabolism in skeletal muscle fibers by experimental modification of the extramitochondrial medium. In particular, the SSM and IMM, which are likely to be differentially involved in neurophysiological and pathological processes (Palmer et al., 1986; Cogswell et al., 1993; Philippi and Sillau, 1994; Takahashi and Hood, 1996), can be analyzed simultaneously.
Previous work has substantiated that the fluorescence signals detected at 366-nm excitation originate from the mitochondrial NADH, whereas the fluorescence signals recorded at 488-nm argon ion laser excitation are largely due to the emission of the oxidized flavin moiety of the mitochondrial flavoprotein α-lipoamide dehydrogenase (Kunz et al., 1994). We show here that the flavoprotein fluorescence obtained in the oxidized state of the myofiber overlaps to a large extent with the fluorescence of the mitochondrial potentiometric dye DASPMI (Horster et al., 1983; Bereiter-Hahn and Voth, 1994) and also with MitoTracker™ Green FM (Hoth et al., 1997), which is a constitutive marker of mitochondria. The fluorescence images obtained by confocal microscopy show the typical pattern of mitochondrial organization beneath the sarcolemma (SSM) and along the myofibrils (IMM). Despite the similarities of the autofluorescence and DASPMI signal distributions in single myofibers, differences between these patterns were also evident. The latter differences were particularly prominent by fluorescence quantitation in histograms clearly showing a substantial reduction of the flavoprotein signal level in the IMM area of the fiber compared with the SSM compartment. By contrast, DASPMI shows a more homogeneous fluorescence signal intensity associated both with the SSM and IMM. This suggested the presence of mitochondria with differences in flavoprotein composition. Our quantification indicates a fourfold higher content of the fluorescent flavoprotein α-lipoamide dehydrogenase in SSM than in IMM. Colocalization studies with the mitochondrial marker MitoTracker™ Green FM substantiated these results. In addition, it was seen that a substantial heterogeneity of the flavoprotein fluorescence signal is present within the subsarcolemmal area. We found a clear indication for the existence of two topological mitochondrial subsets. One subset is negative for flavoprotein fluorescence (flavoprotein fluorescence–negative/MitoTracker™ Green FM fluorescence–positive mitochondria), and one is positive for flavoprotein fluorescence (flavoprotein fluorescence–positive/MitoTracker™ Green FM fluorescence–positive mitochondria). To test this observation we applied flow cytometry to isolated single mice muscle mitochondria. Mitochondria with similar sizes showed a heterogeneous non-Gaussian distribution of flavoprotein-caused autofluorescence signals, whereas the entire population showed a rather uniform accumulation of the fluorescent dye DASPMI. According to the fact that the accumulation of DASPMI in the mitochondrial matrix space is known to be dependent on the presence of a high membrane potential of the mitochondrial inner membrane (Horster et al., 1983; Bereiter-Hahn and Voth, 1994), all stained particles are, therefore, functionally intact mitochondria. Moreover, the accumulation of DASPMI can be completely reversed by the uncoupler TTFB, a protonophore causing the dissipation of the membrane potential. These results further support the presence of mitochondrial subpopulations containing different amounts of fluorescent flavoproteins in skeletal muscle fibers.
It was suggested earlier that mitochondria with different subcellular locations in myofibers may have different protein compositions (Palmer et al., 1986; Cogswell et al., 1993; Philippi and Sillau, 1994), which might be due to differences in mitochondrial protein import (Takahashi and Hood, 1996). Our data support this possibility. Moreover, we have shown that the heterogeneity of mitochondria is higher than expected by the simple distinction of subsarcolemmal and intermyofibrillar type. The higher content of fluorescent flavoproteins in one of the SSM populations identified in our study can explain the reported differences of SSM and IMM in the oxidative capacity for NADH- and FADH-generating substrates (Philippi and Sillau, 1994). We detected these biochemical differences of the mitochondrial subpopulations under dynamic in situ model conditions. Therefore, the occurrence of artifacts due to isolation procedures, which may have led to contradictory results (Manneschi and Frederico, 1995), can be excluded.
One important step in the analytical procedure of mitochondrial functions (or dysfunctions) in situ is to develop methods providing insight into the redox dynamics of the mitochondrial inner membrane. We have shown here that rather small changes of the NAD–redox states can be assessed by ratio imaging of fluorescent flavoproteins and of NAD(P)H. Upon the addition of mitochondrial substrates, ADP, or inhibitors of the oxidative phosphorylation, inverse changes of the fluorescence intensities of flavoproteins and NAD(P)H fluorescences were observed. This results in significant changes of ratio images. Within single fibers these changes are rather uniform, which is in line with a complete accessibility of the entire mitochondrial population. Therefore, despite the detected differences in the flavoprotein fluorescences of the different mitochondrial subsets, the overall functional behavior in saponin-permeabilized fiber preparations is unique.
Our results have implications for the analysis of cellular functions of mitochondria. First, by direct spatial correlation of intrinsic mitochondrial redox markers with accumulating potentiometric dyes and/or constitutive mitochondrial markers, it is possible to dissect the oxidative phosphorylation pathway into different compartments. Second, by application of different mitochondrial substrates or specific inhibitors it is possible to trigger the system and experimentally assign changes within these distinct compartments to subcellular sites. Hence, the compartmentation of mitochondrial functions can be studied in a dynamic way. Third, functional imaging of mitochondria in single myofibers by the approach presented here may unravel the functional and distributional consequences of mitochondrial DNA heteroplasmy occurring in mitochondrial cytopathies (for review see Wallace, 1992). Under these pathological conditions, genotypically different mitochondrial subpopulations that might have different biochemical properties will be detectable within a fiber bundle and even within a single fiber.
Acknowledgments
This work was supported by grants of the Land Sachsen-Anhalt (1795A/0084; 1919A/0025; 1897A/0025), the Deutsche Forschungsgemeinschaft (SFB 387; INK 15/A1; Schu 627/2-2 and 8-1), and the Bundesministerium für Bildung, Wissenschaft, Forschung und Technologie (07NBL04,TP10).
Abbreviations used in this paper
- DASPMI
2-(p-dimethylaminostyryl) pyridyl methyl iodide
- FAD
flavine adenine dinucleotide
- IMM
intermyofibrillar mitochondria
- SSM
subsarcolemmal mitochondria
- TTFB
4, 5, 6, 7-tetrachloro-2-trifluoromethyl-benzimidazole
Footnotes
The excellent technical assistance of K. Kaiser (Neurobiochemisches Labor der Klinik für Neurologie, Magdeburg, Germany) is gratefully acknowledged.
A. Kuznetsov and O. Mayboroda contributed equally to this work.
Address all correspondence to Wolfram S. Kunz, Neurobiochemisches Labor der Klinik für Neurologie, Universitätsklinikum der Otto-von- Guericke Universität Magdeburg, Leipziger Str. 44, D-39120 Magdeburg, Germany. Tel.: (49) 391-671-5219. Fax: (49) 391-671-5228. E-mail: wolfram. kunz@medizin.uni-magdeburg.de
References
- Altschuld RA, Wenger WC, Lamka KG, Kindig OR, Capen CC, Mizuhira V, van der Heide RS, Brierley GP. Structural and functional properties of adult rat heart myocytes lysed with digitonin. J Biol Chem. 1985;260:14325–14334. [PubMed] [Google Scholar]
- Bereiter-Hahn J, Voth M. Dynamics of mitochondria in living cells: shape changes, dislocations, fusion, and fission of mitochondria. Microsc Res Tech. 1994;27:198–219. doi: 10.1002/jemt.1070270303. [DOI] [PubMed] [Google Scholar]
- Chemnitius JM, Manglitz T, Kloeppel M, Doenst T, Schwartz P, Kreuzer H, Zech R. Rapid preparation of subsarcolemmal and interfibrillar mitochondrial subpopulations from cardiac muscle. Int J Biochem. 1993;25:589–596. doi: 10.1016/0020-711x(93)90668-5. [DOI] [PubMed] [Google Scholar]
- Chen LB. Fluorescent labeling of mitochondria. Methods Cell Biol. 1989;29:103–123. doi: 10.1016/s0091-679x(08)60190-9. [DOI] [PubMed] [Google Scholar]
- Cogswell AM, Stevens RJ, Hood DA. Properties of skeletal muscle mitochondria isolated from subsarcolemmal and intermyofibrillar regions. Am J Physiol. 1993;264:C383–C389. doi: 10.1152/ajpcell.1993.264.2.C383. [DOI] [PubMed] [Google Scholar]
- Eng J, Lynch RM, Balaban RS. Nicotinamide adenine dinucleotide fluorescence spectroscopy and imaging of isolated cardiac myocytes. Biophys J. 1989;55:621–630. doi: 10.1016/S0006-3495(89)82859-0. [DOI] [PMC free article] [PubMed] [Google Scholar]
- Estabrook RW. Fluorometric measurement of reduced pyridine nucleotide in cellular and subcellular particles. Anal Biochem. 1962;4:231–245. doi: 10.1016/0003-2697(62)90006-4. [DOI] [PubMed] [Google Scholar]
- Franke H, Barlow CH, Chance B. Oxygen delivery in perfused rat kidney: NADH fluorescence and renal functional state. Am J Physiol. 1976;231:1082–1086. doi: 10.1152/ajplegacy.1976.231.4.1082. [DOI] [PubMed] [Google Scholar]
- Füchtbauer E-M, Rowlerson AM, Götz K, Friedrich G, Mabuchi K, Gergely J, Jockusch H. Direct correlation of parvalbumin levels with myosin isoforms and succinate dehydrogenase activity on frozen sections of rodent muscle. J Histochem Cytochem. 1991;39:355–361. doi: 10.1177/39.3.1825216. [DOI] [PubMed] [Google Scholar]
- Glauert A, Dingle J, Lucy J. Action of saponin on biological cell membranes. Nature. 1962;196:952–955. doi: 10.1038/196952a0. [DOI] [PubMed] [Google Scholar]
- Hassinen I, Chance B. Oxidation-reduction properties of the mitochondrial flavoprotein chain. Biochem Biophys Res Commun. 1968;31:895–900. doi: 10.1016/0006-291x(68)90536-6. [DOI] [PubMed] [Google Scholar]
- Horster MF, Wilson PD, Gundlach H. Direct evaluation of fluorescence in single renal epithelial cells using a mitochondrial probe (DASPMI) J Microsc. 1983;132:143–148. doi: 10.1111/j.1365-2818.1983.tb04265.x. [DOI] [PubMed] [Google Scholar]
- Hoth M, Fanger CM, Lewis RS. Mitochondrial regulation of store-operated calcium signaling in T lymphocytes. J Cell Biol. 1997;137:633–648. doi: 10.1083/jcb.137.3.633. [DOI] [PMC free article] [PubMed] [Google Scholar]
- Katz LA, Koretsky AP, Balaban RS. Respiratory control in the glucose perfused heart: a 31P-NMR and NADH fluorescence study. FEBS (Fed Eur Biochem Soc) Lett. 1987;221:270–276. doi: 10.1016/0014-5793(87)80939-0. [DOI] [PubMed] [Google Scholar]
- Kunz WS, Kuznetsov AV, Schulze W, Eichhorn K, Schild L, Striggow F, Bohnensack R, Neuhof S, Grasshoff H, Neumann HW, Gellerich FN. Functional characterization of mitochondrial oxidative phosphorylation in saponin-skinned human muscle fibers. Biochim Biophys Acta. 1993;1144:46–53. doi: 10.1016/0005-2728(93)90029-f. [DOI] [PubMed] [Google Scholar]
- Kunz WS, Kuznetsov AV, Winkler K, Gellerich FN, Neuhof S, Neumann HW. Measurement of fluorescence changes of NAD(P)H and of fluorescent flavoproteins in saponin-skinned human skeletal muscle fibers. Anal Biochem. 1994;216:322–327. doi: 10.1006/abio.1994.1048. [DOI] [PubMed] [Google Scholar]
- Kunz D, Luley C, Winkler K, Lins H, Kunz WS. Flow cytometric detection of mitochondrial dysfunction in subpopulations of human mononuclear cells. Anal Biochem. 1997;246:218–224. doi: 10.1006/abio.1997.2007. [DOI] [PubMed] [Google Scholar]
- Lin A, Krockmalnic G, Penman S. Imaging cytoskeleton-mitochondrial membrane attachments by embedment-free electron microscopy of saponin-extracted cells. Proc Natl Acad Sci USA. 1990;87:8565–8569. doi: 10.1073/pnas.87.21.8565. [DOI] [PMC free article] [PubMed] [Google Scholar]
- Manneschi L, Federico A. Polarographic analysis of subsarcolemmal and intermyofibrillar mitochondria from rat skeletal and cardiac muscle. J Neurol Sci. 1995;128:151–156. doi: 10.1016/0022-510x(94)00227-f. [DOI] [PubMed] [Google Scholar]
- Mayevsky A, Chance B. Intracellular oxidation-reduction state measured in situ by a multichannel fiber-optic surface fluorimeter. Science. 1982;217:537–540. doi: 10.1126/science.7201167. [DOI] [PubMed] [Google Scholar]
- McKean TA. Calcium uptake by mitochondria isolated from muskrat and guinea pig hearts. J Exp Biol. 1991;157:133–142. doi: 10.1242/jeb.157.1.133. [DOI] [PubMed] [Google Scholar]
- O'Gorman E, Beutner G, Wallimann T, Brdiczka D. Differential effects of creatine depletion on the regulation of enzyme activities and on creatine-stimulated mitochondrial respiration in skeletal muscle, heart, and brain. Biochim Biophys Acta. 1996;1276:161–170. doi: 10.1016/0005-2728(96)00074-6. [DOI] [PubMed] [Google Scholar]
- Palmer JW, Tandler B, Hoppel CL. Heterogeneous response of subsarcolemmal heart mitochondria to calcium. Am J Physiol. 1986;250:H741–H748. doi: 10.1152/ajpheart.1986.250.5.H741. [DOI] [PubMed] [Google Scholar]
- Piston DW, Masters BR, Webb WW. Three-dimensionally resolved NAD(P)H cellular metabolic redox imaging of the in situ cornea with two-photon excitation laser scanning microscopy. J Microsc. 1995;178:20–27. doi: 10.1111/j.1365-2818.1995.tb03576.x. [DOI] [PubMed] [Google Scholar]
- Philippi M, Sillau HA. Oxidative capacity distribution in skeletal muscle fibers of the rat. J Exp Biol. 1994;189:1–11. doi: 10.1242/jeb.189.1.1. [DOI] [PubMed] [Google Scholar]
- Scholz R, Thurman RG, Williamson JR, Chance B, Bücher T. Flavin and pyridine nucleotide oxidation-reduction changes in perfused rat liver. J Biol Chem. 1969;244:2317–2324. [PubMed] [Google Scholar]
- Schubert W. Triple immunofluorescence confocal laser scanning microscopy: spatial correlation of novel cellular differentiation markers in human muscle biopsies. Eur J Cell Biol. 1991;55:272–285. [PubMed] [Google Scholar]
- Schubert W, Zimmermann K, Cramer M, Starzinski-Powitz A. Lymphocyte antigen Leu-19 as a molecular marker of regeration in human skeletal muscle. Proc Natl Acad Sci USA. 1989;86:307–311. doi: 10.1073/pnas.86.1.307. [DOI] [PMC free article] [PubMed] [Google Scholar]
- Takahashi H, Hood DA. Protein import into subsarcolemmal and intermyofibrillar mitochondria. Differential import regulation in distinct subcellular regions. J Biol Chem. 1996;271:27285–27291. doi: 10.1074/jbc.271.44.27285. [DOI] [PubMed] [Google Scholar]
- Veksler VI, Kuznetsov AV, Sharov VG, Kapelko VI, Saks VA. Mitochondrial respiratory parameters in cardiac tissue: a novel method of assessment by using saponin-skinned fibers. Biochim Biophys Acta. 1987;892:191–196. doi: 10.1016/0005-2728(87)90174-5. [DOI] [PubMed] [Google Scholar]
- Vuorinen KH, Ala-Rämi A, Yan Y, Ingman P, Hassinen I. Respiration control in heart muscle during fatty acid oxidation. Energy state or substrate-level regulation by Ca2+? . J Mol Cell Cardiol. 1995;27:1581–1591. doi: 10.1016/s0022-2828(95)90458-1. [DOI] [PubMed] [Google Scholar]
- Wallace DC. Diseases of the mitochondrial DNA. Annu Rev Biochem. 1992;61:1175–1212. doi: 10.1146/annurev.bi.61.070192.005523. [DOI] [PubMed] [Google Scholar]
- Wisniewski E, Kunz WS, Gellerich FN. Phosphate affects the distribution of flux control among the enzymes of oxidative phosphorylation in rat skeletal mitochondria. J Biol Chem. 1993;268:9343–9346. [PubMed] [Google Scholar]


