

Abstract
Dynamic cytoskeletal rearrangements are involved in neuronal growth cone motility and guidance. To investigate how cell surface receptors translate guidance cue recognition into these cytoskeletal changes, we developed a novel in vitro assay where beads, coated with antibodies to the immunoglobulin superfamily cell adhesion molecule apCAM or with purified native apCAM, replaced cellular substrates. These beads associated with retrograde F-actin flow, but in contrast to previous studies, were then physically restrained with a microneedle to simulate interactions with noncompliant cellular substrates. After a latency period of ∼10 min, we observed an abrupt increase in bead-restraining tension accompanied by direct extension of the microtubule-rich central domain toward sites of apCAM bead binding. Most importantly, we found that retrograde F-actin flow was attenuated only after restraining tension had increased and only in the bead interaction axis where preferential microtubule extension occurred. These cytoskeletal and structural changes are very similar to those reported for growth cone interactions with physiological targets. Immunolocalization using an antibody against the cytoplasmic domain of apCAM revealed accumulation of the transmembrane isoform of apCAM around bead-binding sites. Our results provide direct evidence for a mechanical continuum from apCAM bead substrates through the peripheral domain to the central cytoplasmic domain. By modulating functional linkage to the underlying actin cytoskeleton, cell surface receptors such as apCAM appear to enable the application of tensioning forces to extracellular substrates, providing a mechanism for transducing retrograde flow into guided growth cone movement.
The precise formation of neuronal connections represents an essential process during embryonic development of the nervous system. The initial pattern of neuronal connections depends on axonal navigation mediated by growth cones, highly motile structures residing at the tip of developing or regenerating axons. Growth cones are essentially sensors that continuously probe their environment for both long- and short-range guidance cues, which may be either attractive or repulsive (Goodman, 1996; Tessier-Lavigne and Goodman, 1996). It is now believed that the integration of these four guidance properties determines the direction of the axonal projection.
Evidence suggests that the growth cone cytoskeleton is intimately involved in transducing guidance signals, in particular, short-range cues including cell surface and extracellular matrix molecules (Tanaka and Sabry, 1995). Actin filaments are the major cytoskeletal components of filopodia and lamellipodia in the peripheral domain of growth cones (Lewis and Bridgman, 1992). These dynamic structures undergo cycles of extension and retraction, and sample the local environment for directional cues (Bray and Chapman, 1985; Bentley and Toroian-Raymond, 1986; Goldberg and Burmeister, 1986; Chien et al., 1993; Davenport et al., 1993). Microtubules are bundled in axons and generally localized to the central cytoplasmic domain of growth cones (Forscher and Smith, 1988). As they enter the growth cone, microtubules typically splay out and have been observed to continuously extend into and retract from lamellipodia and filopodia bases (Tanaka and Kirschner, 1991). Actin filaments and microtubules also undergo dynamic redistribution during growth cone steering events (Tanaka and Sabry, 1995). Recent studies suggest that actin filaments accumulate just distal to sites of microtubule extension during target interactions both in vitro and in vivo (Lin and Forscher, 1993; O'Connor and Bentley, 1993), and microtubule reorientation and extension appear to depend on actin filament assembly and turnover (Sabry et al., 1991; Lin and Forscher, 1993). Similar results have been observed with growth cones turning at substrate boundaries (Tanaka and Kirschner, 1995; Challacombe et al., 1996, 1997; Williamson et al., 1996).
Recent investigations suggest a mechanism for harnessing peripheral actomyosin-based motility to produce directed cellular movements (Mitchison and Kirschner, 1988; Lin et al., 1994; Mitchison and Cramer, 1996). In noninteracting growth cones, actin filaments move centripetally at rates of about 100 nm/s by a process referred to as retrograde flow (Forscher and Smith, 1988). This flow is maintained by continuous assembly of actin filaments along the leading edge of the lamellipodium and at the tips of filopodia concomitant with myosin-dependent retrograde filament transport (Lin et al., 1996). Actin filament recycling at a proximal site (by a yet to be characterized mechanism involving depolymerization and/or severing) is likely involved in maintaining the steady filament flux (see Fig. 9 A).
Figure 9.

Substrate–cytoskeletal coupling model. Schematic cross-sections through a growth cone demonstrate the cytoskeletal organization of the P and C domain, as well as of the T zone, at different stages of an RBI experiment. Left inset shows potential conventional (a), unconventional (b), and microtubule-associated (c) myosin localizations and details of actin recycling; right inset depicts actin-filament organization in filopodia and lamellipodia as well as actin assembly. Inset in B shows details of a potential molecular clutch. Cross-section and top views of growth cones during RBIs are shown on left and right, respectively. (A) Latency period. The molecular clutch between receptor and actin cytoskeleton exhibits slippage at low levels of apCAM clustering early in the RBI. ApCAM–actin linkage is not strong enough to support significant C–P domain tension, nor attenuate retrograde flow. Retrograde flow is maximal (F-actin flow marker 1 displacement) and growth is slow. (B) Interaction period. When enough functional linkages are engaged by restrained beads, retrograde flow is attenuated (marker bead 2), C–P domain tension increases and the C domain extends toward the restrained bead. Protrusive growth may result directly from continued actin assembly during F-actin flow attenuation.
When F-actin flow patterns were mapped during homophilic growth cone interactions between cultured Aplysia neurons, an inverse relationship between rates of growth cone advance and retrograde F-actin flow was discovered (Lin and Forscher, 1995). According to these and other findings (Theriot and Mitchison, 1991), a model was proposed whereby growth cones regulate the rate and direction of axonal advance by modulating receptor-mediated coupling between intracellular actin networks and extracellular substrates (Lin et al., 1994; Lin and Forscher, 1995). Previous studies did not analyze the properties of the putative cell surface receptor(s) involved. In this report we address this question by investigating if a specific cell adhesion molecule (CAM)1 of the immunoglobulin superfamily, Aplysia apCAM, could direct growth by affecting underlying actin filament dynamics in a predictable manner.
CAMs of the immunoglobulin superfamily (Ig CAMs) represent an expanding structural group of cell surface receptors with important roles in neurite outgrowth and axonal guidance as well as other cell–cell interactions (Rutishauser, 1993; Bruemmendorf and Rathjen, 1994; Walsh and Doherty, 1996). The structural features, binding properties and expression patterns of these receptors have been well characterized, and recent studies have implicated a variety of signal transduction pathways in the neurite outgrowth-promoting activity of Ig CAMs (for reviews see Doherty and Walsh, 1994, 1996; Maness et al., 1996; Kamiguchi and Lemmon, 1997). Despite these advances, how Ig CAMs might transduce extracellular cue recognition during neuronal growth and steering into biophysical effects on the actin cytoskeleton has not been addressed. In fact, there are only a few reports describing potential linkage proteins (such as ankyrin and spectrin), which could provide a biochemical basis for such interactions (Pollerberg et al., 1987; Davis and Bennett, 1994; Garver et al., 1997).
apCAM is structurally related to vertebrate NCAM (Cunningham et al., 1987) containing five extracellular Ig-like and two fibronectin type III-like domains. apCAM has three alternative mRNA splice forms leading to one membrane-spanning and two glycosylphosphatidylinositol (GPI)-linked isoforms (Mayford et al., 1992). Originally identified as a neuron-specific membrane glycoprotein, apCAM has been localized on neuronal cell bodies, neurites, and growth cones, and appears to be involved in neurite fasciculation (Keller and Schacher, 1990; Peter et al., 1994). In addition, serotonin-mediated internalization of apCAM plays a role in formation of new synapses between sensory and motor neurons in learning related synaptic growth (Bailey et al., 1992; Zhu et al., 1994, 1995). Although the function of the GPI-linked isoforms are unknown, very recent evidence suggests that mitogen-activated protein kinase–mediated phosphorylation of the apCAM cytoplasmic domain may regulate internalization during long-term facilitation (Bailey et al., 1997).
From a developmental perspective, possible roles for apCAM in regulating growth cone motility or guidance have not been well characterized. In this regard, apCAM does accumulate at sites of growth cone–target interactions where active remodeling of the actin cytoskeleton occurs (Thompson et al., 1996). Furthermore, analysis of apCAM behavior in living neurons revealed that apCAM can associate with the F-actin cytoskeleton in different ways depending on clustering density (Thompson et al., 1996; Fig. 6 F).
Figure 6.


Inductopodia preferentially start with an anterograde orientation after restraint. (A) DIC image of a growth cone with a 4E8-coated bead which was restrained for 2 min. Star marks the center of the bead at time of initial restraint. (B) After release of restraint bead moves anterogradely (α = 135°) driven by inductopodium formation (arrow). (C) Scheme showing how α was measured. (D) Inductopodia probability of 4E8 beads restrained for various amounts of time. (E) Inductopodia were grouped according translocation angle (α) into four different categories. 69% (n = 35) of all inductopodia analyzed had an anterograde component to their initial movement (90° < α < 180°). (F) Scheme depicting apCAM behavior as a function of clustering density. Free apCAM (left) does not appear to interact with underlying F-actin (white arrowhead), whereas moderate clustering results in coupling to F-actin flow via putative linkage protein(s) (middle). High-density clustering has been shown to trigger nucleation of actin assembly (right) in addition to flow coupling (Thompson et al., 1996). Bar, 5 μm.
Here we report a role for apCAM–cytoskeletal interactions in regulating growth cone motility and reorientation responses using large silica beads derivatized with cell surface ligands as defined substrates. When beads derivatized with affinity-purified native apCAM, apCAM antibodies, or Con A (a lectin known to interact with apCAM; Thompson et al., 1996) were placed on Aplysia growth cones and physically restrained to prevent retrograde movement, structural and cytoskeletal changes typical of growth cone interactions with cellular targets were observed (Lin and Forscher, 1993). These effects included directed microtubule extension towards the bead, protrusive growth of the leading edge, and actin accumulation at the target site. During such restrained bead interactions (RBIs), we found that tension increased in the RBI axis at the same time as central domain extension and attenuation of retrograde F-actin flow were observed. Our results provide evidence that cross-linking of a specific cell surface receptor, apCAM, promotes neuronal growth and reorientation by functioning like a molecular clutch, transducing force between the intracellular actomyosin-based contractile system and extracellular substrates.
Materials and Methods
apCAM Purification
apCAM was purified by immunoaffinity isolation as reported (Keller and Schacher, 1990). Aplysia nervous system ganglia and associated connectives were homogenized in ice-cold solution containing 250 mM sucrose and 25 mM Tris, pH 7.4, 3 mM EDTA, 1 mM EGTA, and 0.5 mM Pefabloc (Boehringer Mannheim Biochemicals, Indianapolis, IN) as protease inhibitors. After centrifugation of the homogenate at 1,600 g for 10 min to remove nuclei and connective debris, the supernatant was centrifuged at 150,000 g for 2 h at 4°C. The pelleted membranes were solubilized in 2.5% Triton X-100, 25 mM Tris, pH 7.4, 150 mM NaCl containing 1 mg/ml BSA and 0.5 mM Pefabloc overnight at 4°C. The extracted membranes were centrifuged at 150,000 g for 1 h and the supernatant was loaded at 4°C onto an affinity column, which was prepared by coupling IgG of the monoclonal anti-apCAM antibody 4E8 (recognizes an extracellular epitope in all three reported apCAM isoforms; Keller and Schacher, 1990; Mayford et al., 1992) to cyanogen bromide–activated Sepharose 4B (Sigma Chemical Co., St. Louis, MO) according to the manufacturer. The column was washed with 10 vol of the following buffers: 50 mM Tris, pH 7.4, 0.5 M NaCl, 1 mM EDTA, 0.5% Triton X-100; 50 mM Tris, pH 7.4, 150 mM NaCl, 1% Triton X-100; 50 mM Tris, pH 7.4, 150 mM NaCl, and 1% β-octyl-glucoside (Sigma Chemical Co.). apCAM was eluted with 100 mM glycine, pH 2.6, 150 mM NaCl, 3 mM EDTA, 1 mM EGTA, 1% β-octyl- glucoside. 1.5 ml fractions were immediately neutralized with 50 μl of 1 M Tris, pH 9.5. Fractions were analyzed by 7.5% SDS-PAGE followed by silver staining (Heukeshoven and Dernick, 1988) and immunoblotting with 4E8 (Thompson et al., 1996). Purified apCAM was then dialyzed against PBS and concentrated with Centripreps (Amicon Corp., Danvers, MA) to 150–250 μg/ml. Protein determination was carried out using the BCA microassay (Pierce Chemical Co., Rockford, IL) according to the manufacturer. The average yield of apCAM was ∼100 μg starting from six animals.
Cloning of the apCAM Cytoplasmic Domain
Fusion proteins containing the cytoplasmic domain of apCAM (CapCAM) and either maltose-binding protein (MBP) or glutathione-S-transferase (GST) were produced using the pMAL-p2 (New England Biolabs, Inc., Beverly, MA) and pGEX-2T (Pharmacia Biotechnology Inc., Piscataway, NJ) expression systems respectively. The MBP fusion protein was used as an immunogen for polyclonal antibody production, and the GST fusion protein for affinity purification of the CapCAM antibody to screen out antibodies to MBP.
For the MBP–CapCAM construct, the CapCAM sequence was amplified by PCR from a random primed λ-ZAP Aplysia cDNA library (a kind gift of J. Schwartz and D. Solomon, Columbia University, New York; Jonas et al., 1996), using primers corresponding to the sequence coding for amino acids 820–932 (Mayford et al., 1992) with EcoRI and PstI sites added to the sense and antisense primers, respectively, to allow directional cloning into the pMAL-p2 expression vector. Sense and antisense primer sequences were: 5′ CCG TAG AAT TCG AGC TGG TGG ACA GAC TGA GAG GC 3′ and 5′ AAC TGC AGG CTG AGG TGT CCA GAT CAA GC 3′, respectively. Using AmpliTaq DNA polymerase (Perkin-Elmer Corp., Norwalk, CT), a single PCR product at the expected size of 380 bp was obtained and subcloned into pMAL-p2 using the EcoRI and PstI restriction sites. The cloned gene fragment sequence was confirmed by standard dideoxy-chain termination sequencing using 7-deaza Sequenase, version 2.0, following manufacturer's instructions (United States Biochemical Corp., Cleveland, OH). For the GST–CapCAM construct, the CapCAM sequence was amplified by PCR as above using exact match primers corresponding to amino acids 828–932 with BamHI and EcoRI sites added to the sense and antisense primers, respectively, to allow directional cloning into the pGEX-2T expression vector. Sense and antisense primer sequences were: 5′ CGC GGA TCC GCG GGA TCC CGC CTG GGA GGC AAG GGA GGG 3′ and 5′ CCG GAA TTC CCG GAA TTC TCC GGG AGT TGA GGA GTG GC 3′, respectively.
apCAM Cytoplasmic Domain Expression and Antibody Production
MBP–CapCAM fusion protein was isolated from the periplasm of induced bacterial cells using the cold osmotic shock method. Briefly, the bacteria were harvested by centrifugation at 3,000 g for 15 min at 4°C, resuspended in 1/10 vol of 30 mM Tris-HCl, pH 8.0, 20% sucrose, and 1 mM EDTA, and incubated at room temperature (RT) for 10 min on an orbital shaker. The suspension was centrifuged at 8,000 g at 4°C for 10 min, the pellet resuspended in 1/10 original volume with 5 mM MgSO4 and incubated on ice for 10 min on an orbital shaker. After centrifugation of the suspension as above, the supernatant was loaded onto an amylose affinity column and MBP-CapCAM was eluted with 10 mM maltose in 10 mM sodium phosphate, pH 7.2, 1 mM EGTA. Pure MBP–CapCAM protein fractions (determined by SDS-PAGE) were pooled and dialyzed against 10 mM Tris-HCl, 100 mM NaCl, pH 8.0.
To isolate GST–CapCAM fusion protein, bacteria were harvested as above, resuspended in PBS containing 5 mM DTT and 0.5 mM Pefabloc, and treated with 100 μg/ml lysozyme (Sigma Chemical Co.) for 15 min at 4°C. After a brief sonication, the suspension was solubilized in 1% Triton X-100 for 30 min at 4°C on a rocker platform. After centrifugations first at 12,000 g for 10 min, and then at 30,000 g for 10 min at 4°C, the supernatant was filtered (0.45 μm) and loaded onto a glutathione-Sepharose column. The GST–CapCAM fusion protein was eluted with 10 mM glutathione in 50 mM Tris-HCl, pH 8.0, containing 5 mM DTT. Pure GST–CapCAM fusion protein fractions (determined by SDS-PAGE) were dialyzed against coupling buffer (0.1 M NaHCO3, pH 8.0, 0.5 M NaCl).
For antibody production, purified MBP–CapCAM fusion protein was injected into rabbits using standard protocols. The serum was then affinity purified using a GST–CapCAM affinity column using a cyanogen bromide-activated Sepharose (Sigma Chemical Co.) matrix to couple the GST–CapCAM. After equilibration with TBS, pH 7.5, the column was loaded with 10 ml rabbit serum diluted 1:1 with TBS. The column was washed with five volumes of TBS, TBS containing 1 M NaCl, and again with TBS. CapCAM antibody was eluted with 0.1 M glycine-HCl, pH 2.8, collected as 1 ml fractions, neutralized with 100 μl 1 M Tris, pH 8.8, and fractions were dialyzed against TBS. For Western blots, membrane proteins extracted from Aplysia nervous system were separated by 10% SDS-PAGE and transferred onto nitrocellulose membrane (Thompson et al., 1996). The CapCAM rabbit antiserum was incubated at 1:10,000, the affinity-purified CapCAM antibody at 25 ng/ml, and 4E8 at 2 μg/ml in TBS containing 5% nonfat dry milk, 0.1% Tween 20, overnight at 4°C. After washing, secondary alkaline phosphatase–conjugated antibodies (Promega Corp., Madison, WI) were incubated at 0.2 μg/ml for 2 h at RT, and blots were developed by standard techniques.
Bead Preparation
Silica beads (5 μm diam) with aminopropyl functional groups (Bangs Laboratories Incorporated, Carmel, IN) were derivatized with protein A or avidin DX, respectively, via glutaraldehyde linkage as previously described (Thompson et al., 1996). Protein-linked beads were stored as 1% stocks (wt/vol) at 4°C. Using a protein A–Sepharose column (Pharmacia Biotechnology Inc.), 4E8 IgG was purified from ascites produced by mice injected with 4E8 hybridoma cells (hybridomas were kindly provided by K. Martin, E. Kandel, and S. Schacher, Columbia University, New York). Before antibody incubation, protein A beads were washed twice with TBS and then incubated with 1 mg/ml 4E8 or RPC5 (nonimmune IgG of the same subclass as 4E8 [IgG2a], Cappel, Durham, NC) IgG in TBS overnight at 4°C, whereas avidin beads were washed twice with 10 mM Tris, pH 8.0, and incubated with 1 mg/ml biotinylated lectins (Vector Labs Inc., Burlingame, CA) in the same buffer overnight at 4°C. Antibody and lectin bead stocks were stored in ligand solution at 4°C. Before use, beads were washed three times with TBS to remove free ligands. Western blotting and densitometry analysis of 4E8 beads revealed about 4,900 IgG molecules per μm2. To prepare apCAM beads, affinity-purified apCAM was added at 150–250 μg/ml in PBS to 0.25% (wt/vol) glutaraldehyde-activated silica beads. Coupling was done overnight at 4°C. apCAM-coupled beads were pelleted and resuspended in 5 mg/ml BSA in 50 mM Tris, pH 8.0 (blocking solution) for 30 min at RT to backfill any residual active sites. ApCAM beads were then incubated in 2 M NaCl in TBS, 1 mM EDTA for 30 min at RT to remove protein noncovalently bound to coupled apCAM. As with protein A or avidin beads, apCAM-coupled beads were stored in blocking solution at 4°C. Con A beads (d = 800 nm) used as actin flow markers were prepared identically to Con A–coated target beads.
Cell Culture
Aplysia bag cell neurons were cultured as previously described (Forscher and Smith, 1988; Lin and Forscher, 1993). For bead interactions, bag cell neurons were plated on 25-mm round coverslips coated with poly-l-lysine (Sigma Chemical Co.), and used for interaction assays 1–2 d after plating. Cells were treated with 0.1% FCS (Gemini Bioproducts, Calabasas, CA) for 1 h at 14°C followed by three washes with L15 medium supplemented with artificial seawater (Forscher and Smith, 1988) on the day of the experiment. Serum treatment was not essential for RBIs.
Video-Light Microscopy and Image Processing
Video-enhanced differential interference contrast (DIC) and fluorescence microscopy were performed as previously described (Forscher and Smith, 1988; Lin and Forscher, 1993, 1995). Images processed on line with a 151-AT series image processor (Imaging Technology Inc., Woburn, MA) were recorded on an optical memory laser disc (model TQ-2026F; Panasonic, Secaucus, NJ) and redigitized for image analysis using custom-written software. Images for presentations were captured using a Targa board (Truevision, Inc., Indianapolis, IN) and processed with Photoshop 4.0 software (Adobe, San Jose, CA).
RBI Assay
Cells plated on round coverslips were placed in a custom-made open chamber and perfused with L15 supplemented with artificial seawater containing 5 mg/ml BSA (to block nonspecific bead binding) until start of the experiment. Growth cones suitable for RBI experiments were identified with a x/y stage controller (Newport Corporation, Irvine, CA) driven by custom search and mark software, and imaged using a 63×/1.4 NA planapochromat objective (Zeiss, Thornwood, NY). For geometric reasons, growth cones with their growth axis perpendicular to the microneedle axis were usually chosen for RBI experiments. Beads were applied as a 1:5,000 dilution of 1% (wt/vol) stocks in perfusion medium, and moved onto growth cone lamellae using a microneedle mounted on a 3D hydraulic micromanipulator (Narashigi USA Inc., East Meadow, NY). Microneedles with an average tip diameter of 1 μm were made from 5 μl micropipettes (Drummond Scientific Company, Broomall, PA) using a Narashigi micropipette puller. After coupling to the retrograde flow, beads were restrained from further movement with the microneedle under video observation. Beads were held at the upper third part of their curvature. Antibody control experiments were carried out by pretreatment of cells and apCAM beads with 10 μg/ml of 4E8 in perfusion medium for 15 min at RT.
Fluorescence Staining
At the end of restrained bead interactions, when the central domain reached the bead, cells were fixed as previously described (Forscher and Smith, 1988). Staining for F-actin (Rhodamine-phalloidin; Molecular Probes, Eugene, OR), β-tubulin (monoclonal antibody; Sigma Chemical Co.), and total apCAM (with 4E8) were carried out as previously described (Lin and Forscher, 1993; Thompson et al., 1996). The membrane-spanning apCAM isoform was detected using an affinity-purified polyclonal rabbit antibody (10 μg/ml) raised against a recombinant peptide (CapCAM) representing the cytoplasmic domain of apCAM. For CapCAM staining, cells were treated either with 0.1% saponin or 1% Triton X-100 before blocking. All primary antibody incubations were for 1 h at RT. Secondary FITC- or TRITC-labeled antibodies were from Jackson Immunoresearch Labs (West Grove, PA) and incubated at 1:100 for 30 min at RT. After washing with PBS, cells were incubated with mounting solution (20 mM n-propyl-gallate in PBS with 80% glycerol, pH 8.5) before fluorescence inspection. Images were acquired using a silicon-intensified target video camera (Hammamatsu Phototonics, Bridgewater, NJ) as described (Forscher and Smith, 1988).
Flow Analysis
To measure retrograde F-actin flow rates, 800 nm Con A–coated beads were placed on growth cones during RBIs using an infrared laser tweezer as described (Lin and Forscher, 1995; Thompson et al., 1996). Flow marker beads were positioned on the peripheral lamella along the bead interaction axis (shortest distance between bead and central domain boundary) and off this axis as a control. Bead centroid positions and central domain extension rates were quantified as described (Forscher et al., 1992; Lin and Forscher, 1993). Growth during interactions was typically assessed by monitoring central domain extension rather than leading edge advance because beads were sometimes the preferred growth substrate, resulting in lamellar movement up the side of beads, which obscured leading edge growth (e.g., see Fig. 2 B). Note that it was previously shown that the central domain boundary and leading edge move forward at about the same velocity subsequent to interactions with cellular targets (Lin and Forscher, 1993, 1995).
Figure 2.
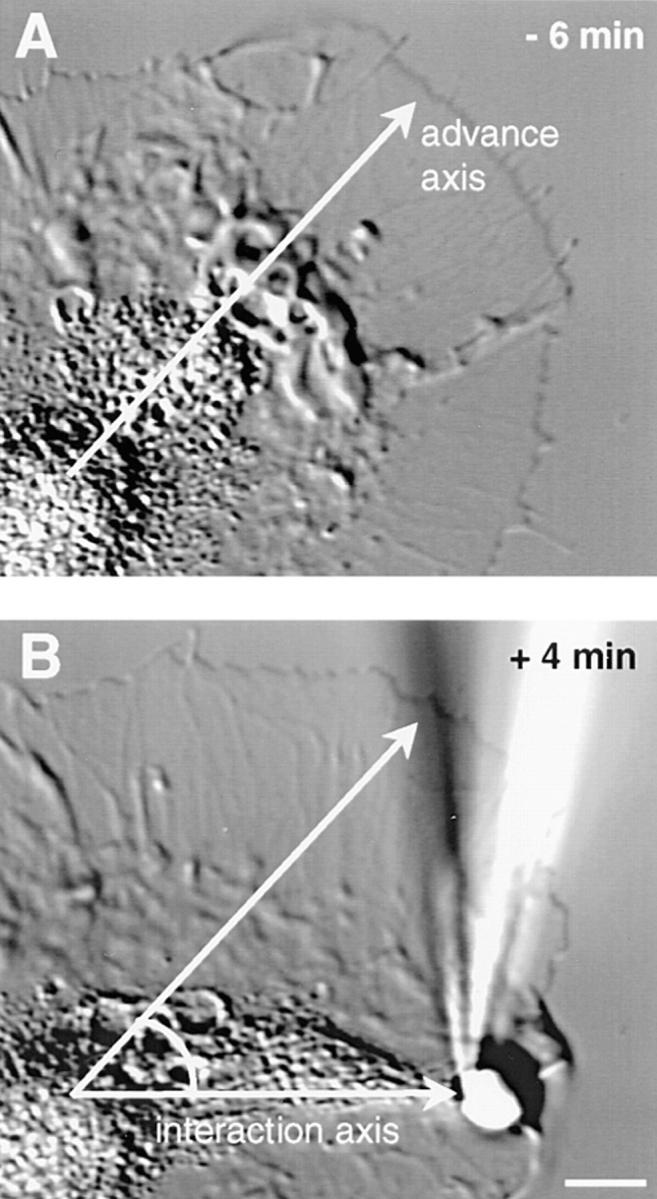
Growth cone– steering response evoked by cross-linking of apCAM. (A) DIC image of a growth cone just before bead placement (6 min before start of C domain extension). Axis of growth cone orientation is indicated. (B) 4 min after strong coupling, the C domain has reoriented toward a bead placed roughly 45° off the advance axis. The newly formed lamellipodium distal to the bead moved up the sides of the bead as the adhesive properties of the poly-lysine substrate were reduced, due to the presence of BSA. Bar, 5 μm.
Results
apCAM Cross-linking Induces Growth Cone Steering and Cytoskeletal Remodeling
To study the effects of CAM–cytoskeleton interactions on growth cone motility and reorientation, we established a novel in vitro assay using large beads (5 μm diameter) coated with specific substrates (Fig. 1). We combined bead technology used in previous studies investigating receptor–actin interactions (Sheetz et al., 1990; Schmidt et al., 1993, 1995; Felsenfeld et al., 1996; Thompson et al., 1996) with a restraining device (microneedle) similar to those used for growth cone–towing experiments (Bray, 1984). A means of bead restraint was deemed appropriate for this study because physiological substrates like cells or cellular processes present themselves as relatively noncompliant target substrates.
Figure 1.


Cross-linking of apCAM triggers C domain extension, protrusive growth, and cytoskeletal remodeling. All images refer to the same growth cone. (A) Beads coated with the anti-apCAM antibody (4E8) were placed on the P domain of an Aplysia bag cell growth cone near the leading edge and restrained from retrograde movement using a microneedle. This video-enhanced DIC image was recorded after the latency period (G) at the start of C-domain extension. The double-headed arrow indicates interaction axis between bead and C domain. (B) After 4 min, the C domain boundary extended to the bead (arrowhead marks initial boundary position). Arrow indicates new leading edge position. (C) Rhodamine phalloidin labeling of F-actin and (D) β-tubulin immunofluorescence after fixation at the 5-min timepoint. Note F-actin accumulation around the bead (C, arrowhead) and typical control staining for actin bundles in adjacent areas (C, arrow). Microtubule extension (D, arrow) was directed toward the bead, visible as a ring (D, arrowhead) as the secondary antibody also binds to protein A and 4E8 on the bead. (E) Pseudocolor overlay of F-actin (red) and tubulin (green) stainings. (F) DIC time course of this interaction. Line indicates needle position at time 0, note rearward displacement over time. (G) C-domain extension rates plotted as a function of time. Bead placement (arrowhead) followed by latency and interaction periods (double-headed arrows) are indicated. Bars, 5 μm.
Aplysia bag cell growth cones have two clearly distinguishable cytoplasmic domains when observed under control conditions: the microtubule- and organelle-rich central (C) domain and the F-actin–rich peripheral (P) domain (Fig. 1 A; see Figs. 7 [C and E] and 9). Overlapping regions between these two domains are referred to as the transition (T) zone (Forscher and Smith, 1988). Beads coated with the monoclonal apCAM antibody 4E8 were positioned onto the P domain near the leading edge as in Fig. 1 A. After placement, anti-apCAM antibody–coated beads rapidly bound to the cell surface and coupled to the underlying retrograde F-actin flow as previously reported (Thompson et al., 1996); however, to mimic immobile cellular substrates, beads were restrained from further centripetal movement with a microneedle. After restraining beads, there was a latency period (average 9.5 ± 1.0 min, n = 22, measured from initial bead–cell contact) during which time no marked change in restraining tension and growth cone structure was observed. Note, however, that removal of the needle restraint during the latency period resulted in immediate rearward bead movement at the rate of retrograde flow (data not shown), suggesting that restrained beads maintained relatively weak interactions with underlying actin filaments during this time.
Figure 7.

Characterization of an antibody against the cytoplasmic domain of apCAM. (A) Western blot analysis. Triton-extracted membrane proteins from Aplysia nervous system tissue were separated by 10% SDS-PAGE and probed with crude rabbit antiserum against the MBP fusion protein of the cytoplasmic domain peptide (CapCAM, left lane), the affinity-purified antibody (middle lane), and 4E8 (right lane). The affinity-purified antibody recognizes two protein species at 130 and 150 kD, which correspond to the two higher molecular weight bands recognized by 4E8. Molecular weight markers (kD), as indicated. (B–E) Immunolocalization of membrane-spanning apCAM. Triton- extracted growth cones were double-stained for membrane-spanning apCAM with the CapCAM antibody (B and D), and F-actin (C) or β-tubulin (E), respectively. Note generally homogeneous distribution of membrane-spanning apCAM and accumulation at the contact site between two growth cones (arrow in D). The white dashed line in E indicates the leading edge of the growth cones. Bar, 5 μm.
Initiation of an RBI was marked by rapid extension of the C domain toward the restrained bead, accompanied by simultaneous leading edge protrusion, anterior to the bead (Fig. 1, B and F). In the example shown, after a 15-min latency period, the C domain began to extend with an average velocity of 3.19 μm/min, reaching the bead ∼4 min after the start of extension (Fig. 1, F and G). The average C domain extension rate for 4E8 beads was 3.19 ± 0.21 μm/ min (n = 22, see Fig. 5 C). C domain extension was also accompanied by a marked increase in tension in the RBI axis, as indicated by a progressive increase needle bending during the interaction period (vertical line, Fig. 1 F). These results confirm that growth cones exert pulling forces, as previously reported (Lamoureux et al., 1989), and show that such forces can be transduced through apCAM or apCAM-associated linkage complex. The timepoint marking C domain extension and tension increase will be referred to as the “strong coupling” point (Fig. 1 G) to differentiate it from the relatively weaker coupling to underlying F-actin observed during the latency period (see Fig. 3). Presence of tension between restrained beads and the C domain during RBIs was confirmed by removing needle restraints during the interaction period (data not shown). When the needle was removed, both the bead and the C domain underwent rapid initial retrograde displacements; C domains snapped back to nearly their pre-interaction positions, and after initial rearward displacements, beads resumed retrograde flow-coupled movement.
Figure 5.

Analysis of RBIs mediated by apCAM antibody, apCAM and Con A–coated beads. (A) RBI probabilities as a function of ligand. (antibodies) Protein A beads coated with anti-apCAM (mAB 4E8), a nonimmune control antibody (mAB RPC5) or no antibody (Prot A). ApCAM beads were tested either in the absence (apCAM) or presence of 4E8 (apCAM/4E8). Lectins: avidin beads coated with biotinylated lectins such as Concanavalin A (Con A), wheat germ agglutinin (WGA), succinyl-wheat germ agglutinin (S-WGA), Sophora japonica agglutinin (SJA) or no lectins (avidin). n indicates the number of experiments. (B) Interaction latencies represent the delay between bead placement and start of C domain extension (strong coupling). (C) C domain extension rates for 4E8, apCAM, and Con A beads. Data represent average values ± SEM.
Figure 3.


Retrograde F-actin flow is attenuated specifically along the interaction axis between C domain and restrained bead. (A) F-actin flow markers (small Con A beads) were positioned with a laser tweezer within the interaction corridor (on-axis box) and on adjacent areas (off-axis box) during an interaction experiment using a 4E8 bead. (B) Cumulative displacement over time of on-axis and off-axis beads and C domain boundary during the latency period. Note that before strong coupling occurs, retrograde F-actin flow rates in the interaction axis are equal to off-axis rates. Inset depicts F-actin mark movements and relative bead-restraining force during the latency period shown. (C, top) DIC image sequence of off-axis bead movement (solid line) in area of interest indicated in A. (Bottom) Concurrent time sequence showing on-axis bead movement (solid line) and C-domain extension (dashed line; growth rate = 3.20 μm/min). Note progressive attenuation of F-actin marker bead movement. (D) Displacement over time of on-axis, off-axis beads, and C domain boundary during interaction period. Inset depicts F-actin mark movements and relative increase in bead- restraining force during interaction period. Bar, 5 μm.
The growth cone shown in Fig. 1 was fixed at the 5-min timepoint and stained for F-actin and tubulin. A ring-like accumulation of F-actin was found around the bead (Fig. 1 C, arrowhead). In contrast, areas of the P domain adjacent to the interaction axis exhibited radial bundles of F-actin typical of control growth cones (Fig. 1 C, arrow; see Fig. 7 C). Note that the corridor along the interaction axis was completely depleted of F-actin (Fig. 1 C), having been replaced by microtubules that had extended to the bead (Fig. 1, D and E). The microtubules near the interaction site were highly oriented toward the bead, whereas relatively few microtubules crossed the central–peripheral domain boundary in areas adjacent to the interaction axis (Fig. 1 E). Thus, C domain extension observed in DIC during RBIs appears to faithfully represent underlying microtubule extension. Taken together, the increased rates of C domain extension and leading edge protrusion, the underlying cytoskeletal reorganization (actin accumulation at the interaction site and microtubule extension toward the bead) and tension between the growth cone and the bead (i.e., target) substrate, all mimic changes previously reported for growth cone interactions with native cellular targets (Lin and Forscher, 1993).
To test if anti-apCAM–coated beads were able to cause growth cone steering, beads were placed roughly 45° off of the original growth axis (Fig. 2). Such experimental conditions resulted in reorientation of the C domain toward the bead as well as leading edge protrusion, demonstrating that bead-mediated clustering of apCAM can induce growth in a preoriented direction as well as growth cone turning.
During The Latency Period Retrograde F-Actin Flow Is Not Affected
Next we tested whether the inverse relationship between rates of C domain extension and retrograde F-actin flow reported previously for growth cone interactions with cellular targets (Lin and Forscher, 1995) would hold true with a defined molecular substrate. To achieve this end, we used an infrared laser trap to place small Con A–coated marker beads on the growth cone surface to measure F-actin flux rates during the latency and interaction periods (Lin and Forscher, 1995). Marker beads were positioned along the interaction axis (between the C domain and restrained bead) and also in adjacent areas (Fig. 3 A), enabling us to make concurrent measurements of actin filament movements in both on- and off-axis domains. During the latency period, (i.e., before strong coupling occurred) on-axis rates of F-actin flow were not different from off-axis flow rates (Fig. 3 B; 5.11 μm/min for on-axis bead; 5.05 μm/min for off-axis bead) and C domain extension did not occur. The continuous presence of retrograde F-actin flow at control rates in the RBI axis as well as relatively weak forces needed to restrain beads during the latency period (i.e., absence of needle bending) strongly suggest that the target beads were only weakly coupled to underlying F-actin networks during the latency period and that some slippage is occurring in the apCAM–cytoskeletal linkage during this time (Fig. 3 B, inset).
During the Interaction Period Retrograde F-Actin Flow Is Attenuated in the RBI Axis
During the interaction period, off-axis marker beads placed lateral to 4E8-coated beads continued to exhibit retrograde movement indistinguishable from control flow rates (Fig. 3 C, top, and D; 4.92 μm/min for the bead shown versus 4.94 ± 0.18 μm/min for controls [average ± SEM, n = 24]). In marked contrast, retrograde movement of on-axis marker beads observed simultaneously were attenuated by 70% (n = 10) during periods of C domain extension (Fig. 3 C, bottom, and D; 85% attenuation in the experiment shown). Note that as the interaction shown in Fig. 3, C and D begins (time 0–20 s), the on-axis bead first slows and then stops completely by the 40-s time point. The C domain extension rate in this experiment was 3.20 μm/min. When on-axis bead movements were compared with C domain extension rates for independent experiments, an inverse correlation between rates of retrograde flow and C domain extension was observed similar to that reported for growth cone interactions with cellular targets (Lin and Forscher, 1995; data not shown). These experiments suggest that during RBIs, a mechanical connection is established between restrained bead substrates and actin networks in the P domain. Progressive strengthening of this mechanical linkage supports a buildup of tension in the RBI axis (as indicated by increased needle bending, Fig. 1) and attenuation of retrograde F-actin flow (Fig. 3 D, inset). These effects are accompanied by increased rates of C domain and leading edge advance.
Native apCAM and Con A–Bead Substrates Support RBIs
To test if RBIs could be induced with the presumptive ligand of apCAM, namely apCAM itself, we purified the protein from an Aplysia central nervous system membrane extract using 4E8-affinity chromatography. Fig. 4 demonstrates that our isolated apCAM was pure and contained the full complement of reported apCAM polypeptides as assessed by silver staining and Western blot analysis. A major band at 100 kD and two weaker bands of 130 and 150 kD, respectively, are recognized by the monoclonal antibody 4E8 in agreement with previous findings (Keller and Schacher, 1990). Purified apCAM was then covalently coupled to silica beads and tested for RBI competence.
Figure 4.
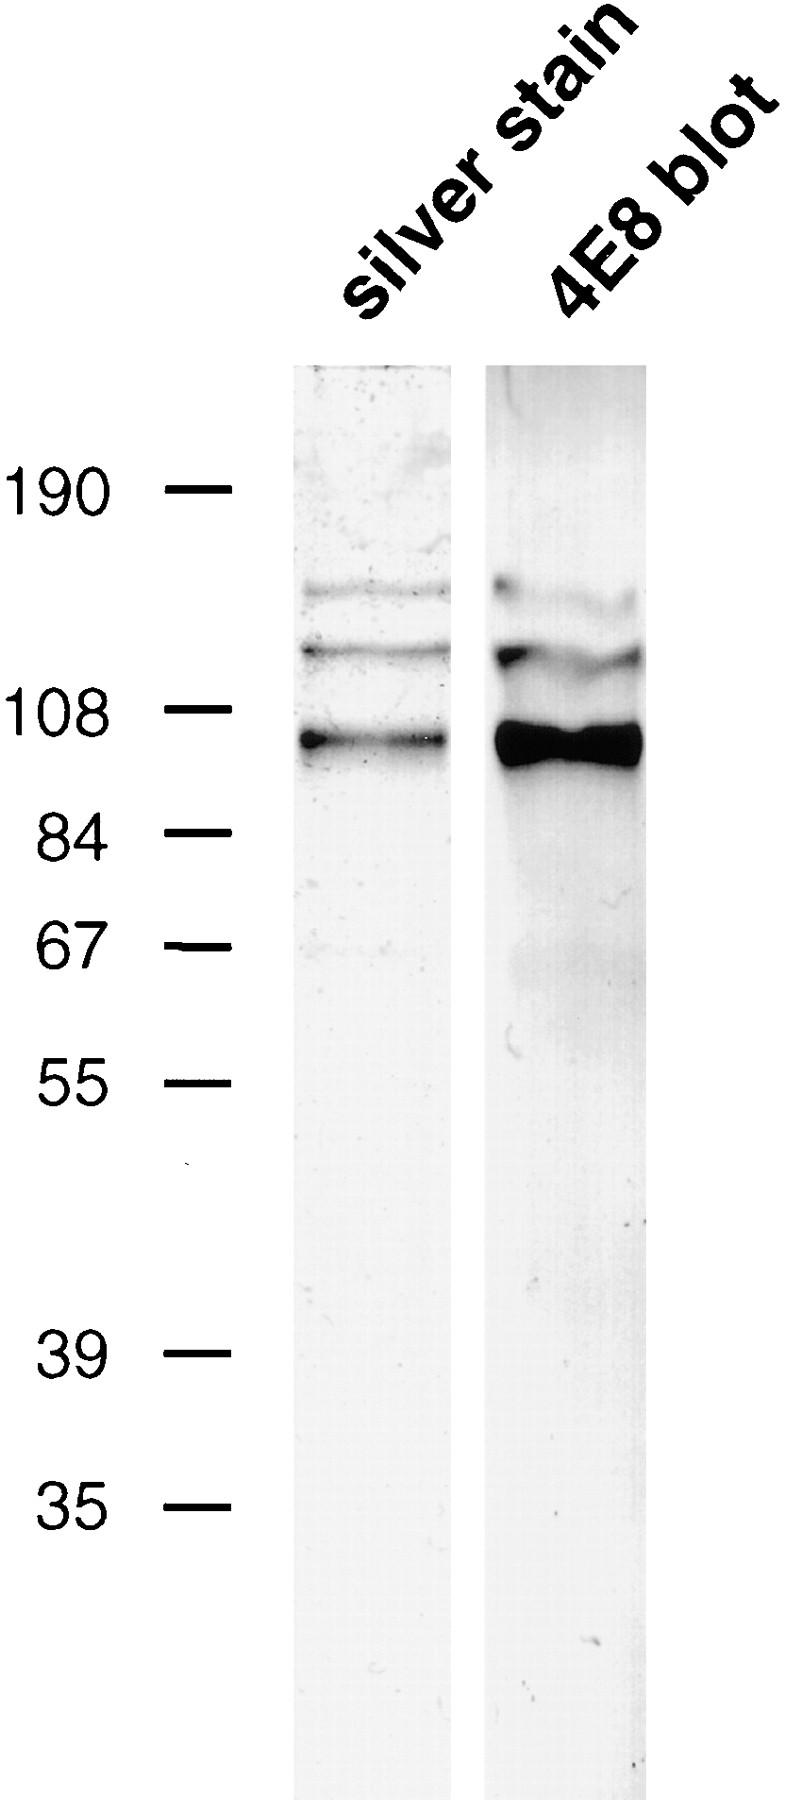
SDS-PAGE analysis of purified apCAM. Affinity-purified apCAM (0.2 μg per lane) was analyzed by 7.5% SDS-PAGE and processed for silver staining (left lane) and Western blotting using the 4E8 antibody (right lane). No contaminants were detected by silver staining. All three bands (major band at 100 kD, two minor bands at 130 and 150 kD) are 4E8 positive as reported (Keller and Schacher, 1990). Molecular weight markers (kD) as indicated.
Beads coated with native apCAM bound to the growth cone membrane, coupled to retrograde F-actin flow and induced RBIs with a probability of 68% (Fig. 5 A; 13 interactions in 19 experiments). Interestingly, we noted that apCAM beads often induced membrane ruffles around the bead contact site and frequently (64%) exhibited active motility independent of retrograde flow. This motility has been shown to be driven by de novo actin assembly and is characterized by formation of F-actin tail-like structures behind the bead referred to as “inductopodia” (Forscher et al., 1992; Thompson et al., 1996). Similar results were observed with 4E8-coated beads (Fig. 6). As a control for apCAM specificity, we analyzed apCAM-coupled bead behavior in the continuous presence of free 4E8 antibody (Fig. 5 A, apCAM/4E8; see Materials and Methods). Under these conditions, apCAM beads were only weakly adherent, never caused RBIs, and exhibited flow-coupled behavior only after long restraining periods (∼15 min). 4E8-coated beads had an interaction probability of 88% (22 interactions in 25 experiments), whereas in control experiments protein A beads or beads coated with a nonimmune antibody (RPC5; same IgG subclass as 4E8, IgG2a) exhibited low affinity for the growth cone surface, did not exhibit F-actin flow coupling, and never induced RBIs (Fig. 5 A).
To investigate the scope of the RBI response, we screened a panel of lectins with known Aplysia central nervous system membrane protein-binding characteristics (Thompson et al., 1996) for their ability to evoke RBIs. Of the lectins tested, only Con A was found to promote RBIs (84%, 26 interactions in 31 experiments; Fig. 5 A). Interestingly, Con A beads also precipitate apCAM from membrane extracts (Thompson et al., 1996) suggesting that Con A bead interactions are mediated at least in part by clustering of apCAM. Con A bead-mediated RBIs appeared to be specific since they were competitively inhibited by the presence of the Con A–binding sugar α-manno-pyranoside (data not shown). Note that flow coupling alone was not sufficient to elicit RBIs, as succinyl-wheat germ agglutinin beads coupled to F-actin flow, but did not evoke RBIs. In addition, wheat germ agglutinin did not support interactions, yet this lectin binds a large number of Aplysia membrane proteins (Thompson et al., 1996), suggesting that nonspecific cross-linking of multiple cell surface proteins is also not sufficient to trigger an RBI. Weakly adherent lectins such as Sophora japonica agglutinin never induced interactions. Finally, avidin control beads, not incubated with biotinylated lectins, did not adhere to the growth cone membrane and therefore did not evoke any interactions.
To further compare the characteristics of the ligands tested, interaction latencies were assessed. Con A beads induced RBIs with significantly (P < 0.001; t test) shorter latency (4.9 ± 0.4 min) than beads coated with either 4E8 (9.5 ± 1.0 min) or apCAM (12.0 ± 1.6 min; Fig. 5 B). In contrast, average C domain extension rates were not significantly different (4E8, 3.19 ± 0.21 μm/min; apCAM, 3.29 ± 0.29 μm/min; Con A, 3.69 ± 0.32 μm/min; P > 0.1) among the ligands tested (Fig. 5 C). This suggests a common mechanism of C domain (i.e., microtubule) extension may be shared among these three apCAM-related ligands capable of eliciting RBIs. To summarize, RBIs could be evoked not only by antibody-mediated cross-linking of apCAM, but also by using purified apCAM or Con A as a ligand on the beads.
Anterograde Inductopodium Movement May Increase Interaction Latency
We hypothesized that the longer interaction latencies typical of 4E8 and apCAM beads might be related to inductopodia formation, as anterograde bead movements would tend to null effects of retrograde flow coupling. In support of this assumption, we found that Con A beads that never trigger inductopodia formation, but flow couple effectively (this work; Thompson et al., 1996) had significantly shorter interaction latencies than either 4E8 or apCAM beads (Fig. 5 B). To test if inductopodia movements had any orientation preference under our experimental conditions, 4E8 beads were restrained for various amounts of time and, after removal of the restraining needle, inductopodia-driven bead movements were analyzed (Fig. 6).
Fig. 6, A and B shows a representative experiment where a 4E8 bead started its movement with an anterograde orientation after 2 min of restraint. First, we analyzed inductopodia probability as a function of restraining time. The highest probability for inductopodia activity was found when 4E8 beads were restrained for 5 min (50%, n = 28), whereas, without restraint, only 5% (n = 20) of the beads tested formed an inductopodium (Fig. 6 D). When beads were restrained for 10 min, the probability was 31% (n = 13). Thus, there is a considerable chance of inductopodia activity during the observed latency periods for 4E8 and apCAM beads in RBIs (∼10–12 min; Fig. 5 B) and interestingly, restraint appears to increase inductopodia probability. We then grouped all inductopodia according to their initial angular orientation (α, Fig. 6 C) into four categories (Fig. 6 E). Interestingly, 69% of inductopodia analyzed (n = 35) had an initial anterograde component to their movement (i.e., α >90°, Fig. 6 E). Taken together, the preferential anterograde orientation of antibody- mediated inductopodia (as well as of apCAM-mediated inductopodia; data not shown) could account for the longer interaction latencies (∼10–12 min) observed relative to Con A beads (∼5 min).
Membrane-spanning apCAM Is Concentrated at Con A Interaction Sites
apCAM is reported to have two GPI-linked and one membrane-spanning isoform with a cytoplasmic tail (Mayford et al., 1992). To test for involvement of the membrane-spanning isoform of apCAM in RBIs mediated by Con A, an antibody against a recombinant peptide corresponding to the complete cytoplasmic tail of apCAM (CapCAM) was raised (see Materials and Methods). Characterization of the resulting polyclonal antibody by Western blot is shown in Fig. 7 A. After affinity purification of the antiserum (see Materials and Methods), the cytoplasmic tail antibody recognized only two protein species at 130 and 150 kD. These higher molecular weight species are also detected by 4E8 (Fig. 7 A), which recognizes an extracellular apCAM epitope (Keller and Schacher, 1990). Our findings unambiguously identify the two higher molecular weight species as being membrane spanning and are consistent with previous reports suggesting that these bands represent posttranslational modifications of the membrane-spanning apCAM isoform. The 100-kD band recognized only by 4E8 corresponds to the two GPI-linked isoforms that differ only slightly in electrophoretic mobility (Keller and Schacher, 1990; Mayford et al., 1992). Immunofluorescence staining with the affinity-purified antibody revealed that membrane-spanning apCAM isoform has a relatively homogeneous distribution on growth cone membranes (Fig. 7 B), except in regions of growth cone overlap where it accumulates as previously reported for total apCAM (Thompson et al., 1996; Fig. 7 D, arrow). Under conditions where apCAM is unbound and presumably not clustered, membrane-spanning apCAM did not colocalize with either F-actin (Fig. 7 C) or microtubules (Fig. 7 E) in growth cones.
Involvement of membrane-spanning apCAM in Con A bead-mediated interactions was further examined with immunofluorescence staining (Fig. 8). In the experiment shown in Fig. 8, the C domain reached the Con A bead ∼4 min after positioning the bead (Fig. 8, A and B). The growth cone was immediately fixed, extracted with saponin, and stained for total apCAM with 4E8 (Fig. 8 C) and membrane-spanning apCAM with the cytoplasmic tail antibody (Fig. 8 D). Outside the interaction site, both antibodies exhibited a homogeneous-staining pattern. The membrane-spanning apCAM–labeling pattern resembles that of total apCAM, appearing concentrated near the bead-binding site with a high degree of colocalization. These results suggest that Con A interactions are mediated at least in part by apCAM and are consistent with a role for the cytoplasmic domain of apCAM in cytoskeletal coupling. Further experiments are in progress addressing the respective functions of GPI-linked and membrane-spanning apCAM isoforms in RBI responses.
Figure 8.

Membrane-spanning apCAM accumulates at Con A bead interaction sites. (A) Start of C domain extension during an interaction with a Con A–coated bead. (B) 4 min later, the C domain (open arrow) extends toward bead. (C) Total apCAM immunofluorescence visualized with 4E8. (D) Membrane-spanning apCAM isoform immunofluorescence visualized with the affinity-purified antibody against the cytoplasmic domain of apCAM. Note the accumulation of membrane-spanning apCAM around the bead interaction site. Bar, 5 μm.
Discussion
The main goal of this work was to test if a specific CAM could affect growth cone motility and structure by regulation of cytoskeletal dynamics. We present evidence that in the presence of an external bead-restraining force, cross-linking of the Ig superfamily molecule apCAM with a bead substrate is sufficient to mediate growth cone protrusion and cytoskeletal rearrangements, similar to those observed during steering in response to cellular targets (Lin and Forscher, 1993). Importantly, we found that C domain extension was accompanied by attenuation of retrograde F-actin flow and increased tension in the RBI axis. These results strongly suggest that a mechanical continuum forms between the bead substrate, cell surface receptors, and P and C domain during RBIs. Possible mechanisms for these effects are considered below.
Retrograde F-Actin Flow, Pulling Force and Growth Cone Motility
Previous work has shown that growth cones exert pulling forces and tend to advance in response to applied tension (Bray, 1984; Lamoureux et al., 1989); however, details of how these presumably actomyosin-based forces are transduced at the membrane interface to promote growth and steering are unclear. In this study, our aim was to investigate the relationship between specific cell surface receptors, retrograde F-actin flow, and application of force in growth cones. Our basic strategy was to use ligand-coated beads as artificial growth cone interaction substrates, and observe effects on cytoskeletal structure and motility in response to experimental application of bead-restraining forces. Ligand-coated beads have been used successfully in a variety of previous studies addressing membrane protein movements and receptor–cytoskeletal interactions in growth cones and fibroblasts (Kucik et al., 1989; Forscher and Smith, 1990; Sheetz et al., 1990; Schmidt et al., 1993; Kuhn et al., 1995; Schmidt et al., 1995; Felsenfeld et al., 1996; Thompson et al., 1996) and to monitor actin filament dynamics (Forscher et al., 1992; Lin and Forscher, 1993, 1995).
In our previous studies, restraining forces were not used, i.e., beads were fully compliant and allowed to move freely on the growth cone surface. In vivo, however, growth cones interact with other cells or the extracellular matrix—both of which represent relatively noncompliant substrates. Therefore, in an effort to mimic such noncompliant substrates, beads were forcibly restrained (from retrograde movement) in the present study. In a recent related report, application of relatively weak restraining forces (∼10–50 pN) by infrared laser trapping were found to actually strengthen the linkage between fibronectin-coated beads, integrins, and the cytoskeleton of fibroblasts (Choquet et al., 1997); however, forces generated by conventional laser trapping are not strong enough to fully resist retrograde flow. Because our aim here was to examine the effects of fully resisting retrograde flow, microneedles capable of applying greater force (>1 nN; Dennerll et al., 1989) were used as bead-restraining devices. Only under conditions where flow was restrained were protrusive growth and C domain extension observed. Development of tension appears to be directly correlated with rates of growth cone advance (Dennerll et al., 1989), and although we did not directly measure tensioning forces in this study, there is clear physical evidence of tension development in the RBI axis over time (needle bending, Fig. 1 F). We also found that when needle restraints were withdrawn during periods of active extension, the C domain of the growth cone snapped rapidly back to the preinteraction position (not shown), strongly suggesting relaxation of tension in the RBI axis, and beads resumed retrograde movement. Given recent evidence that retrograde F-actin flow in growth cones is driven by myosin motors (Lin et al., 1996), an interesting area for future research will be investigation of the molecular details of the actomyosin contractile machinery, responsible for generating tension during RBIs, and how motor activity may affect microtubule advance (Fig. 9 A).
A Substrate–Cytoskeletal Coupling Model
We will consider our results in the context of a substrate– cytoskeletal coupling model (Fig. 9; Mitchison and Kirschner, 1988; Lin et al., 1994; Lin and Forscher, 1995; Felsenfeld et al., 1996; Mitchison and Cramer, 1996). According to this model, cells and growth cones can move forward only if they are capable of coupling intracellular actomyosin-based motility to a fixed (noncompliant) extracellular translocation substrate. If such a substrate is not available, myosin motors will drive retrograde flow, but the resulting F-actin flux does not contribute to forward movement. To discuss the predictions of this model, we will make the simplifying assumption that the defined cytoplasmic domains of the growth cone (P and C domains, as well as T zone) behave as functional units (Fig. 9).
In a previous study we demonstrated that unrestrained Con A–coated beads faithfully couple to the underlying retrograde F-actin flow and can be used as noninvasive markers for assessing F-actin flow rates in this system (Lin and Forscher, 1995). Here, we found that during the latency period, F-actin flow rates either on or off of the RBI axis were equal (Figs. 3 and 9 A, flow marker 1). During the latency period, we found no evidence of tension development in the RBI axis and the C domain always remained stationary (Fig. 9 A). Later, during the interaction period (Fig. 9 B, flow marker 2), we observed slowing of retrograde flow in the RBI axis concomitant with C-domain advance and increased tension between the restrained bead and the growth cone. These results suggest that, during the course of an RBI, a mechanical continuum is established between the bead substrate and the C domain. This mechanical linkage allows contractile forces in the growth cone to be applied to extracellular substrates. If the substrate is compliant, like an unrestrained bead, it is simply pulled toward the C domain; conversely, if the substrate is noncompliant, tension builds in this linkage and the C domain will tend to be pulled forward (Fig. 9 B).
Although our results suggest that tensioning of the C domain occurs during RBIs, the molecular details of tension generation between C and P domains remain to be elucidated. For example, it is not yet clear if tension is applied directly to microtubules in the C domain, for example, by a microtubule-associated myosin (Fig. 9 A, left inset, c) or, alternatively, to some closely associated structural element. In terms of the role of myosin in tension generation, compelling evidence now suggests that actomyosin contractility localized to the T zone may provide the motive force for both retrograde flow and cell translocation. Specifically, Svitkina et al. have presented compelling evidence that contraction of F-actin–myosin II networks in the T zone are involved in fish keratocyte translocation, as well as retrograde F-actin flow, which occurs in tethered cells (Svitkina et al., 1997; as in Fig. 9 A, left inset, a). In addition to our previous finding that a myosin-like motor drives retrograde flow in growth cones (Lin et al., 1996), we have indirect evidence suggesting the T zone is contractile in growth cones. In particular, we found that when F-actin marker beads are sequentially placed parallel to the axis of retrograde flow, the interbead spacing remains constant as they translocate through the P domain. In contrast, when beads reach the T zone, interbead spacing decreases (Forscher, P., unpublished observations). Because these beads are coupled to underlying F-actin networks (Lin and Forscher, 1995), these observations are consistent with T-zone contraction leading to the decreased bead spacing. Localization studies in vertebrate growth cones suggest that conventional myosin II, as well as unconventional myosins I and V, may be involved in these processes (for review see Hasson and Mooseker, 1997). Clearly, more work needs to be done to rigorously test the T-zone contraction hypothesis as well as to identify the actual myosin subtype(s) involved (Fig. 9 A, inset).
An alternative mechanism that may contribute to C domain extension stems directly from the known properties of actin dynamics in growth cones. Assuming that the actin-recycling rate remains unchanged during an RBI, when retrograde flow is attenuated, the actin-recycling zone would move forward potentially clearing F-actin away from distal microtubule ends (Fig. 9 B). This mechanism could relieve restraints on microtubule advance normally imposed by or associated with retrograde F-actin flow. In support, depletion of peripheral F-actin after cytochalasin treatments results in microtubule extension into distal F-actin free zones in Aplysia growth cones (Forscher and Smith, 1988). Furthermore, recent observations of microtubule dynamics in migrating newt lung cells suggest that retrograde F-actin flow inhibits microtubule growth mediated by treadmilling and/or sliding (Waterman-Storer and Salmon, 1997). In summary, for each of the mechanisms discussed above, our data demonstrate a correlation between flow attenuation and C domain extension.
True neurite growth involves simultaneous extension of both C and P domains. If the rate of leading edge actin assembly does not decrease during an RBI, protrusive growth distal to the F-actin attenuation zone (Fig. 9 B) should occur simply as a result of flow attenuation. This is exactly what we observed experimentally (Fig. 1). For technical reasons, F-actin assembly distal to the bead could not always be visualized by rhodamine–phalloidin staining to the extent observed in DIC images (Fig. 1, C and F). This was due to the presence of BSA in the experimental medium as a blocking agent (see Materials and Methods). In BSA, the adhesive properties of the underlying poly-lysine substrate were reduced such that newly formed lamellipodia distal to beads were less well attached than adjacent areas and sometimes retracted during fixation (Fig. 8).
Actin assembly associated with RBIs may also be augmented by apCAM clustering. We recently presented evidence that apCAM behaves differentially with respect to the actin cytoskeleton depending on its binding state (Thompson et al., 1996). We reported that beads with a relatively low density of apCAM-binding sites become F-actin flow coupled when placed on the growth cone surface; in contrast, beads with higher cross-linking capacity triggered de novo actin assembly near bead-binding sites, resulting in the formation of inductopodia (Fig. 6; Forscher et al., 1992; Thompson et al., 1996). In this study, when 4E8-coated beads were restrained for 2–5 min and tested for inductopodia formation, we observed this type of bead movement about 45% of the time. Any anterograde bead movement associated with inductopodia could null tensioning effects resulting from retrograde flow coupling and might account for the longer interaction latencies observed using 4E8 and apCAM beads compared to Con A beads. In support of this, we found that irrespective of restraining time, 69% of all inductopodia initially moved in an anterograde direction (Fig. 6); whereas, later in time they moved randomly as previously reported (Forscher et al., 1992). Note, however, that the interaction latencies observed with apCAM specific ligands (Fig. 5 B) are in a similar time range (∼10 min) to those observed during homophilic growth cone interactions (Lin and Forscher, 1993).
apCAM May Function Like A Molecular Clutch
Although specific effector proteins remain to be characterized, our results suggest the molecular interface between apCAM and the actin cytoskeleton may serve as a variable force transducer situated between extracellular substrates and the intracellular actomyosin contractile machinery. In essence, apCAM may function much like a molecular clutch engaged by substrate-dependent clustering. Several lines of evidence now support this idea.
First, we found that attenuation of F-actin flow and build-up of tension in the RBI axis occurred only after a latency period (Fig. 3 D), suggesting that it takes some time for a significant apCAM cytoskeletal linkage to form. It is important to note that apCAM beads are attached to the membrane during the latency period, but only weakly coupled to underlying F-actin networks, evidenced by the fact that retrograde flow continues unabated in the RBI axis during this time and there is little tension build-up despite bead restraint (Figs. 3 B and 9 A). Note that if the restraint is removed during the latency period, beads move again with retrograde flow, indicating some degree of actin linkage; however, this linkage does not appear to be of sufficient strength to promote tension build-up or affect flow rates. These observations lead to the conclusion that there must be “slippage” in the initial apCAM-actin linkages during the latency period (Fig. 9 A, “clutch” slippage). We hypothesize that over time the number of apCAM-actin linkages progressively increases until the clutch complex is strong enough to support tension sufficient to attenuate flow (Fig. 9 B, linkage strengthening). At some point, strengthening of the apCAM-actin linkage reaches a maximum (Fig. 9 B, clutch engaged) and tension between the C and P domains peaks, promoting maximal rates of C domain advance. In support of this concept, it was recently demonstrated that strengthening of integrin–cytoskeleton linkages depends both on restraining time and force (Choquet et al., 1997).
Second, we found that only substrates capable of efficiently coupling to the actin cytoskeleton were able to induce C domain extension. In our system, these include only apCAM-binding ligands so far; it will clearly be of interest to see if other CAMs exhibit similar properties. Other bead substrates we have examined, such as succinyl-wheat germ agglutinin appear to interact with the actin cytoskeleton in that they undergo retrograde flow, but the strength of their F-actin linkage does not appear to be strong enough to generate significant tension in the RBI axis nor induce C domain extension.
The molecular details of interactions between Ig CAMs and the actin cytoskeleton are not yet well characterized. Biochemical studies have implicated spectrin and ankyrin as possible actin-linkage molecules for NCAM and CAMs of the L1 family, respectively (Pollerberg et al., 1987; Davis and Bennett, 1994; Garver et al., 1997). With respect to apCAM, one of the most interesting questions relates to components of the putative complex that appears to form as a result of substrate-dependent apCAM clustering. apCAM is reported to have one membrane-spanning and two GPI-linked isoforms (Mayford et al., 1992), and it will be important to investigate roles for the GPI-linked versus membrane-spanning isoforms in apCAM-mediated effects. To initially address the function of the membrane-spanning apCAM isoform in RBIs, we raised an antibody against a recombinant peptide corresponding to the cytoplasmic domain of apCAM. Our immunolocalization results with this antibody strongly suggest that membrane-spanning apCAM is involved in RBIs (Fig. 8). Whether the cytoplasmic tail of apCAM associates with the actin cytoskeleton directly, via one or more actin linker molecule(s) (Fig. 9 B, inset) as well as the potential role of signaling cascades in regulating apCAM–actin interactions remains to be determined.
A general theme seems to be emerging from work on adhesion proteins of different structural families: cell adhesion receptors regulated by a variety of signal transduction systems may function as variable force transducers between motile cytoskeletal networks and extracellular substrates (Suter and Forscher, 1998). Of course, this generalization may not hold true in all cases, especially given the wide spectrum of CAMs. In conclusion, apCAM appears to have at least two well documented functions with respect to the actin cytoskeleton in growth cones: (a) Association with retrograde F-actin flow, providing a mechanism for application of tension to substrates, which may in turn promote C domain extension and leading edge protrusion; and (b) nucleation of F-actin assembly local to interaction sites providing an additional basis for protrusive growth.
Acknowledgments
The authors thank Kelsey Martin, Eric Kandel, and Samuel Schacher for providing 4E8 antibody and 4E8 hybridoma cells; James Schwartz and David Solomon for providing the Aplysia λ-ZAP cDNA library; and Haig Keshishian, Mark Mooseker, and Joseph Wolenski for helpful discussions and comments on the manuscript.
This work was supported by a National Institutes of Health grant RO1-NS28695 to P. Forscher and postdoctoral fellowships from the Swiss National Science Foundation and Roche Research Foundation to D.M. Suter.
Abbreviations used in this paper
- C
central
- CAM
cell adhesion molecule
- DIC
differential interference contrast
- GST
glutathione-S-transferase
- MBP
maltose-binding protein
- P
peripheral
- RBI
restrained bead interaction
- RT
room temperature
- T
transition
Footnotes
Address all correspondence to Paul Forscher, Department of Molecular, Cellular, and Developmental Biology, Yale University, P.O. Box 208103, New Haven, CT 06520-8103. Tel.: (203) 432-6344. Fax: (203) 432-8999. E-mail: paul.forscher@yale.edu
References
- Bailey CH, Chen M, Keller F, Kandel ER. Serotonin-mediated endocytosis of apCAM: an early step of learning-related synaptic growth in Aplysia. Science. 1992;256:645–649. doi: 10.1126/science.1585177. [DOI] [PubMed] [Google Scholar]
- Bailey CH, Kaang B, Chen M, Martin KC, Lin C, Casadio A, Kandel ER. Mutation in the phosphorylation sites of MAP kinase blocks learning related internalization of apCAM in Aplysia sensory neurons. Neuron. 1997;18:913–924. doi: 10.1016/s0896-6273(00)80331-1. [DOI] [PubMed] [Google Scholar]
- Bentley D, Toroian-Raymond A. Disoriented pathfinding by pioneer neuron growth cone deprived of filopodia by cytochalasin treatment. Nature. 1986;323:712–715. doi: 10.1038/323712a0. [DOI] [PubMed] [Google Scholar]
- Bray D. Axonal growth in response to experimentally applied mechanical tension. Dev Biol. 1984;102:379–389. doi: 10.1016/0012-1606(84)90202-1. [DOI] [PubMed] [Google Scholar]
- Bray D, Chapman K. Analysis of microspike movements on the neuronal growth cone. J Neurosci. 1985;5:3204–3213. doi: 10.1523/JNEUROSCI.05-12-03204.1985. [DOI] [PMC free article] [PubMed] [Google Scholar]
- Bruemmendorf T, Rathjen FG. Cell adhesion molecules 1: immunoglobulin superfamily. Protein Profile. 1994;1:951–1058. [PubMed] [Google Scholar]
- Challacombe JF, Snow DM, Letourneau PC. Actin filament bundles are required for microtubule reorientation during growth cone turning to avoid an inhibitory guidance cue. J Cell Sci. 1996;109:2031–2040. doi: 10.1242/jcs.109.8.2031. [DOI] [PubMed] [Google Scholar]
- Challacombe JF, Snow DM, Letourneau PC. Dynamic microtubule ends are required for growth cone turning to avoid an inhibitory guidance cue. J Neurosci. 1997;17:3085–3095. doi: 10.1523/JNEUROSCI.17-09-03085.1997. [DOI] [PMC free article] [PubMed] [Google Scholar]
- Chien CB, Rosenthal DE, Harris WA, Holt CE. Navigational errors made by growth cones without filopodia in the embryonic Xenopus brain. Neuron. 1993;11:237–251. doi: 10.1016/0896-6273(93)90181-p. [DOI] [PubMed] [Google Scholar]
- Choquet D, Felsenfeld DP, Sheetz MP. Extracellular matrix rigidity causes strengthening of integrin-cytoskeleton linkages. Cell. 1997;88:39–48. doi: 10.1016/s0092-8674(00)81856-5. [DOI] [PubMed] [Google Scholar]
- Cunningham BA, Hemperly JJ, Murray BA, Prediger EA, Brackenbury R, Edelman GM. Neural cell adhesion molecule: structure, immunoglobulin-like domains, cell surface modulation, and alternative RNA splicing. Science. 1987;236:799–806. doi: 10.1126/science.3576199. [DOI] [PubMed] [Google Scholar]
- Davenport RW, Dou P, Rehder V, Kater SB. A sensory role for neuronal growth cone filopodia. Nature. 1993;361:721–723. doi: 10.1038/361721a0. [DOI] [PubMed] [Google Scholar]
- Davis JQ, Bennett V. Ankyrin binding activity shared by the neurofascin/L1/NrCAM family of nervous system cell adhesion molecules. J Biol Chem. 1994;269:27163–27166. [PubMed] [Google Scholar]
- Dennerll TJ, Lamoureux P, Buxbaum RE, Heidemann SR. The cytomechanics of axonal elongation and retraction. J Cell Biol. 1989;109:3073–3083. doi: 10.1083/jcb.109.6.3073. [DOI] [PMC free article] [PubMed] [Google Scholar]
- Doherty P, Walsh FS. Signal transduction events underlying neurite outgrowth stimulated by cell adhesion molecules. Curr Opin Neurobiol. 1994;4:49–55. doi: 10.1016/0959-4388(94)90031-0. [DOI] [PubMed] [Google Scholar]
- Doherty P, Walsh FS. CAM-FGF receptor interactions: a model for axonal growth. Mol Cell Neurosci. 1996;8:99–111. doi: 10.1006/mcne.1996.0049. [DOI] [PubMed] [Google Scholar]
- Felsenfeld DP, Choquet D, Sheetz MP. Ligand binding regulates the directed movement of beta1 integrins on fibroblasts. Nature. 1996;383:438–440. doi: 10.1038/383438a0. [DOI] [PubMed] [Google Scholar]
- Forscher P, Smith SJ. Actions of cytochalasins on the organization of actin filaments and microtubules in a neuronal growth cone. J Cell Biol. 1988;107:1505–1516. doi: 10.1083/jcb.107.4.1505. [DOI] [PMC free article] [PubMed] [Google Scholar]
- Forscher, P., and S.J. Smith. 1990. Cytoplasmic actin filaments move particles on the surface of a neuronal growth cone. In Optical Microscopy for Biology. Wiley Liss, Inc., New York. 459–471.
- Forscher P, Lin C-H, Thompson C. Novel form of growth cone motility involving site-directed actin filament assembly. Nature. 1992;357:515–518. doi: 10.1038/357515a0. [DOI] [PubMed] [Google Scholar]
- Garver TD, Ren Q, Tuvia S, Bennett V. Tyrosine phosphorylation at a site highly conserved in the L1 family of cell adhesion molecules abolishes ankyrin binding and increases lateral mobility of neurofascin. J Cell Biol. 1997;137:703–714. doi: 10.1083/jcb.137.3.703. [DOI] [PMC free article] [PubMed] [Google Scholar]
- Goldberg DJ, Burmeister DW. Stages in axon formation: observations of growth of Aplysia axons in culture using video-enhanced contrast-differential interference contrast microscopy. J Cell Biol. 1986;103:1921–1931. doi: 10.1083/jcb.103.5.1921. [DOI] [PMC free article] [PubMed] [Google Scholar]
- Goodman CS. Mechanisms and molecules that control growth cone guidance. Ann Rev Neurosci. 1996;19:341–377. doi: 10.1146/annurev.ne.19.030196.002013. [DOI] [PubMed] [Google Scholar]
- Hasson T, Mooseker M. The growing family of myosin motors and their role in neurons and sensory cells. Curr Opin Neurobiol. 1997;7:615–623. doi: 10.1016/s0959-4388(97)80080-3. [DOI] [PubMed] [Google Scholar]
- Heukeshoven J, Dernick R. Improved silver staining procedure for fast staining in PhastSystem Development Unit. I. Staining of sodium dodecyl sulfate gels. Electrophoresis. 1988;9:28–32. doi: 10.1002/elps.1150090106. [DOI] [PubMed] [Google Scholar]
- Jonas EA, Knox RJ, Kaczmarek LK, Schwartz JH, Solomon DH. Insulin receptor in Aplysia neurons: characterization, molecular cloning, and modulation of ion currents. J Neurosci. 1996;16:1645–1658. doi: 10.1523/JNEUROSCI.16-05-01645.1996. [DOI] [PMC free article] [PubMed] [Google Scholar]
- Kamiguchi H, Lemmon V. Neural cell adhesion molecule L1 - signaling pathways and growth cone motility. J Neurosci Res. 1997;49:1–8. doi: 10.1002/(sici)1097-4547(19970701)49:1<1::aid-jnr1>3.0.co;2-h. [DOI] [PubMed] [Google Scholar]
- Keller F, Schacher S. Neuron-specific membrane glycoproteins promoting neurite fasciculation in Aplysia californica. J Cell Biol. 1990;111:2637–2650. doi: 10.1083/jcb.111.6.2637. [DOI] [PMC free article] [PubMed] [Google Scholar]
- Kucik DF, Elson EL, Sheetz MP. Forward transport of glycoproteins on leading lamellipodia in locomoting cells. Nature. 1989;340:315–317. doi: 10.1038/340315a0. [DOI] [PubMed] [Google Scholar]
- Kuhn TB, Schmidt MF, Kater SB. Laminin and fibronectin guideposts signal sustained but opposite effects to passing growth cones. Neuron. 1995;14:275–285. doi: 10.1016/0896-6273(95)90285-6. [DOI] [PubMed] [Google Scholar]
- Lamoureux P, Buxbaum RE, Heidemann SR. Direct evidence that growth cones pull. Nature. 1989;340:159–162. doi: 10.1038/340159a0. [DOI] [PubMed] [Google Scholar]
- Lewis AK, Bridgman PC. Nerve growth cone lamellipodia contain two populations of actin filaments that differ in organization and polarity. J Cell Biol. 1992;119:1219–1243. doi: 10.1083/jcb.119.5.1219. [DOI] [PMC free article] [PubMed] [Google Scholar]
- Lin C-H, Forscher P. Cytoskeletal remodeling during growth cone– target interactions. J Cell Biol. 1993;121:1369–1383. doi: 10.1083/jcb.121.6.1369. [DOI] [PMC free article] [PubMed] [Google Scholar]
- Lin C-H, Forscher P. Growth cone advance is inversely proportional to retrograde F-actin flow. Neuron. 1995;14:763–771. doi: 10.1016/0896-6273(95)90220-1. [DOI] [PubMed] [Google Scholar]
- Lin C-H, Thompson CA, Forscher P. Cytoskeletal reorganization underlying growth cone motility. Curr Opin Neurobiol. 1994;4:640–647. doi: 10.1016/0959-4388(94)90004-3. [DOI] [PubMed] [Google Scholar]
- Lin C-H, Espreafico EM, Mooseker MS, Forscher P. Myosin drives retrograde F-actin flow in neuronal growth cones. Neuron. 1996;16:769–782. doi: 10.1016/s0896-6273(00)80097-5. [DOI] [PubMed] [Google Scholar]
- Maness PF, Beggs HE, Klinz SG, Morse WR. Selective neural cell adhesion molecule signaling by Src family tyrosine kinases and tyrosine phosphatases. Perspect Dev Neurobiol. 1996;4:169–181. [PubMed] [Google Scholar]
- Mayford M, Barzilai A, Keller F, Schacher S, Kandel ER. Modulation of an NCAM-related adhesion molecule with long term synaptic plasticity in Aplysia. Science. 1992;256:638–644. doi: 10.1126/science.1585176. [DOI] [PubMed] [Google Scholar]
- Mitchison T, Kirschner M. Cytoskeletal dynamics and nerve growth. Neuron. 1988;1:761–772. doi: 10.1016/0896-6273(88)90124-9. [DOI] [PubMed] [Google Scholar]
- Mitchison TJ, Cramer LP. Actin-based cell motility and cell locomotion. Cell. 1996;84:371–379. doi: 10.1016/s0092-8674(00)81281-7. [DOI] [PubMed] [Google Scholar]
- O'Connor TP, Bentley D. Accumulation of actin in subsets of pioneer growth cone filopodia in response to neural and epithelial guidance cues in situ. J Cell Biol. 1993;123:935–948. doi: 10.1083/jcb.123.4.935. [DOI] [PMC free article] [PubMed] [Google Scholar]
- Peter N, Aronoff B, Wu F, Schacher S. Decrease in growth cone-neurite fasciculation by sensory or motor cells in vitro accompanies downregulation of Aplysia cell adhesion molecules by neurotransmitters. J Neurosci. 1994;14:1413–1421. doi: 10.1523/JNEUROSCI.14-03-01413.1994. [DOI] [PMC free article] [PubMed] [Google Scholar]
- Pollerberg GE, Burridge K, Krebs KE, Goodman SR, Schachner M. The 180-kD component of the neural cell adhesion molecule N-CAM is involved in cell-cell contacts and cytoskeleton-membrane interactions. Cell & Tissue Res. 1987;250:227–236. doi: 10.1007/BF00214676. [DOI] [PubMed] [Google Scholar]
- Rutishauser U. Adhesion molecules of the nervous system. Curr Opin Neurobiol. 1993;3:709–715. doi: 10.1016/0959-4388(93)90142-l. [DOI] [PubMed] [Google Scholar]
- Sabry JH, O'Connor TP, Evans L, Toroian RA, Kirschner MW, Bentley D. Microtubule behavior during guidance of pioneer neuron growth cones in situ. J Cell Biol. 1991;115:381–395. doi: 10.1083/jcb.115.2.381. [DOI] [PMC free article] [PubMed] [Google Scholar]
- Schmidt CE, Horwitz AF, Lauffenburger DA, Sheetz MP. Integrin–cytoskeletal interactions in migrating fibroblasts are dynamic, asymmetric, and regulated. J Cell Biol. 1993;123:977–991. doi: 10.1083/jcb.123.4.977. [DOI] [PMC free article] [PubMed] [Google Scholar]
- Schmidt CE, Dai J, Lauffenburger DA, Sheetz MP, Horwitz AF. Integrin-cytoskeletal interactions in neuronal growth cones. J Neurosci. 1995;15:3400–3407. doi: 10.1523/JNEUROSCI.15-05-03400.1995. [DOI] [PMC free article] [PubMed] [Google Scholar]
- Sheetz MP, Baumrind NL, Wayne DB, Pearlman AL. Concentration of membrane antigens by forward transport and trapping in neuronal growth cones. Cell. 1990;61:231–241. doi: 10.1016/0092-8674(90)90804-n. [DOI] [PubMed] [Google Scholar]
- Suter, D.M., and P. Forscher. 1998. An emerging link between cytoskeletal dynamics and cell adhesion molecules in growth cone guidance. Curr. Opin. Neurobiol. In press. [DOI] [PubMed]
- Svitkina TM, Verkhovsky AB, McQuade KM, Borisy GG. Analysis of the actin-myosin II system in fish epidermal keratocytes - mechanism of cell body translocation. J Cell Biol. 1997;139:397–415. doi: 10.1083/jcb.139.2.397. [DOI] [PMC free article] [PubMed] [Google Scholar]
- Tanaka EM, Kirschner MW. Microtubule behavior in the growth cones of living neurons during axon elongation. J Cell Biol. 1991;115:345–363. doi: 10.1083/jcb.115.2.345. [DOI] [PMC free article] [PubMed] [Google Scholar]
- Tanaka E, Kirschner MW. The role of microtubules in growth cone turning at substrate boundaries. J Cell Biol. 1995;128:127–137. doi: 10.1083/jcb.128.1.127. [DOI] [PMC free article] [PubMed] [Google Scholar]
- Tanaka E, Sabry J. Making the connection: cytoskeletal rearrangements during growth cone guidance. Cell. 1995;83:171–176. doi: 10.1016/0092-8674(95)90158-2. [DOI] [PubMed] [Google Scholar]
- Tessier-Lavigne M, Goodman CS. The molecular biology of axon guidance. Science. 1996;274:1123–1133. doi: 10.1126/science.274.5290.1123. [DOI] [PubMed] [Google Scholar]
- Theriot JA, Mitchison TJ. Actin microfilament dynamics in locomoting cells. Nature. 1991;352:126–131. doi: 10.1038/352126a0. [DOI] [PubMed] [Google Scholar]
- Thompson C, Lin C-H, Forscher P. An Aplysia cell adhesion molecule associated with site-directed actin filament assembly in neuronal growth cones. J Cell Sci. 1996;109:2843–2854. doi: 10.1242/jcs.109.12.2843. [DOI] [PubMed] [Google Scholar]
- Walsh FS, Doherty P. Cell adhesion molecules and neuronal regeneration. Curr Opin Cell Biol. 1996;8:707–713. doi: 10.1016/s0955-0674(96)80113-x. [DOI] [PubMed] [Google Scholar]
- Waterman-Storer CM, Salmon ED. Actomyosin-based retrograde flow of microtubules in the lamella of migrating epithelial cells influences microtubule dynamic instability and turnover and is associated with microtubule breakage and treadmilling. J Cell Biol. 1997;139:417–434. doi: 10.1083/jcb.139.2.417. [DOI] [PMC free article] [PubMed] [Google Scholar]
- Williamson T, Gordon-Weeks PR, Schachner M, Taylor J. Microtubule reorganization is obligatory for growth cone turning. Proc Natl Acad Sci USA. 1996;93:15221–15226. doi: 10.1073/pnas.93.26.15221. [DOI] [PMC free article] [PubMed] [Google Scholar]
- Zhu H, Wu F, Schacher S. Aplysia cell adhesion molecules and serotonin regulate sensory cell-motor cell interactions during early stages of synapse formation in vitro. J Neurosci. 1994;14:6886–6900. doi: 10.1523/JNEUROSCI.14-11-06886.1994. [DOI] [PMC free article] [PubMed] [Google Scholar]
- Zhu H, Wu F, Schacher S. Changes in expression and distribution of Aplysia cell adhesion molecules can influence synapse formation and elimination in vitro. J Neurosci. 1995;15:4173–4183. doi: 10.1523/JNEUROSCI.15-06-04173.1995. [DOI] [PMC free article] [PubMed] [Google Scholar]