Abstract
Microfibrils are ubiquitous fibrillin-rich polymers that are thought to provide long-range elasticity to extracellular matrices, including the zonular filaments of mammalian eyes. X-ray diffraction of hydrated bovine zonular filaments demonstrated meridional diffraction peaks indexing on a fundamental axial periodicity (D) of ∼56 nm. A Ca2+-induced reversible change in the intensities of the meridional Bragg peaks indicated that supramolecular rearrangements occurred in response to altered concentrations of free Ca2+. In the presence of Ca2+, the dominant diffracting subspecies were microfibrils aligned in an axial 0.33-D stagger. The removal of Ca2+ caused an enhanced regularity in molecular spacing of individual microfibrils, and the contribution from microfibrils not involved in staggered arrays became more dominant. Scanning transmission electron microscopy of isolated microfibrils revealed that Ca2+ removal or addition caused significant, reversible changes in microfibril mass distribution and periodicity. These results were consistent with evidence from x-ray diffraction. Simulated meridional x-ray diffraction profiles and analyses of isolated Ca2+-containing, staggered microfibrillar arrays were used to interpret the effects of Ca2+. These observations highlight the importance of Ca2+ to microfibrils and microfibrillar arrays in vivo.
Afibrillin-rich network is formed from elastic microfibrils that are widely distributed in the extracellular matrices (ECM) of tissues such as skin, muscle, vasculature, ligaments, cartilage, and ocular zonules (13, 24). Long flexible microfibrils with numerous beads have been isolated from tissues and their structure visualized by rotary shadowing or scanning transmission electron microscopy (STEM)1 (10, 14, 26). Isolated microfibrils are 10–14-nm wide beaded structures exhibiting an average axial unit repeat (D) of 56 nm within the range of 33–165 nm (10, 26). This 400% variation in bead periodicity suggests that microfibrils in vivo may be highly elastomeric. In evolutionary terms, these microfibrils may be the most fundamental elastic components of the ECM, and may therefore be of central importance in providing long range elastic recoil to connective tissues (18, 28). In elastic tissues, microfibrils act as the template for tropoelastin deposition during elastic fibrillogenesis, and mature elastic fibers are composites of elastin and microfibrils (19).
The major structural components of microfibrils are fibrillin-1 and fibrillin-2, homologous multidomain glycoproteins that contain 47 epidermal growth factor–like domains, 43 of which have Ca2+-binding potential and probably bind Ca2+ in vivo (1, 7, 21, 25). Fibrillin is believed to contribute both to the beads and to the filamentous strands linking the beads (17, 22), although other molecules may also be present (4–6, 16, 27). The molecular arrangement of fibrillin in assembled microfibrils is poorly defined, and to date, only tentative structural models have been proposed to account for their elastic properties (3, 22). Rotary shadowing studies have highlighted the key role of ligated Ca2+ in maintaining the ordered lateral packing arrangement of microfibrils (11). In addition, the experimental removal of Ca2+ renders isolated and recombinant fibrillin-1 molecules shorter and more flexible (23).
We have previously used x-ray diffraction to examine the structural organization of microfibrils in zonular filaments (29). Preliminary x-ray diffraction studies of microfibrils in such tissues have provided information relating to the molecular structure, packing, and behavior on extension that may explain their unusual biomechanical properties. Diffraction data obtained from native bovine zonular filaments revealed a structural feature indexing on a 56-nm periodicity. The fundamental periodicity did not change significantly with extensions of up to 40%, indicating that some portions of the microfibrils exhibit a static periodicity (29). The diffraction data obtained from native zonule preparations also exhibited strong intensities corresponding to molecular spacings of 18.73 and 9.36 nm. These correspond to the third and sixth orders of a 56-nm periodicity.
A key advantage of x-ray diffraction to study fibrillin-rich microfibrils is that a statistically significant number of molecular conformations can be examined in hydrated intact tissues. This technique can reveal molecular features that cannot be readily detected by microscopic techniques that rely on disruption of tissues and dehydration of samples (30, 31). In this study, we have examined the effects of Ca2+ on the structural organization of microfibrillar arrays using x-ray diffraction of tissue microfibrils together with electron microscopic and biochemical studies of isolated microfibrils.
Materials and Methods
Materials
Adult and second trimester fetal calves (120–130-d gestation) were obtained from the local abattoir within 1 h of death. Bacterial collagenase (type 1A), hyaluronidase (E.C. 3.2.1.36) (type X from leech), DNase I (E.C. 3.1.2.1) from bovine pancreas, PMSF, N-ethylmaleimide, and benzamidine were obtained from the Sigma Chemical Company (Poole, Dorset, UK). Sepharose CL-2B was supplied by Pharmacia-LKB (Milton Keynes, Bucks, UK). Centricon microconcentrators were purchased from Amicon, (Stonebrook, Gloucestershire, UK).
X-ray Diffraction
Zonular fibers from bovine eyes are relatively large (5-mm long in situ) and contain microfibrils orientated along their length. They therefore present a good system to study the structure and extensibility of microfibrils. Dissection of zonular filaments and removal of the contaminating vitreous were done as in (29). X-ray diffraction experiments were conducted on beamlines 2.1 and 16.1 at the Central Laboratories Research Council (CLRC) Daresbury laboratory. This provided a suitable small beam of intense x-ray flux combined with suitable low angle camera geometries. Each sample was mounted between two thin sheets of mica that were sealed together with silicon grease and the sample bathed in PBS, pH 7.5, at 20°C. The aluminium frame that held the sample also served as a suitable aperture for the x-ray diffraction beam. Before diffraction, the sample was immersed for 15 min in an excess of isotonic 0.05 M Tris, pH 7.5, buffer containing 0.1 M NaCl (TBS); supplementary TBS buffers containing 0.05 M CaCl2 or 0.01 M EGTA were used to add or remove Ca2+ from the tissue. NaCl levels were adjusted in these solutions to maintain constant ionic strength.
The effect of x-ray beam damage was found to be insignificant with serial diffraction experiments where the total exposure time was over 1 h, confirming previous transmission electron microscopy analysis of microfibrils after x-ray beam exposure (29). An individual sample exhibiting well-ordered diffraction peaks maintained under a pretension was used to examine the cyclic effects of Ca2+ addition and Ca2+ removal for both camera lengths. The effect of EGTA on an untensioned sample was also examined.
Data were collected on a two-dimensional, gas-filled detector developed at CLRC Daresbury. The sample to detector distance used was 6.25 m (beamline 2.1) and 2.5 m (beamline 16.1) with an x-ray beam spot size at the sample of 200 × 500 μm defined by slits in both cases. The wavelength of x-rays used was 0.1488 nm. Suitable blank exposures of the empty cell and a detector response were taken. A sample of wet rat tail tendon was used for calibration and comparison of diffraction strength. The exposure time of each sample was 15 min (rat tail tendon 2 min). The relatively broad nature of the diffraction peaks meant that to obtain an adequate separation of diffraction peaks, while also making the first order of diffraction observable, only the first four orders of diffraction were obtained using the 6.25-m camera. The 2.5-m camera collected data from the third to eighth orders of diffraction. The diffraction does not show any appreciable Bragg diffraction beyond the eighth order, indicating a significant amount of disorder within the sample.
X-ray Data Analysis
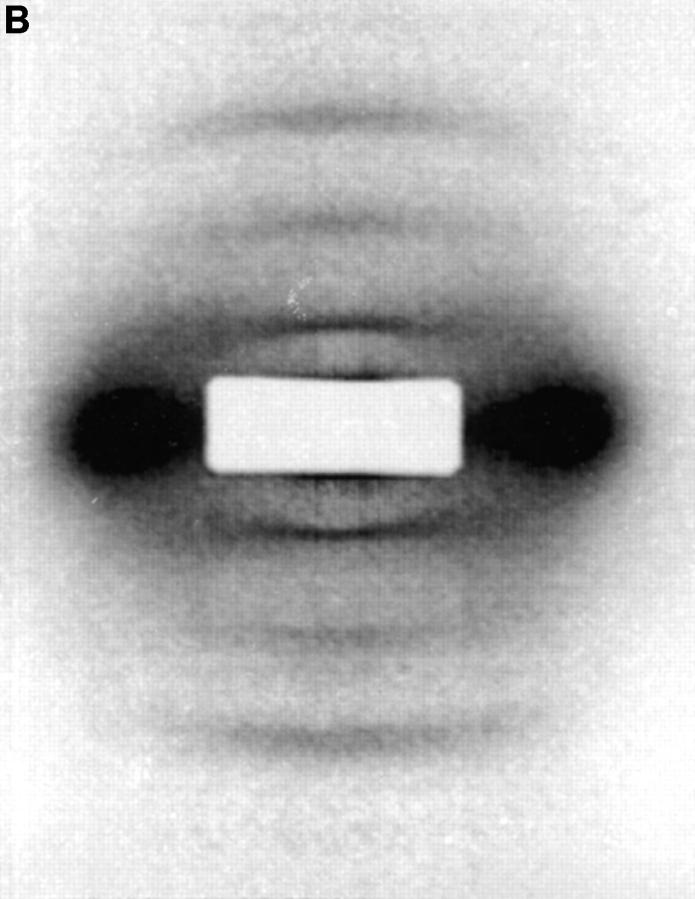
X-ray diffraction two-dimensional images were calibrated using programs written to use the 1/67-nm-1 meridional axis spacing of rat tail tendon Bragg peaks. All images were corrected for the detector response and the empty cell was subtracted from each. Data pixels were converted from two-dimensional detector data to radial data profiles (reciprocal film space co-ordinate vs. angle where the equator is 0 degrees) in order to facilitate integration around arced Bragg diffraction peaks. Typical diffraction images can be seen in Figs. 1 and 2. Data correction procedures were similar to those used in (29). The two-dimensional radial distribution profiles were integrated using boundaries that included all visible meridional Bragg intensity; this resulted in single line plots used to examine any changes in meridional intensity or position.
Figure 1.
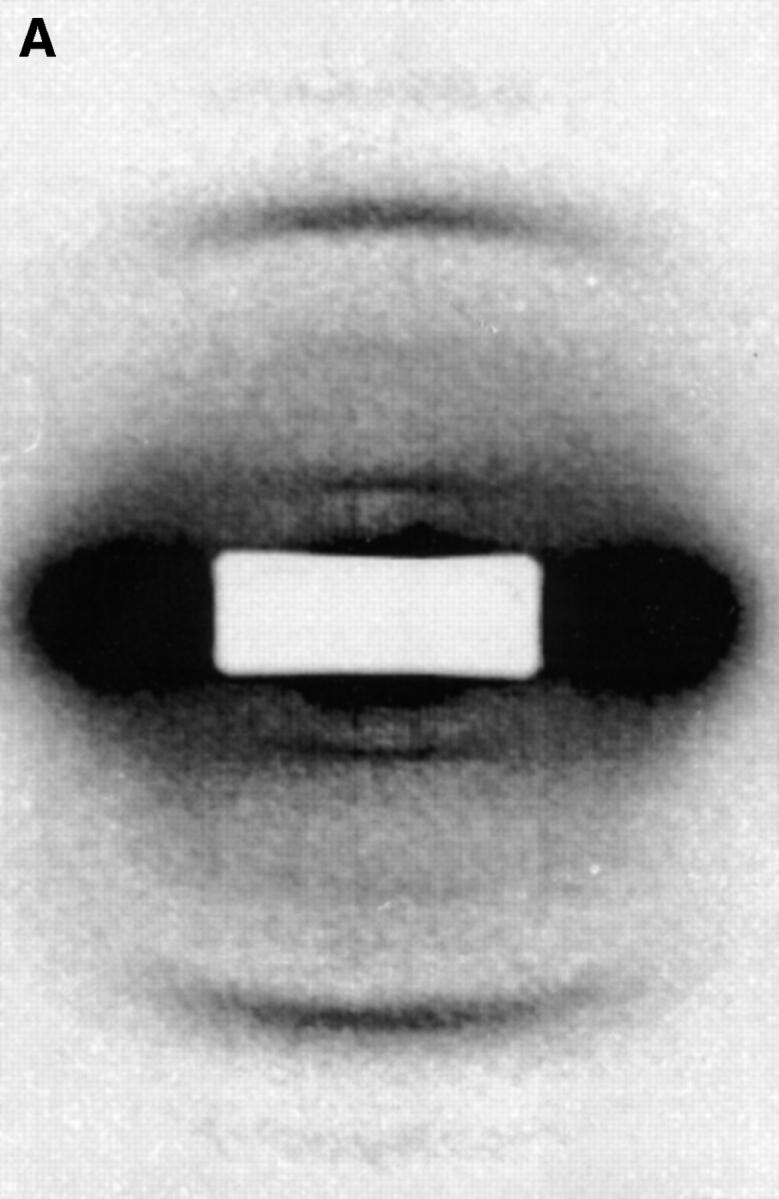
(A) X-ray diffraction image of fibrillin-rich zonular filaments in the presence of Ca2+. Data were recorded on beamline 2.1 CLRC Daresbury (camera length, 6.25 m); experiments were conducted at 20°C. The predominant first and third orders can be seen. The second and fourth diffraction intensities are very weak. The diffraction image has been corrected for the detector response and a suitable empty cell image removed. Intensities were scaled within individual minimum–maximum boundaries. (B) X-ray diffraction image of fibrillin-rich zonular filaments in the absence of Ca2+. Ca2+ ions have been removed by immersion in a buffer containing an excess of EGTA. In this case, the relative intensities of the diffraction peaks can be seen to decrease as a function of diffraction order. However, the absolute intensity of the third order was found to remain relatively constant relative to Ca2+-containing samples, and the major effects are the enhancement of intensity for the first and second orders with EGTA added.
Figure 2.
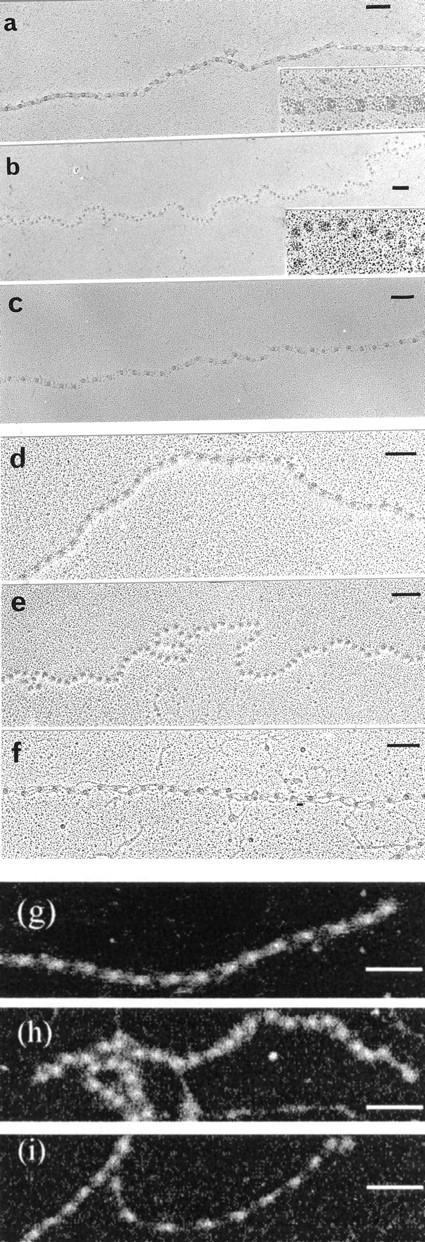
Isolated fibrillin-rich microfibrils visualized by rotary shadowing electron microscopy or dark-field STEM. Intact native microfibrils isolated from bovine skin (a–c), zonular filaments (d–f), and aorta (g–i) were visualized directly or after incubation in the presence of EDTA, EGTA, or CaCl2. Rotary shadowing EM and dark-field STEM both highlight gross structural microfibril rearrangements that result from these treatments. a, d, and g, untreated microfibrils; b and h, microfibrils treated with 5 mM EDTA; e, microfibrils treated with 5 mM EGTA; c, f, and i, microfibrils treated with 5 mM CaCl2; a–f, rotary-shadowed images. Bars, 100 nm.
Modeling of X-ray Diffraction Data
To simulate the meridional diffraction data, a realistic axial electron density profile along an individual microfibril was used as a starting point. The axial distribution of mass measured by STEM has been used in the study presented here. These profiles were used in turn to produce structures relating to staggered arrays of microfibrils (see Results). We assumed that there was minimal structural coherence between staggered arrays and non-staggered microfibrils in the bulk sample (especially if the coherence length of any regularly repeating region is relatively short). The Fourier transforms of the staggered arrays and microfibril density profile were calculated for orders 1–10 of the meridional series, and the square of the amplitude terms (intensities) from the structures combined to produce an optimal fit with the diffraction data.
Preparation of Isolated Microfibrils for Ultrastructural Analysis
Intact native microfibrils were isolated and purified from fetal bovine aorta, skin, and nuchal ligament and from adult zonular filaments as previously described (12, 14–16). These microfibrils were morphologically indistinguishable. Briefly, tissues were disrupted by bacterial collagenase digestion in 0.05 M Tris/HCl, pH 7.4, containing 0.4 M NaCl and 0.01 M CaCl2 in the presence of freshly added protease inhibitors (5 mM PMSF, 5 mM N-ethylmaleimide, 2 mM benzamidine). These extracts were sequentially digested with leech hyaluronidase and DNase I before isolation in the void volume of a Sepharose CL-2B gel filtration column. Microfibril preparations were equilibrated in 0.05 M Tris/HCl, pH 7.4, containing 0.4 M NaCl and 0.01 M CaCl2, and examined by electron microscopy after rotary shadowing. Ultrastructural analyses of microfibrils were carried out on untreated microfibrils and after 10 min incubation at 20°C in (a) 5 or 10 mM EDTA or EGTA, (b) 5 or 10 mM CaCl2, or (c) 5 mM EDTA and then 6 mM CaCl2. We have previously shown that 5–25 mM EDTA and EGTA have the same effect on microfibril morphology (11).
Rotary Shadowing Electron Microscopy
Intact microfibrils were adsorbed onto mica and shadowed with tungsten/ platinum, using a modification of the mica sandwich technique (12, 14, 16).
Scanning Transmission Electron Microscopy
STEM mass analysis is a well-established technique that has provided quantitative data on mass per unit length and axial mass distribution of unstained and unshadowed fibrillin-containing microfibrils and other macromolecules (2, 8, 9, 20, 26). Intact native aortic microfibrils were prepared and examined by STEM using a transmission electron microscope (1200EX; JEOL USA, Inc., Peabody, MA) as previously described (26).
An axial unit repeat (D) was defined as the distance from one mass minimum to the next (effectively one bead plus one interbead region). Total period mass (mass per unit length [kD/nm] × axial repeat [nm]) represented the total mass (kD) present in each axial repeat. Five measurements of mass per unit length were taken per microfibril, with 40–50 microfibrils per grid examined. Intra-period axial mass distributions were calculated as the averages of 10 measurements per microfibril. In addition, 50 measurements of intra-period axial mass distributions were determined for calcium-containing microfibrils where the axial repeat was within the range of 55.5–56.5 nm. Two-dimensional contour plots were constructed from the averages of five scans per microfibril. In all cases, these STEM measurements were repeated on multiple preparations. Microfibril diameter, measured as a function of mass distribution, was determined from two-dimensional contour plots.
Results
X-ray Diffraction of Ciliary Zonules
The x-ray diffraction patterns of ciliary zonules exhibited a series of meridional Bragg peaks (Fig. 1); these were found to index on a fundamental periodicity of 56 nm. The background diffuse scatter is believed to derive in part from the sample itself, indicating a degree of static disorder in the sample. The application of a small pretension on the sample (10% extension of zonular tissue) caused the shape of the diffuse scatter to become anisotropic and less predominant. In the presence of EGTA, it was also observed that the relaxed zonular preparations indicated a shortened axial periodicity of 46.8 nm (see Fig. 5 A). The effect of pretension was to maintain the axial periodicity at ∼56 nm for each cyclic treatment of an individual sample. Under conditions of fixed extension, the relative intensity of Bragg reflections were modulated whilst the periodicity remained constant. In all zonular filaments studied, the meridional series was found to extend over eight orders, the truncation of the series is presumed to reflect the inherent disorder in the sample. The electron density contrast of the bead–interbead region is apparent at low resolution. However, variation in the bead–interbead mass distribution in the bulk sample blurs the electron density contrast at higher resolution, and eventually Bragg peaks merge into the diffuse background. The intensity profile of the meridional series appears to be sampled by a Gaussian function indicating that the averaged axially repeating electron density structure itself resembles a Gaussian function; variation between unit cell densities will impose a degree of static disorder.
Figure 5.
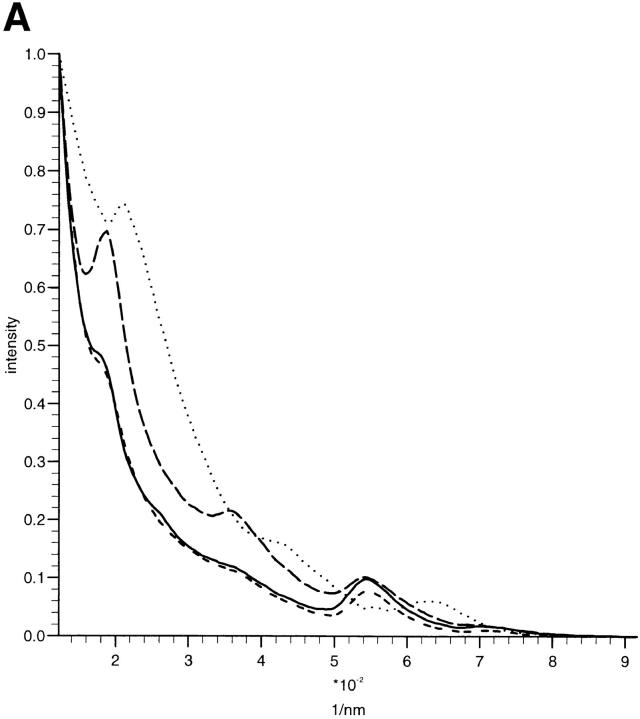
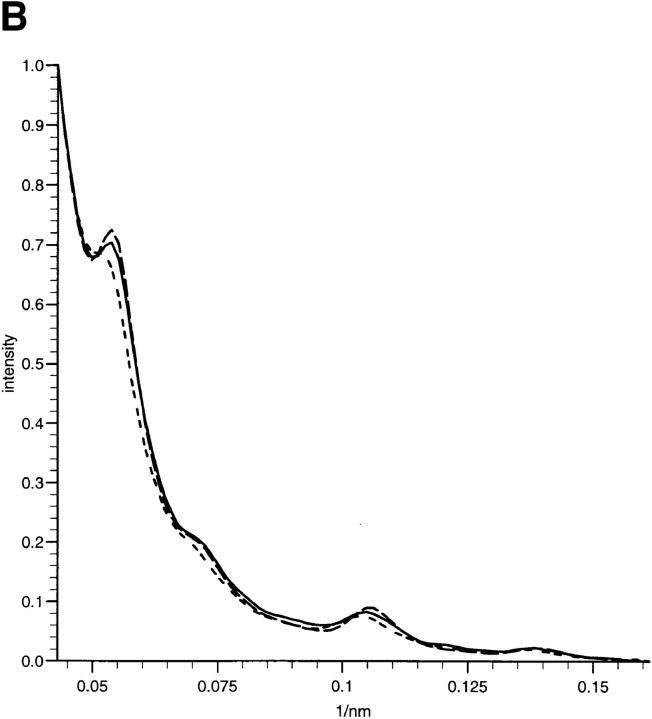
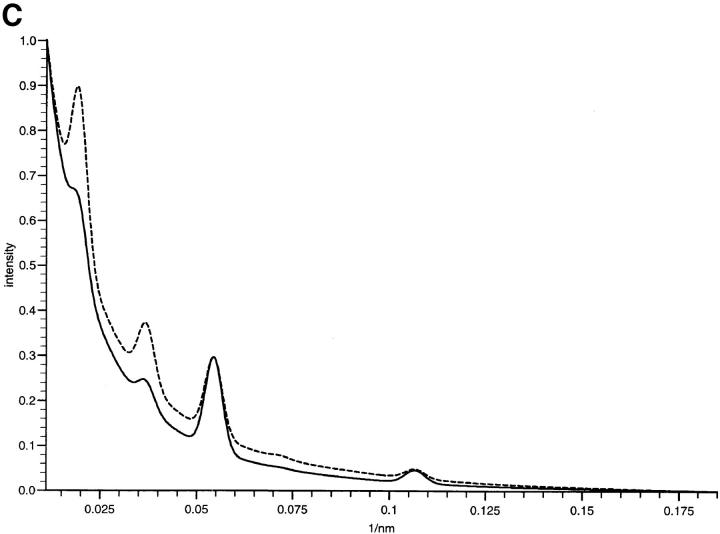
X-ray diffraction intensity profiles and simulations. (A) Profiles of the meridional intensities of the first four orders of the zonular filament diffraction pattern showing the Bragg peaks superimposed on a diffuse background. The application of a small pretension (10% extension of zonular tissue) caused the shape of the diffuse scatter to become anisotropic and less predominant, and maintained axial periodicity at ∼56 nm for each cyclic treatment of an individual sample with Ca2+ and EGTA. Under these conditions of fixed extension, the relative intensity of Bragg reflections were modulated while the periodicity remained constant. The effect of EGTA can be seen as the presence of the first order as the dominant intensity. In samples containing Ca2+, the third order is dominant. The effect of EGTA on the fundamental periodicity of the axial repeat without a 10% pretension is also shown. The line plot represents integrated intensity of meridional reflections versus radial position. Short dashed, Ca2+-enriched sample; solid, native sample; long dashed, EGTA-treated sample with pretension; dotted, EGTA-treated sample without 10% pretension. (B) Profiles of the meridional intensities of orders three through eight of the zonular filament diffraction pattern under conditions of 10% pretension, showing the Bragg peaks superimposed on a diffuse background. The effect of EGTA is less pronounced at higher orders of diffraction since the molecular arrangements in the individual microfibrils are more variable than the supramolecular arrays. The line plot represents integrated intensity of meridional reflections versus radial position. Short dashed, Ca2+-enriched; solid, native sample; long dashed, EGTA-treated sample with pretension. (C) Simulations of meridional diffraction series using combinations of the staggered and non-staggered profiles. A diffuse background was added to the simulated data based on the exponential decay of the diffuse scatter in the sample. Details of percentage contribution from the isolated microfibrils and staggered array structures can be found in Results. The two lines represent simulations of microfibril in the presence or absence of bound Ca2+. Short dashed, EGTA-treated sample; solid, native sample.
In both native samples and those immersed in Ca2+ solution, the presence of a dominant third order of intensity indicates that a regular array of microfibrils with a relative stagger of 56/3 nm may exist as a population within the sample (Fig. 1). This feature is less apparent in the samples where Ca2+ have been chelated by EGTA, here the meridional diffraction intensities of the first four orders follows a more stepwise decrease in intensity with diffraction order. The strength of the meridional diffraction also appears to be greater in the presence of EGTA when compared with the equatorial diffraction features. The diffraction profiles obtained using the 2.5-m camera indicate less obvious differences for diffraction orders three through eight (see Fig. 5 B), indicating that the differences in the diffraction images are limited to the first few terms of the Fourier series. Changes in the molecular packing must, therefore, involve structural alterations that contain an inherent degree of static or dynamic disorder.
Ca2+-induced Changes in Isolated Microfibrils
Rotary shadowed microfibrils, and dark field images of unstained, unshadowed microfibrils, from four different tissues all showed the same structural changes following Ca2+ chelation and addition (Fig. 2). Microfibrils treated with EDTA or EGTA remained intact but exhibited profoundly altered morphology with pronounced beads, loss of interbead definition, and increased flexibility. In contrast, microfibrils incubated with CaCl2 were well-packed, relatively linear structures. In the presence of Ca2+, some microfibril bundles were also apparent (see Fig. 7).
Figure 7.
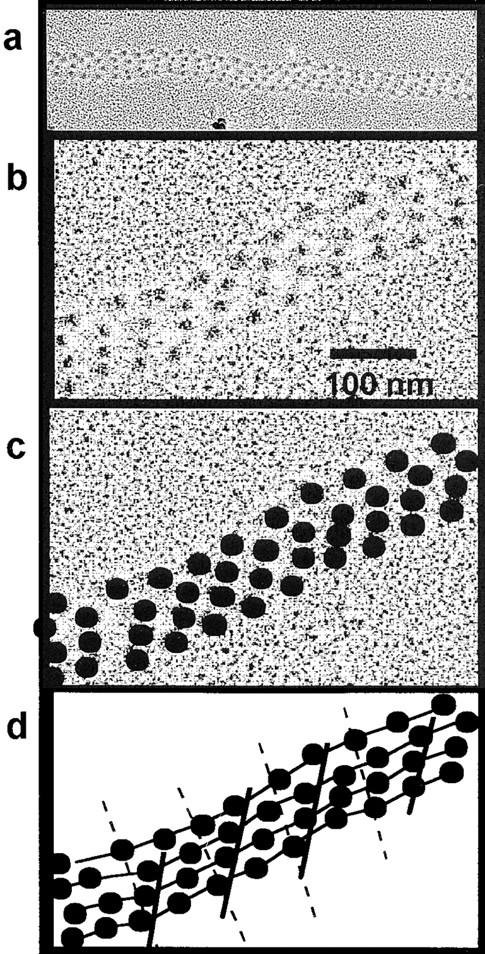
Proposed microfibrillar interactions that constitute a “supramolecular” junction. An electron micrograph of a native microfibrillar array isolated from nuchal ligament in presence of Ca2+; arrays have also been observed in microfibril preparations from zonules and other tissues. The individual fibrils are aligned predominantly as a 0.33 staggered structure. Coherent regions of beads aligned in a 0.33-D stagger can be seen clearly. (a) Microfibrils associated together over ∼40-D periods. (b) A detailed view of one part of the microfibrillar junction. (c) Enhancement of detail, the same figure as above with the bead regions highlighted. (d) The 0.33-D stagger lattice shown as beads distributed on lines as obtained from Fig. 7, b and c.
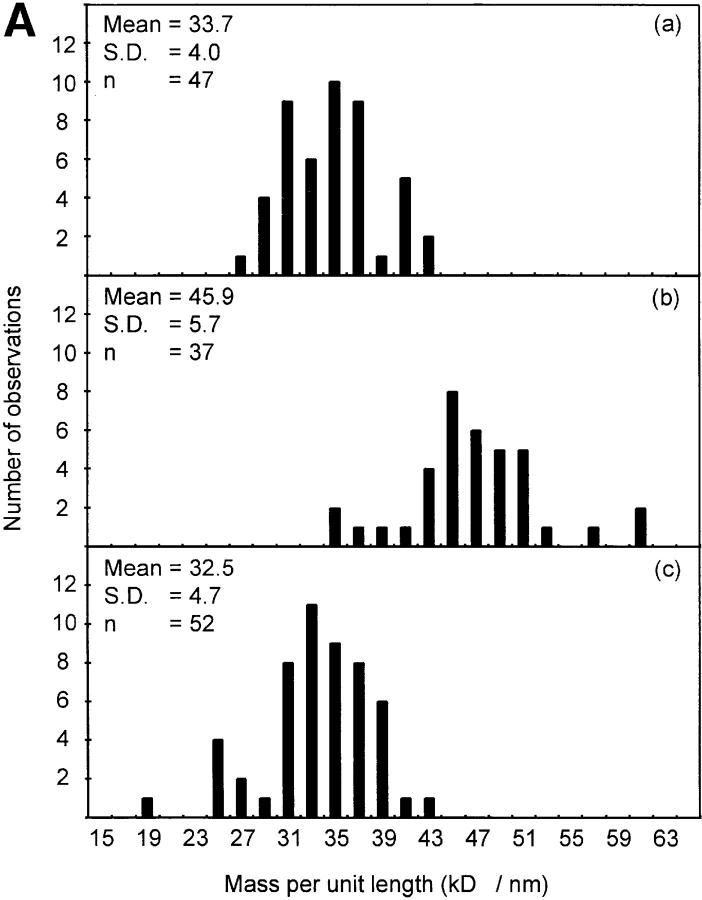
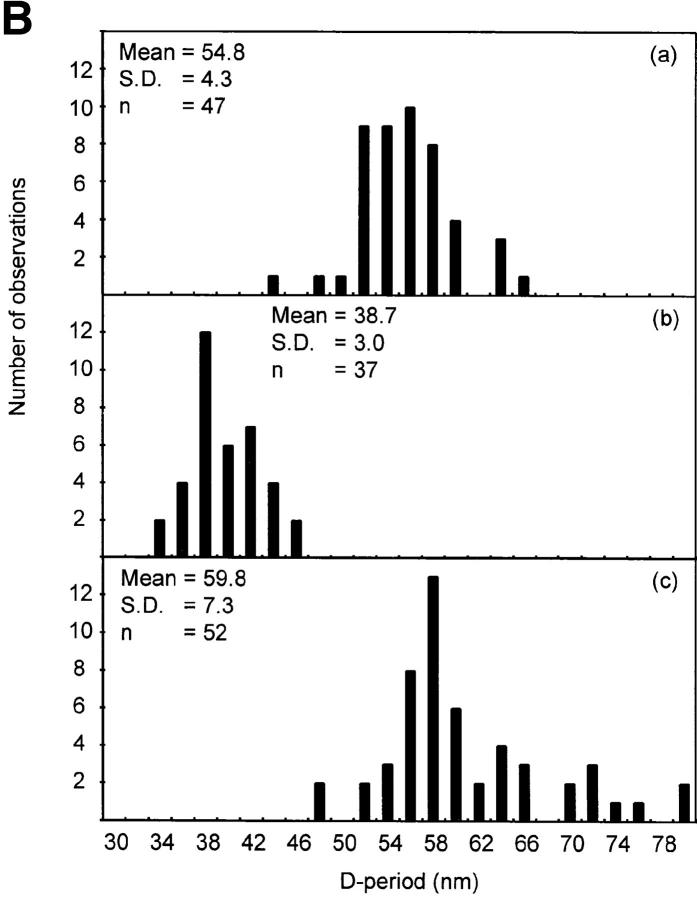
Quantitative STEM analyses were carried out on these microfibrils to investigate the effects of Ca2+ on microfibril mass and periodic organization (Table I; Figs. 3 and 4). Similar results were obtained for all microfibril populations examined. Axial repeat distances of untreated aortic and zonular filament microfibrils were 54.8 nm (SD = 4.3) and 54.9 nm (SD = 2.1), respectively. After incubation with EDTA or EGTA, axial repeat distance decreased in both aortic and zonular filament microfibrils to 38.7 nm (SD = 3) and 37.3 nm (SD = 0.2), respectively. After incubation in the presence of Ca2+, aortic microfibril axial repeat distance increased to 59.8 nm (SD = 7.3) and zonular filament axial repeat distance to 60.75 nm (SD = 5.1). The mass per unit length of aortic microfibrils was 33.7 kD/ nm (SD = 4; n = 47) (Table I). After incubation in the presence of EDTA, microfibrillar mass per unit length increased to 45.9 kD/nm (SD = 5.7; n = 37). Microfibrils incubated in the presence of Ca2+ had a mass per unit length of 32.5 kD/ nm (SD = 4.7; n = 52). When total mass per axial repeat was calculated, it was clear that small mass losses had occurred after EDTA (−3.8%) treatment, and gains after addition of Ca2+ (+5.3%).
Table I.
STEM Mass Analysis of Isolated Microfibrils
| Axial repeat | Mass per unit length | Total period mass | Mass change | |||||
|---|---|---|---|---|---|---|---|---|
| nm | kD/nm | kD | kD | |||||
| Untreated | 54.8 (± 4.3) | 33.7 (± 4.0) | 1,847 | 0 | ||||
| EDTA-treated | 38.7 (± 3.0) | 45.9 (± 5.7) | 1,776 | −71 (−3.8%) | ||||
| CaCl2-treated | 59.8 (± 7.3) | 32.5 (± 4.7) | 1,944 | +97 (+5.3%) |
Aortic microfibrils were untreated, or incubated with 5 mM EDTA or 5 mM CaCl2. Axial repeat measurements were determined using dark field images of unstained, unshadowed microfibrils. Mass measurements were derived by STEM using a JEOL 1200EX transmission electron microscope, with tobacco mosaic virus as mass standard. Standard deviations are shown in parenthesis (4).
Figure 3.
Determination of microfibrillar mass and axial repeat by STEM. Intact unstained native microfibrils were adsorbed onto carbon film grids and examined by STEM in a JEOL 1200EX transmission electron microscope interfaced with a microcomputer system permitting digital scan control and digitization of signal from the dark-field detector. Mass measurements were based on the use of tobacco mosaic virus as a mass standard. (A) Mass per unit length (kD/nm) of (a) untreated microfibrils, (b) 5 mM EDTA-treated microfibrils, and (c) 5 mM CaCl2-treated microfibrils. (B) Axial repeat (D-period) in nm of (a) untreated microfibrils, (b) 5 mM EDTA-treated microfibrils, and (c) 5 mM CaCl2-treated microfibrils.
Figure 4.
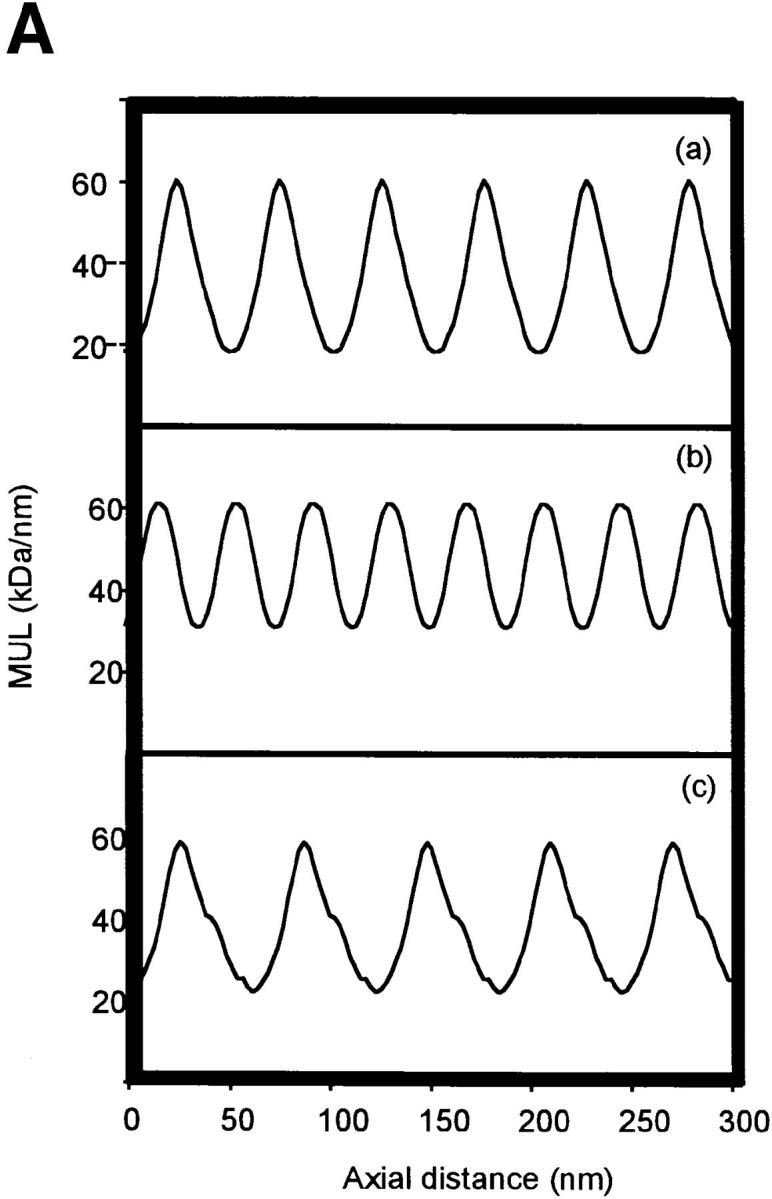
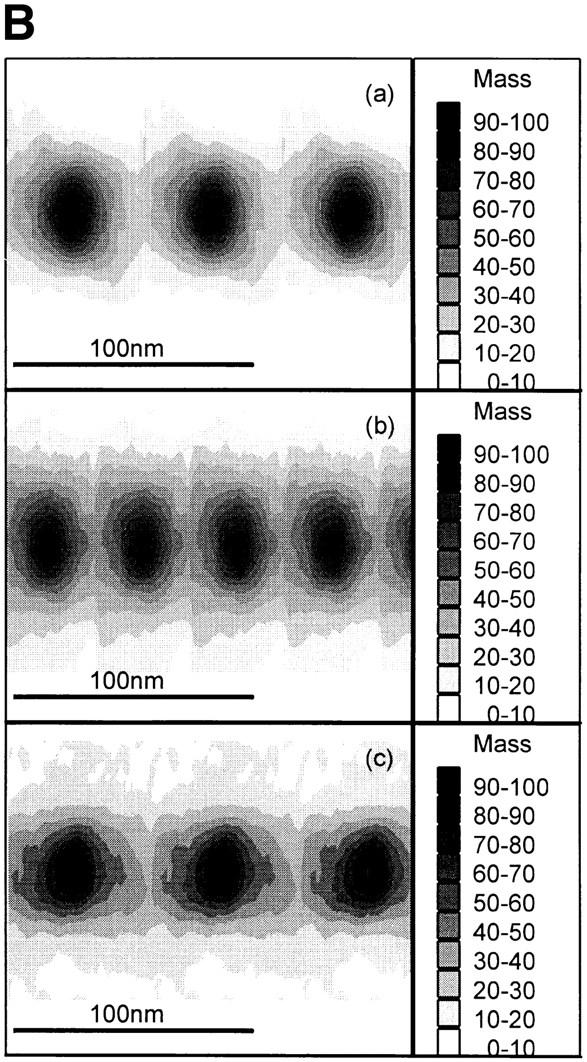
Mean axial mass distributions of microfibrils. Mean axial mass distributions of intact unstained microfibrils were determined from dark-field STEM images using low-dose electron exposure. (A) Axial mass distributions of (a) untreated microfibrils, (b) 5 mM EDTA-treated microfibrils, and (c) 5 mM CaCl2-treated microfibrils. (B) Contour plots of axial mass distribution of (a) untreated microfibrils, (b) 5 mM EDTA-treated microfibrils, and (c) 5 mM CaCl2-treated microfibrils.
Irrespective of experimental conditions, microfibrillar mass was always distributed axially as repeating peaks of mass coinciding with beads, and troughs corresponding to interbeads (Fig. 4). In the presence of Ca2+, the peaks of mass were asymmetrical (Fig. 4 A). Visualization of microfibril mass distributions as two-dimensional contour plots highlighted that microfibril diameter was reduced in the presence of Ca2+ and increased after EDTA chelation (Fig. 4 B).
Modeling of X-ray Diffraction Data
A linear profile of the x-ray diffraction intensities for the first four orders of fibrillin can be seen in Fig. 5 A. Data are shown for the sample in the native state and in a Ca2+-enriched buffer, as well as after removal of Ca2+ by EGTA. The relative intensity of each series of reflections was normalized. The effect of EGTA is clear in enhancing the relative intensity of the first and second orders of diffraction. In the case of native samples and those with Ca2+ present, the third order of diffraction was dominant. The effects of EGTA and Ca2+ on diffraction orders four through eight were observed to be minor (Fig. 5 B).
Modeling of the intensity started with the use of axial mass distribution derived from the STEM data of dried isolated microfibrils. For individual microfibrils, the intensity profile is dominated by the general bead–interbead function. Axial density profiles from STEM data where the bead–interbead periodicity was measured to be 56 ± 1 nm, were used. Initial attempts at diffraction profile simulation showed a rapid extinction of the diffraction intensity with order. This indicated that in the dry state the axial mass distribution is smeared, possibly because of the action of drying. The effect is that the structural interface between the bead and interbead is less pronounced than in the fully hydrated state that gives a sharper contrast of electron density distribution. A sharpened axial density profile that reduced the half-width of the bead region, was used to calculate the Fourier transforms.
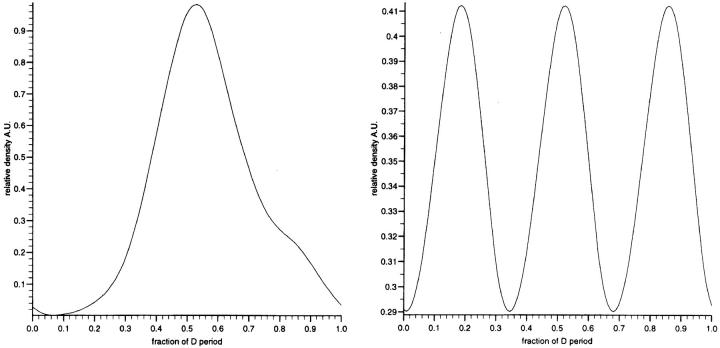
Arrays of the axial mass profiles were constructed by staggering the axial mass profiles by a number of discrete subdivisions of the axial repeat. There are no features present in any STEM axial density profiles that indicate strong molecular contrast of 0.33 D along an individual microfibril, rather the presence of a strong third order of the diffraction data immediately indicates the optimal relative axial stagger between nearest neighbor microfibrils to be 0.33 D where D is the axial repeat. The axially projected and staggered density profiles used to simulate the x-ray diffraction intensities can be seen in Fig. 6. The intensity terms for a meridional series were calculated from the Fourier transform of the density profiles. There are differences in the Gaussian character of the staggered and non staggered arrays presented in the Fourier transforms. The contribution from the individual microfibril profiles decayed to a minimum within the first four orders. In the case of the staggered arrays, the model dictates that the inherent ordering of the axial structures required to achieve array formation is reflected in a diffraction profile which shows more coherence and results in diffraction to the sixth order. The simulated diffraction series from staggered microfibril arrays and non-staggered microfibrils were combined in an optimal manner to simulate the profile of scattering from zonular fibrils with and without Ca2+. These simulations can be seen in Fig. 5 C. The EGTA treated sample (Ca2+ depleted) is constructed from the combination of 35% of the diffraction intensity from the individual microfibrils added to the diffraction series of the staggered profile. The Ca2+-enriched sample was constructed by the combination of 10% of individual microfibril profile added to the diffraction series of the staggered array profile. The use of the two structural features, regularly spaced bead–interbead regions of individual microfibrils and staggered arrays could therefore simulate the main features of the diffraction profile. In both cases, it is possible to make the simulation by maintaining a fixed level of contribution from the staggered array that is complemented to different degrees from the non staggered intensity profile. The profiles in Fig. 5 were superimposed on a profile of diffuse scatter modeled as an exponential function that in turn was derived from the interpolated diffuse scattering present in the diffraction data. This improved the quality of the simulation in comparison to the diffraction intensity profiles from zonular filaments. The simulated profiles cover the diffraction space sampled by the two different camera lengths used. The principal differences in the simulated profiles are confined (as in the experimental data) to the first few orders of diffraction. The diffraction profile of the higher orders are similar in both simulations as in the case of the experimental data.
Figure 6.
The relative density profiles used to simulate the electron density in the non-associated microfibrils (left) and microfibrillar arrays where the relative molecular stagger is 0.33 D (right). The staggered array was produced by superimposing the individual microfibril structure at 0.33-D intervals to produce a continuous function.
The main features of the diffraction profiles can therefore be simulated by a relatively simple model that consists of differential contributions of two levels of structure. The model makes relatively few assumptions and all features are backed by observations from other sources such as STEM measurements and the observation of microfibrillar 0.33-D staggered arrays by EM.
Staggered arrays of microfibrils may be found in discrete regions of the zonular bundles. Electron micrographs of staggered arrays that have remained intact after microfibril purification also strongly indicate the presence of these structures. Fig. 7 shows an electron micrograph of such a two-dimensional array of ∼0.33-D staggered microfibrils. The array propagates for over 40 bead–interbead periodicities, but also contains incoherence that may result from sample preparation or be inherent in the system. X-ray diffraction allows periodicities to be observed that indicate the existence of significant amounts of microfibrillar bases staggered arrays in the intact tissue. The axial value for D may be regulated by the lateral association of adjacent microfibrils and produce a more ordered part of the microfibrillar-rich tissue.
It is of interest that the subsidiary peak observed on the axial mass profiles of microfibrils containing Ca2+ is ∼0.33 D (where D = 56 nm) away from the central peak of the bead region (see Fig. 4 A). This structural feature is not strong enough to produce a significant third order diffraction peak and is not visible on staggering the microfibrils in a regular 0.33-D array. The presence of this subsidiary peak may, however, provide a basis for the staggered interaction between molecules in the presence of Ca2+.
The relative increase of first and second order diffraction intensities observed in removing Ca2+ from the zonular filament sample could result from a decrease in the spread of bead–interbead periodicities in the sample. This effect is also observed in the SD measurements of the STEM data (see Fig. 3; Table I). Increased regularity of the bead–interbead spacing would result in more coherent contrasting density contributing to coherent Bragg scatter. In the native, and particularly within the Ca2+-enriched treatments, the diffraction profile is predominantly from the staggered arrays, since the disperse nature of the D period values as observed in STEM data prevents coherent diffraction contributions from the microfibrils not involved in the staggered arrays.
Discussion
Using high resolution biophysical methods, we have found that microfibril periodicity can be observed in intact, hydrated tissue samples, and that the diffraction intensity distribution can be experimentally modulated by removing Ca2+ ions. We have also observed that Ca2+ influences the flexibility, mass distribution, and periodicity of microfibrils isolated from zonules and other tissues. These studies demonstrate for the first time the Ca2+ dependence of the molecular packing of not only individual microfibrils but also higher order hydrated microfibrillar arrays such as those occurring in vivo.
The small angle x-ray diffraction peaks indicate two possible levels of molecular organization. These are individual microfibrils with some statistical spread of periodicity, and supramolecular arrays where the axial molecular spacing is inherently regulated by the formation of a lattice. For diffraction to occur as discrete Bragg peaks above a diffuse background, the sample must contain a significant number of molecular spacings where the relative spread of the fundamental bead–interbead spacing is low. Therefore, the diffraction pattern of zonular fibers indicates a degree of axial uniformity that correlates well with the well-documented ∼56-nm periodicity of isolated untensioned microfibrils (13, 14, 26).
The relative intensity of the diffraction peaks from individual microfibrils corresponds to the mass density distribution within the periodic structure as determined by STEM analysis, where the mass density of the specimen is directly proportional to the electron density of the signal (see Fig. 3). The Fourier transform of such a Gaussian function corresponds to a series of intensities where the intensity decreases with increasing Bragg reflection order under a Gaussian envelope. This pattern approximates well to the observed intensity distribution of zonular filaments in the absence of calcium (+EGTA). X-ray diffraction indicates that the axial mass contrast is sharper in the intact hydrated state than in dried isolated microfibrils as determined by STEM.
After incubation in Ca2+-enriched buffer and in the native intact state, the third order is predominant in the diffraction data, indicating that a structural feature present in the sample contains a periodicity corresponding to one third of the bead–interbead period. Previous experiments have also shown a strong sixth order of diffraction, corresponding to the second harmonic of this periodic feature (29). This element could reflect a particular structural arrangement with ∼18.5-nm axial periodicity along individual microfibrils, and/or the organization of microfibrils into a supramolecular architecture. Such higher order arrays may be present in zonular fibers and may allow the transmission of molecular elasticity from the microfibrillar level to the intact tissue. These arrays may serve as functional “junctions” within microfibril bundles where the internal stress of the system can be transferred to the hierarchical network of fibrillin zonular filaments. The relative inextensibility of these regions may be central to their role in transmitting force.
Ca2+-containing zonular microfibrils are relatively rigid, but their bead–interbead periodicity is somewhat more variable than those experimentally depleted of Ca2+. The SD of axial mass and periodicity measurements from STEM analysis of freshly isolated non-ocular microfibrils corroborates this interpretation. This indicates that the bulk of the zonular microfibrils contain insufficient periodic regularity to produce coherent diffraction. The main diffraction results from the 0.33-D staggered arrays in the junction regions. The isolation of such staggered microfibrillar arrays intact from tissues supports the likelihood that this arrangement occurs in vivo (see Fig. 7) However, in the presence of EGTA, although the diffraction from the junction region remains, the diffraction pattern of the first two orders is now dominated by individual microfibrils since the spread of molecular periodicities is less in the bulk of the tissues. The inextensibility of a diffracting portion of the zonules in the native state is already documented. The effect of applied tension on the zonule in the presence of EGTA compared with the relaxed state indicates that in the relaxed state the diffraction pattern contains diffraction from a shorter periodicity. The axial length change is 17% less than the ∼56-nm observed “static” periodicity. This indicates that the now dominant x-ray diffraction from the individual microfibrils is indexing on a shorter axial repeat.
STEM analysis of isolated microfibrils highlights that microfibril organization is Ca2+-dependent. The reduction in bead periodicity and increase in microfibril diameter and flexibility that results from experimental Ca2+ chelation demonstrate conclusively that ligated Ca2+ influences microfibril packing and rigidity in vivo. Ca2+-induced changes in microfibril periodicity (∼35%) were greater than those reported for isolated fibrillin molecules, where the change of ∼19% in molecular length between Ca2+-bound and Ca2+-free forms was ascribed to altered conformation of contiguous calcium-binding (cb)EGF-like domains (23); this observation indicates that additional Ca2+-mediated folding events occur in assembled microfibrils. The x-ray diffraction evidence from untensioned EGTA-treated zonular filaments also contains a decreased axial periodicity, which is ∼17% shorter than the observed periodicity of native zonular filaments (Fig. 5 A). It is striking that this value is similar to the molecular contraction proposed in Reinhardt et al. (23), however the percentage contraction in periodicity is significantly less than that observed by EM of individual microfibrils. These differences may be ascribed to local restriction of conformational changes resulting from lateral interactions in dense microfibril bundles.
Present models of fibrillin alignment in microfibrils, based on epitope mapping and/or fibrillin monomer dimensions, predict a parallel arrangement of linear fibrillin molecules, either unstaggered (12) or with ∼50% overlap (3). Our STEM data are not in conflict with these published models, since the asymmetric axial mass distribution of Ca2+-saturated microfibrils supports parallel monomer alignment. However, neither model presents an obvious explanation for the mass maxima and minima that correspond to bead and interbead, respectively, and it is difficult to see how laterally aligned fibrillin (visualized as rod-like molecules [22]) could give rise to this axial mass distribution. Beaded microfibrils could result from the periodic association of polymers of linearly aligned fibrillin molecules with additional components that may influence the organization and properties of large microfibrillar arrays.
Conclusions
This x-ray diffraction study highlights that the fibrillin-rich microfibril periodicity observed in intact hydrated physiological tissue samples has an intensity distribution that indicates the presence of Ca2+. The diffraction from zonular filaments can be modeled in a relatively simple way by defining to structural lattices of different character, these being axially well-ordered individual microfibrils and supramolecular microfibrillar arrangements. The relative contributions of these diffracting sources may be highly variable depending on the microenvironment of the microfibrils within a tissue. The zonular filaments contain little else apart from microfibrils, and the presence of supramolecular junctions may be essential to the tissue architecture and therefore the macroscopic extensibility of the tissue. In elastic fiber–containing tissues, that arrangement may not be as predominant in diffraction terms due to differences in microfibrillar organization in the presence of elastin.
Acknowledgments
We are grateful to Dr. E. Townes-Andrews and A. Gleeson of CLRC Daresbury for help with x-ray data collection.
Abbreviations used in this paper
- D
axial unit repeat
- STEM
scanning transmission electron microscopy
Footnotes
The support of CLRC in granting beam-time on stations 2.1 and 16.1 of the Synchrotron Radiation Source at Daresbury Laboratory is gratefully acknowledged. C.M. Kielty acknowledges the support of the Medical Research Council. T.J. Wess acknowledges the support of Biotechnology and Biological Sciences Research Council. J.L. Ashworth holds a Wellcome Trust Vision Research Training Fellow.
Address all correspondence to T.J. Wess, Department of Biological and Molecular Sciences, University of Stirling, Stirling FK9 4LA, United Kingdom. Tel.: (44) 1786 467775. Fax: (44) 1786 464994. E-mail: tjw3@stir.ac.uk
References
- 1.Corson GM, Chalberg SC, Dietz HC, Charbonneau NL, Sakai LY. Fibrillin binds calcium and is coded by cDNAs that reveal a multidomain structure and alternatively spliced exons at the 5′ end. Genomics. 1993;17:476–484. doi: 10.1006/geno.1993.1350. [DOI] [PubMed] [Google Scholar]
- 2.Danielson KG, Baribault H, Holmes DF, Graham H, Kadler KE, Iozzo RV. Targeted disruption of decorin leads to abnormal collagen fibril morphology and skin fragility. J Cell Biol. 1997;136:729–743. doi: 10.1083/jcb.136.3.729. [DOI] [PMC free article] [PubMed] [Google Scholar]
- 3.Downing AK, Knott V, Werner JM, Cardy CM, Campbell ID, Handford P. Solution structure of a pair of Ca2+binding epidermal growth factor-like domains: implications for the Marfan syndrome and other genetic disorders. Cell. 1996;85:597–605. doi: 10.1016/s0092-8674(00)81259-3. [DOI] [PubMed] [Google Scholar]
- 4.Gibson MA, Hughes JL, Fanning JC, Cleary EG. The major antigen of elastin-associated microfibrils is a 31-kDa glycoprotein. J Biol Chem. 1986;261:11429–11435. [PubMed] [Google Scholar]
- 5.Gibson MA, Hatzinikolas G, Davis EC, Baker E, Sutherland GR, Mecham RP. Bovine latent transforming growth factor β 1-binding protein 2: molecular cloning, identification of tissue isoforms, and immunolocalization to elastin-associated microfibrils. Mol Cell Biol. 1995;15:6932–6942. doi: 10.1128/mcb.15.12.6932. [DOI] [PMC free article] [PubMed] [Google Scholar]
- 6.Gibson MA, Hatzinikolas G, Kumaritilake JS, Sandberg LS, Nicholl JK, Sutherland GR, Cleary EG. Further characterization of proteins associated with elastic fiber microfibrils including the molecular cloning of MAGP-2 (MP25) J Biol Chem. 1996;271:1096–1103. doi: 10.1074/jbc.271.2.1096. [DOI] [PubMed] [Google Scholar]
- 7.Handford P, Downing AK, Rao Z, Hewett DR, Sykes BC, Kielty CM. Defective calcium binding to an epidermal growth factor-like domain of fibrillin-1 causes the Marfan syndrome. J Biol Chem. 1995;270:6751–6756. doi: 10.1074/jbc.270.12.6751. [DOI] [PubMed] [Google Scholar]
- 8.Holmes DF, Mould AP, Chapman JA. Morphology of sheet-like assemblies of pN-collagen, pC-collagen and procollagen studied by scanning transmission electron microscopy mass measurements. J Mol Biol. 1991;220:111–123. doi: 10.1016/0022-2836(91)90385-j. [DOI] [PubMed] [Google Scholar]
- 9.Holmes DF, Watson RB, Steinmann B, Kadler KE. Ehlers-Danlos syndrome type VIIB. Morphology of type I collagen fibrils formed in vivo and in vitro is determined by the conformation of the retained N-propeptide. J Biol Chem. 1993;268:15758–15765. [PubMed] [Google Scholar]
- 10.Keene DR, Maddox K, Kuo H-J, Sakai LY, Glanville RW. Extraction of extendible beaded structures and their identification as fibrillin-containing extracellular microfibrils. J Histochem Cytochem. 1991;39:441–449. doi: 10.1177/39.4.2005373. [DOI] [PubMed] [Google Scholar]
- 11.Kielty CM, Shuttleworth CA. The role of calcium in the organisation of fibrillin microfibrils. FEBS (Fed Eur Biochem Soc) Lett. 1993;336:323–326. doi: 10.1016/0014-5793(93)80829-j. [DOI] [PubMed] [Google Scholar]
- 12.Kielty CM, Shuttleworth CA. Abnormal fibrillin assembly by dermal fibroblasts from two patients with Marfan syndrome. J Cell Biol. 1994;124:997–1004. doi: 10.1083/jcb.124.6.997. [DOI] [PMC free article] [PubMed] [Google Scholar]
- 13.Kielty CM, Shuttleworth CA. Fibrillin-containing microfibrils: structure and function in health and disease. Int J Biochem Cell Biol. 1995;27:747–760. doi: 10.1016/1357-2725(95)00028-n. [DOI] [PubMed] [Google Scholar]
- 14.Kielty CM, Cummings C, Whittaker SP, Shuttleworth CA, Grant ME. Isolation and ultrastructural analysis of microfibrillar structures from foetal elastic tissues. J Cell Sci. 1991;99:797–807. doi: 10.1242/jcs.99.4.797. [DOI] [PubMed] [Google Scholar]
- 15.Kielty CM, Davies SJ, Phillips JE, Jones CJP, Shuttleworth CA, Charles SJ. Marfan syndrome: fibrillin expression and microfibrillar abnormalities in a family with predominant ocular defects. J Med Genet. 1995;32:1–6. doi: 10.1136/jmg.32.1.1. [DOI] [PMC free article] [PubMed] [Google Scholar]
- 16.Kielty CM, Whittaker SP, Shuttleworth CA. Fibrillin: evidence that chondroitin sulphate proteoglycans are components of microfibrils and associate with newly-synthesised monomers. FEBS (Fed Eur Biochem Soc) Lett. 1996;386:169–173. doi: 10.1016/0014-5793(96)00423-1. [DOI] [PubMed] [Google Scholar]
- 17.Maddox BK, Sakai LY, Keene DR, Glanville RW. Connective tissue microfibrils. Isolation and characterisation of three large pepsin-resistant domains of fibrillin. J Biol Chem. 1989;264:21381–21385. [PubMed] [Google Scholar]
- 18.McConnell CJ, DeMont ME, Wright GM. Microfibrils provide non-linear elastic behavior in the abdominal artery of the lobster Homarus americanus. . J Physiol. 1997;499:513–526. doi: 10.1113/jphysiol.1997.sp021945. [DOI] [PMC free article] [PubMed] [Google Scholar]
- 19.Mecham, R.P., and J.E. Heusar. 1991. The elastic fiber. In Cell Biology of the Extracellular Matrix, 2nd Ed. E.D. Hay, editor. Plenum Press, New York. 79–109.
- 20.Muller SA, Goldie KN, Burki R, Haring R, Engel A. Factors influencing the precision of quantitative scanning transmission electron microscopy. Ultramicroscopy. 1992;46:317–334. [Google Scholar]
- 21.Pereira L, D'Alessio M, Ramirez F, Lynch JR, Sykes B, Pangilinan T, Bonadio J. Genomic organisation of the sequence coding for the fibrillin gene product in Marfan syndrome. Hum Molec Genet. 1993;2:961–968. doi: 10.1093/hmg/2.7.961. [DOI] [PubMed] [Google Scholar]
- 22.Reinhardt DP, Keene DR, Corson GM, Poschl E, Bachinger H-P, Gambee JE, Sakai LY. Fibrillin-1: organisation in microfibrils and structural properties. J Mol Biol. 1996;258:104–116. doi: 10.1006/jmbi.1996.0237. [DOI] [PubMed] [Google Scholar]
- 23.Reinhardt DP, Mechling DE, Boswell BA, Keene DR, Sakai LY, Bachinger HP. Calcium determines the shape of fibrillin. J Biol Chem. 1997;272:7368–7373. doi: 10.1074/jbc.272.11.7368. [DOI] [PubMed] [Google Scholar]
- 24.Sakai LY, Keene DR, Engvall E. Fibrillin, a new 350-kD glycoprotein, is a component of extracellular microfibrils. J Cell Biol. 1986;103:2499–2509. doi: 10.1083/jcb.103.6.2499. [DOI] [PMC free article] [PubMed] [Google Scholar]
- 25.Sakai LY, Keene DR, Glanville RW, Bachinger H-P. Purification and partial characterisation of fibrillin, a cysteine-rich structural component of connective tissue microfibrils. J Biol Chem. 1991;266:14763–14770. [PubMed] [Google Scholar]
- 26.Sherratt MJ, Holmes DF, Shuttleworth CA, Kielty CM. Scanning transmission electron microscopy mass analysis of fibrillin-containing microfibrils from foetal elastic tissues. Int J Biochem Cell Biol. 1997;29:1063–1070. doi: 10.1016/s1357-2725(97)00028-9. [DOI] [PubMed] [Google Scholar]
- 27.Taipale J, Saharinen J, Hedman K, Keski-Oja J. Latent transforming growth factor-beta-1 and its binding protein are components of extracellular matrix microfibrils. J Histochem Cytochem. 1996;44:875–889. doi: 10.1177/44.8.8756760. [DOI] [PubMed] [Google Scholar]
- 28.Thurmond FA, Trotter JA. Morphology and biomechanics of the microfibrillar network of sea-cucumber dermis. J Exp Biol. 1996;199:1817–1828. doi: 10.1242/jeb.199.8.1817. [DOI] [PubMed] [Google Scholar]
- 29.Wess TJ, Purslow PP, Kielty CM. Fibrillin-rich microfibrils: an X-ray diffraction study of the fundamental axial periodicity. FEBS (Fed Eur Biochem Soc) Lett. 1997;413:424–428. doi: 10.1016/s0014-5793(97)00950-2. [DOI] [PubMed] [Google Scholar]
- 30.Wess TJ, Wess L, Hocking PM. The structure of avian cartilage: a combined X-ray and biochemical analysis. J Comp Pathol. 1997;116:145–155. doi: 10.1016/s0021-9975(97)80072-2. [DOI] [PubMed] [Google Scholar]
- 31.Wess TJ, Wess L, Hammersley AP, Miller A. Molecular packing of type I collagen in tendon. J Mol Biol. 1998;275:255–267. doi: 10.1006/jmbi.1997.1449. [DOI] [PubMed] [Google Scholar]


