

Abstract
A growing body of evidence indicates that individual ribosomal proteins and changes in their expression, participate in, and modulate, a variety of cellular activities. Our earlier studies have found that apoptosis could be induced by inhibiting expression of ribosomal protein S3a (RPS3a) in many tumor cells which constitutively express RPS3a at levels much higher than in normal cells. This study aimed to investigate cellular responses to enhancement of RPS3a expression, and whether apoptosis could be induced by sequential alterations in RPS3a expression involving enhancement from an initially low constitutive level, followed by suppression. Stably transfected NIH 3T3– derived cell lines were established in which exogenous RPS3a expression could be readily manipulated. Enhancement of RPS3a expression appeared to induce transformation as assessed by well-established criteria such as foci formation and anchorage-independent growth in vitro, and formation of tumors in nude mice. These properties were compared with those observed in ras-transformed NIH 3T3 cells. Apparent transformation occurred only when enhanced RPS3a-expressing cells were in close cell–cell contact. Suppression of enhanced RPS3a expression was observed to induce apoptosis as assessed by various morphological and biochemical characteristics including cell shrinkage, membrane blebbing, chromatin condensation, nuclear and cell fragmentation, phosphatidylserine externalization, and internucleosomal DNA fragmentation. This induction of apoptosis was not specific to apparently transformed cells, as cells at low confluence, which likewise expressed RPS3a at enhanced levels but exhibited no morphological transformation, underwent apoptosis when RPS3a expression was inhibited. These results support a role for RPS3a in the apoptotic process, but not as an oncoprotein per se.
Many eukaryotic gene products demonstrate remarkable diversity and plasticity of function, a feature that could extend to those involved in fundamental cellular machinery such as the translational apparatus. The eukaryotic ribosome is composed of four ribosomal RNA (rRNA) molecules and >70 ribosomal proteins (Wool et al., 1990). It has been speculated that the primordial ribosome consisted only of rRNA and that ribosomal proteins represent a later evolutionary acquisition to facilitate protein synthesis (Wool et al., 1990, 1995). According to such conjecture, ribosomal proteins may have been recruited from among a set of preexisting proteins that originally possessed, and may have retained other cellular functions. Alternatively, and not exclusively, it is possible that ribosomal proteins may have been specifically designed for the ribosome and could be recruited for extraribosomal functions (Wool et al., 1995; Wool, 1996).
Regardless of the primordial sequence of events, there is increasing evidence that ribosomal proteins are capable of extraribosomal functions. For example, ribosomal proteins P0 and S3 appear to possess apurinic/apyrimidinic endonuclease activity that has strongly implicated these proteins in DNA repair functions (Grabowski et al., 1991; Kim et al., 1995). Various other ribosomal proteins have been implicated in the regulation of development. For example, haploinsufficiency of the ribosomal protein S4 genes has been suggested to contribute to anatomic abnormalities associated with the Turner syndrome in humans (Fisher et al., 1990). In Drosophila, mutations in the ribosomal protein S2 gene appear to cause arrest of oogenesis (Cramton and Laski, 1994), whereas mutations in the ribosomal protein S6 gene apparently cause melanotic tumor formation, lymph gland hyperplasia, and abnormal blood cell differentiation (Watson et al., 1992).
Ribosome biogenesis is dependent on coordinate, stoichiometric production of ribosomal proteins and rRNAs (Mager, 1988). Increased overall ribosome biogenesis is a common feature of active proliferation. However, independent, noncoordinate changes in expression of an individual ribosomal protein gene, or of a subset of ribosomal protein genes, can occur under various cellular conditions, and have no direct association or correlation with proliferative and/or protein synthetic activities per se (Ferrari et al., 1990; Seshadri et al., 1993). Indeed, the apparent lack of association in various tumors between the differentially enhanced expression of several ribosomal protein genes and proliferative activity, when compared with normal tissues, has raised the possibility that such enhancement could be involved in transformation (Pogue-Geile et al., 1991; Barnard et al., 1993; Starkey and Levy, 1995).
Growth and homeostasis of normal and tumor tissues are regulated by the opposing processes of cell proliferation and cell death by apoptosis (Wyllie, 1992; Steller, 1995). Although cessation of ribosome biogenesis and disintegration of the translational apparatus are eventualities of cell death, there has been little study to date as to the possible involvement of an individual ribosomal protein in regulating the apoptotic process. In earlier work, we characterized a cDNA clone, nbl, isolated on the basis of its abundance in a Namalwa Burkitt Lymphoma library (Naora et al., 1995). The putative product of the nbl clone was found to be identical to human ribosomal protein S3a (RPS3a)1 (Metspalu et al., 1992), except for one residue in the COOH-terminal half. The putative nbl gene has been found to be constitutively expressed at high levels in a number of tumor cell lines in which apoptosis can be induced by lowering such high nbl expression by treatment with actinomycin D (Act D) (Naora et al., 1996) and, more specifically, by antisense-mediated mechanisms (Naora et al., 1998). However, the involvement of alterations in nbl expression in inducing apoptosis in cells in which this gene is normally expressed at low levels is less clear. It has been observed in the normal mouse thymus, that the initially low constitutive level of nbl expression markedly rises and then abruptly falls during glucocorticoid-induced apoptosis in vivo, and that inhibition of the transient nbl enhancement by Act D blocks thymic apoptosis (Naora et al., 1995). These findings give rise to the possibility that apoptosis could be induced by coordination of sequential shifts in nbl expression from initially low to high levels followed by a return to low levels. Such a possibility has, however, not yet been experimentally examined.
Given that the sizes of the single transcript detected by the nbl clone, and of the protein detected by antiserum raised against the nbl product, are identical to those of RPS3a, it is likely that the putative nbl gene product is identical to human RPS3a, and that the unique residue in the original nbl clone is either a mutation in the natural population or a cloning artifact. In view of our findings using the nbl clone and of increasing evidence of “multi-functionality” of individual ribosomal proteins, we aimed in the present study to investigate a possible causal relationship between sequential up- and downregulation of RPS3a expression and induction of apoptosis in a model system in which exogenous human RPS3a expression could be readily manipulated. Furthermore, in view of findings that nbl is constitutively expressed in tumor tissues at levels generally higher than in normal tissues (Naora et al., 1995), we investigated whether enhancement of exogenous RPS3a expression was associated with transformation by comparison with morphological features of ras-transformed NIH 3T3 cells.
Materials and Methods
Plasmids
The pMSG vector (Pharmacia Biotech Sevrage, Uppsala, Sweden) contains the mouse mammary tumor virus long terminal repeat (MMTV LTR) upstream of a polylinker, and the Escherichia coli xanthine–guanine phosphoribosyl-transferase (gpt) gene, which provides a marker for selecting stable transformants. A nbl cDNA clone, which included the 5′ untranslated region (UTR) and was cloned into the vector pUC118, was provided by Dr. Y. Shindo (Cellular Technology Institute, Tokushima, Japan). A 0.6-kb XcmI fragment, containing a major proportion of the protein-coding region, was removed from the nbl cDNA clone and replaced with the corresponding XcmI fragment from a human RPS3a cDNA clone 108.1.3, which was provided by A. Metspalu (Institute of Molecular and Cell Biology, Tartu, Estonia). This exchange yielded a clone containing the complete protein coding region plus 5′- and 3′-UTRs, which are identical to those of human RPS3a (Metspalu et al., 1992; these sequence data are available from GenBank/EMBL/DDBJ under accession number M77234). The cDNA insert was resected from pUC118 by EcoRI digestion, cloned into the EcoRI site of the pBluescript SK− vector (Stratagene, La Jolla, CA), and then resected by SmaI/XhoI digestion and cloned into SmaI/XhoI polylinker sites of pMSG in sense orientation relative to the MMTV LTR. The resultant construct was designated pMSG-RPS3a (see Fig. 1). Both pMSG vector DNA and pMSG-RPS3a plasmid DNA were linearized by PvuI digestion and used to transfect NIH 3T3 cells.
Figure 1.

Schematic diagram of plasmid pMSG-RPS3a. A human RPS3a cDNA, containing the complete protein coding region plus 5′ and 3′ UTRs and expressed under the control of the MMTV LTR, and the SV-40 early promoter–driven gpt gene, are present in the same orientation. The 950-bp EcoRI fragment containing the RPS3a cDNA and the 950-bp HindIII–AatII fragment of the gpt gene were used as probes for Southern and Northern blot analyses.
Transfection of NIH 3T3 Cells and Maintenance of Stable Transfectants
NIH 3T3 cells were cultured in DME (Flow Laboratories, Irvine, UK) containing 10% FCS, 100 units/ml penicillin, 100 μg/ml streptomycin, and 2 mM glutamine, hereafter referred to as “normal medium.” Stable transfections were performed using the CaPO4 method of the Mammalian Transfection Kit (Stratagene), essentially according to manufacturer's instructions, except that linearized, not circular, plasmid DNA was used. After transfection, cells were cultured in normal medium for 3 d before applying selection for the gpt gene in the form of “gpt medium,” which is composed of DME plus the following supplements: 10% dialyzed FCS, 100 units/ml penicillin, 100 μg/ml streptomycin, 2 mM glutamine, 250 μg/ml xanthine, 100 μM hypoxanthine, 18 μg/ml thymidine, 10 μg/ml glycine, 0.4 μM aminopterin, and 25 μg/ml mycophenolic acid. After 7–12 d culture in gpt medium, colonies of stably transfected cells were isolated. Transfectant clones were maintained routinely and continuously in gpt medium unless otherwise mentioned.
Manipulation of Expression of the RPS3a and gpt Genes In Vitro
Expression of a cloned MMTV LTR–driven gene and of the 3′-linked gpt gene were manipulated essentially as described previously (Xu et al., 1991; Naora et al., 1994). Briefly, to induce exogenous RPS3a expression, stably transfected cells, cultured in gpt medium, were washed twice with HBSS and, unless otherwise mentioned, cultured for 1–2 d in normal medium containing 1 μM dexamethasone (Dex) (Sigma Chemical Co., St. Louis, MO), hereafter called “Dex medium.” Since MMTV LTR–driven gene expression tends to decline after 24 h (Naora et al., 1994), Dex medium was supplemented with a fresh daily addition of Dex, where incubation extended for >1 d. To suppress exogenous RPS3a expression, Dex-stimulated cells were washed twice with HBSS, and then cultured for 1–2 d in gpt medium. Similar alterations of culture conditions were carried out to manipulate exogenous human (mutated) H-ras expression in the ras-transformed NIH 3T3–derived cell lines 1-6 and 1-5 (Xu et al., 1991; Naora et al., 1994). In other experiments, Act D (Sigma Chemical Co.) was added to cells at a final concentration of 1 μg/ml.
Microscopic Examinations of Cell Viability, Morphology, Anchorage Dependence, and Cell Surface Changes
Cell counting was performed using aliquots of cell suspensions after trypsinization and/or centrifugation. Growth kinetics of cells in various culture media were analyzed using 96-well plates containing 200 μl medium per well. At day 4, old medium was removed, detached cells collected by centrifugation, resuspended in 200 μl fresh medium, and then transferred to the original well for continuation of culture. Nonviable cells were assessed by their uptake of trypan blue dye. Apoptotic cells, which excluded trypan blue dye, were assessed by well-established morphological criteria such as distinct cell shrinkage and membrane blebbing described in Wyllie et al. (1980). These criteria were routinely used in this study, as induction of such morphology strongly correlates with other typical apoptotic changes such as chromatin condensation, nuclear and cell fragmentation and internucleosomal DNA cleavage (Wyllie et al., 1980; Naora and Naora, 1995; Naora et al., 1996). Cells were prepared for Giemsa staining by cytocentrifugation to allow detailed examination of chromatin distribution. Foci formation was examined by phase contrast microscopy or by Giemsa staining of culture plates. Before staining, plates were washed with HBSS, and then with a 1:1 mixture of HBSS and methanol, followed by fixation in 100% methanol. To examine anchorage-independent growth, cells cultured at 30–80% confluence were resuspended in gpt or Dex medium at 3 × 10³ cells/150 μl, and cultured for 3–5 d in wells of 96-well plates coated with poly 2-hydroxyethylmethacrylate (poly[HEMA]) (Sigma Chemical Co.) as described in Fukazawa et al. (1995). Cells cultured in gpt or Dex medium immediately formed large aggregates when seeded in coated wells. Changes in size of the formed aggregates were examined using an ocular micrometer. Phosphatidylserine externalization was examined using the ApoAlert Annexin V Apoptosis kit (CLONTECH, Palo Alto, CA), according to manufacturer's instructions, and cells were observed by fluorescence and differential interference contrast microscopy using an Axioplan microscope (Carl Zeiss Inc., Jena, Germany).
Formation of Solid Tumors in Nude Mice
Animal experiments were performed according to protocols approved by The Australian National University (Canberra, A.C.T., Australia). 1 × 10⁶ cells of transfected cell lines cultured in Dex medium to ∼80% confluence, or of the parental NIH 3T3 cell line cultured in normal medium, were suspended in PBS and subcutaneously inoculated into the shoulders or rump of 4-wk-old male nude (Swiss nu/nu) mice. Number of mice bearing tumors >3 mm in diam were scored. 4–5 mg of the resultant solid tumors were subcutaneously inoculated and tumor lines subsequently maintained by repeated inoculation.
Isolation and Analyses of RNA and DNA
Isolation and Northern blot analysis of RNA, and quantitation of mRNA levels by PhosphorImager analysis (Molecular Dynamics, Sunnyvale, CA) were performed as described in Naora et al. (1995). Genomic DNA was isolated and electrophoresed as previously described (Naora et al., 1995), and immobilized on Hybond C extra membrane (Amersham Intl., Little Chalfont, UK). 32P-labeled DNA probes were prepared using the Random Primed DNA Labeling Kit (Boehringer Mannheim GmbH, Mannheim, Germany) and hybridization carried out using ExpressHyb Hybridization Solution (CLONTECH).
Measurement of Protein Synthetic Activity
Protein synthetic activity was assayed by measuring incorporation of [3H]leucine into TCA-insoluble material. Culture of 104 and 2 × 10⁴ cells, originally seeded in gpt medium in 24-well plates, was continued in gpt medium or switched to Dex medium for 2 d. Cells were then incubated for 4 h in gpt or Dex medium containing 10% dialyzed FCS and 30 μCi/ml of l-[4,5-3H]leucine (152 Ci/mmol; Amersham Intl.). For cell counting, duplicate plates were incubated without [3H]leucine. All assays were performed using samples of duplicate wells. After incubation, attached and detached cells were treated with cold 10% TCA, followed by washing with cold TCA, and then methanol. TCA-insoluble material was dissolved in 0.3 M NaOH/1% sodium lauryl sulfate. Radioactivity was counted by liquid scintillation in 5.0 ml of Emulsifier-Safe (Packard, Meriden, CT). Attached and detached cells in duplicate plates were pooled together for counting. Radioactivity incorporated was expressed as a relative value in terms of radioactivity per 104 cells.
Results
Isolation and Characterization of Stable RPS3a Transfectants
To investigate the functional consequences of enhancing RPS3a expression, NIH 3T3 cells were stably transfected with the plasmid pMSG-RPS3a, which was composed of a full-length human RPS3a cDNA cloned into the pMSG vector, in sense orientation relative to the glucocorticoid-inducible MMTV LTR (Fig. 1). The selective marker gene gpt, which is expressed under the control of the SV-40 early promoter, was located downstream of, and in the same orientation as, the RPS3a cDNA insert (Fig. 1). Seven stably transfected clones, termed the S series, were isolated after transfection of NIH 3T3 cells with pMSG-RPS3a. As a control, NIH 3T3 cells were also transfected with the pMSG vector and six resultant clones, termed the P series, were isolated. Stable transfectants in both series were selected by culture in gpt medium, recloned once or twice from a single cell by limiting dilution, and routinely maintained in gpt medium. At the initial selection stage, the clones varied from one another in their growth rates.
In earlier work, we found that expression of a MMTV LTR–driven cloned gene and of the closely linked gpt gene can be readily manipulated when only a few (but preferably one) copies of the linked gene pair were stably integrated (Xu et al., 1991; Naora et al., 1994). In such studies, we observed that NIH 3T3 cells, which took up several copies of the plasmid DNA, tended to grow rapidly in gpt medium, whereas transfectants containing only one or two copies initially grew slowly in this medium. In the present experiments, we therefore isolated and recloned transfectant clones of the S and P series that showed slowest growth in gpt medium. These were termed S-8 and S-12, and P-7 and P-12. Growth of these cell lines improved after initial culture in gpt medium for several weeks. Each cell line grew as a monolayer and exhibited typical normal cell morphology, with growth being inhibited once confluency was reached. The growth rates of S-12 and P-12 were very similar in gpt medium, with doubling times of 23 and 22 h, respectively (Fig. 2). In contrast, parental NIH 3T3 cells, which do not express the gpt gene, were unable to survive in gpt medium.
Figure 2.

Growth curves of P-12 and S-12 cells. P-12 (•) and S-12 (○) cells were plated at 0.7 × 10³ cells per well and cultured in gpt medium. S-12 cells were likewise plated and cultured in Dex medium (▵). The total cell number per well was determined every 2 d thereafter. Data represent the mean ± SD of duplicate or triplicate wells. Culture medium was removed on day 4, and detached cells collected, resuspended in fresh medium, and then transferred to the original well for continuation of culture. Values observed for P-12 and S-12 cells cultured in gpt medium were very similar at a given time point, and these values are plotted to the right and left sides of the appropriate time point. The growth curve of P-12 cells cultured in Dex medium (not shown) was almost identical to that of P-12 cells cultured in gpt medium.
Southern blot analysis was performed to determine copy numbers of integrated plasmid DNA. Genomic DNA of P-7 and P-12 were digested with SmaI, which cleaves the polylinker, and hybridized with a 950-bp HindIII/AatII fragment containing most of the gpt gene (Fig. 1). One band was detected in P-7 and in P-12, indicating these cell lines each contain one stably integrated copy of the pMSG vector (Fig. 3 a). This was confirmed by detection of two gpt-positive bands in hybridization patterns of P-7 and P-12 DNA digested with EcoRV (Fig. 3 a), which cleaves the gpt gene (Fig. 1). Hybridization of EcoRV-digested DNA of S-8 and S-12 with the gpt probe revealed a common 1.8-kb fragment extending 3′ of the RPS3a cDNA to the middle of the gpt gene (Fig. 1), its intensity being greater in S-8 (Fig. 3 b). Two additional bands were detected in S-8, whereas S-12 contained one unique band, indicating that these cell lines contain two and one integrated copies, respectively, of the RPS3a-gpt gene pair. This was verified by the relative intensities of a common 2.4-kb HindIII fragment extending from the MMTV LTR to the 3′ end of the RPS3a cDNA (Fig. 1), detected by the RPS3a cDNA probe (Fig. 3 c). The integration of one copy of the RPS3a- gpt gene pair in the S-12 genome was further confirmed by the detection of one unique RPS3a-positive band in EcoRV-digested S-12 DNA, but not in parental NIH 3T3 DNA (Fig. 3 d). In view that P-12 and S-12 showed very similar growth rates and contained one integrated copy of the pMSG vector and pMSG-RPS3a plasmid, respectively, these transfectants were routinely used for further experiments.
Figure 3.

Determination of stable integration by Southern blot analysis of genomic DNA. (a) SmaI- and EcoRV-digested DNA of parental NIH 3T3 cells and P-7 and P-12 transfectants, and (b) EcoRV-digested DNA of NIH 3T3 and S-8 and S-12 transfectants, were hybridized with the gpt probe. (c) HindIII-digested DNA of NIH 3T3, S-8, and S-12 cells, and (d) EcoRV-digested DNA of NIH 3T3 and S-12 cells, were hybridized with the RPS3a cDNA probe. The fragments derived from transfected RPS3a/gpt sequences are shown by ◂. Sizes of HindIII- or PstI-digested λ DNA fragments (in kb) are shown at the left of each panel.
Involvement of Enhanced RPS3a Expression in Transformation: Foci Formation In Vitro
As described earlier, both the P-12 and S-12 transfectants grew as a monolayer in gpt medium, and exhibited typical normal cell morphology similar to that of parental NIH 3T3 cells. Endogenous RPS3a mRNA levels were similar in these cells, and did not significantly differ from the level in parental NIH 3T3 cells (Fig. 4, lanes 1, 2, and 5). It should be noted that levels of RPS3a mRNA generally correlate with those of RPS3a protein, and that the constitutive RPS3a mRNA level in NIH 3T3 cells is only slightly higher than the levels detected in various normal mouse tissues such as brain, thymus, lung, and liver (data not shown), which are much lower than levels detected in various tumor tissues and cell lines (Naora et al., 1995, 1998). In view of its favorably low level of endogenous RPS3a expression, compared with a variety of other cell lines, the NIH 3T3 cell line represented an ideal model system in which cellular responses to sequential enhancement and suppression of exogenous RPS3a expression could be examined. The NIH 3T3 cell line has been, and still is, used in numerous studies as a classic model system for assessing transforming ability of various oncogenes, although this cell line has been known to be “partially transformed.” However, in view that typical oncogenic transformation patterns induced by human (mutated) H-ras have been well characterized in NIH 3T3 cells using the same transfection vector as used in the present study (Xu et al., 1991; Naora et al., 1994), the transforming ability of enhanced RPS3a expression was primarily assessed in NIH 3T3 cells under experimental conditions comparable with those used to investigate H-ras.
Figure 4.
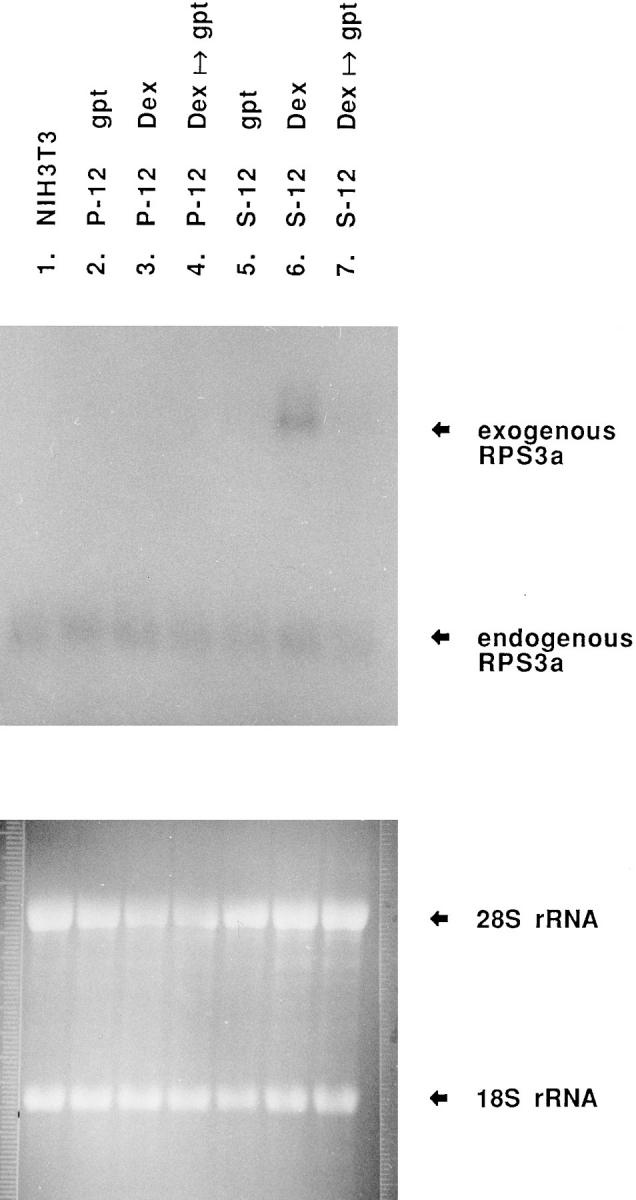
Northern blot analysis of RPS3a expression. RNA was isolated from parental NIH 3T3 cells cultured in normal medium (lane 1), and from P-12 and S-12 cells cultured in gpt medium (lanes 2 and 5), switched to Dex medium for 2 d (lanes 3 and 6), and then switched back to gpt medium for 1 d (lanes 4 and 7). 8 μg of RNA was electrophoresed on a 1.6% agarose gel and used to prepare a Northern blot that was hybridized with the RPS3a cDNA probe. Endogenous RPS3a mRNAs were detected in all samples. The longer exogenous RPS3a transcripts were induced in S-12 cells switched from gpt to Dex medium (lane 6), and then inhibited when cells were switched back to gpt medium (lane 7). Equalization of RNA content was checked by visualizing 28S and 18S rRNAs on the ethidium bromide–stained RNA gel.
Exogenous RPS3a expression was not detected in S-12 cells cultured in gpt medium. However, significant MMTV LTR–driven exogenous RPS3a expression was induced when gpt medium was replaced with Dex medium (Fig. 4, compare lanes 5 and 6). Endogenous RPS3a expression levels in S-12 and in P-12 cells were not significantly altered by switching these cells from gpt to Dex medium (Fig. 4, compare lanes 5 and 2 to lanes 6 and 3). When switched to Dex medium, high confluence cultures of S-12 cells noticeably formed multicellular layers of overlapping cells, and exhibited refractile morphology and marked foci formation (Fig. 5, compare a with b and c; Fig. 6, compare c and d). Transformed foci (19 per 104 cells) formed in S-12 cultures at 80% confluence. However, no foci were observed in cultures at <50% confluence. Morphological features observed in S-12 cells at high cell density are characteristic of transformation in vitro, which we have observed in ras-transformed NIH 3T3 cells (Naora et al., 1994) and which other workers have observed in cells transformed with E2F-1 (Johnson et al., 1994) and eIF-4E (Lazaris-Karatzas et al., 1990). The typical morphological transformation exhibited by S-12 cells was also observed at high cell density when S-8 cells, possessing two integrated RPS3a-gpt copies, were switched from gpt to Dex medium (data not shown). In contrast, P-12 cells remained as a monolayer even at high cell density when switched from gpt to Dex medium (Fig. 5, compare f with g and h). No foci formation was observed in P-12 cultures (Fig. 6, compare a and b). No foci formation was observed in another pMSG vector transfectant, P-7, under equivalent culture conditions, nor when parental NIH 3T3 cells were cultured in Dex medium. It appears therefore that typical morphological features of in vitro transformation are specific to cells expressing enhanced levels of RPS3a at high cell density.
Figure 5.
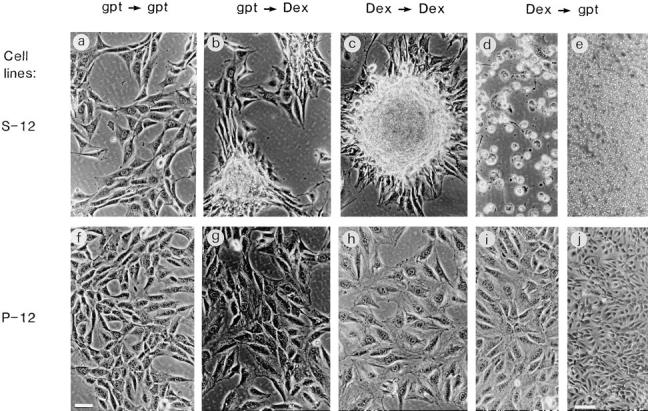
Alterations in morphology of S-12 (a–e) and P-12 (f–j) cells. Cells were cultured in gpt medium (a and f), switched to Dex medium for 1 d (b and g), cultured in fresh Dex medium for an additional day (c and h), and then switched back to gpt medium for 1 d (d and i, and e and j at lower magnification). S-12 cells began to pile up when switched from gpt to Dex medium (b). A typical transformed focus formed when culture was continued in Dex medium is shown in c. Switching S-12 cells from Dex to gpt medium resulted in massive detachment from the substratum and loss of viability (d and e). In contrast, the same alterations in culture conditions did not significantly change the morphology of P-12 cells. Bar in f: (a–d, f, and g–i) 50 μm; bar in j: (j and e) 150 μm.
Figure 6.

Foci formation in P-12 and S-12 cultures. P-12 (a and b) and S-12 (c and d) cells were plated at 1.5 × 10⁵ cells in six-well plates and cultured in either gpt or Dex medium until growth reached ∼70–80% confluence. Cells were fixed and stained with Giemsa. Note that darkly and weakly stained foci were widely observed only when S-12 cells were cultured in Dex medium (d). Bar, 1 mm.
Although the doubling times of S-12 cells in Dex and gpt medium did not greatly differ (26 and 23 h, respectively), logarithmic growth in Dex medium extended well beyond the stage that was contact-inhibitory in gpt medium (Fig. 2). The saturation cell density in Dex medium was more than twice that observed in gpt medium. It is highly likely that such increased saturation cell density is due to the formation of multicellular layers of overlapping cells, including development of foci. Increased saturation cell density has also been observed in cells transformed with eIF-4E (Lazaris-Karatzas et al., 1990). It should be noted that the protein synthetic activity of logarithmically growing S-12 cells in gpt medium was just as active as that of S-12 cells in Dex medium (relative activity: 1 in gpt medium; 1.05 ± 0.07 in Dex medium). This observation correlated with the finding that the logarithmic growth rate in gpt medium does not greatly differ from that in Dex medium. The parental NIH 3T3 cell line has been reported to form transformed foci when cultured at high cell density for extended periods (>7 d) in low FCS (<5%) medium (Rubin and Ellison, 1991). In this study, foci-forming ability was compared in NIH 3T3–derived cell lines cultured at high cell density in medium containing 10% FCS for shorter periods. It should be noted that the foci formation observed in cultures of S-12 cells expressing exogenous RPS3a (i.e., in Dex medium) and at high cell density is highly unlikely to be attributable alone to any propensity of NIH 3T3 cells to undergo transformation at high cell density, since S-12 cells in gpt medium (in which exogenous RPS3a was not expressed), and P-12 cells in either gpt or Dex medium, demonstrated contact-inhibitory growth and no foci formation at a similar high cell density (Figs. 2 and 6).
Anchorage-independent Growth of Cells Expressing Enhanced RPS3a Levels
It has been well accepted that loss of anchorage dependence is a typical feature of in vitro transformation, although the molecular events underlying anchorage independence are not yet fully understood. To further investigate the transforming ability of enhanced RPS3a expression, growth of P-12 and S-12 cells were compared when cell adhesion and spreading on a substratum were inhibited by coating wells with the nontoxic polymer poly(HEMA) (Re et al., 1994; Fukazawa et al., 1995). Cell growth in poly(HEMA)-coated wells bears strong correlation with anchorage-independent growth in soft agar (Fukazawa et al., 1995). The use of poly(HEMA)-coated wells was more advantageous for the present study, than the traditional soft agar assay, given the limited effectiveness of MMTV LTR–stimulatory factors in culture and the requirement to maintain enhanced MMTV LTR–driven exogenous RPS3a expression. Furthermore, the use of poly(HEMA)-coated wells allowed ready manipulation of culture conditions. When P-12 and S-12 cells were seeded in gpt medium in poly(HEMA)-coated wells, cells of both lines retained a round shape and formed large spherical aggregates (Fig. 7, a and c) that did not significantly alter in shape or size for 3–4 d. Although a few cells occasionally died and were released into the medium during this incubation period, most cells in these aggregates excluded trypan blue dye, and were able to proliferate when subsequently transferred to gpt medium in uncoated wells. When morphologically untransformed S-12 cells, after preculture in gpt medium, were switched to Dex medium in poly(HEMA)-coated wells, large spherical aggregates that initially formed were observed to dissemble slowly into smaller aggregates or single cells, and begin to proliferate (Fig. 7 d). These growth patterns are similar to those of H-ras–transformed cells cultured in poly(HEMA)- coated wells (Fukazawa et al., 1995). As S-12 cells immediately aggregated and came in close cell–cell contact within the aggregates when seeded in poly(HEMA)-coated wells, irrespective of their preculture confluence, we were unable to examine whether anchorage-independence requires prior growth at high cell density. In contrast, P-12 cells remained in the original spherical aggregates in poly(HEMA)-coated wells when cultured in Dex medium (Fig. 7 b) without any proliferation during the same period as S-12 cells. These observations suggest that cells, in which RPS3a expression is enhanced, exhibit anchorage-independent growth characteristic of transformation.
Figure 7.

Growth of P-12 and S-12 cells in poly(HEMA)-coated wells. P-12 and S-12 cells were plated at 3 × 10³ cells in poly(HEMA)-coated 96-well plates, and maintained in gpt or Dex medium for 4 d. Growth of S-12 cells was observed in Dex medium (d) but not in gpt medium (c). P-12 cells formed aggregates and were unable to grow in gpt (a) or Dex (b) medium. Bar, 50 μm.
Formation of Solid Tumors in Nude Mice
A third characteristic of transformed cells is their ability to form tumors in nude mice. S-12 cells, cultured at high confluence in Dex medium, were subcutaneously injected into nude mice. Large solid tumors were formed at the site of injection in six out of eight mice during periods of 35–77 d. Subsequent inoculation of mice with tissue from resultant nodules readily formed tumors that could be maintained by repeated inoculation. In contrast, no tumors were formed in any of 5 mice after injection of P-12 cells during similar or longer periods (73–168 d). Injection of parental NIH 3T3 cells also failed to produce tumors. The results observed with S-12 cells contrast with the high tumorigenic capacity of 1–6 cells, which are NIH 3T3 cells stably transformed with one copy of MMTV LTR–driven, mutated human c-H-ras. Injection of 1–6 cells resulted in formation of rapidly growing tumors in all of the tested mice within a much shorter period than S-12 cells (<21 d) (Xu et al., 1991). These results suggest that enhanced RPS3a expression in cells cultured at high cell density has some transforming ability, though not as strong as that of mutated c-H-ras. It should be noted that MMTV LTR–driven gene expression was rapidly initiated and maintained in vivo by the presence of strong MMTV LTR–stimulatory factors present in mice such as hydrocortisone and testosterone, even when cells were precultured in gpt medium before injection (Xu et al., 1991). It was found, furthermore, that injected cells were locally present in close cell–cell contact, and survived at the injected site for a period of a few weeks. For these reasons, tumor formation of S-12 cells precultured in gpt medium or in Dex medium at low cell density were not assessed.
Suppression of Enhanced Exogenous RPS3a Expression Induces Cell Detachment and Loss of Viability
Interference of expression of a gene by activating expression of a closely linked gene in the same orientation has been described as a cis-acting gene–gene interaction (Naora and Deacon, 1982; Naora, 1986). We have demonstrated this phenomenon in NIH 3T3 cells stably transfected with a MMTV LTR–driven c-H-ras gene closely linked to, and in the same orientation as, the gpt gene (Xu et al., 1991; Naora et al., 1994). These cells exhibited typical malignant transformation when cultured in Dex medium, which stimulated MMTV LTR–driven c-H-ras expression. This expression was severely inhibited when expression of the neighboring gpt gene was enforced by switching cells to gpt medium. Although MMTV LTR– driven, exogenous gene expression can be suppressed by removing Dex from the culture medium, such suppression is considerably less effective than inhibition mediated by enforcing neighboring gpt expression, because of the presence of MMTV LTR stimulatory factors in the medium. In the present study, we therefore used the principle of enforcing expression of the neighboring gpt gene to ensure drastic suppression of enhanced exogenous RPS3a expression. The significant exogenous RPS3a expression induced in S-12 cells by culture in Dex medium was markedly suppressed when Dex medium was removed, the cells washed with HBSS, and then exposed to gpt medium (Fig. 4, compare lanes 6 and 7). Such drastic downregulation of RPS3a expression, after transient enhancement, has been observed in thymocytes in vivo, before massive apoptotic cell death (Naora et al., 1995). Switching culture medium did not significantly alter the level of endogenous RPS3a expression (Fig. 4, lanes 6 and 7).
The morphology and viability of S-12 cells was observed to alter drastically when switched from Dex to gpt medium. Cells became markedly rounded in shape and detached from the substratum (Fig. 5, compare b and c with d and e). Rapid growth of S-12 cells cultured in Dex medium immediately halted when switched to gpt medium, and after 1 d, ∼80–90% of the cell population shown in Fig. 5, d and e had lost viability. S-12 cells continued to grow if maintained only in Dex medium. S-8 cells, possessing two linked RPS3a-gpt copies, also showed massive cell death when switched from Dex to gpt medium (data not shown). In contrast, P-12 cells exhibited no significant alterations in morphology and viability when switched from Dex to gpt medium (Fig. 5, compare g and h with i and j). Likewise, no massive cell death nor change in morphology were exhibited by another pMSG vector transfectant P-7. These results indicate that cell detachment and loss of viability is attributable to inhibition of enhanced exogenous RPS3a expression, rather than to the switch in culture conditions per se.
It should be noted that S-12 cells that remained attached to the substratum and escaped death, after conversion from Dex to gpt medium, showed slow recovery in growth. This raises the possibility of heterogeneity in the cell population. As described earlier, the original cloning and subsequent routine maintenance of S-12 (and S-8) cells were carried out in gpt medium in which good growth was observed. At early stages of the present study, ∼80–90% of the S-12 cell population was observed to die when cells, routinely maintained in gpt medium, were switched to Dex medium and then back to gpt medium, as shown in Fig. 5, d and e. The population of death-sensitive cells appeared to gradually decline after routine maintenance in gpt medium for many passages. Nearly 2 yr after the original cloning of the S-12 cell line, ∼40–60% of exogenous RPS3a-expressing cells died by switching from Dex to gpt medium (see later description). Death-resistant cells appeared to remain even after the S-12 cell line was recloned by limiting dilution. It seems that the intrinsic death-sensitive nature of S-12 cells was altered by prolonged maintenance and death-resistant cells selectively remained in the population.
Loss of Viability Occurs by Apoptosis
The appearance of rounded cell morphology and detachment from the substratum has been observed in various adherent cells undergoing cell death by apoptosis in vitro (Evans and Dive, 1993; Desjardins and MacManus, 1995). The following observations provided evidence that the loss of viability, induced by suppressing enhanced exogenous RPS3a expression, was associated with apoptotic cell death. First, S-12 cells became noticeably shrunken and blebbed in appearance when enhanced exogenous RPS3a expression was suppressed in these cells by switching from Dex to gpt medium. (Fig. 8 A). In addition, marked chromatin condensation and nuclear and cell fragmentation were exhibited (Fig. 8 A). Such features are characteristic of apoptosis in a wide variety of cells (Wyllie et al., 1980), such as HL-60 cells induced to undergo apoptosis by Act D (Naora et al., 1996). Second, increased exposure of phosphatidylserine moieties on the cell surface, a common feature of apoptosis (Martin et al., 1995), was detected by Annexin V binding in a number of S-12 cells, in which enhanced exogenous RPS3a expression was inhibited (Fig. 8 B). Externalization of phosphatidylserine moieties around the whole, or in localized regions, of the cell surface was closely associated with marked ruffling of the cell surface as observed by differential interference contrast microscopy (Fig. 8 B). Third, distinct internucleosomal DNA fragmentation typical of apoptosis was detected in S-12 cells switched from Dex to gpt medium, whereas S-12 cells incubated in Dex medium showed no characteristic “DNA ladder” (Fig. 9, compare lanes 7 and 8). No DNA ladder formation was observed when P-12 cells were switched from Dex to gpt medium (Fig. 9, compare lanes 4 and 5).
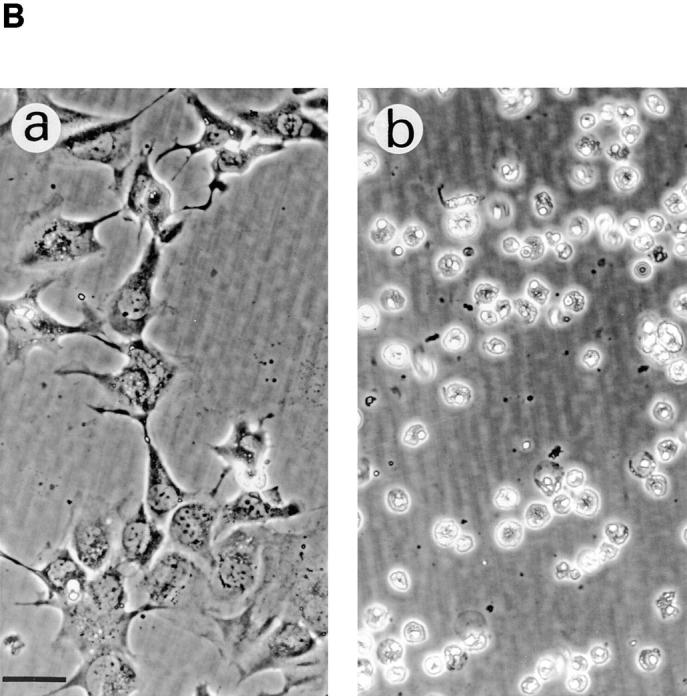
Figure 8.


Morphology of apoptotic and nonviable S-12 cells. S-12 cells, precultured in gpt medium, were incubated in Dex medium for 2 d and then switched back to gpt medium for 1 d. In A, cells that became detached were collected from the culture medium and examined by phase contrast microscopy (a), which revealed rounded morphology and blebbing (arrow), and by Giemsa staining, which revealed shrinkage and chromatin condensation (b) and nuclear fragmentation (c). In B, cells which remained attached were harvested and pooled with detached cells, and then treated with Annexin V–FITC reagent and examined by fluorescence (a and c) and differential interference contrast (b and d) microscopy. Approximately half of the total cell population showed Annexin V–binding activity, with some cells being strongly positive and others exhibiting weak or localized fluorescence, the former showing marked ruffling on their surface (d). Bars in A: (a) 20 μm; (b and c) 10 μm. Bars in B: (a and b) 25 μm; (c and d) 10 μm.
Figure 9.
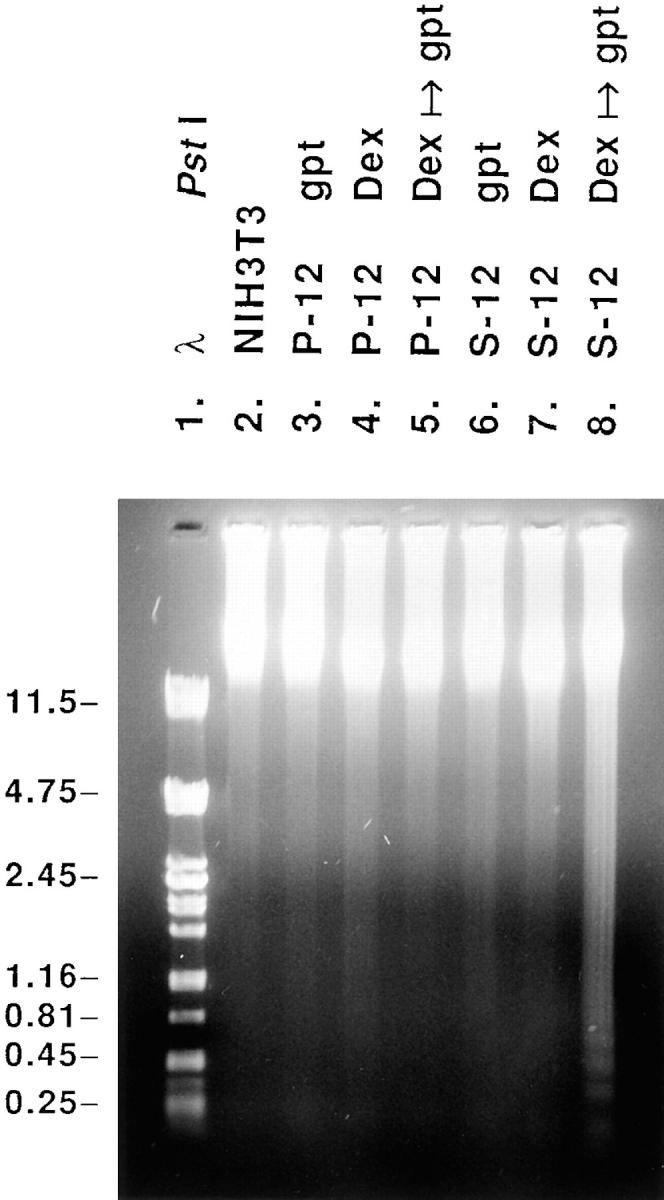
Analysis of genomic DNA fragmentation in P-12 and S-12 cells. Genomic DNA was isolated from parental NIH 3T3 cells cultured in normal medium (lane 2), and from P-12 and S-12 cells cultured in gpt medium (lanes 3 and 6), switched to Dex medium for 2 d (lanes 4 and 7), and then switched back to gpt medium for 1 d (lanes 5 and 8). Genomic DNA was isolated from detached cells recovered from the culture medium pooled with attached cells. 10 μg of DNA was electrophoresed on a 0.8% agarose gel, together with PstI- digested λ DNA as size markers (lane 1; sizes of various fragments in kb shown at left).
Enhanced RPS3a Expression Is Associated with Sensitivity to Death Induced by Act D
Our earlier studies using the nbl clone found that endogenous RPS3a is constitutively expressed at high levels in a number of cell lines (e.g., HL-60), which undergo apoptosis when such enhanced endogenous RPS3a expression is downregulated by Act D treatment; whereas cells with low constitutive levels of RPS3a expression do not apparently undergo typical apoptotic cell death in response to Act D (Naora et al., 1996). It was therefore of interest to investigate whether enhanced exogenous RPS3a expression rendered cells sensitive to apoptotic induction by Act D. When S-12 cells, incubated in Dex medium, were treated with Act D, distinct rounded morphology and detachment from the substratum were observed. Virtually all S-12 cells were detached and nonviable at 24 h after Act D addition (Fig. 10 B). Under the same conditions, many P-12 cells, in contrast, remained adhered to the substratum and viable (Fig. 10 B). At 6 h after addition of Act D to S-12 cells incubated in Dex medium, significant DNA fragmentation was observed, whereas genomic DNA of P-12 cells remained relatively intact (Fig. 10 A, compare lanes 5 and 2). Genomic DNA integrity of S-12 cells cultured in gpt medium, was relatively unaffected by Act D treatment for 6 h (Fig. 10 A, lane 7). Although Act D induced extensive DNA fragmentation in S-12 cells incubated in Dex medium, it should be noted that the DNA fragmentation pattern was somewhat different from that induced in S-12 cells by switching from Dex to gpt medium (Fig. 10 A, compare lanes 5 and 8).
Figure 10.
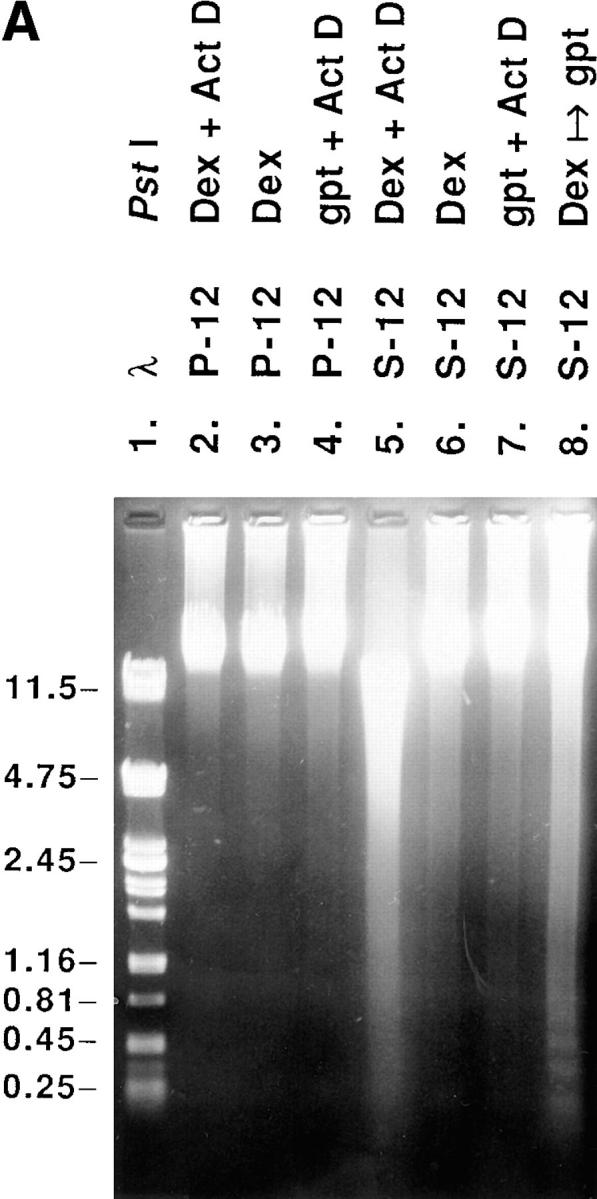
Effects of Act D on DNA fragmentation (A) and morphology (B) of P-12 and S-12 cells. In A, genomic DNA was isolated from P-12 and S-12 cells incubated for 2 d in Dex medium (lanes 3 and 6), and for a further 6 h with the addition of Act D (1 μg/ml) (lanes 2 and 5). Genomic DNA was also isolated from P-12 and S-12 cells, incubated in gpt medium with the addition of Act D for 6 h (lanes 4 and 7), and from S-12 cells switched to gpt medium for 1 d after incubation in Dex medium for 2 d (lane 8). Genomic DNA was isolated from detached cells recovered from the culture medium pooled with attached cells, and electrophoresed as described in Fig. 9 with PstI-digested λ DNA (lane 1). In B, P-12 (a) and S-12 (b) cells were incubated in Dex medium for 2 d, followed by incubation for a further 24 h with the addition of Act D (1 μg/ml). Bar, 50 μm.
Influence of Cell Density on Foci Formation In Vitro, but Not on Apoptotic Cell Death
Since cell–cell contact modulates a variety of phenomena including transformation and apoptosis (Rak et al., 1995), we examined whether cell density affects the biological consequences of enhancing and subsequently suppressing RPS3a expression. As described earlier, typical morphological features of in vitro transformation, such as formation of multicellular layers of overlapping cells and of foci, were induced when high confluence S-12 cultures were switched from gpt to Dex medium (Fig. 11 C). In contrast, as mentioned earlier, S-12 cultures remained as a monolayer of nonoverlapping cells when switched from gpt to Dex medium at low confluence (Fig. 11 C). However, levels of exogenous RPS3a expression induced in S-12 cells by switching from gpt to Dex medium were very similar in both high and low confluence cultures (Fig. 11 A). This suggests that the apparent transforming ability of enhanced RPS3a expression requires additional signals such as those mediated by cell–cell contact in NIH 3T3 cells. This implies that RPS3a is not oncogenic in the strict sense, even when assayed in NIH 3T3 cells that are sensitive to transformation by various oncogenes. The inability of RPS3a alone to act as an oncoprotein has also been reported in a different cell line Rat-1 (Kho and Zarbl, 1992; Kho et al., 1996). In contrast, ras-transformed NIH 3T3 cells, cultured in Dex medium at low confluence under conditions comparable to those used for S-12 cells, clearly formed multicellular layers of overlapping cells and numerous transformed foci (Xu et al., 1991).
Figure 11.


Effects of cell density on morphological transformation and apoptosis. S-12 cells, precultured in gpt medium, were incubated at low and at high cell densities in Dex medium for 2 d. In C, cells at high density grew in multicellular layers and exhibited foci formation, whereas cells at low density remained as a monolayer and exhibited no morphological transformation. Exogenous RPS3a expression levels in these cells were quantified by PhosphorImager analysis of hybridization signals of exogenous RPS3a transcripts. In A, the level of exogenous RPS3a expression in cells at high density is expressed relative to the level in cells at low density (open bar). S-12 cells incubated at low and at high cell densities were then switched from Dex to gpt medium for 1 d. In B, the resulting cell death is expressed in terms of percentages (mean ± SD of duplicate wells) of apoptotic and nonviable cells in the total cell population. Filled and open sections represent the fraction of apoptotic and nonviable cells composed of detached cells collected from the culture medium, and of cells collected after trypsinization, respectively. The extent of inhibition of exogenous RPS3a expression, induced when cells were switched from Dex to gpt medium, was quantified by PhosphorImager analysis, and is shown in A (dotted bar). Data in A represents the mean ± SD of two experiments. Bar, 200 μm.
In contrast to in vitro transforming ability, the induction of apoptosis by suppressing enhanced exogenous RPS3a expression showed no dependence on cell density. When high confluence cultures of S-12 cells in Dex medium, which exhibited typical morphological transformation, were switched to gpt medium, approximately half of the total cell population was apoptotic and nonviable after 1 d (Fig. 11 B). Almost the same proportion of the total cell population was apoptotic and nonviable when S-12 cells at low confluence—which expressed enhanced exogenous RPS3a at levels similar to transformed cells, but that themselves displayed no morphological transformation—were switched to gpt medium (Fig. 11 B). The majority of apoptotic and nonviable cells in both high and low confluence cultures was comprised of cells that had detached (Fig. 11 B). The extent of inhibition of exogenous RPS3a expression, induced by switching S-12 cells from Dex to gpt medium, was similar in cells cultured at low and at high confluence (Fig. 11 A). These results suggest that suppression of enhanced RPS3a expression per se induces apoptosis, irrespective of cell density and regardless of whether cells were morphologically transformed by enhanced RPS3a expression at high cell density.
Discussion
The coordinate, stoichiometric production of numerous ribosomal proteins and rRNAs is crucial for ribosome assembly and function (Mager, 1988). Where production of an individual ribosomal protein is selectively enhanced, it is presumably not assembled in the ribosome giving rise to the possibility that the species, in its unbound form, could be recruited for an extraribosomal function (Cramton and Laski, 1994). There is increasing evidence that individual ribosomal proteins and changes in their expression participate in, and modulate, a variety of cellular activities (Wool et al., 1995; Wool, 1996). Typical features of transformation such as foci formation, increased saturation cell density, anchorage-independent growth in vitro and tumor formation in vivo have been observed when expression of another component of the translational apparatus, initiation factor 4E, is enhanced (De Benedetti and Rhoads, 1990; Lazaris-Karatzas et al., 1990). Although the causal or consequential nature of enhanced expression of several ribosomal protein genes in various tumors was not established in earlier studies, their involvement in transformation was implicated by the lack of association between such selective enhancement and proliferative activity when compared with normal tissues (Pogue-Geile et al., 1991; Barnard et al., 1993; Starkey and Levy, 1995). Our earlier studies indicated that RPS3a expression is generally higher in most tumor cells than in normal cells, and that there likewise appeared no strong correlation between RPS3a expression levels and proliferative activities among the range of cell types examined (Naora et al., 1995, 1996). The present findings suggest that enhanced RPS3a expression could be involved in transformation in NIH 3T3 cells, although enhancement of RPS3a expression alone does not appear to induce transformation. The notion that RPS3a does not act as an oncoprotein intrinsically is supported by recent observations in Rat-1 cells (Kho and Zarbl, 1992; Kho et al., 1996).
During the course of the present work, the RPS3a gene was found in humans to be identical to fte-1 (Kho et al., 1996), whose rat homologue was originally cloned by virtue of its disruption by plasmid integration in v-fos–transformed Rat-1 cells, which resulted in a revertant phenotype (Kho and Zarbl, 1992). Expression of the fte-1/RPS3a cDNA restored the transformed phenotype in revertant cells, implying that oncogenic transformation of Rat-1 cells did not occur by v-fos alone. Furthermore, Kho and coworkers demonstrated that enhanced expression of fte-1/ RPS3a alone failed to induce transformation in normal Rat-1 cells, but was involved in transformation when v-fos was coexpressed in these cells (Kho and Zarbl, 1992; Kho et al., 1996). It therefore appears that transformation can occur when fte-1/RPS3a expression is enhanced in the presence of specific additional signals. These signals may differ between cell types. In NIH 3T3 cells, such signals appear to be mediated by cell–cell contact, whereas signals mediated by the cooperative effect of v-fos are apparently required for transformation of Rat-1 cells. Furthermore, signals which could cooperate with enhanced RPS3a expression to induce transformation appear to be absent or inactive in the normal mouse thymus. The transient enhancement of RPS3a expression in the thymus in vivo, from an initially low level after glucocorticoid administration, was of an order similar to that observed for the enhancement of RPS3a expression in the present NIH 3T3 model, and was not associated with transformation (Naora et al., 1995). In addition, enhanced RPS3a expression may not be obligatory for transformation in general as a few types of tumor cells, such as the hepatoma HepG2, constitutively express RPS3a at levels similar to or lower than those in normal tissues (Naora et al., 1996).
Kho et al. (1996) also reported that expression of the fte-1/RPS3a cDNA in revertant cells increased protein synthetic activity to the level seen in parental v-fos transformants, suggesting that elevating RPS3a expression increases protein synthesis. Although elevated mRNA levels of two other ribosomal proteins were observed in v-fos transformants, it is difficult to envisage how enhanced expression of one ribosomal protein can lead to increased ribosome biogenesis, involving >70 other ribosomal proteins, and thereby increase protein synthetic activity. Furthermore, the increase in protein synthetic activity observed by Kho and coworkers may be influenced, at least in part, by the cooperative effect of v-fos. In contrast, we found that inducing exogenous RPS3a expression alone in NIH 3T3 cells did not increase protein synthetic activity. It is possible that enhanced RPS3a expression may be involved in promoting synthesis of oncogenic factors necessary for the induction/maintenance of the transformed phenotype, as suggested by findings of Kho and coworkers. However, at this stage an alternative possibility that cannot be excluded is that RPS3a—when expressed at high levels under certain conditions and/or in the presence of specific signals—could be involved in transformation in an extraribosomal capacity.
A key novel finding of the present study is that up- and downregulation of RPS3a expression, coordinated in sequence, can actively induce apoptosis. Enhancement of RPS3a expression from an initially low level, without subsequent suppression, is insufficient for apoptotic induction, as switching on exogenous RPS3a expression alone failed to induce death. Conversely, apoptosis cannot be apparently induced by suppressing levels of RPS3a expression which are already low in the absence of prior enhancement. This is evidenced by the observed inability of Act D to induce death in RPS3a-transfected cells in which the exogenous gene was not switched on, and in vector-transfected cells, under conditions in which Act D could induce death in transfectants expressing exogenous RPS3a. Furthermore, in preliminary studies, we have observed that NIH 3T3 cells, which normally express RPS3a at low levels, grew at a 60% slower rate without any increased cell death when stably transfected with RPS3a antisense sequences which were continuously expressed (Naora, H., and H. Naora, unpublished observations). Likewise, suppression of RPS3a expression either by Act D or by antisense-mediated mechanisms failed to induce apoptosis in cell lines that constitutively expressed endogenous RPS3a at levels similar to the low level in normal tissues, under conditions in which apoptosis could be potently induced in cell lines that constitutively expressed RPS3a at levels more than several-fold above the low normal tissue level (Naora et al., 1996, 1998). It appears, therefore, that an enhancement of RPS3a expression is a general prerequisite for apoptotic induction, which is not specific to the present NIH 3T3 model system.
The present findings support a model in which enhanced RPS3a expression, either existing constitutively or transiently induced depending on cell type, could be regarded as “priming” a cell for apoptosis. Cell types that constitutively express RPS3a at low levels need to undergo transient induction of RPS3a enhancement, as appears to be the physiological case in the thymus, in which marked upregulation of RPS3a expression occurs during a highly temporal-specific window within which Act D is able to block glucocorticoid-induced apoptosis in vivo (Naora et al., 1995). The subsequent fall in these transiently elevated RPS3a levels occurred before the occurrence of massive internucleosomal DNA cleavage and thymocyte depletion, and at a stage when Act D was no longer able to block apoptosis. In contrast, various tumor cell lines which constitutively express RPS3a at high levels could be considered as already “primed”. Suppression of enhanced RPS3a expression could therefore be associated with and/or involved in a downstream pathway of apoptosis common to a variety of cell types that otherwise differ in their initial constitutive level of RPS3a expression. However, the physiological signals that mediate such suppression could be cell specific and remain to be elucidated.
Growth inhibition and/or apoptosis can be induced in some cases by switching off expression of a gene believed responsible for the transformed phenotype, as suggested by the effects of inhibiting c-myc and bcr-abl in promyelocytic, and in chronic myeloid, leukemia cells, respectively (Holt et al., 1988; Smetsers et al., 1994). It appears that it is the suppression of enhanced RPS3a expression, rather than the inhibition of its possible involvement in transformation that induces apoptosis. This is strongly supported by the finding that S-12 cells that expressed RPS3a at enhanced levels, very similar to apparently transformed cells (but that themselves displayed no morphological transformation), underwent apoptosis when enhanced RPS3a expression was inhibited. The notion that suppression of enhanced RPS3a expression induces apoptosis irrespective of transformation is consistent with our observations in normal mouse thymus in vivo.
The possibility that suppressing protein synthesis could trigger apoptosis, at least in some cell types, has been raised by the observed ability of macromolecular synthesis inhibitors to induce apoptosis in various cell lines (Martin et al., 1990). In view that ribosome biogenesis is dependent on stoichiometric production of its individual components, it is conceivable that a dramatic fall in levels of one or more ribosomal proteins could decrease protein synthetic activity and thereby signal a cell to self-destruct. However, defects or deficiencies in various ribosomal proteins associated with the air8, string of pearls, and various Minute mutants of Drosophila, do not appear to directly result in lethality, though the life span of these developmentally abnormal organisms is in general reduced (Kongsuwan et al., 1985; Watson et al., 1992; Cramton and Laski, 1994). It is possible that reduced levels of RPS3a may detrimentally affect protein synthesis to a greater extent than reduced levels of some other ribosomal proteins, and thereby result in lethality. RPS3a has been implicated to play a crucial role in translational initiation in view that it can be cross-linked to 18S rRNA (Svoboda and McConkey, 1978), initiation factors eIF-2 (Westermann et al., 1979), and eIF-3 (Tolan et al., 1983), Met-tRNAf (Westermann et al., 1981), and mRNA (Takahashi and Ogata, 1981). Recently, it has been found that monoallelic disruption of the RPS3a gene results in altered polysome profiles and a decreased rate of protein synthesis (Kho et al., 1996). In yeast, many ribosomal proteins are encoded by duplicated functional genes (Warner, 1989), in contrast to most ribosomal proteins in higher eukaryotes, for each there being a single functional gene and numerous pseudogenes (Wool et al., 1990). Disruption of either one of the two yeast homologues of RPS3a has been found to slow growth, whereas disruption of both copies results in a lethal phenotype (Garrett et al., 1991; Ito et al., 1992).
A possible mechanism by which disrupted protein synthesis could trigger apoptosis is by reducing levels of survival/protective factors (Steller, 1995). A subset of proteins appears selectively reduced, compared with the overall decreased level, in cells in which the RPS3a gene is disrupted (Kho et al., 1996), giving rise to the possibility that suppressing enhanced RPS3a expression could specifically inhibit synthesis of survival/protective factors. Ribosomal protein L7 has been recently proposed to be involved in apoptotic induction by specifically inhibiting the synthesis of survival/protective factors (Neumann and Krawinkel, 1997). However, the apoptotic pathway involving ribosomal protein L7 appears to require its constitutive expression and additional signals mediated by close cell–cell contact. In contrast, the present study indicates that the apoptotic pathway involving RPS3a is triggered by suppressing its enhanced expression, and shows no apparent cell density dependence.
A possible mechanism by which apoptosis is triggered by suppressing enhanced RPS3a expression can be explained, at least in part, in terms of the role of RPS3a in protein synthesis. However, such a role for RPS3a cannot fully account for the prior requirement of RPS3a expression to be enhanced, either existing constitutively or transiently induced, depending on cell type. An alternative possibility is that enhanced levels of RPS3a, acting in an extraribosomal capacity, provide a crucial apoptotic signal, the presence of which is required for “priming” and the subsequent absence of which triggers the cell death process. Experiments along this line are in progress in our laboratories. With the recent exception of ribosomal protein L7, there have been no prior reports implicating a role for ribosomal proteins in apoptosis. The present work gives rise to the possibility that this crucial cell death process could be regulated not only by the highly specific inducers/effectors that have been identified to date, but also by components of a basal cellular machinery that have been traditionally believed not to individually modulate a specific cellular response. Irrespective of whether apoptosis is induced by suppressing enhanced levels of RPS3a acting in an extraribosomal capacity or as a component of the translational apparatus, the possibility is raised by the present findings that a novel anti-cancer strategy might include targeting RPS3a, given that this species is generally expressed in many tumor cells at levels higher than in normal cells.
Acknowledgments
We thank Drs. T. Nishida and Y. Shindo (Cellular Technology Institute, Tokushima, Japan) for discussion and providing the nbl cDNA clone, and A. Metspalu (Institute of Molecular and Cell Biology, Tartu, Estonia) for providing the RPS3a cDNA clone.
Abbreviations used in this paper
- Act D
actinomycin D
- Dex
dexamethasone
- gpt
xanthine-guanine phosphoribosyl-transferase gene
- MMTV LTR
mouse mammary tumor virus long terminal repeat
- poly(HEMA)
poly 2-hydroxyethylmethacrylate
- RPS3a
ribosomal protein S3a
- rRNA
ribosomal RNA
- UTR
untranslated region
Footnotes
Address all correspondence to Hiroto Naora, Research School of Biological Sciences, The Australian National University, GPO Box 475, Canberra, A.C.T. 2601, Australia. Tel.: 61 2 62 49 23 89. Fax: 61 2 62 47 36 43.
References
- Barnard GF, Staniunas RJ, Mori M, Puder M, Jessup MJ, Steele GD, Chen LB. Gastric and hepatocellular carcinomas do not overexpress the same ribosomal protein messenger RNAs as colonic carcinoma. Cancer Res. 1993;53:4048–4052. [PubMed] [Google Scholar]
- Cramton SE, Laski FA. string of pearls encodes Drosophila ribosomal protein S2, has Minute-like characteristics, and is required during oogenesis. Genetics. 1994;137:1039–1048. doi: 10.1093/genetics/137.4.1039. [DOI] [PMC free article] [PubMed] [Google Scholar]
- De Benedetti A, Rhoads RE. Overexpression of eukaryotic protein synthesis initiation factor 4E in HeLa cells results in aberrant growth and morphology. Proc Natl Acad Sci USA. 1990;87:8212–8216. doi: 10.1073/pnas.87.21.8212. [DOI] [PMC free article] [PubMed] [Google Scholar]
- Desjardins LM, MacManus JP. An adherent cell model to study different stages of apoptosis. Exp Cell Res. 1995;216:380–387. doi: 10.1006/excr.1995.1048. [DOI] [PubMed] [Google Scholar]
- Evans DL, Dive C. Effects of cisplatin on the induction of apoptosis in proliferating hepatoma cells and nonproliferating immature thymocytes. Cancer Res. 1993;53:2133–2139. [PubMed] [Google Scholar]
- Ferrari S, Manfredini R, Tagliafico E, Rossi E, Donelli A, Torelli G, Torelli U. Noncoordinated expression of S6, S11, and S14 ribosomal protein genes in leukemic blast cells. Cancer Res. 1990;50:5825–5828. [PubMed] [Google Scholar]
- Fisher EMC, Beer-Romero P, Brown LG, Ridley A, McNeil JA, Bentley J, Lawrence, Willard HF, Bieber FR, Page DC. Homologous ribosomal protein genes on the human X and Y chromosomes: escape from X inactivation and possible implications for Turner syndrome. Cell. 1990;63:1205–1218. doi: 10.1016/0092-8674(90)90416-c. [DOI] [PubMed] [Google Scholar]
- Fukazawa H, Mizuno S, Uehara Y. A microplate assay for quantitation of anchorage-independent growth of transformed cells. Anal Biochem. 1995;228:83–90. doi: 10.1006/abio.1995.1318. [DOI] [PubMed] [Google Scholar]
- Garrett JM, Singh KK, Vonder RA, Haar, Emr SD. Mitochondrial protein import: isolation and characterization of the Saccharomyces cerevisiae MFT1gene. Mol Gen Genet. 1991;225:483–491. doi: 10.1007/BF00261691. [DOI] [PubMed] [Google Scholar]
- Grabowski DT, Deutsch WA, Derda D, Kelley MR. Drosophila AP3, a presumptive DNA repair protein, is homologous to human ribosomal associated protein P0. Nucleic Acids Res. 1991;19:4297. doi: 10.1093/nar/19.15.4297. [DOI] [PMC free article] [PubMed] [Google Scholar]
- Holt JT, Redner RL, Nienhuis AW. An oligomer complementary to c-mycmRNA inhibits proliferation of HL-60 promyelocytic cells and induces differentiation. Mol Cell Biol. 1988;8:963–973. doi: 10.1128/mcb.8.2.963. [DOI] [PMC free article] [PubMed] [Google Scholar]
- Ito M, Yasui A, Komamine A. A gene family homologous to the S-phase specific gene in higher plants is essential for cell proliferation in Saccharomyces cerevisiae. . FEBS (Fed Eur Biochem Soc) Lett. 1992;301:29–33. doi: 10.1016/0014-5793(92)80203-s. [DOI] [PubMed] [Google Scholar]
- Johnson DG, Cress WD, Jakoi L, Nevins JR. Oncogenic capacity of the E2F1 gene. Proc Natl Acad Sci USA. 1994;91:12823–12827. doi: 10.1073/pnas.91.26.12823. [DOI] [PMC free article] [PubMed] [Google Scholar]
- Kho C-J, Zarbl H. Fte-1, a v-fostransformation effector gene, encodes the mammalian homologue of a yeast gene involved in protein import into mitochondria. Proc Natl Acad Sci USA. 1992;89:2200–2204. doi: 10.1073/pnas.89.6.2200. [DOI] [PMC free article] [PubMed] [Google Scholar]
- Kho C-J, Wang Y, Zarbl H. Effect of decreased fte-1gene expression on protein synthesis, cell growth, and transformation. Cell Growth Differ. 1996;7:1157–1166. [PubMed] [Google Scholar]
- Kim J, Chubatsu LS, Admon A, Stahl J, Fellous R, Linn S. Implication of mammalian ribosomal protein S3 in the processing of DNA damage. J Biol Chem. 1995;270:13620–13629. doi: 10.1074/jbc.270.23.13620. [DOI] [PubMed] [Google Scholar]
- Kongsuwan K, Yu Q, Vincent A, Frisardi MC, Rosbash M, Lengyel JA, Merriam J. A Drosophila Minutegene encodes a ribosomal protein. Nature. 1985;317:555–558. doi: 10.1038/317555a0. [DOI] [PubMed] [Google Scholar]
- Lazaris-Karatzas A, Montine KS, Sonenberg N. Malignant transformation by a eukaryotic initiation factor subunit that binds to mRNA 5′ cap. Nature. 1990;345:544–547. doi: 10.1038/345544a0. [DOI] [PubMed] [Google Scholar]
- Mager WH. Control of ribosomal protein gene expression. Biochim Biophys Acta. 1988;949:1–15. doi: 10.1016/0167-4781(88)90048-6. [DOI] [PubMed] [Google Scholar]
- Martin SJ, Lennon SV, Bonham AM, Cotter TG. Induction of apoptosis (programmed cell death) in human leukemic HL-60 cells by inhibition of RNA or protein synthesis. J Immunol. 1990;145:1859–1867. [PubMed] [Google Scholar]
- Martin SJ, Reutelingsperger CP, McGahon AJ, Rader JA, van Schie RC, LaFace DM, Green DR. Early redistribution of plasma membrane phosphatidylserine is a general feature of apoptosis regardless of the initiating stimulus: Inhibition by overexpression of Bcl-2and Abl. J Exp Med. 1995;182:1545–1556. doi: 10.1084/jem.182.5.1545. [DOI] [PMC free article] [PubMed] [Google Scholar]
- Metspalu A, Rebane A, Hoth S, Pooga M, Stahl J, Kruppa J. Human ribosomal protein S3a: cloning of the cDNA and primary structure of the protein. Gene (Amst) 1992;119:313–316. doi: 10.1016/0378-1119(92)90289-2. [DOI] [PubMed] [Google Scholar]
- Naora H. Gene ecology. A novel regulatory system in gene expression network. Biol Forum. 1986;79:345–371. [PubMed] [Google Scholar]
- Naora H, Deacon NJ. Clustered genes require extragenic territorial DNA sequences. Differentiation. 1982;21:1–6. doi: 10.1111/j.1432-0436.1982.tb01186.x. [DOI] [PubMed] [Google Scholar]
- Naora H, Naora H. Differential expression patterns of β-actin mRNA in cells undergoing apoptosis. Biochem Biophys Res Comm. 1995;211:491–496. doi: 10.1006/bbrc.1995.1840. [DOI] [PubMed] [Google Scholar]
- Naora H, Xu ZZ, Miyahara K, Liszczynsky H, Seno S. Gene ecology: a cis-acting gene-to-gene interaction due to the spatial arrangement of genes in chromosomes affects neighbouring transfected c-H-rasexpression. Chromosome Res. 1994;2:171–183. doi: 10.1007/BF01553317. [DOI] [PubMed] [Google Scholar]
- Naora H, Nishida T, Shindo Y, Adachi M, Naora H. Association of nbl gene expression and glucocorticoid-induced apoptosis in mouse thymus in vivo. . Immunology. 1995;85:63–68. [PMC free article] [PubMed] [Google Scholar]
- Naora H, Nishida T, Shindo Y, Adachi M, Naora H. Constitutively enhanced nblexpression is associated with the induction of internucleosomal DNA cleavage by actinomycin D. Biochem Biophys Res Comm. 1996;224:258–264. doi: 10.1006/bbrc.1996.1017. [DOI] [PubMed] [Google Scholar]
- Naora, H., T. Nishida, Y. Shindo, M. Adachi, and H. Naora. 1998. Antisense sequences of the nbl gene induce apoptosis in the human promyelocytic leukemia cell line HL-60. Leukemia. In press. [DOI] [PubMed]
- Neumann F, Krawinkel U. Constitutive expression of human ribosomal protein L7 arrests the cell cycle in G1and induces apoptosis in Jurkat T-lymphoma cells. Exp Cell Res. 1997;230:252–261. doi: 10.1006/excr.1996.3417. [DOI] [PubMed] [Google Scholar]
- Pogue-Geile K, Geiser JR, Shu M, Miller C, Wool IG, Meisler AI, Pipas JM. Ribosomal protein genes are overexpressed in colorectal cancer: isolation of a cDNA clone encoding the human S3 ribosomal protein. Mol Cell Biol. 1991;11:3842–3849. doi: 10.1128/mcb.11.8.3842. [DOI] [PMC free article] [PubMed] [Google Scholar]
- Rak J, Mitsuhashi Y, Erdos V, Huang S, Filmus J, Kerbel RS. Massive programmed cell death in intestinal epithelial cells induced by three-dimensional growth conditions: Suppression by mutant c-H-rasoncogene expression. J Cell Biol. 1995;131:1587–1598. doi: 10.1083/jcb.131.6.1587. [DOI] [PMC free article] [PubMed] [Google Scholar]
- Re F, Zanetti A, Sironi M, Polentarutti N, Lanfrancone L, Dejana E, Colotta F. Inhibition of anchorage-dependent cell spreading triggers apoptosis in cultured human endothelial cells. J Cell Biol. 1994;127:537–546. doi: 10.1083/jcb.127.2.537. [DOI] [PMC free article] [PubMed] [Google Scholar]
- Rubin, A.L., and B.J. Ellison. 1991. Induction of transformation in NIH3T3 cells by moderate growth constraint: evidence that neoplasia is driven by adaptational change. Carcinogenesis. 12:1801–1806. [DOI] [PubMed]
- Seshadri T, Uzman JA, Oshima J, Campisi J. Identification of a transcript that is down-regulated in senescent human fibroblasts. J Biol Chem. 1993;268:18474–18480. [PubMed] [Google Scholar]
- Smetsers TFCM, Skorski T, van de Locht LTF, Wessels HMC, Pennings AHM, de Witte T, Calabretta B, Mensink EJBM. Antisense BCR-ABL oligonucleotides induce apoptosis in the Philadelphia chromosome-positive cell line BV173. Leukemia. 1994;8:129–140. [PubMed] [Google Scholar]
- Starkey CR, Levy LS. Identification of differentially expressed genes in T-lymphoid malignancies in an animal model system. Int J Cancer. 1995;62:325–331. doi: 10.1002/ijc.2910620316. [DOI] [PubMed] [Google Scholar]
- Steller H. Mechanisms and genes of cellular suicide. Science. 1995;267:1445–1449. doi: 10.1126/science.7878463. [DOI] [PubMed] [Google Scholar]
- Svoboda AJ, McConkey EH. Cross-linking of proteins to ribosomal RNA in HeLa cell polysomes by sodium periodate. Biochem Biophys Res Comm. 1978;81:1145–1152. doi: 10.1016/0006-291x(78)91256-1. [DOI] [PubMed] [Google Scholar]
- Takahashi Y, Ogata K. Ribosomal proteins cross-linked to natural mRNA by UV irradiation of rat liver polysomes. J Biochem. 1981;90:1549–1552. doi: 10.1093/oxfordjournals.jbchem.a133624. [DOI] [PubMed] [Google Scholar]
- Tolan DR, Hershey JWB, Traut RT. Crosslinking of eukaryotic initiation factor eIF3 to the 40S ribosomal subunit from rabbit reticulocytes. Biochimie (Paris) 1983;65:427–436. doi: 10.1016/s0300-9084(83)80062-5. [DOI] [PubMed] [Google Scholar]
- Warner JR. Synthesis of ribosomes in Saccharomyces cerevisiae. . Microbiol Rev. 1989;53:256–271. doi: 10.1128/mr.53.2.256-271.1989. [DOI] [PMC free article] [PubMed] [Google Scholar]
- Watson KL, Konrad KD, Woods DF, Bryant PJ. Drosophilahomolog of the human S6 ribosomal protein is required for tumor suppression in the hematopoietic system. Proc Natl Acad Sci USA. 1992;89:11302–11306. doi: 10.1073/pnas.89.23.11302. [DOI] [PMC free article] [PubMed] [Google Scholar]
- Westermann P, Heumann W, Bommer U-A, Bielka H, Nygard O, Hultin T. Cross-linking of initiation factor eIF-2 to proteins of the small subunit of rat liver ribosomes. FEBS (Fed Eur Biochem Soc) Lett. 1979;97:101–104. doi: 10.1016/0014-5793(79)80061-7. [DOI] [PubMed] [Google Scholar]
- Westermann P, Nygard O, Bielka H. Cross-linking of Met-tRNAf to eIF-2β and to the ribosomal proteins S3a and S6 within the eukaryotic initiation complex, eIF-2.GMPPCP.Met-tRNAf.small ribosomal subunit. Nucleic Acids Res. 1981;9:2387–2396. doi: 10.1093/nar/9.10.2387. [DOI] [PMC free article] [PubMed] [Google Scholar]
- Wool IG. Extraribosomal functions of ribosomal proteins. Trends Biochem Sci. 1996;21:164–165. [PubMed] [Google Scholar]
- Wool, I.G., Y. Endo, Y.L. Chan, and A. Gluck. 1990. Structure, function, and evolution of mammalian ribosomes. In The Ribosome. Structure, Function, and Evolution. W.E. Hill, A. Dahlberg, R.A. Garrett, P.B. Moore, D. Schlessinger, and J.R. Warner, editors. American Society for Microbiology, Washington, D.C. 203–214.
- Wool IG, Chan YL, Gluck A. Structure and evolution of mammalian ribosomal proteins. Biochem Cell Biol. 1995;73:933–947. doi: 10.1139/o95-101. [DOI] [PubMed] [Google Scholar]
- Wyllie AH. Apoptosis and the regulation of cell numbers in normal and neoplastic tissues: an overview. Cancer Metastasis Rev. 1992;11:95–103. doi: 10.1007/BF00048057. [DOI] [PubMed] [Google Scholar]
- Wyllie AH, Kerr JFR, Currie AR. Cell death: the significance of apoptosis. Int Rev Cytol. 1980;68:251–306. doi: 10.1016/s0074-7696(08)62312-8. [DOI] [PubMed] [Google Scholar]
- Xu ZZ, Miyahara K, Liszczynsky H, Seno S, Naora H. Reversible conversion of cells between cancerous and normal states. Proc Jpn Acad. 1991;67:11–15. doi: 10.1016/0309-1651(91)90006-5. [DOI] [PubMed] [Google Scholar]