Abstract
Kinetoplast DNA (kDNA), the mitochondrial DNA in kinetoplastids, is a network containing several thousand topologically interlocked minicircles. We investigated cell cycle–dependent changes in the localization of kDNA replication enzymes by combining immunofluorescence with either hydroxyurea synchronization or incorporation of fluorescein–dUTP into the endogenous gaps of newly replicated minicircles. We found that while both topoisomerase II and DNA polymerase β colocalize in two antipodal sites flanking the kDNA during replication, they behave differently at other times. Polymerase β is not detected by immunofluorescence either during cell division or G1, but is abruptly detected in the antipodal sites at the onset of kDNA replication. In contrast, topoisomerase II is localized to sites at the network edge at all cell cycle stages; usually it is found in two antipodal sites, but during cytokinesis each postscission daughter network is associated with only a single site. During the subsequent G1, topoisomerase accumulates in a second localization site, forming the characteristic antipodal pattern. These data suggest that these sites at the network periphery are permanent components of the mitochondrial architecture that function in kDNA replication.
Keywords: cell cycle, kinetoplast DNA, DNA replication, DNA polymerase β, topoisomerase II
Trypanosomatid protozoa such as Crithidia fasciculata possess an unusual mitochondrial genome known as kinetoplast DNA (kDNA)1 that is comprised of ∼5,000 minicircles (2.5 kb) and ∼25 maxicircles (38 kb) topologically interlocked into a single network. An isolated kDNA network is a planar structure ∼10 μm × 15 μm in size. In vivo, however, the network is condensed into a disk ∼1 μm in diam and 0.4 μm in thickness within the mitochondrial matrix (see Shapiro and Englund, 1995 for discussion of network packaging in vivo). Like mitochondrial DNAs in other eukaryotes, maxicircles encode rRNAs and proteins required for mitochondrial energy transduction (Stuart, 1983). Maxicircle transcripts undergo RNA editing, the specific insertion or deletion of uridine residues at internal sites. The sequence specificity of RNA editing is dictated by guide RNAs that are encoded by minicircles (Benne, 1994; Simpson and Thiemann, 1995).
The complex network structure of kDNA dictates a novel replication mechanism (reviewed in Ray, 1987; Shlomai, 1994; Shapiro and Englund, 1995). In this process, covalently closed minicircles are individually released from the network and replicated as free minicircles via theta structure intermediates. Newly synthesized minicircles, which contain gaps, are then reattached to the network periphery by a topoisomerase. Thus replicating networks develop two zones, an outer zone of gapped, progeny minicircles and an inner zone of covalently closed minicircles that have not yet replicated. Once replication is complete, the network has twice the number of minicircles and all are gapped. After repair of the gaps in each minicircle, the network undergoes scission (presumably in another topoisomerase-mediated reaction) to form two daughter networks.
The intramitochondrial localization of kDNA replication enzymes has been crucial for our current understanding of network replication. The mitochondrial DNA primase is detected in regions adjacent to the two faces of the kDNA disk, suggesting that early stages of minicircle replication may occur in these locations (Li and Englund, 1997). In contrast, the mitochondrial topoisomerase II (topo II) and DNA polymerase β (pol β) localize to two sites flanking the network edge (Melendy et al., 1988; Ferguson et al., 1992). A similar antipodal localization pattern is also observed for minicircle replication intermediates detected by fluorescence in situ hybridization (Ferguson et al., 1992). Furthermore, newly replicated minicircles are known to reattach to the network periphery at two antipodal positions (Simpson and Simpson, 1976; Pérez-Morga and Englund, 1993a ). The similar localizations of topo II, pol β, minicircle replication intermediates, and minicircle reattachment sites led to the hypothesis that these sites were involved in minicircle replication, particularly in the repair of highly gapped minicircles and the re-attachment of minicircle progeny to the network (Melendy et al., 1988; Ferguson et al., 1992; Li and Englund, 1997).
In most eukaryotes, the replication of mitochondrial DNA is independent of the nuclear cell cycle. Mitochondrial DNA in mammalian cells can replicate at any cell cycle stage (Bogenhagen and Clayton, 1977). In fact, some circles replicate multiple times during a cell cycle and others not at all, with only the final copy number being accurately controlled (Shadel and Clayton, 1997). In contrast, kDNA replication is more stringently regulated. Each minicircle and maxicircle in Crithidia replicates only once per generation (Wolstenholme et al., 1974; Hajduk et al., 1984). Furthermore, kDNA replication is restricted to a discrete time period, the onset of which is close to that of nuclear S phase (Cosgrove and Skeen, 1970). The mechanism by which kDNA replication is coordinated with that of nuclear DNA, however, is not known.
The organization of replication enzymes to discrete sites raised the possibility that changes in localization of these enzymes could temporally correlate with kDNA replication. Such changes in enzyme organization could either contribute to the regulation of kDNA replication or be subject to the same regulatory factors and thus illuminate regulatory mechanisms. This report describes the cell cycle dependence of pol β, topo II, and DNA primase localization. Pol β and topo II both localize in the antipodal sites during kDNA replication, but differ markedly at other cell cycle stages. The DNA primase localization, in contrast, is constant at all cell cycle stages.
Materials and Methods
Cell Culture and Synchronization
C. fasciculata were cultured in brain heart infusion (Difco Laboratories, Inc., Detroit, MI) containing 10 μg/ml hemin, and were grown at 28°C in a shaking water bath. Synchronization by hydroxyurea arrest was performed as described (Pasion et al., 1994). In brief, a cell culture in late log phase (∼108 cells/ml) was diluted to 107 cells/ml and incubated for 6 h in medium with 200 μg/ml hydroxyurea. Synchronized cells were collected by centrifugation (4,000 rpm, 10 min, room temperature) (HS4 rotor; Sorvall, Newtown, CT), resuspended in fresh medium without hydroxyurea, and then allowed to grow at 28°C for an additional 6 h.
Several parameters of synchronized cultures were analyzed at 30-min intervals. Cell density was determined by counting in a hemacytometer. The fraction of dividing cells was determined by phase and fluorescence microscopy on fixed cells stained with 4,6-diamidino-2-phenylindole (DAPI) (see below for fixation conditions). Cells with two nuclei that had not completed cytokinesis were counted as dividing. The rate of DNA synthesis was determined by measuring [3H]thymidine incorporation during a 10 min pulse. [3H]Thymidine (1 mCi/ml, 81 Ci/mmol, 10 μl; NEN Life Science Products, Boston, MA) was added to 65 μl of culture and incubated for 10 min at 28°C. The cells were then treated with proteinase K in SDS and the DNA was extracted with phenol/chloroform/iso-amyl-alcohol. The labeled DNA was bound to Whatman DE81 paper (Clifton, NJ), washed in 0.5 M sodium phosphate, pH 7.0, and then counted in a scintillation counter.
Antibodies
The anti-DNA primase was a mouse polyclonal serum (Li and Englund, 1997). The anti-topo II was mouse mAb 3A4 (a gift of D.S. Ray, University of California, Los Angeles, CA) (Melendy et al., 1988). The anti-pol β was rabbit serum JH167, raised against recombinant protein, the preparation of which will be described elsewhere. Anti-pol β serum was affinity purified on recombinant antigen bound to Immobilon P membrane (Harlow and Lane, 1988).
Whole Cell Lysates and Western Blotting
Aliquots (10 ml) from a synchronized C. fasciculata culture were taken at 30-min intervals. Cells were harvested by centrifugation (Sorvall HS-4 rotor, 7 min, 2,500 g), washed in PBS (137 mM NaCl, 2.7 mM KCl, 4.3 mM Na2HPO4, 1.4 mM KH2PO4) and lysed at 109 cells/ml in 1% NP-40, 200 mM Tris-HCl, pH 7.5, 25 mM NaCl, 20 mM EDTA, 4 mM PMSF, 4 μg/ml leupeptin, 1 μg/ml pepstatin A, 50 μg/ml antipain. Crude lysates were cleared by centrifugation for 15 min in a microfuge at 4°C, and supernatants were frozen in dry ice/ethanol and stored at −70°C. SDS-PAGE (10% gel) and transfer to Immobilon P membranes (Amersham Life Science, Arlington Heights, IL) were performed as described (Torri and Englund, 1995). Membranes were blocked for 60 min in 5% BSA in TBST (20 mM Tris-HCl, pH 7.5, 0.5 M NaCl, 0.1% Triton X-100), and were probed with a 1:1,000 dilution of anti-pol β antibody. After three 15-min washes in TBST, membranes were probed for 1 h with a 1:1,000 dilution of 125I-protein A (30 mCi/mg, 100 μCi/ml; Amersham Life Science) in TBST and washed as above. Membranes were exposed to a Fuji PhosphorImager plate for 15 h, and the results were quantitated using MacBas software (V2.31).
Cell Fixation and Immunofluorescence
All procedures were conducted at room temperature unless otherwise indicated. Cells were centrifuged for 1 min in a microfuge, washed, and then resuspended in 1 vol of PBS. Aliquots (25 μl, ∼5 × 10⁵ cells) were spotted on poly-l-lysine–coated slides and the cells were allowed to adhere for 10 min. For immunofluorescence against DNA primase and pol β, cells were fixed in 2% paraformaldehyde for 5 min, washed twice in PBS with 0.1 M glycine, pH 8.6, for 3 min, washed once in PBS for 3 min, and then immersed in methanol at −20°C overnight. Two different fixation methods were used to detect topo II. Cells were fixed either as described above, or fixed by methanol overnight at −20°C. These fixation methods yield comparable results. After fixation, slides were rehydrated with three 5-min washes in PBS before a 30-min incubation in blocking buffer (10% goat serum, 0.9× PBS). Primary antibodies were diluted in blocking buffer (topo II antibody, 1:20; pol β antibody, 1:50; primase antibody, 1:250), and slides were incubated at room temperature for 1 h. Slides were washed three times for 5 min in PBS, and then were incubated 45 min with a 1:250 dilution of secondary antibody (see figure legends). Slides were given three 5-min washes in PBS with 0.1 μg/ml DAPI included in the first two washes. Finally, slides were mounted in Mowiol (Boehringer Mannheim Corp., Indianapolis, IN) with 2.5% 1,4-diazobicyclo-[2.2.2]-octane (DABCO) as an antifade agent.
In Situ Labeling of kDNA Networks with Fluorescently Labeled dUTP
Fluorescein-5(6)-carboxamidocaproyl-[5-(3-aminoallyl)]-2′-deoxy-uridine-5′-triphosphate (dUTP-F) labeling has been used previously in our laboratory to analyze isolated kDNA networks (Guilbride and Englund, 1998) and is based on a method previously used for identifying cells undergoing apoptosis (Gavrieli et al., 1992). For in situ labeling of minicircle gaps, cells were adhered to slides, fixed in PFA as described above, and incubated for 10 min at room temperature in equilibration buffer (200 mM potassium cacodylate, 25 mM Tris-HCl, pH 6.6, 0.2 mM DTT, 2.25 mM CoCl2, and 0.25 mg/ml BSA). Slides were then incubated with 25 μl reaction buffer containing 180 mM potassium cacodylate, 22.5 mM Tris-HCl, pH 6.6, 0.18 mM DTT, 2.0 mM CoCl2, 0.23 mg/ml BSA, 0.1 mM EDTA, 10 μM dATP, 10 units of terminal deoxynucleotidyltransferase (TdT; Boehringer Mannheim Corp.), and 5 μM dUTP-F (Boehringer Mannheim Corp.). After 60 min at room temperature, the reaction was stopped with a 10 min wash in 2× SSC (0.3 M NaCl, 30 mM Na2 citrate). Slides were then washed three times for 5 min in PBS before proceeding with immunofluorescence.
Results
Colocalization of Pol β and Topo II
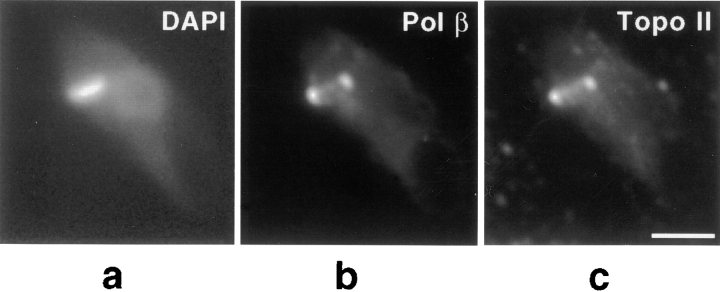
We found, as previously reported, that in asynchronously-growing cells pol β and topo II have similar patterns of localization to two antipodal sites flanking the kDNA disk (Melendy et al., 1988; Ferguson et al., 1992). To further characterize the antipodal localizations of topo II and pol β, we used double-label immunofluorescence to probe both enzymes. We observed that pol β and topo II colocalized to the same sites at the network edge, as shown in Fig. 1. In addition, we observed that in some cells with topo II concentrated in these antipodal sites, a small amount of the enzyme is also detected either between these sites, in the region of the kDNA network (Fig. 2 d), or in a region adjacent to the flagellar face of the network (data not shown).
Figure 1.
Colocalization of pol β and topo II. Cells from an asynchronous culture were fixed and processed for immunofluorescence to detect both pol β and topo II as described in Materials and Methods. (a) DAPI visualization of the dimly stained nucleus and brightly staining kDNA. (b) Detection of pol β with goat anti– rabbit secondary antibody conjugated to Texas red (Molecular Probes, Inc.). (c) Detection of topo II with goat anti–mouse secondary antibody conjugated to fluorescein (Boehringer Mannheim Corp.). Images were captured with a Photometrics slow-scan CCD camera (Tucson, AZ) using IPLab software. Bar, 3 μm.
Figure 2.
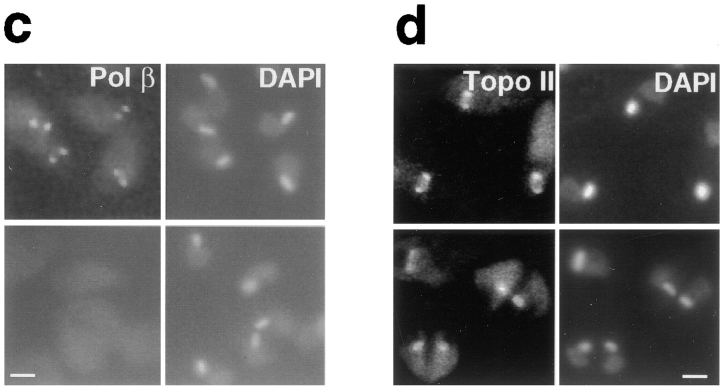
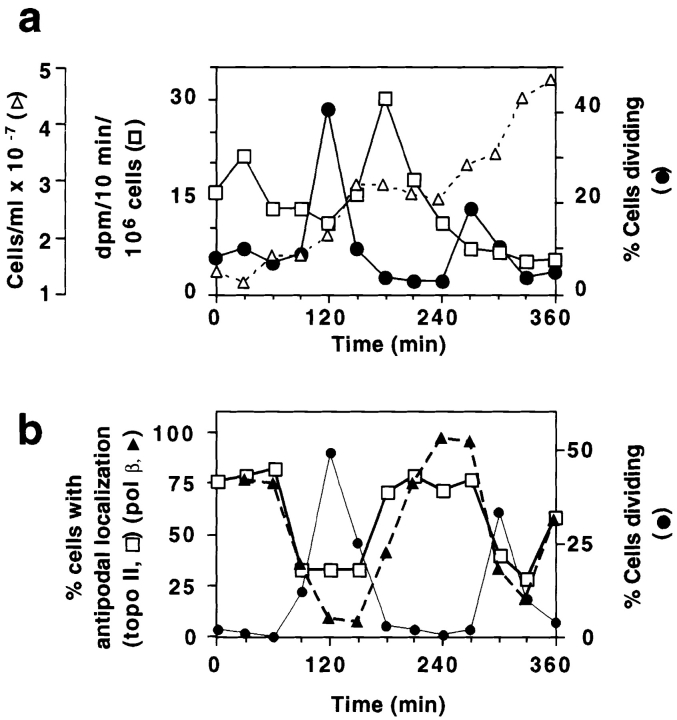
Localization of pol β and topo II in hydroxyurea synchronized C. fasciculata. (a) Cells were treated with hydroxyurea and released into fresh medium at 0 min. Samples were analyzed as described in Materials and Methods for cell division (closed circles), cell density (open triangles), and for the rate of DNA synthesis (open squares). (b) Cells from another synchronized culture were processed for immunofluorescence to detect pol β and topo II and stained with DAPI. The percentage of cells undergoing division (closed circles), percentage of cells with topo II detected in two antipodal sites (open squares), and percentage of cells with pol β detected in two antipodal sites (closed triangles) are shown. At least 200 randomly chosen cells per time point were scored. Results were confirmed three times, and data shown are from a representative experiment. (c and d) Localization of pol β (c) and topo II (d) in cells synchronized with hydroxyurea. The pol β images are from the synchronization in a, and those of topo II are from the experiment in b. Top row, cells during interphase, 210 min after release from hydroxyurea arrest; bottom row, cells during the peak of cell division, 120 min after release from hydroxyurea arrest. Control experiments showed that the weak signal covering the entire cell results from non-specific binding of the secondary antibody (data not shown). Images were captured with a Zeiss 35 mm camera. Bar, 3 μm.
Localization of DNA Polymerase β throughout the Cell Cycle
Our next objective was to localize the pol β at different stages of the cell cycle using cells synchronized with hydroxyurea. We followed the growth of synchronized cultures through two cell division cycles, measuring the rate of incorporation of [3H]thymidine into total cellular DNA, the percentage of dividing cells, and the density of cells in the culture (Fig. 2 a). After release from hydroxyurea arrest, the rate of [3H]thymidine incorporation (Fig. 2 a, open squares) peaks at 30 and 180 min, each peak indicating an S phase. This incorporation is due to synthesis of both nuclear DNA (75% of total) and kDNA (25% of total) (Englund, 1979) that replicate in approximate synchrony (Cosgrove and Skeen, 1970). Sudden increases in the percentage of cells with two nuclei (Fig. 2 a, closed circles) at 120 and 270 min mark passage of the culture through mitosis and indicate the timing of the subsequent cell division. Cytokinesis occurs fairly quickly, and thus the populations of dividing cells also contain some mitotic cells and daughter cells already in G1. This characterization of the C. fasciculata cell cycle agrees with data previously reported (Pasion et al., 1994) and is reproducible between experiments.
Using a synchronized culture, we found that detection of pol β in the antipodal sites is cell cycle dependent. The number of cells with this antipodal localization pattern peaks at 30–60 and 240–270 min, during interphase (Fig. 2 b, closed triangles; c, upper panels). The percentage of cells with this localization pattern decreases during the peak of cell division, however, when only 7% show this localization (Fig. 2 b). Unexpectedly, when not localized in the antipodal sites, the pol β is not detectable by immunofluorescence (Fig. 2 c, lower panels).
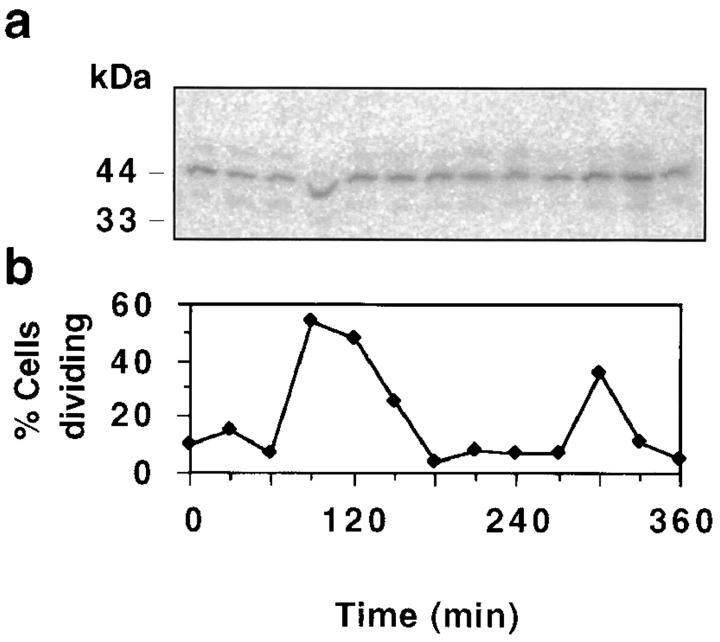
Our inability to detect pol β immunofluorescence in the population of dividing cells raised the possibility that the enzyme abundance may change during the cell cycle. To address this issue, we performed Western blots on whole cell lysates taken at 30 min intervals during synchronized growth of a C. fasciculata culture. We found that the enzyme is present at similar levels in all time points (Fig. 3 a). Thus while the pol β protein is continuously present, it is detectable by immunofluorescence only at certain cell cycle stages. Possible explanations of the inability to immunolocalize this enzyme will be addressed in Discussion.
Figure 3.
Steady-state level of pol β during the C. fasciculata cell cycle. (a) Western blot of whole cell lysates (5 μg protein per lane) made at 30-min intervals from a synchronized culture. Blots were probed with anti–pol β serum and 125I-labeled protein A. Control experiments indicated that PhosphorImager signals are in the linear range. (b) Percentage of cells undergoing cell division in the same culture as determined by DAPI fluorescence and phase microscopy.
Localization of Topoisomerase II throughout the Cell Cycle
To determine whether this cyclic localization pattern was a feature of all enzymes detected in the antipodal sites, we also examined topo II localization at different cell cycle stages, using the same culture as was used for pol β. In this experiment synchronized cells were scored for the presence or absence of topo II in both antipodal sites. During interphase most cells have topo II in both antipodal sites (Figs. 2 b, open squares; d, upper panels), but the percentage of cells with topo II concentrated in these sites decreases during cell division (120 and 300–330 min). Thus the periodicity of topo II localization to both antipodal sites is similar to that of the pol β. Unlike pol β, however, topo II is detectable by immunofluorescence in virtually all cells at all stages of the cell cycle. When topo II is not detected in the antipodal sites, it is present either in a diffuse pattern near the kDNA (Fig. 2 d, lower panels) or in other localization patterns that will be discussed below.
These experiments indicate that both topo II and pol β are periodically detected in the two antipodal sites flanking the network edge. There are significant differences, however, in the timing of these changes in enzyme localization (Fig. 2 b, pol β, closed triangles; topo II, open squares). For example, at the 120-min time point 30% of cells have topo II localized in both antipodal sites, while <10% have pol β in this location. In addition, after cell division the accumulation of topo II in the two antipodal sites precedes that of pol β (Fig. 2 b, see 180-min time point). To further evaluate these differences between topo II and pol β it was necessary to determine the timing of the changes in localization with greater precision. We therefore developed a new method to determine the kDNA replication status in individual, fixed cells from an asynchronous culture. This method, coupled with immunolocalization of the two enzymes, allowed a correlation of enzyme localization with the stage of kDNA replication in individual cells.
A Method for Determination of kDNA Replication Stage in Asynchronous Cells
We determined the kDNA replication stage by fluorescence microscopy of individual cells in which fluorescein-labeled dUTP (dUTP-F) had been incorporated in situ into the endogenous gaps in newly replicated minicircles by terminal deoxynucleotidyl transferase (TdT). This analysis was facilitated by the well-characterized distribution of covalently-closed and gapped minicircles in pre-replication, replicating, and post-replication kDNA in both isolated networks (Englund, 1978; Pérez-Morga and Englund, 1993; Guilbride and Englund, 1998) and for networks in vivo (Ferguson et al., 1992).
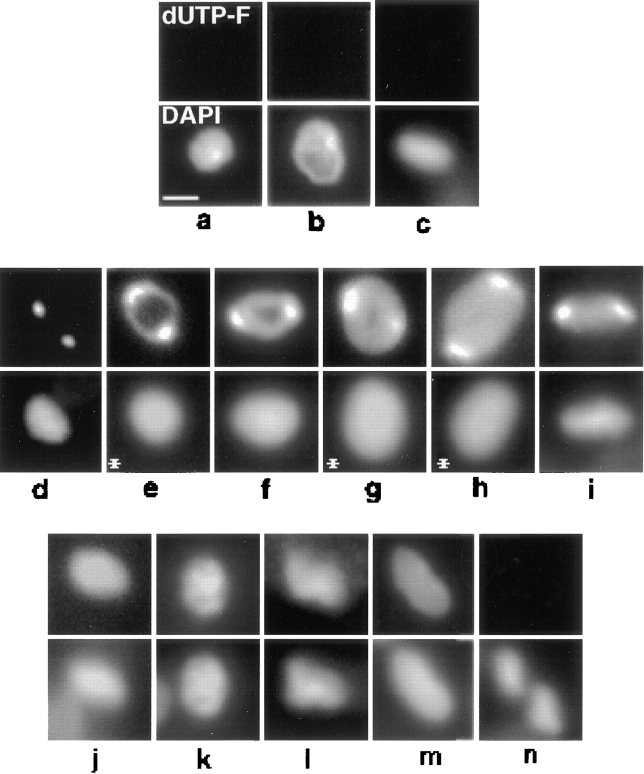
Fig. 4 shows images of the kinetoplast region of dUTP-F–labeled cells from an asynchronous culture. In vivo, the kDNA network is condensed into a disk positioned perpendicularly to the flagellum, and therefore fluorescent images usually provide a view of the edge of the disk, as in Fig. 4, c and i. In fixed cells the kDNA disk is occasionally re-oriented, or “tipped,” providing a view of the face of the disk. The frequency of tipped networks can be increased by a mild protease treatment (examples in Fig. 4, e, g, and h) (Ferguson et al., 1992). Since images of a tipped disk are more informative about the degree of replication in a partially replicated network, we chose most examples in Fig. 4 with the disk tipped.
Figure 4.
In situ analysis of kDNA replication in fixed cells from an asynchronous culture. dUTP-F was incorporated into endogenous minicircle gaps by TdT as described in Materials and Methods. Top row, dUTP-F fluorescence of kDNA networks. Bottom row, DAPI fluorescence. (a–c) Pre-replication networks. (d–i) Replicating networks. (j–m) Postreplication networks. (n) Two fully repaired, post scission networks, both in a cell undergoing cytokinesis. The kDNA networks in c and i are positioned vertically. Images were captured with a Photometrics slow-scan CCD camera using IPLab software. Networks in cells treated with proteinase K to reposition the network for a horizontal view are indicated with an asterisk. Treatment with proteinase K was modified from a previous method (Ferguson et al., 1992). Before either immunofluorescence or dUTP-F labeling, fixed cells were treated at room temperature for 15 min with 1 μg/ml Proteinase K in 10 mM Tris-HCl, 1 mM EDTA, 150 mM NaCl, and 0.1% SDS. Slides were then given three 5-min washes in PBS containing 1 mM PMSF, and one 5-min wash in PBS. Without protease treatment, ∼8% of cells contain tipped networks. Treatment with protease increases the frequency of horizontally positioned networks to ∼25%. Bar, 1 μm.
Pre-replication networks do not label with dUTP-F because the minicircles are all covalently closed (Fig. 4, a–c). In contrast, networks undergoing replication have a peripheral ring of dUTP-F label and a central zone of unlabeled minicircles (Fig. 4, e–g). kDNA at an early stage of replication has a narrow peripheral ring (Fig. 4 e) that increases in thickness during the replication process (Fig. 4, e–g). Replicating networks (Fig. 4, d–i) are always flanked by two antipodally positioned, bright dUTP-F spots. These bright spots colocalize with pol β and topo II (see below), and their intense labeling by dUTP-F is probably due to the presence of highly gapped, free minicircle replication intermediates (Johnson, 1998). Fig. 4 d shows a network flanked by antipodal spots of dUTP-F, but without the peripheral ring of fluorescence. This image likely represents the earliest stage of kDNA replication before a significant number of gapped minicircles have been attached to the network periphery. Consistent with this possibility, the dUTP-F fluorescence in Fig. 4 d was weak and required a longer (58 s) exposure time than other images in Fig. 4, e–l (1.5–4 s). Some replicating networks, while flanked by bright dUTP-F spots, appear to lack an unlabeled central zone (Fig. 4 h). In these cases, in the final stages of kDNA replication, the central unlabeled zone is probably too small to have been observed with fluorescence microscopy. Since the network in Fig. 4 i is positioned vertically it is impossible to determine whether it is early or late in the replication process, but it is characterized as replicating because of the antipodally positioned bright dUTP-F spots. Postreplication kDNA networks label uniformly with dUTP-F because all of the minicircles are gapped, and these networks are not flanked by bright dUTP-F spots (Fig. 4, j–l). Some postreplication networks appear irregularly shaped, often like a “V,” and do not lie in a single plane of focus (Fig. 4 l). Networks with this irregular structure may be beginning the network scission process. Repair of the remaining minicircle gaps occurs before network scission (Pérez-Morga and Englund, 1993b ) and results in reduction and ultimately elimination of dUTP-F fluorescence (Fig. 4 m is probably a partially repaired network). Finally, after network scission, the cells contain two kDNA networks that do not incorporate dUTP-F as all the minicircles are covalently closed (Fig. 4 n).
Localization of Pol β in Asynchronously Growing Cells
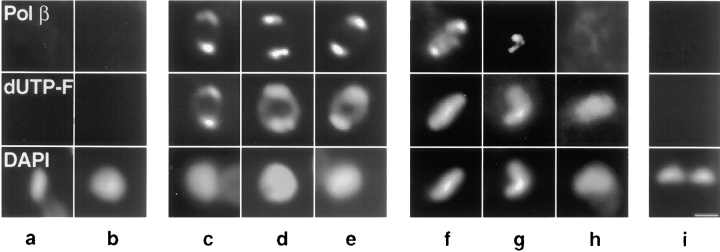
We used immunofluorescence to determine the location of pol β in cells that had been first labeled with dUTP-F to determine the stage of kDNA replication (see Table I and Fig. 5). In cells which had not initiated kDNA replication, we detected no pol β immunofluorescence (Fig. 5, a–b). In contrast, 100% of the cells undergoing kDNA replication had pol β localized in the two antipodal sites (Fig. 5, c–e) that co-localize with the two bright spots of dUTP-F fluorescence. After replication is complete, different patterns of pol β localization were observed. In 54% of these cells, pol β was found in the two antipodal sites (Fig. 5 f). At this stage of kDNA replication, some weak pol β signal is also detected in the kDNA region (Fig. 5 f). The rest of the post-replication networks either contain no detectable pol β immunofluorescence (33%, Fig. 5 h) or the enzyme is in other locations (13% of post-replication cells, see Fig. 5 g). Finally, in dividing cells which have two daughter kDNA networks (following gap repair and network scission), none showed detectable pol β immunofluorescence (Fig. 5 i).
Table I.
Localization of Pol β and Topo II
| kDNA network type* | Percent of cells with kDNA network type‡ | DNA polymerase β localization§ (% of network type) | Topoisomerase II localization‖ (% of network type) | |||||||||||
|---|---|---|---|---|---|---|---|---|---|---|---|---|---|---|
| Two antipodal sites | Not detected | Other locations ¶ | Two sites per network | One site per network | Other locations ¶ | |||||||||
| Pre-replication | 27 | 0 | 100 | 0 | 43 | 35 | 21 | |||||||
| Replicating | 58 | 100 | 0 | 0 | 100 | 0 | 0 | |||||||
| Postreplication | 7 | 54 | 33 | 13 | 73 | 0 | 27 | |||||||
| Repaired and | 8 | 0 | 100 | 0 | 0 | 60 | 40 | |||||||
| Postscission** | ||||||||||||||
Cells were labeled with dUTP-F (to mark the newly replicated, gapped minicircles) and then with antibody to either pol β or topo II. Experiments were repeated at least three times, and data shown are from a representative experiment.
Network type was determined by DAPI and dUTP-F labeling in situ. See text and Fig. 4 for characteristics of each network type.
Determined by evaluating 400 cells from an asynchronous culture.
For each network type, 28–50 cells were scored.
For each network type, 51–94 cells were scored.
Cells in these categories typically show localization throughout the region of the kDNA network.
These cells contain two kDNA networks that do not label with dUTP-F.
Figure 5.
Analysis of pol β localization in asynchronous cells labeled with dUTP-F. dUTP-F was incorporated into endogenous gaps in kDNA by TdT and cells were then processed for immunofluorescence. Pol β was visualized with goat anti–rabbit antibody conjugated to Texas red (Molecular Probes, Inc.). Images were captured as in Fig. 4. Top row, pol β immunofluorescence. Middle row, dUTP-F fluorescence of kDNA networks. Bottom row, DAPI fluorescence of kDNA networks. (a and b) Pre-replication networks. (c–e) Replicating networks. (f–h) Post-replication networks. (i) Postscission kDNA networks in a cell undergoing cytokinesis. Bar, 1 μm.
Localization of Topo II in Asynchronously Growing Cells
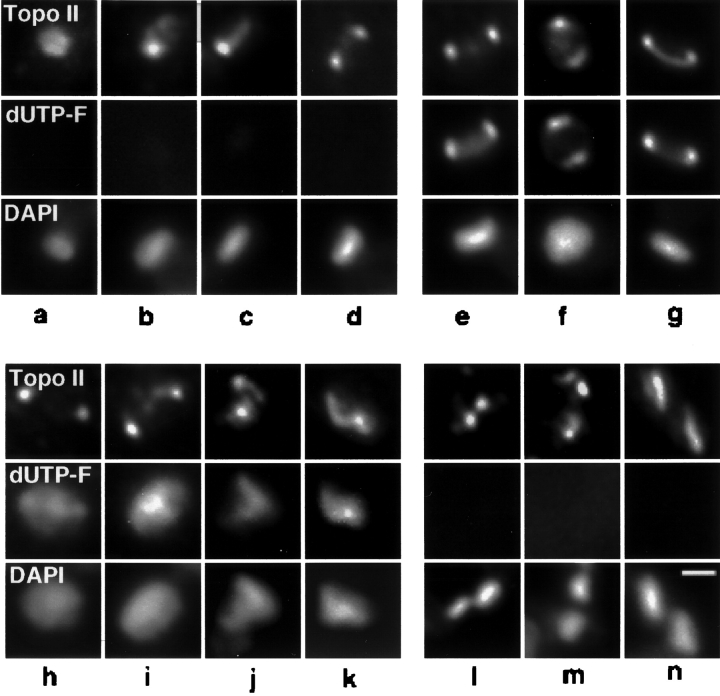
At certain stages of kDNA replication the pattern of topo II localization in cells labeled with dUTP-F differed significantly from that of pol β (Table I; Fig. 6). Before the onset of kDNA replication all cells had topo II detectable in the kinetoplast region; in 22% topo II was found to be diffuse throughout the kDNA region (Fig. 6 a). In nearly half (43%) of pre-replication cells topo II was localized to both antipodal sites (Fig. 6 d), but surprisingly, 35% had topo II concentrated at only a single site at the network edge (Fig. 6, b and c).
Figure 6.
Analysis of topo II localization in asynchronous cells labeled with dUTP-F. dUTP-F was incorporated into endogenous gaps in kDNA by TdT, and cells were then processed for immunofluorescence. Topo II was visualized with goat anti–mouse antibody conjugated to Cy3 (Boehringer Mannheim Corp.). Images were captured as in Fig. 4. Top row, topo II immunofluorescence. Middle row, dUTP-F fluorescence of kDNA networks. Bottom row, DAPI fluorescence of kDNA networks. (a–d) Pre-replication networks. (e–g) Replicating kDNA networks. (h–k) Postreplication kDNA networks. (l–n) Cells containing two kDNA networks. Bar, 1 μm.
As with pol β, all cells undergoing kDNA replication had topo II concentrated in both antipodal sites, which colocalized with the bright spots of dUTP-F fluorescence (Fig. 6, e–g). Additionally, some weaker topo II signal was detected in the region of the kDNA network. After network replication, topo II remains localized to both antipodal sites in 73% of cells (Fig. 6, h–j), but it has a more diffuse localization in the kDNA region in the other 27% (Fig. 6 k). Once the processes of network repair and scission are complete, 60% of cells still have topo II localized in two discrete sites, although now each daughter network is associated with only a single site of topo II localization (Fig. 6, l and m). The remaining 40% of these cells have topo II diffusely localized in the kDNA region (Fig. 6 n).
Localization of DNA Primase throughout the Cell Cycle
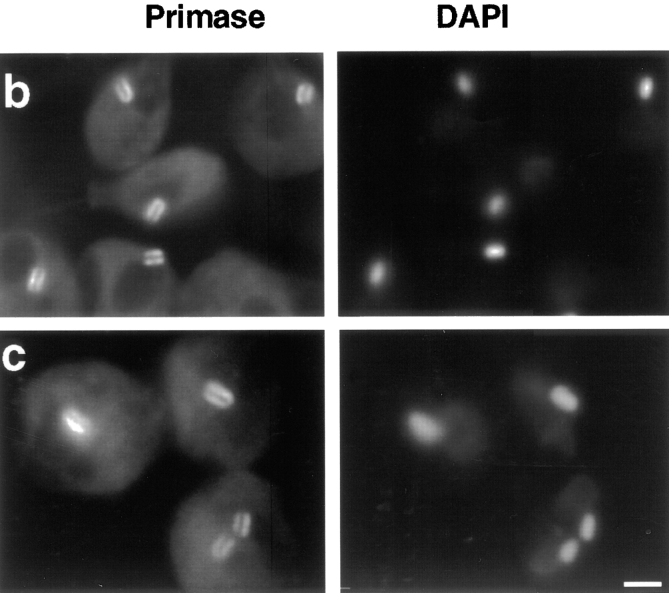
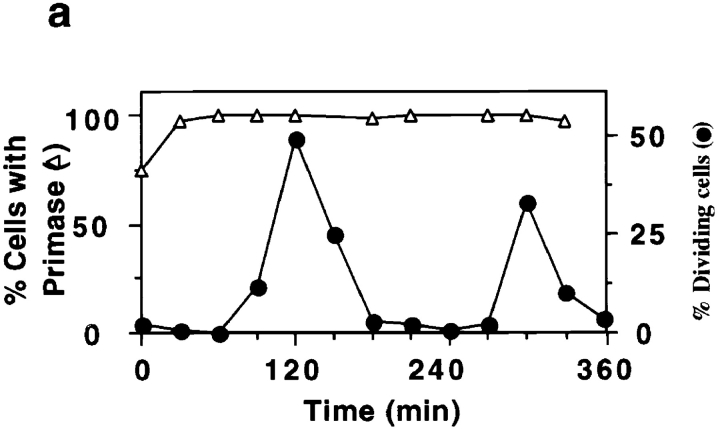
Given the cell cycle variation in localization pattern of pol β and topo II, we were interested to determine whether the localization of enzymes not detected in the antipodal sites also varied during the cell cycle. To this end, we performed immunolocalization of the DNA primase in conjunction with hydroxyurea synchronization. In asynchronous cells, primase is localized to regions adjacent to the faces of the kDNA disk (Li and Englund, 1997). Using synchronized cultures we found that the primase is detectable in virtually all cells (Fig. 7 a), and is similarly localized to the two network faces at all stages of the cell cycle (see Fig. 7 b for examples of cells in S phase; and c for examples of dividing cells).
Figure 7.
DNA primase localization during the C. fasciculata cell cycle. Cells from a synchronized culture were processed for immunofluorescence and stained with DAPI. (a) Percentage of cells undergoing cell division (closed circles), and percentage of cells with DNA primase localized above and below the kDNA disk (open triangles). (b) Localization of DNA primase during S phase, 60 min after release from hydroxyurea arrest. (c) Localization of DNA primase from the peak of cell division, 120 min after release from hydroxyurea arrest. The same localization of primase was seen at other time points. Left column, DNA primase localization detected by goat anti–mouse antibody conjugated to fluorescein. Right column, cells stained with DAPI to visualize the brightly stained kDNA and dimly stained nuclear DNA. Images were captured as described in the legend of Fig. 1. Bar, 3 μm.
Discussion
The specific location of replication enzymes in unique sites surrounding the kDNA network is one of the most striking features of the kDNA replication system. In this paper we demonstrate the colocalization of pol β and topo II, and use two independent methods to analyze the changes in location of three replication enzymes during the cell cycle. Surprisingly, we found that these enzymes acted differently. The DNA primase, localized adjacent to the faces of the kDNA disk, was invariant during the cell cycle. In contrast, pol β and topo II colocalize to the antipodal sites during the period of kDNA replication, but behaved differently at other cell cycle stages.
Cell Cycle–dependent Changes in Pol β
Although pol β is located in the antipodal sites throughout kDNA replication (Figs. 2 and 5; Table I), this localization pattern is not static. Despite constant levels of protein (indicated by Western blots, see Fig. 3), the enzyme ceases to be detectable by immunofluorescence shortly after network replication is complete. Pol β remains undetectable by immunofluorescence throughout G1, and then reappears in the antipodal sites abruptly at the onset of kDNA replication. This coincidence of renewed detectability of pol β and the initiation of kDNA replication is striking, and suggests these events are coordinately regulated. Furthermore, the appearance of pol β in the two antipodal sites precisely at the onset of kDNA replication suggests that this enzyme has an essential role in that process. Given its lack of fidelity and low processivity (Torri et al., 1994), however, it is unlikely to be the major replicative enzyme, and we have recently detected and partially purified a second mitochondrial DNA polymerase which may play that role (Klingbeil, M., and P.T. Englund, unpublished observations). Since pol β enzymes efficiently fill gapped templates (Torri et al., 1994; Singhal et al., 1995), the C. fasciculata pol β is well positioned in the antipodal sites to function in the partial repair of the highly gapped minicircle progeny, a process known to occur just before reattachment to the network (Kitchin et al., 1985). Later in the Discussion section we will comment on the lack of detectability of pol β by immunofluorescence during part of the cell cycle.
Topo II Localization throughout the Cell Cycle
Topo II, like pol β, is always detected in the two antipodal sites during kDNA replication (Figs. 2 and 6, and Table I). Unlike pol β, however, topo II is detected by immunofluorescence at all cell cycle stages, and is antipodally localized in some pre-replication and postreplication cells. In addition, at these times before and after kDNA replication, topo II is frequently localized to a single site at the network edge in some cells. Presumably, after kDNA replication, a post-replication network associated with two antipodally-positioned sites divides into two daughter networks, each associated with a single site. Consistent with this hypothesis, we never observed a post-scission network flanked by two antipodal sites. Thus, during cell division, each daughter cell must inherit a single site and a daughter kDNA network, yielding a G1 cell with a single site associated with the pre-replication network. The second antipodal site must then form during G1.
Significance and Function of the Antipodal Sites
What is the nature of the two antipodal sites to which pol β and topo II colocalize? It is unlikely that the sites are comprised of stoichiometric complexes of these enzymes, since crude estimates of their relative abundance (based on recovery of activity during purification) indicate that pol β is ∼50-fold more abundant than topo II.
Our detection of topo II in discrete site(s) at all cell cycle stages suggests that these sites are permanent structures in the mitochondrial architecture. The sites are consistently found in the same focal plane and antipodal position relative to the kDNA (Ferguson et al., 1992), indicating their fixed position within the mitochondrial matrix. Such organized sites for enzyme localization may ensure not only that newly replicated minicircles are attached at opposing edges of the network (Simpson and Simpson, 1976; Pérez-Morga and Englund, 1993a ), but could also establish the spatial configuration of other processes in the maintenance of the kDNA network. For example, one could speculate a role for the sites in establishing the line of cleavage in the center of the network before network scission. That the primase is also localized in fixed positions throughout the cell cycle indicates that this enzyme may also associate with structural elements that are permanent components of the mitochondrial matrix. Clearly, to further understand the intramitochondrial organization of these proteins it will be necessary to identify other components of both the antipodal sites and the areas colocalizing with primase.
As fixed components within the mitochondrion, these localization sites may also associate with structures within the mitochondrial membrane, or even outside the mitochondrion. Experiments on Saccharomyces cerevisiae demonstrated that the mtDNA is anchored to the mitochondrial membrane, and such anchoring explains the non-random mtDNA inheritance patterns (Nunnari et al., 1997). In bacteria, accumulating evidence suggests multiprotein complexes bridging the cell membrane and the bacterial genome function in chromosome maintenance and inheritance (Firshein and Kim, 1997; Mohl and Gober, 1997). In T. brucei, the kDNA network is physically attached (through the mitochondrial membrane) to the basal bodies (Robinson and Gull, 1991). Furthermore, kDNA segregation is dependent upon the microtubule-mediated basal body separation (Robinson and Gull, 1991). A basal body–kDNA network association is also found in C. fasciculata (Robinson, D.R., and P.T. Englund, unpublished observations). Unfortunately, antibodies specific to either basal bodies or the network attachment site in C. fasciculata are currently unavailable. However, experiments correlating the relative positions of the topo II–localization sites with sites of basal body–kDNA attachment could elucidate the possible functions of these localization sites in kDNA maintenance or segregation.
The Pol β Conundrum
We do not know why pol β is undetected by immunofluorescence at some cell cycle stages, since the steady state protein level does not change (Fig. 2). One possibility is that pol β is dynamically localized to the antipodal sites during the cell cycle. The enzyme could assemble at the antipodal sites during kDNA replication, subsequently disassemble, and disperse throughout the mitochondrial matrix. When not sequestered in the antipodal sites the enzyme may be too dilute for immunofluorescence detection. Our attempts to detect dispersed pol β signal with long exposures resulted only in amplification of background signal throughout the cell, and the result was not distinguishable from control experiments in which we used only secondary antibody. Another explanation is that during G1 and cytokinesis pol β epitopes may be obscured, or masked, by protein–protein interactions that make the protein unrecognizable to antibodies in situ. The “masked” pol β could be located either in the antipodal sites, or dispersed throughout the mitochondrion.
Candidates for proteins that may interact with pol β include DNA repair enzymes. Mammalian nuclear pol β has been well characterized for its role in base excision repair (Nealon et al., 1996; Sobol et al., 1996), and it is known to form complexes with other base excision repair enzymes such as AP endonuclease (Bennett et al., 1997) and DNA ligase (Prasad et al., 1996). The abundance of reactive oxygen species, which are known to damage DNA, in mitochondria may necessitate such a repair pathway in this organelle (Richter, 1995). In support of this possibility we have recently detected and partially purified an abundant AP endonuclease (a key enzyme in the base excision repair pathway) from C. fasciculata mitochondria (Saxowsky, T., and P.T. Englund, unpublished observations). Thus in C. fasciculata mitochondria, pol β may function in kDNA replication by filling in minicircle gaps, and then subsequently interact with base excision repair enzymes and fulfill a second role in DNA repair.
Regulation of kDNA Replication
This work has implications for the control of kDNA replication. Unlike mammalian mitochondrial DNA (see Introduction), kDNA replication has been known for many years to proceed during a discrete phase of the cell cycle, with timing close to that of the nuclear S phase (Cosgrove and Skeen, 1970; Simpson and Braly, 1970; Woodward and Gull, 1990). Little is known about either the molecular factors that trigger the initiation of kDNA replication or the synchronization of this event with nuclear DNA replication. Ray and co-workers have shown a cell cycle dependence in the periodic accumulation of mRNA levels of genes for certain proteins involved in kDNA and nuclear replication (Pasion et al., 1994; Brown and Ray, 1997; Hines and Ray, 1997). Their finding obviously relates to kDNA replication control and the synchrony of replication of nuclear and kDNA. We suggest that the intramitochondrial reorganization of certain replication enzymes may also play a role in control of kDNA replication. It will be of great interest to identify the factors that trigger these enzymes to assemble at discrete sites around the kDNA, and to further understand the nature and function of these antipodal sites.
Acknowledgments
We thank D. Ray for the gift of the anti–topo II antibody, C. Li for anti-primase antibody, A. Torri for preparation of the pol β expression construct, and V. Klein for early morning assistance. We thank T. Shapiro, B. Sollner-Webb, and members of our lab for critical reading of the manuscript, and D. Robinson, L. Rocco Carpenter, and T. Shapiro for many helpful discussions.
This work was supported by a grant (GM27608) from the National Institutes of Health. C.E. Johnson was supported in part by National Institutes of Health training grant 2T32 GM07445.
Abbreviations used in this paper
- kDNA
kinetoplast DNA
- pol β
DNA polymerase β
- topo II
topoisomerase II
- DAPI
4,6-diamidino-2-phenylindole
- TdT
terminal deoxynucleotidyltransferase
- dUTP-F
fluorescein-5(6)-carboxamidocaproyl-[5-(3-aminoallyl)-2′-deoxy-uridine-5′-triphosphate
- RP-A
replication protein A
References
- Benne R. RNA editing in trypanosomes. Eur J Biochem. 1994;221:9–23. doi: 10.1111/j.1432-1033.1994.tb18710.x. [DOI] [PubMed] [Google Scholar]
- Bennett RAO, Wilson DM, Wong D, Demple B. Interaction of human apurinic endonuclease and DNA polymerase beta in the base excision repair pathway. Proc Natl Acad Sci USA. 1997;94:7166–7169. doi: 10.1073/pnas.94.14.7166. [DOI] [PMC free article] [PubMed] [Google Scholar]
- Bogenhagen D, Clayton DA. Mouse L cell mitochondrial DNA molecules are selected randomly for replication throughout the cell cycle. Cell. 1977;11:719–727. doi: 10.1016/0092-8674(77)90286-0. [DOI] [PubMed] [Google Scholar]
- Brown LM, Ray DS. Cell cycle regulation of RPA1 transcript levels in the trypanosomatid Crithidia fasciculata. . Nucleic Acids Res. 1997;25:3281–3289. doi: 10.1093/nar/25.16.3281. [DOI] [PMC free article] [PubMed] [Google Scholar]
- Cosgrove WB, Skeen MJ. The cell cycle in Crithidia fasciculata. Temporal relationships between synthesis of deoxyribonucleic acid in the nucleus and in the kinetoplast. J Protozool. 1970;17:172–177. doi: 10.1111/j.1550-7408.1970.tb02350.x. [DOI] [PubMed] [Google Scholar]
- Englund PT. The replication of kinetoplast DNA networks in Crithidia fasciculata. . Cell. 1978;14:157–168. doi: 10.1016/0092-8674(78)90310-0. [DOI] [PubMed] [Google Scholar]
- Englund PT. Free minicircles of kinetoplast DNA in Crithidia fasciculata. . J Biol Chem. 1979;254:4895–4900. [PubMed] [Google Scholar]
- Ferguson M, Torri AF, Ward DC, Englund PT. In situ hybridization to the Crithidia fasciculatakinetoplast reveals two antipodal sites involved in kinetoplast DNA replication. Cell. 1992;70:621–629. doi: 10.1016/0092-8674(92)90431-b. [DOI] [PubMed] [Google Scholar]
- Firshein W, Kim P. Plasmid replication and partition in Escherichia coli: is the cell membrane the key? . Mol Microbiol. 1997;23:1–10. doi: 10.1046/j.1365-2958.1997.2061569.x. [DOI] [PubMed] [Google Scholar]
- Gavrieli Y, Sherman Y, Ben-Sasson SA. Identification of programmed cell death in situvia specific labeling of nuclear DNA fragmentation. J Cell Biol. 1992;119:493–501. doi: 10.1083/jcb.119.3.493. [DOI] [PMC free article] [PubMed] [Google Scholar]
- Guilbride DL, Englund P. The replication mechanism of kinetoplast DNA networks in several trypanosomatid species. J Cell Sci. 1998;111:675–679. doi: 10.1242/jcs.111.6.675. [DOI] [PubMed] [Google Scholar]
- Hajduk SL, Klein VA, Englund PT. Replication of kinetoplast DNA maxicircles. Cell. 1984;36:483–492. doi: 10.1016/0092-8674(84)90241-1. [DOI] [PubMed] [Google Scholar]
- Harlow, E., and D. Lane. 1988. Antibodies: A Laboratory Manual. Cold Spring Harbor Laboratory, Cold Spring Harbor, NY. 498 pp.
- Hines JC, Ray DS. Periodic synthesis of kinetoplast DNA topoisomerase II during the cell cycle. Mol Biochem Parasitol. 1997;88:249–252. doi: 10.1016/s0166-6851(97)00076-5. [DOI] [PubMed] [Google Scholar]
- Johnson, C. 1998. Kinetoplast DNA Replication in Crithidia fasciculata: Analysis of Replication Enzymes and Minicircle Replication Intermediates during the Cell Division Cycle. Ph.D. thesis. The Johns Hopkins University, Baltimore, MD. 130 pp.
- Kitchin PA, Klein VA, Englund PT. Intermediates in the replication of kinetoplast DNA minicircles. J Biol Chem. 1985;260:3844–3851. [PubMed] [Google Scholar]
- Li C, Englund PT. A mitochondrial DNA primase from the trypanosomatid Crithidia fasciculata. . J Biol Chem. 1997;272:20787–20792. doi: 10.1074/jbc.272.33.20787. [DOI] [PubMed] [Google Scholar]
- Melendy T, Sheline C, Ray DS. Localization of a type II DNA topoisomerase to two sites at the periphery of the kinetoplast DNA of Crithidia fasciculata. . Cell. 1988;55:1083–1088. doi: 10.1016/0092-8674(88)90252-8. [DOI] [PubMed] [Google Scholar]
- Mohl DA, Gober JW. Cell cycle–dependent polar localization of chromosome partitioning proteins in Caulobacter crescentus. . Cell. 1997;88:675–684. doi: 10.1016/s0092-8674(00)81910-8. [DOI] [PubMed] [Google Scholar]
- Nealon K, Nicholl ID, Kenny MK. Characterization of the DNA polymerase requirement of human base excision repair. Nucleic Acids Res. 1996;24:3763–3770. doi: 10.1093/nar/24.19.3763. [DOI] [PMC free article] [PubMed] [Google Scholar]
- Nunnari J, Marshall WF, Straight A, Murray A, Sedat JW, Walter P. Mitochondrial transmission during mating in Saccharomyces cerevisiaeis determined by mitochondrial fusion and fission and the intramitochondrial segregation of mitochondrial DNA. Mol Biol Cell. 1997;8:1233–1242. doi: 10.1091/mbc.8.7.1233. [DOI] [PMC free article] [PubMed] [Google Scholar]
- Pasion SG, Brown GW, Brown LM, Ray DS. Periodic expression of nuclear and mitochondrial DNA replication genes during the trypanosomatid cell cycle. J Cell Sci. 1994;107:3515–3520. doi: 10.1242/jcs.107.12.3515. [DOI] [PubMed] [Google Scholar]
- Pérez-Morga D, Englund PT. The attachment of minicircles to kinetoplast DNA networks during replication. Cell. 1993a;74:703–711. doi: 10.1016/0092-8674(93)90517-t. [DOI] [PubMed] [Google Scholar]
- Pérez-Morga D, Englund PT. The structure of replicating kinetoplast DNA networks. J Cell Biol. 1993b;123:1069–1079. doi: 10.1083/jcb.123.5.1069. [DOI] [PMC free article] [PubMed] [Google Scholar]
- Prasad R, Singhal RK, Srivastava DK, Molina JT, Tomkinson AE, Wilson SH. Specific interaction of DNA polymerase beta and DNA ligase I in a multiprotein base excision repair complex from bovine testis. J Biol Chem. 1996;271:16000–16007. doi: 10.1074/jbc.271.27.16000. [DOI] [PubMed] [Google Scholar]
- Ray DS. Kinetoplast DNA minicircles: high-copy-number mitochondrial plasmids. Plasmid. 1987;17:177–190. doi: 10.1016/0147-619x(87)90026-6. [DOI] [PubMed] [Google Scholar]
- Richter C. Oxidative damage to mitochondrial DNA and its relationship to aging. Int J Biochem Cell Biol. 1995;27:647–653. doi: 10.1016/1357-2725(95)00025-k. [DOI] [PubMed] [Google Scholar]
- Robinson DR, Gull K. Basal body movements as a mechanism for mitochondrial genome segregation in the trypanosome cell cycle. Nature. 1991;352:731–733. doi: 10.1038/352731a0. [DOI] [PubMed] [Google Scholar]
- Shadel GS, Clayton DA. Mitochondrial DNA maintenance in vertebrates. Annu Rev Biochem. 1997;66:409–435. doi: 10.1146/annurev.biochem.66.1.409. [DOI] [PubMed] [Google Scholar]
- Shapiro TA, Englund PT. The structure and replication of kinetoplast DNA. Annu Rev Microbiol. 1995;49:117–143. doi: 10.1146/annurev.mi.49.100195.001001. [DOI] [PubMed] [Google Scholar]
- Shlomai J. The assembly of kinetoplast DNA. Parasitol Today. 1994;10:341–346. doi: 10.1016/0169-4758(94)90244-5. [DOI] [PubMed] [Google Scholar]
- Simpson AM, Simpson L. Pulse-labeling of kinetoplast DNA: localization of 2 sites of synthesis within the networks and kinetics of labeling of closed minicircles. J Protozool. 1976;23:583–587. doi: 10.1111/j.1550-7408.1976.tb03846.x. [DOI] [PubMed] [Google Scholar]
- Simpson L, Braly P. Synchronization of Leishmania tarentolaeby hydroxyurea. J Protozool. 1970;17:511–517. doi: 10.1111/j.1550-7408.1970.tb04719.x. [DOI] [PubMed] [Google Scholar]
- Simpson L, Thiemann OH. Sense from nonsense: RNA editing in mitochondria of kinetoplastid protozoa and slime molds. Cell. 1995;81:837–840. doi: 10.1016/0092-8674(95)90003-9. [DOI] [PubMed] [Google Scholar]
- Singhal RK, Prasad R, Wilson SH. DNA polymerase beta conducts the gap-filling step in uracil-initiated base excision repair in a bovine testis nuclear extract. J Biol Chem. 1995;270:949–957. doi: 10.1074/jbc.270.2.949. [DOI] [PubMed] [Google Scholar]
- Sobol RW, Horton JK, Kuhn R, Gu H, Singhal RK, Prasad R, Rajewsky K, Wilson SH. Requirement of mammalian DNA polymerase-β in base-excision repair. Nature. 1996;379:183–186. doi: 10.1038/379183a0. [DOI] [PubMed] [Google Scholar]
- Stuart K. Mitochondrial DNA of an African trypanosome. J Cell Biochem. 1983;23:13–26. doi: 10.1002/jcb.240230103. [DOI] [PubMed] [Google Scholar]
- Torri AF, Englund PT. A DNA polymerase beta in the mitochondrion of the trypanosomatid Crithidia fasciculata. . J Biol Chem. 1995;270:3495–3497. doi: 10.1074/jbc.270.8.3495. [DOI] [PubMed] [Google Scholar]
- Torri AF, Kunkel TA, Englund PT. A β-like DNA polymerase from the mitochondrion of the trypanosomatid Crithidia fasciculata. . J Biol Chem. 1994;269:8165–8171. [PubMed] [Google Scholar]
- Wolstenholme DR, Renger HC, Manning JE, Fouts DL. Kinetoplast DNA of Crithidia. . J Protozool. 1974;21:622–631. doi: 10.1111/j.1550-7408.1974.tb03716.x. [DOI] [PubMed] [Google Scholar]
- Woodward R, Gull K. Timing of nuclear and kinetoplast DNA replication and early morphological events in the cell cycle of Trypanosoma brucei. . JCell Sci. 1990;95:49–57. doi: 10.1242/jcs.95.1.49. [DOI] [PubMed] [Google Scholar]


