

Abstract
Bone has an enormous capacity for growth, regeneration, and remodeling. This capacity is largely due to induction of osteoblasts that are recruited to the site of bone formation. The recruitment of osteoblasts has not been fully elucidated, though the immediate environment of the cells is likely to play a role via cell– matrix interactions. We show here that heparin-binding growth-associated molecule (HB-GAM), an extracellular matrix–associated protein that enhances migratory responses in neurons, is prominently expressed in the cell matrices that act as target substrates for bone formation. Intriguingly, N-syndecan, which acts as a receptor for HB-GAM, is expressed by osteoblasts/osteoblast precursors, whose ultrastructural phenotypes suggest active cell motility. The hypothesis that HB-GAM/N-syndecan interaction mediates osteoblast recruitment, as inferred from developmental studies, was tested using osteoblast-type cells that express N-syndecan abundantly. These cells migrate rapidly to HB-GAM in a haptotactic transfilter assay and in a migration assay where HB-GAM patterns were created on culture wells. The mechanism of migration is similar to that previously described for the HB-GAM–induced migratory response of neurons. Our hypothesis that HB-GAM/N-syndecan interaction participates in regulation of osteoblast recruitment was tested using two different in vivo models: an adjuvant-induced arthritic model and a transgenic model. In the adjuvant-induced injury model, the expression of HB-GAM and of N-syndecan is strongly upregulated in the periosteum accompanying the regenerative response of bone. In the transgenic model, the HB-GAM expression is maintained in mesenchymal tissues with the highest expression in the periosteum. The HB-GAM transgenic mice develop a phenotype characterized by an increased bone thickness. HB-GAM may thus play an important role in bone formation, probably by mediating recruitment and attachment of osteoblasts/osteoblast precursors to the appropriate substrates for deposition of new bone.
Keywords: heparin-binding growth-associated molecule, N-syndecan, osteoblast, bone, transgenic mice
Bone is characterized by an extraordinary capacity for growth, regeneration, and remodeling throughout life. This capacity has been largely attributed to a series of diffusible growth and differentiation factors that lead to formation of bone by inducing differentiation of osteoblasts (Rosen and Thies, 1992; Kingsley, 1994; Bonewald, 1996). The process of new bone formation can be divided into several stages. At an initial stage, precursors of osteoblasts are recruited to the site for osteoid deposition. After arriving, these cells differentiate into fully functional, osteoid-producing osteoblasts (Bonewald, 1996). To form appropriate shape and mass of future bone, the recruitment of the osteoblast precursors must be precisely regulated.
Osteoblasts/osteoblast precursors are shown to be recruited by chemotactic signals via diffusible factors like TGF-βs (Bonewald, 1996), at least to the vicinity of their destinations. At the stage of osteoid deposition, osteoblasts are always found attached to substrates, although the target substrates may vary in different locations and at different developmental stages. For example, the mineralized cartilage during endochondral ossification, the bone surface during appositional ossification, and the head epithelia during intramembranous ossification of the skull serve as the substrates for osteoid deposition. This evidence leads to the hypothesis that the osteoblast recruitment and attachment to their target substrates may be mediated by contact-dependent signal(s) provided by yet unidentified molecule(s) immobilized in the target substrates.
Heparin-binding growth-associated molecule (HB-GAM)1 (also designated as pleiotrophin) is an extracellular matrix–associated protein rich in lysine and cysteine residues (Li et al., 1990; Merenmies and Rauvala, 1990). HB-GAM is rapidly secreted from cells upon cleavage of its classic-type secretion signal (Raulo et al., 1994). The sequence of HB-GAM is conserved more than 95% in the human, rat, bovine, and chicken (Li et al., 1990; Hulmes et al., 1993) and shares 50% homology with midkine (Tomomura et al., 1990). HB-GAM was first isolated from developing rat brain (Rauvala, 1989), but it also occurs in many nonneuronal tissues during embryonic development (Mitsiadis et al., 1995). During development, the expression of HB-GAM is strictly regulated both in neuronal and nonneuronal tissues. High expression levels of HB-GAM are found in fiber pathways of the developing nervous system (Rauvala et al., 1994) and in basement membranes outside of the nervous system (Mitsiadis et al., 1995). Interestingly, a cDNA clone having the same sequence as HB-GAM was isolated from a murine osteosarcoma cell line MC3T3, and the protein was termed as osteoblast stimulating factor-1 (OSF-1) (Tezuka et al., 1990). Up to 3.5 mg/kg of HB-GAM/ OSF-1 could be isolated from bovine bone (Zhou et al., 1992), and such a high amount has been found in no other tissue except the developing brain (Rauvala, 1989). However, the function of HB-GAM in bone tissue remains to be determined.
Syndecans are sequence-related transmembrane heparan sulfate proteoglycans sharing a conserved intracellular domain but having structurally heterogeneous extracellular domains (for reviews see Bernfield et al., 1992; Carey, 1997). Up to now, four different members of syndecans have been cloned (Marynen et al., 1989; Saunders et al., 1989; Carey et al., 1992; David et al., 1992), and expression of each member is strictly regulated in tissue type– and developmental stage–specific manners (Carey, 1997). For instance, syndecan-3 was originally cloned from rat Schwann cell cDNA library and has been named as N-syndecan because of its exclusive expression in the developing nervous system (Carey et al., 1992; Carey, 1997). In the developing brain, expression of N-syndecan shows a clear-cut spatiotemporal relation to that of HB-GAM (Nolo et al., 1995; A. Kinnunen et al., 1998), an extracellular ligand for N-syndecan (K d = 0.6 nM) (Raulo et al., 1994). The ectodomain of N-syndecan binds to matrix-associated HB-GAM by its heparan sulfate chains (iduronic acid-2-0-sulfates are implicated in the binding), although the protein part also affects the binding (Kinnunen et al., 1996). Very recent biochemical and cell biological studies have shown that the conserved cytosolic domain of N-syndecan binds a protein complex containing src-family tyrosine kinases (pp60-src and fyn) and the src-substrate cortactin (T. Kinnunen et al., 1998). Binding of HB-GAM to N-syndecan leads to phosphorylation and activation of src followed by cortactin phosphorylation (T. Kinnunen et al., 1998). Phosphorylation of cortactin is known to modulate its F-actin cross-linking activity (Hung et al., 1997), which may lead to cytoskeletal reorganization pertinent to cell motility. Although it appears clear that N-syndecan functions as an HB-GAM receptor in neurite extension, the possible role of the HB-GAM/N-syndecan interaction outside of the nervous system has not been previously addressed.
In the present study, we demonstrate the presence of N-syndecan in osteoblasts/osteoblast precursors and the presence of HB-GAM in their target substrates during development and regeneration of rat bone. The spatiotemporal relationship of N-syndecan and HB-GAM suggests that interaction of this receptor-ligand pair may play a role in the osteoblast recruitment and attachment to their target substrates. We then use several osteoblast-type cells, in which the present study demonstrates endogenous N-syndecan as abundantly as in the developing rat brain. Osteoblast-type cells are shown to be recruited and attached to HB-GAM when presented as an insoluble substrate. Lastly, we produce transgenic mice that maintain an elevated level of HB-GAM, which is normally downregulated after skeletal development. The maintained high level of HB-GAM expression leads to an increased bone volume, presumably by maintaining an elevated osteoblast recruitment and attachment to their target substrate.
Materials and Methods
N-Syndecan and Recombinant HB-GAM
Recombinant HB-GAM was produced with the aid of baculovirus in Spodopteria frugiperda cells and purified to apparent homogeneity from the culture medium as described previously (Raulo et al., 1992). N-syndecan was isolated as previously described (Raulo et al., 1994). Alcian blue-silver staining that detects both proteins and proteoglycans was used in combination with SDS-PAGE to detect fractions that contain N-syndecan.
Antibodies to N-Syndecan and HB-GAM
Affinity-purified antibodies against recombinant HB-GAM were produced in rabbit as previously described (Raulo et al., 1992) and affinity-purified as previously described (Rauvala, 1989). These antibodies have been characterized by Western blotting (Raulo et al., 1992), and their specificity against HB-GAM has been verified in an immunohistochemical context (Peng et al., 1995). Affinity-purified antibodies against a synthetic peptide corresponding to the NH2-terminal extracellular moiety of rat N-syndecan (Carey et al., 1992) were produced and verified by Western blotting and immunohistochemistry (Raulo et al., 1994; Nolo et al., 1995).
Histological Procedures
All the animals used in the study were perfusion-fixed with 4% paraformaldehyde and 0.5% glutaraldehyde in 0.1 M phosphate buffer (PB), except for embryos that were immersion-fixed with the same fixative. Five to six serial cryostat sections (40 μm thick) were cut for each animal. Three to four sections were handled for light microscopy, while the remaining two to three sections were reserved for electron microscopy (EM) after immunostaining. Replacement of primary antibodies with nonspecific rabbit IgG served as a negative control. After avidin-biotin-peroxidase complex reaction (Vector Laboratories, Burlingame, CA), peroxidase label was developed in 0.04% 3,3-diamine-benzidine tetrahydrochloride (DAB) with nickel enhancement (0.3% nickel ammonium sulfate). Thus, positive staining produces blue color on light microscopy and aggregated intense electron-density on EM. Detailed procedures are described elsewhere (Imai et al., 1997).
Immunoelectron Microscopy
The immunostained sections reserved for EM were postfixed with 1% osmium tetroxide for 1 h and dehydrated in ethanol series. The sections were flat-embedded in Epon medium and coverslipped on glass slides coated with silicon. Light microscopic observation was made at this point to select areas to be examined electron-microscopically. Ultrathin sections (60 nm) were stained with uranyl acetate and lead citrate and were examined by a transmission electron microscope (Acceleration voltage: 60 KeV; model Joel 1200; Joel, Tokyo, Japan).
Probes and In Situ Hybridization
A 1.8-kb fragment of N-syndecan cDNA, corresponding to base pairs 67– 1867 and containing the full coding region of the mRNA (Carey et al., 1992), was used for preparation of N-syndecan probe. A 1.25-kb cDNA containing the whole coding sequence of HB-GAM (Merenmies and Rauvala, 1990) was used to prepare HB-GAM probe. Digoxigenin-labeled single-stranded sense and anti-sense RNA probes were generated as previously described (Szabat and Rauvala, 1996). 10 serial cryostat sections (7 μm thick), which topographically correspond to the immunostained sections, were cut and mounted on glasses. In situ hybridization was performed using a modified protocol of Wilkinson (1992) and is described elsewhere (Nolo et al., 1995).
Cell Culture and Cell Types
Rat osteoblast-type cells, UMR-106 (ATCC CRL-1661), and human osteoblast-type cells, Saos-2 (ATCC HTB-85), U-2 OS (ATCC HTB-96), and KHOS/NP (ATCC CRL-1544), were recently purchased from the American Type Culture Collection (ATCC; Rockville, MD). Cells were freshly prepared for the assays in media recommended by the ATCC (UMR-106: DME, Saos-2, and U-2 OS: McCoy's 5A medium, KHOS/NP: minimal essential Eagle's medium) supplemented with 10% FCS, 100 U/ml penicillin G, and 100 μg/ml streptomycin. For comparison, 3T3 fibroblast-type cells and N18 neuroblastoma cells were used as control cells. Cells were harvested by trypsin and EDTA treatment and were recovered in suspension with 10% FCS-containing media for 1.5 h before using in assay.
RNA Preparation and Northern Blot Analysis
To characterize the used osteoblast-type cells in terms of N-syndecan expression, Northern analysis for rat N-syndecan RNA was performed. Total RNA was prepared from UMR-106, N18, and 3T3 cells by lysis with guanidinium isothiocyanate, phenol extraction, and ethanol precipitation using RNeasy™ Total RNA Kits (QIAGEN GmbH, Hilden, Germany). RNA prepared from rat perinatal brain served as control (Nolo et al., 1995). The RNA was quantified spectrophotometrically, and 10 μg of total RNA was prepared for each lane. The RNA was electrophoresed in 1.2% agarose–7% formaldehyde gel and transferred to nylon filter. A 200-bp fragment of rat N-syndecan cDNA (Nolo et al., 1995) was labeled with 32P Ready-to-go DNA labeling kit (Amersham Pharmacia Biotek, Uppsala, Sweden). After hybridization and washing, the filter was subject to autoradiography.
Isolation of the HB-GAM–binding Fraction from UMR-106 Cells
To characterize the HB-GAM–binding components from UMR-106, the cells were extracted with 50 mM octyl glucoside in ice-cold PBS containing 1 mM PMSF. HB-GAM affinity column was prepared by coupling 5 mg of the recombinant HB-GAM to a 1-ml NHS-activated HI-TRAP column (Amersham Pharmacia Biotek). The extracts were centrifuged at 40,000 g for 0.5 h, and the supernatants were passed through the column that had been equilibrated with 50 mM octyl glucoside. The column was then eluted with a 0.15–2.0 M linear gradient of NaCl. One-column volume fractions were collected, run on 4–15% SDS-PAGE, and stained with alcian blue–silver nitrate. The apparent molecular mass of the proteoglycan core protein was estimated after nitrous acid depolymerization. HB-GAM–binding fractions from perinatal rat brain served as positive control and were prepared as previously described (Raulo et al., 1994).
Western Blot Analysis of the HB-GAM–binding Fraction from UMR-106
To identify that the HB-GAM–binding fraction from UMR-106 is N-syndecan, the samples were transferred on Immobilon P (Millipore, Molsheim, France) in 10 mM CAPS, pH 9.0, for 2 h at 70 V. Affinity-purified polyclonal antibodies against the NH2-terminal synthetic peptide of N-syndecan were applied, and alkaline phosphatase–conjugated secondary antibodies were used for the detection.
Transfilter Migration Assay
Haptotactic migratory response to HB-GAM was studied for all the used osteoblast-type cells (i.e., rat osteoblast-type cells, UMR-106; and human osteoblast-type cells, Saos-2, U-2 OS, and KHOS/NP). The assay was carried out in Transwell chambers (Corning Costar, Cambridge, MA). The chamber is divided by a polycarbonate microporous filter (15 μm thick, pore size 8 μm), and the purified recombinant HB-GAM was coated to the lower surface of the filter at doubling concentrations from 0.025 to 50.0 μg/ml overnight at 4°C. The filter was then thoroughly washed with water and dried in laminar flow hood. The chamber was filled with the FCS-free medium containing 1 mg/ml BSA 30 min before adding cells. Cells were placed in the upper chamber at ∼1.0 × 10⁵ cells/cm2 and cultured for 4 h. After fixing with methanol for 15 min, staining with 0.05% toluidine blue, and removal of the cells from the upper surface of the filter, cells that had migrated and attached to the lower surface were examined under a light microscope. Five fields per filter were counted for cell number (1 field = 1/160 of entire surface of filter). Filters coated with 20 μg/ml of nonspecific rat IgG or 10 mg/ml of BSA served as controls.
Inhibition of Osteoblast Recruitment by Adding Soluble HB-GAM and N-Syndecan
To test that the cell recruitment was induced by binding of cell surface N-syndecan and substrate-bound HB-GAM, the binding was competed by adding soluble forms of N-syndecan or HB-GAM to the medium. Doubling concentrations of soluble HB-GAM (from 5 to 20 μg/ml) or soluble N-syndecan (from 1 to 4 μg/ml) were added to the cell suspension 30 min before plating the cells. UMR-106 cells were plated on the filter, the lower side of which was coated with 10 μg/ml HB-GAM. The number of cells that migrated was counted as described above.
Inhibition of Osteoblast Recruitment by Adding Tyrosine Kinase Inhibitors
A possible involvement of tyrosine phosphorylation in HB-GAM– induced osteoblast recruitment was tested using inhibitors of protein tyrosine kinases. Benzoquinoid ansamycin (herbimycin A), a widely used general inhibitor of protein tyrosine kinases (Migita et al., 1994), and pyrazolopyrimidine 1 (PP1), a recently defined specific inhibitor of src-type tyrosine kinases (Hanke et al., 1996), were added to the cell suspension 10 min before plating cells to inhibit N-syndecan–mediated intracellular phosphorylation. Then, cells were subject to the transfilter assay using 10 μg/ml of substrate-bound HB-GAM.
Osteoblast Recruitment from Denatured HB-GAM to Intact HB-GAM
Since cells may attach nonspecifically to polycationic proteins, the following cell recruitment assay was designed to show that the three-dimensionally intact structure of HB-GAM is pertinent to the osteoblast recruitment. The purified recombinant HB-GAM was coated to chamber slides (Lab-tek: Nunc, Inc., Naperville, IL) at different concentrations at 0, 0.1, 0.5, 1, 5, 10, 25, and 50 μg/ml overnight at 4°C. The chambers were washed with water and dried in a laminar flow hood, and electron microscopy grids were placed over the coated HB-GAM. The chambers were then UV-irradiated (model UV Stratalinker TM 2400, Stratagene, La Jolla, CA; wave length 254 nm) for 1 h. After removal of the grids, the chamber was thoroughly washed with water and filled with the FCS-free media containing 1 mg/ml BSA 30 min before plating the cells. The UMR-106 cells were plated at 1.25 × 10⁵ cells/cm2 and cultured in the FCS-free medium. Chamber slides coated with 20 μg/ml of nonspecific rat IgG or 10 mg/ml of BSA served as control substrates. N18 and 3T3 cells, which are shown to be N-syndecan negative in the present study, served as negative control cells.
A Model of Postarthritic Periosteal Ossification
The study included 25 male Wistar-Lewis rats, aged 7 wk (body weight: 230–250 g). Postarthritic, periosteal ossification has been characterized in an adjuvant-induced arthritic model (Imai et al., 1997). In brief, 15 rats received intradermal injection of 0.05 ml suspension of Freund's complete adjuvant (cell wall fragments of heat-killed mycobacterium butylicum; 3 mg/g body weight; Difco Laboratories, Detroit, MI) in paraffin oil into the tail base. The remaining 10 animals, serving as controls, received the paraffin oil alone. Signs of inflammation in the hindpaw appeared by 7 d after inoculation. Apparent acute inflammation subsides, and the periosteum becomes proliferated during the second week. The proliferated periosteum mineralizes during the third week (Imai et al., 1997). The animals were killed 7, 10, 14, 21, and 28 d after inoculation of the adjuvant or vehicle (three animals/arthritic group and two animals/control group). Immunohistochemistry and immuno-EM for HB-GAM and N-syndecan were performed on the ankle samples.
Production of Transgenic Mice
HB-GAM cDNA (Merenmies and Rauvala, 1990) was cloned into a BamHI restriction site in pHBApr-1-neo vector (Gunning et al., 1987). pHBApr-1-neo contains the promoter and the first intron from human β-actin gene and SV-40–polyadenylation signal. The expression cassette was removed from the plasmid by digestion with EcoRI and NdeI, separated by agarose gel electrophoresis, and purified. Fertilized eggs from FVB/NIH and FlxNMRI mice were used for microinjection. Founder animals were screened by Southern blotting from tail biopsies. Founder animals were bred with FVB/NIH mice.
Western Blot Analysis of the Transgenic Mice
Tissue samples from transgenic and nontransgenic littermates were dissected, minced with scissors, and weighed. 1 ml sample buffer (60 mM Tris, pH 6.8, 8% glycerol, 1.8% SDS, 4.5% β-mercaptoethanol) was added per 100 mg tissue, and the tissue was solubilized by boiling for 10 min. Samples were centrifuged and 10 or 20 μl of the supernatant (corresponding to 1 or 2 mg of tissue weight) was loaded on SDS-PAGE. Proteins were transferred to nitrocellulose membrane. HB-GAM was detected by affinity-purified antibodies against the NH2-terminal synthetic peptide of HB-GAM (Rauvala, 1989).
Histopathologic and Histomorphometric Analysis of Transgenic Mice
Gross appearance of the skeletons was evaluated after maceration in potassium hydroxide and removal of the soft tissue. Immunohistochemical localization of HB-GAM was studied using longitudinal and cross-sectional sections of femora and humeri of 1-yr-old animals (two transgenic and two nontransgenic animals). Histomorphometric analyses, following the recommended procedures and nomenclature (Parfitt, 1987), were conducted on seven transgenic and nine nontransgenic animals using computer-assisted image analyzer (model Image-Pro Plus; Media Cybernetics, Los Angeles, CA).
Results
Expression of HB-GAM and N-Syndecan during Prenatal Development of Bone
HB-GAM was intensely expressed in the matrix of the developing cartilage (Fig. 1 a), which acts as a template for endochondral bone formation (Marks and Hermey, 1996). Little if any expression of N-syndecan was detected before beginning of ossification (Fig. 1 b). HB-GAM persisted in the matrix of the mineralized cartilage (Fig. 1 c), onto which osteoblasts deposit osteoid (Marks and Hermey, 1996; Scammell and Roach, 1996). N-syndecan–expressing cells were localized in the zone of the mineralized cartilage (Fig. 1 d). The localization of the two molecules thus overlapped in the zone of the mineralized cartilage (Fig. 1 c, arrowheads, and Fig. 1 d, arrows). The overlapping expression of the two molecules was maintained while the frontier of the ossification advanced toward the ends of the cartilage template, i.e., N-syndecan–expressing cells appeared to trace the mineralized cartilage, where HB-GAM is abundantly expressed. On the other hand, N-syndecan was not expressed in the anatomical regions where formation of bone tissue had been already completed. These light microscopic localizations of N-syndecan– expressing cells suggest that N-syndecan is expressed by the osteoblast lineage cells that are migrating toward the target matrix. As for the cellular source of HB-GAM, immunolocalization of HB-GAM and in situ hybridization of its mRNA (see below) suggest that chondrocytes supplies it to the cartilage matrix.
Figure 1.
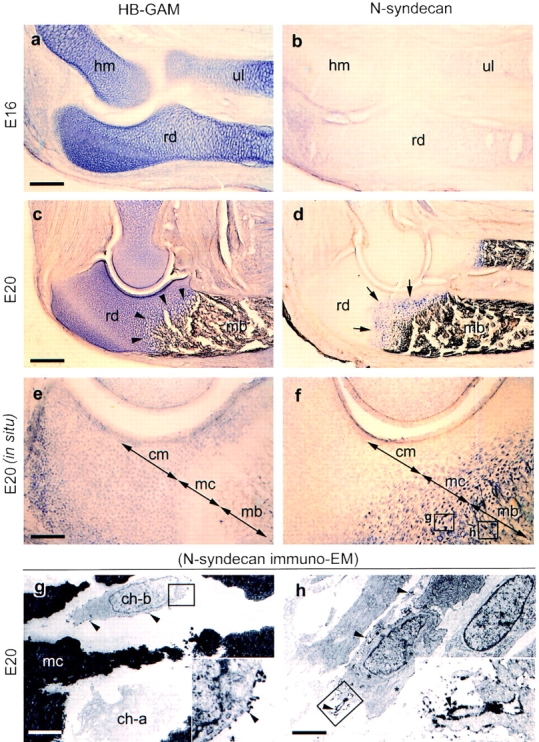
Expression of HB-GAM and N-syndecan in the developing rat bone (immunodetection for the protein, a–d; in situ hybridization for mRNA, e and f; immunoelectron microscopy for N-syndecan, g and h; E, embryonic day). (a) Abundant expression of HB-GAM in the cartilage templates. (b) No expression of N-syndecan in the cartilage templates at E16 (the same magnification as in a). (c) HB-GAM expression persisting in the mineralized cartilage, the structure of which is conceivable by the enlarged lacunae of the chondrocytes (arrowheads). (d) N-syndecan expression by the cells dispersed in the mineralized cartilage (arrows; the same magnification as in c). (e) Selective expression of HB-GAM mRNA by the chondrocytes in the cartilage matrix (cm). (f) Selective expression of N-syndecan mRNA by the cells in the mineralized cartilage (mc) and mineralized bone (the same magnification as in e; the rectangles g and h represent the regions of panels g and h). (g) N-syndecan is localized on the surface of the cell (arrowheads; ch-b), the phenotype of which is distinct from a hypertrophied chondrocyte (ch-a) (the rectangle indicates the inset). (h) N-syndecan is expressed by the cells in the mineralized bone (arrowheads; the rectangle indicates the inset). The ultrastructural phenotype of the cells suggest an active motility with well-developed cell processes. hm, humerus; rd, radius; ul, ulna; mb, mineralized bone. Bars: (a and e) 500 μm; (c) 1,250 μm; (g) 10 μm; (h) 8 μm.
Localization of the mRNAs, in turn, did not overlap. HB-GAM mRNA–positive cells were localized within the unmineralized cartilage matrix, whereas N-syndecan mRNA– positive cells were localized within the mineralized cartilage and mineralized bone (Fig. 1, e and f). N-syndecan immuno-EM of the mineralized cartilage (Fig. 1 f, rectangle g) showed numerous N-syndecan–expressing cells (Fig. 1 g, ch-b) that were distinct from the hypertrophied chondrocytes (Fig. 1 g, ch-a). Immuno-EM of the mineralized bone (Fig. 1 f, rectangle h) showed that N-syndecan was expressed by a group of cells, the ultrastructural phenotypes of which were not of blood vessels, osteoclasts, or macrophages but were suggestive of an active motility with the spindle-shaped cell somas and well-developed cell processes (Fig. 1 h). These cells were often seen in the channels between the trabeculae of the mineralized bone. Based on their ultrastructural features, N-syndecan may be expressed by the osteoblast lineage cells that are migrating before adhesion to their target matrix.
Expression of HB-GAM during Postnatal Development of Bone
The postnatal growth of bone involves numerous anatomical sites of new bone formation. The metaphyseal part of the cartilage template remains as the growth plate that is responsible for the postnatal elongation of long bone. HB-GAM was abundantly expressed in the growth plate (Fig. 2 a), which remains throughout life in rodents. The physeal part of the cartilage gives rise to two types of cartilage, i.e., the outer portion of the cartilage becomes articular cartilage, and the inner portion of the cartilage provides a substrate for osteoblast recruitment by forming a secondary ossification center. HB-GAM was intensely expressed in the cartilage matrix that forms the hollow for the secondary ossification center, with the chondrocytes being presumptive cellular source of HB-GAM. In contrast, HB-GAM was not expressed in the outer portion that becomes the articular cartilage in future (Fig. 2 a).
Figure 2.

Expression of HB-GAM during postnatal development of bone. (a) HB-GAM is intensely expressed in the secondary ossification center, in the growth plate, and in the periosteum (i.e., perichondrium at this stage). (HB-GAM immunostaining, 1-wk-old rat, humeral head.) (b) Bone of the early postnatal life consists of woven bone that is formed during prenatal life and the lamellar bone that has replaced the woven bone. The rectangle is magnified in d (HB-GAM immunostaining, 3-wk-old rat, calcaneal bone). (c) Heidenhain's AZAN staining (Gabe, 1976) of the cortical bone of the same specimen to distinguish the woven bone (wb) from the lamellar bone (lb). (d) The osteocytes of the lamellar bone selectively express HB-GAM, whereas those of the woven bone do not. (e) HB-GAM is localized in the matrix surrounding the osteocytes (double arrows), in the canaliculi of the osteocytes (arrow), and on the bone surface (arrowhead). Bars: (b) 500 μm; (e) 60 μm.
The woven bone that is formed to create the initial shape of bone during prenatal life is continuously resorbed by osteoclasts and macrophages and finally disappears during early postnatal life. In turn, the space created by resorbing the woven bone is replaced by lamellar bone, which continues to grow further until adulthood. HB-GAM was expressed selectively by the osteocytes of the lamellar bone, whereas it was hardly expressed by those of the woven bone (Fig. 2, b–d). HB-GAM was detected in the matrix surrounding the osteocytes (Fig. 2 e, double arrows) and in the canaliculi of the osteocytes (Fig. 2 e, arrow). Most interestingly, HB-GAM was distributed on the surface of lamellar bone, where the growth of bone takes place by adding new bone. Thus, the osteocytes of the lamellar bone may prepare the bone surface as an osteoconductive surface by distributing HB-GAM through the network of bone canaliculi. After skeletal development, however, expression of both HB-GAM and N-syndecan is downregulated (see below for details of the periosteal expression). Taken together, HB-GAM is expressed in the various anatomical sites where osteoblasts are recruited and attached for the postnatal bone formation.
Osteoblast Recruitment Mediated by the N-Syndecan/HB-GAM Interaction
To test the hypothetical osteoblast recruitment induced by HB-GAM, we first performed a haptotactic assay using several osteoblast-type cells. All of the studied osteoblast-type cells rapidly migrated to HB-GAM in a dose-dependent manner, whereas the control cells, N18 and 3T3 cells, did not respond to HB-GAM (Fig. 3 A). Thus, the migration-enhancing effect of HB-GAM appears to be a general finding in the case of osteoblast-type cells (osteogenic sarcoma-derived cell lines).
Figure 3.

(A) Transfilter haptotactic assay. (a) The lower surface of the Transwell® filter (polycarbonate plastic) was coated with HB-GAM, and the cells that migrated from the upper chamber to the lower chamber were studied under microscopy. (b) After the migration, the number of cells that migrated to the lower surface was calculated. (c) The osteoblast-type cells (rat osteoblast-type cells UMR-106, and human osteoblast-type cells, Saos-2, U-2 and KHOS/NP) migrated through the pores. Less than 1% of the plated osteoblast-type cells migrated to the control matrices (nonspecific rat IgG, 0.92%; bovine serum albumin, 0.89%). All the osteoblast-like cells migrated in a dose-dependent manner, but nonosteoblastic cells, 3T3 fibroblasts and N18 neuroblastoma cells, did not respond to HB-GAM. (B) Northern blot analysis of the rat osteoblastic cell line, UMR-106. N-syndecan mRNA is seen at a similar or even higher level as compared with that of the perinatal rat brain. No expression is seen in the control cells (N18 and 3T3 cells). (C) HB-GAM– binding fractions isolated from UMR-106 cells and rat perinatal brain, and Western blot analysis of the fractions. Lane 1, HB-GAM–binding fraction derived from the brain; lane 2, the brain-derived fraction treated with nitrous acid; lane 3, the major HB-GAM–binding fraction from UMR-106 eluted at 0.5 M NaCl in the salt gradient; lane 4, the UMR-106–derived fraction treated with nitrous acid. The HB-GAM–binding fractions isolated from UMR-106 cells have a molecular mass similar to those derived from the rat perinatal brain. Lanes 5 and 6, Western blot using affinity-purified antibodies that bind to NH2-terminal peptide of N-syndecan. The samples in lanes 3 and 4 are identified as N-syndecan. (D) Immunocytochemistry of N-syndecan in the UMR-106 cells. (a) N-syndecan of UMR-106 cells is immunostained (arrowheads). (b) Trypsin treatment clearly abolishes the immunostaining. (E) Inhibition of HB-GAM– induced recruitment of UMR-106 cells. (a) Recruitment of UMR-106 cells using 10 μg/ml HB-GAM is dose-dependently inhibited by adding soluble HB-GAM or N-syndecan to the cell suspension. (b) Addition of herbimycin A, a general inhibitor for tyrosine kinases, and PP1, a recently defined specific inhibitor for src-type tyrosine kinases, clearly interferes the cell recruitment induced by HB-GAM.
Since N-syndecan appears to be expressed by migratory cells of the osteoblast lineage in vivo (Fig. 1, g and h), we further investigated the possible functional role of N-syndecan using rat osteoblastic cells (UMR-106 cells) and the control cells (N18 and 3T3 cells). Northern analysis showed a high expression level of N-syndecan mRNA in UMR-106. The expression level was similar to or even higher than that of the perinatal brain (Fig. 3 B). Affinity chromatography showed that UMR-106 cells express a major HB-GAM–binding protein with a molecular mass similar to that found in the perinatal brain, and this protein was identified as N-syndecan by Western blotting (Fig. 3 C). All members of the syndecan family have a conserved protease-susceptible site at the extracellular juxtaposition to the transmembrane domain (Carey, 1997), and treatment of the UMR-106 with trypsin (0.01% wt/vol, for 5 min) clearly abolished N-syndecan immunostaining (Fig. 3 D). Taken together, the rat osteoblastic cells, UMR-106, express N-syndecan as their major HB-GAM–binding protein on the cell surface. In contrast, the control cells that did not respond to HB-GAM were found to be N-syndecan negative (Fig. 3 B). Thus, the responsiveness to HB-GAM in the transfilter assay appears to depend on the presence of N-syndecan.
The recruitment of UMR-106 cells was competed by adding a soluble form of HB-GAM or N-syndecan into the cell suspension (Fig. 3 E, a), suggesting that the cell recruitment was mediated by binding of the cell surface N-syndecan and the substrate-bound HB-GAM. The cell recruitment was also inhibited by adding the inhibitors of tyrosine kinases into the medium (Fig. 3 E, b), suggesting that the cytoskeletal reorganization pertinent to the HB-GAM–induced cell recruitment is mediated by tyrosine phosphorylation of intracellular components.
Osteoblast Recruitment to the Intact HB-GAM from the Denatured HB-GAM
Since cells may attach nonspecifically to polycationic proteins, another cell recruitment assay was designed. Irradiation with UV light has a protein-denaturing effect, but it is not expected to destroy the polycationic nature of the protein. UV-irradiation has been previously used to create patterned substrates from laminin (Hammerback et al., 1985) and from HB-GAM (Rauvala et al., 1994). UMR-106 cells were clearly recruited to the intact HB-GAM from the UV-irradiated HB-GAM at the concentration of 50 μg/ml (Fig. 4, b–d), suggesting that the intact molecular structure of HB-GAM is a prerequisite for the recruitment of the UMR-106 cells. Cell migration was inactive at lower concentration of HB-GAM, and the cells did not migrate at all when the substrate was not previously coated with HB-GAM (data not shown). The N-syndecan–negative control cells, N18 neuroblastoma cells and 3T3 fibroblasts, were not recruited to the intact HB-GAM (data not shown).
Figure 4.
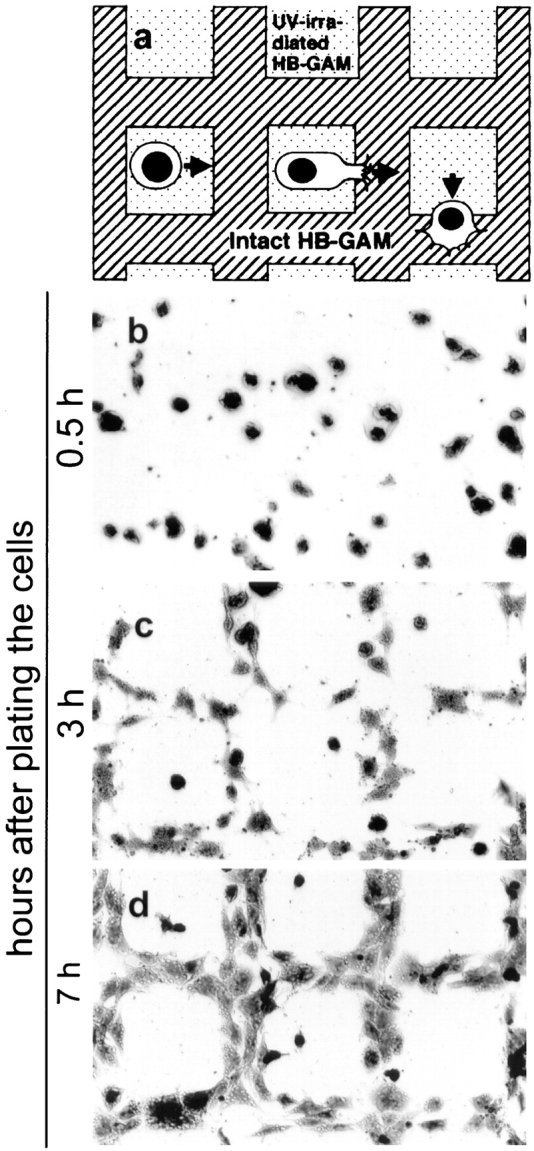
Recruitment of UMR-106 cells using the pattern of UV-irradiated and intact HB-GAM. (a) A schematic representation of the experiment. The substrate is first coated with HB-GAM, covered with a conventional EM grid, and irradiated with UV that denatures the uncovered HB-GAM. (b) Cells are evenly plated, and there is no apparent migration 30 min after plating the cells. (c) Cells migrating from the denatured HB-GAM to the intact HB-GAM at 3 h after plating. (d) The cells have migrated and spread on the intact HB-GAM at 7 h after plating.
Expression of HB-GAM and N-Syndecan during Postarthritic Periosteal Ossification
Normal adult rat bone hardly expresses HB-GAM (Fig. 5) or N-syndecan (Fig. 5 c, also see the rectangle in Fig. 5 a for orientation). To study possible participation of both molecules in regenerative ossification of adult bone, we used a postarthritic ossification model. Intracutaneous inoculation of Freund's adjuvant induces a systemic autoimmune-type arthritis ∼10 d after inoculation (day 10). After the arthritic damage, the periosteum goes through a direct intramembranous ossification (Fig. 5, j and m, rectangles) (Imai et al., 1997).
Figure 5.
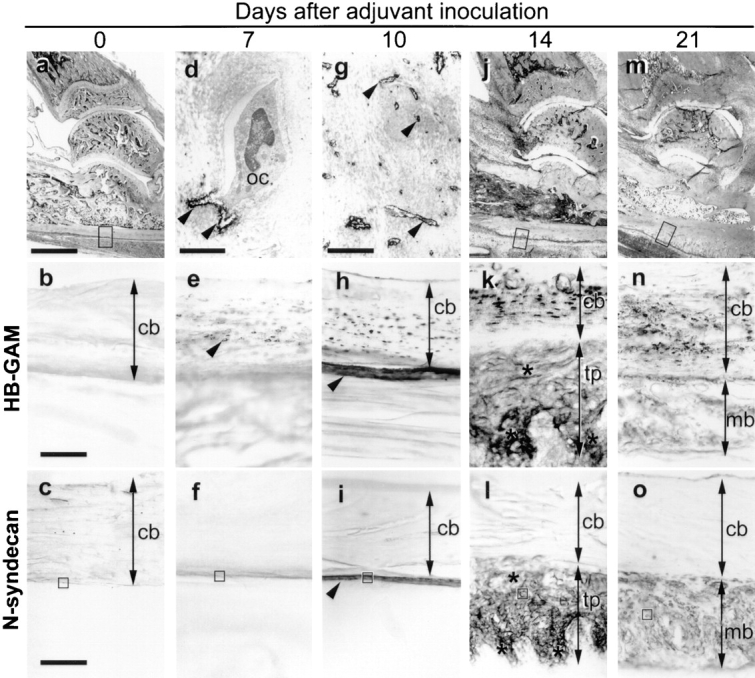
Accelerated periosteal ossification after arthritic damage. (a) Normal adult rat bone. The rectangle corresponds to b and c. (b) HB-GAM expression is hardly seen in the healthy adult bone. (The magnification for the rest of HB-GAM immunostaining is the same.) (c) No N-syndecan expression is observed in the healthy adult bone. (The magnification is the same for the rest of N-syndecan immunostaining.) (d) Electron-microscopical localization of HB-GAM in the osteocytic lacunae (arrowheads) at day 7. oc, osteocyte. (e) An increase in the number of HB-GAM–expressing osteocytes at day 7 (arrowhead). (f) No expression of N-syndecan at day 7. (g) Electron-microscopical localization of HB-GAM in the osteocytic canaliculi (arrowheads) adjacent to the damaged bone surface at day 10. (h) The surface of the damaged bone becomes immunoreactive to HB-GAM (arrowhead) at day 10. (i) N-syndecan is noted for the first time at day 10 (arrowhead). (j) The periosteum is thickened at day 14. The rectangle corresponds to k and l. (k) The thickened periosteum is abundant in HB-GAM (asterisks) at day 14. (l) N-syndecan expression similar to the expression of HB-GAM (asterisks) at day 14. (m) The thickened periosteum is mineralized at day 21. The rectangle corresponds to n and o. (n) HB-GAM expression disappears from the mineralized bone at day 21. (o) N-syndecan is downregulated at day 21. The rectangles in c, f, i, l, and o correspond to Fig. 5, a–e, respectively. cb, width of cortical bone; tp, width of thickened periosteum; mb, width of mineralized bone. Bars: (a, j, and m) 1,000 μm; (b and c) 100 μm; (d) 2.8 μm; (g) 4 μm.
HB-GAM and N-syndecan were upregulated in a site- and time-specific manner during the process. Ultrastructurally, HB-GAM was first seen around the osteocytes on day 7, and the osteocytes appeared to distribute HB-GAM into the osteocytic lacunae (Fig. 5 d). Light microscopically, numerous HB-GAM–expressing osteocytes were noted within the damaged bone (Fig. 5 e). At this stage, however, N-syndecan expression was not detected (Fig. 5 f).
On day 10, an increased number of HB-GAM–expressing osteocytes was noted in the damaged bone (Fig. 5 h). In addition to osteocytic lacunae, HB-GAM was noted on the numerous osteocytic processes adjacent to the damaged bone surface (Fig. 5 g). The surface of the damaged bone became immunoreactive to HB-GAM in a similar manner to that found during the postnatal growth of bone (Fig. 5 h, compare to Fig. 2 e). Osteocytes are extensively connected with bone surface via their cell processes that form a network within the bone (Nijweide et al., 1996); thus the osteocytes may have distributed HB-GAM to the bone surface. Because of accumulation of induced osteoblasts, the periosteum thickens during the arthritic damage (Fig. 5 j) and ossifies thereafter (Fig. 5 m) (Imai et al., 1997). The thickened periosteum became immunoreactive to N-syndecan for the first time on day 10 (Fig. 5 i).
On day 14, HB-GAM was richly expressed in the thickened periosteum (Fig. 5 k), and the expression pattern of N-syndecan was similar to that of HB-GAM (Fig. 5 l). HB-GAM and N-syndecan were downregulated at the stage of mineralization on day 21 (Fig. 5, n and o) and completely disappeared on day 28 (data not shown). During the adult periosteal ossification, HB-GAM was thus initially upregulated by the osteocytes within the damaged bone and was distributed to the bone surface to which newly induced osteoblasts are recruited. In turn, N-syndecan was expressed in the thickened periosteum, presumably by the osteoblast/osteoblast precursors that are recruited to participate in the thickening of the periosteum.
Electron-microscopic Characterization of N-Syndecan–expressing Cells
To identify the cell types that express N-syndecan during the adult periosteal ossification, a detailed electron-microscopical study was performed. Fully differentiated osteoblasts covering the surface of healthy adult bone (Fig. 5 c, rectangle) did not express N-syndecan (Fig. 6 a). Interestingly, the osteoblasts were not found on the surface of the damaged bone 7 d after adjuvant inoculation (day 7; Fig. 5 f, rectangle). Instead, numerous spindle-shaped cells and their cell processes, which may represent fibroblastic osteoprogenitor, were noted along the bone surface. However, these cells were not immunoreactive to N-syndecan (Fig. 6 b).
Figure 6.
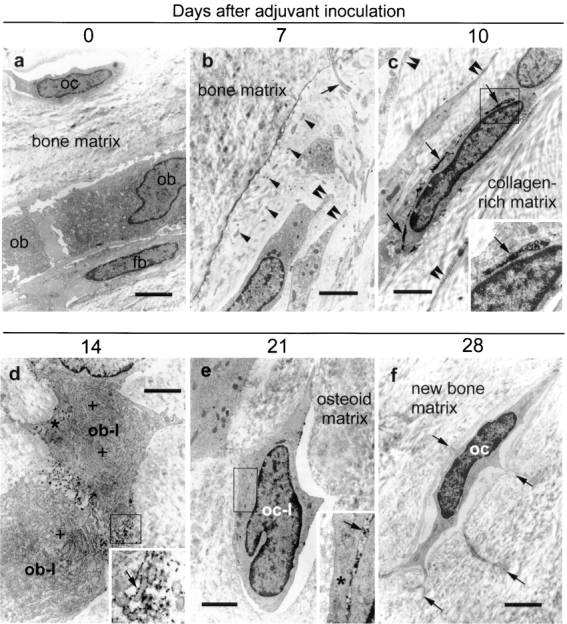
Electron-microscopic characterization of N-syndecan–expressing cells. (a) N-syndecan is not expressed by any cell types of the healthy adult bone (oc, osteocyte; ob, osteoblasts; fb, fibroblast-like cell). (b) N-syndecan is not expressed by the cellular components along the bone surface of 7 d after adjuvant inoculation (day 7). The bone surface is characterized by numerous spindle-shaped small cells (diameter = 2–3 μm; double arrowheads), cell processes of these cells (arrowheads), and long cell processes extending from the osteocytes (arrow). (c) N-syndecan is detected for the first time at day 10 (arrows). N-syndecan is expressed on the spindle-shaped small cells (arrow, diameter of the cells = 2–3 μm) and on their long slender cell processes (double arrowheads). (d) N-syndecan is expressed (arrow) by the osteoblast-like cells (ob-l) characterized by cuboid-shaped large cell soma (diameter = 8–12 μm), rich rough ER (+), and Golgi apparatus (asterisk) at day 14. (e) N-syndecan expression remaining on the cell surface of osteocyte-like cells (oc-l) characterized by lens-shaped small cell soma at day 21 (diameter of the cells = 3–4 μm). These cells have not yet developed gap junctions with the neighboring cells (asterisk), a typical feature of fully differentiated osteocytes. (f) N-syndecan is not expressed by the fully differentiated osteocytes characterized by satellite-shaped cell soma with the cell processes radiating into the mineralized bone matrix at day 28 (arrows). The rectangles in c–e indicate the insets. Bars: (a) 4 μm; (b) 2.3 μm; (c) 2 μm; (d) 1.9 μm; (e) 2.6 μm; (f) 3.2 μm.
On day 10, numerous spindle-shaped cells with long slender cell processes were noted in the vicinity of the damaged bone (Fig. 5 i, rectangle). These spindle-shaped cells expressed N-syndecan on their cell surface (Fig. 6 c). Since osteoblast later expresses N-syndecan (see below), these N-syndecan–expressing spindle-shaped cells may represent preosteoblast, a presumptive motile precursor of osteoblast. On day 14, the thickened periosteum (Fig. 5 l, rectangle) contained numerous osteoblasts with rich rough ER and Golgi apparatus. Osteoblasts expressed N-syndecan on their cell surface (Fig. 6 d).
At mineralization stage on day 21, the thickened periosteum contained numerous osteocyte-like cells being surrounded by the osteoid matrix that they produced themselves (Fig. 5 o, rectangle). These osteocyte-like cells had not yet developed typical gap junctions with neighboring cells. Some of the osteocyte-like cells retained immunoreactivity to N-syndecan (Fig. 6 e). On day 28, the ossified matrix contains only osteocytes (i.e., the terminal differentiation stage of the osteoblast lineage), and these cells did not express N-syndecan (Fig. 6 f). These results suggest that osteoblast lineage cells express N-syndecan when the cells are motile.
HB-GAM Expression in the Transgenic Mice
12 transgenic founders were produced using the HB-GAM cDNA under a β-actin promoter (Fig. 7 A). Southern blotting and PCR were used to verify integration of the construct to genomic DNA of the founders and the first generation offspring. PCR analysis indicated that the transgene was steadily transmitted to the next generations in a Mendelian fashion (data not shown).
Figure 7.

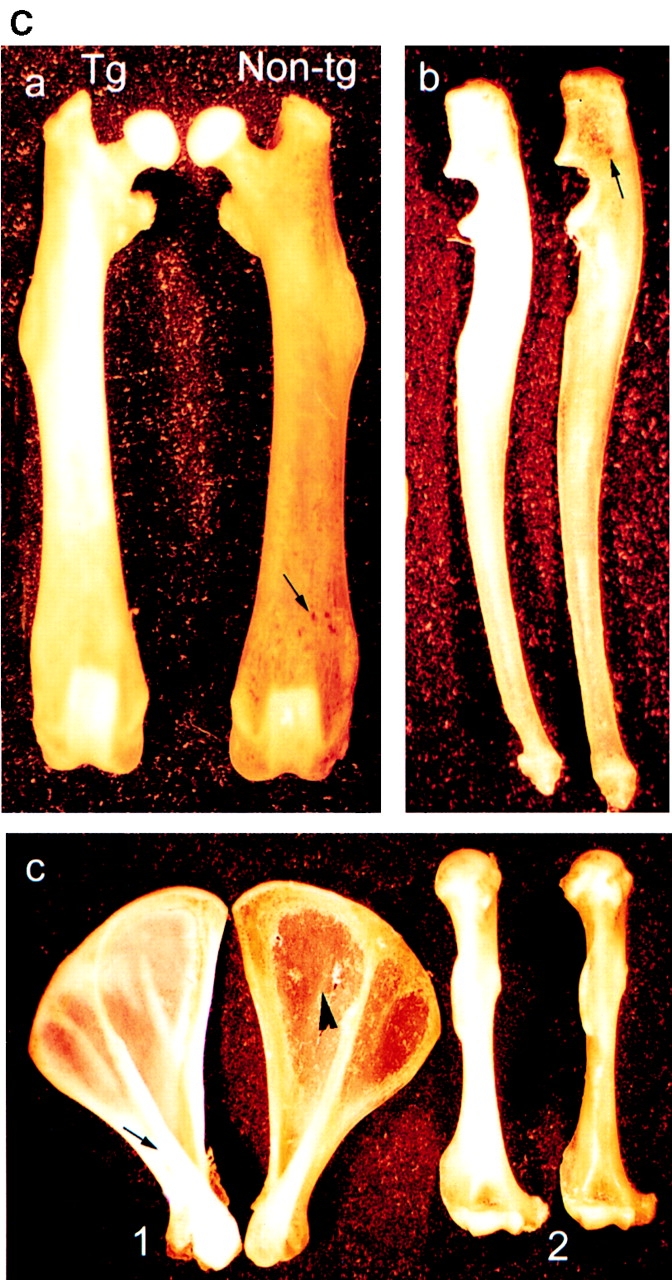
(A) Schematic diagram of the gene construct used to produce transgenic mice. HB-GAM cDNA was cloned in the pHBApr-1-neo vector, which contains the promoter and the first intron from human β-actin gene and SV-40 polyadenylation signal. (B) Expression of HB-GAM in transgenic mice. (a) Western blot analysis of different neonatal tissues (postnatal day 1) from a transgene-positive mouse (lanes noted by +) and its transgene-negative littermate (noted by −). Lane b, brain; lane h, heart; lane m, femoral muscle; lane l, liver; lane k, kidney. Note the intense transgene expression in heart and muscle. (b) Transgene expression in the periosteum in comparison to the heart of 1-yr-old mice. Western blot analysis of tissues from two different transgenic lines (noted by +) and their nontransgenic littermates (noted by −). HB-GAM expression in the transgenic periosteum (p) is even higher than that in the heart (h). Lane c, control recombinant HB-GAM protein (100 ng). (C) Gross appearance of bones form a 1-yr-old transgene-positive mouse (left in all panels) and those from its transgene-negative littermate (right). (a) Femora of transgene-positive (Tg) and transgene-negative (Non-tg) mice. Note the ivory-like solid appearance of the transgene-positive femur, whereas the transgene-negative femur displays a brownish surface because of the bone marrow structures that are seen through the thin cortical bone (arrow). (b) Ulnae. Brownish marrow structure is also seen in the transgene-negative ulna (arrow). (c) Scapulae (1) and humeri (2). The ivory-like appearance is particularly prominent in the scapular spinus of the transgene-positive mouse (arrow). Note the transparency of scapular plane in the transgene-negative bone (arrowhead).
A preliminary study on the HB-GAM transgene expression in different tissues (brain, heart, femoral muscle, liver, and kidney) was carried out by Western blotting. Pups of three lines were found to express the transgene in heart and skeletal muscle, whereas little if any overexpression was detected in liver, kidney, or brain (Fig. 7 B, a). These three mice lines displaying a mesenchymal expression of the transgene were selected and propagated for further analysis. The littermates genotyped as transgene negative did not express HB-GAM in any of the mesenchymal tissues analyzed shortly after birth (Fig. 7 B, a).
The highest protein concentration due to the HB-GAM transgene was seen in the periosteum of adult mice with a somewhat lower expression in the heart (Fig. 7 B, b). No expression could be detected in the periosteum of the transgene-negative individuals from the same litter. Estimated from the band intensities of Western blotting (Fig. 7 B, b), ∼50 μg/g (wet tissue weight) of HB-GAM was found in the periosteum of the transgene-positive adults. This amount is comparable to the highest expression levels found in developing brain (Rauvala, 1989).
Bone Phenotype of the HB-GAM Transgenic Mice
The transgenic mice were normal at birth. However, a distinct macroscopic abnormality of bone became evident in the transgenic mice by 12 mo of age. Bones from the transgene-positive mice displayed an ivory-like solid surface (Fig. 7 C). In contrast, the bones from the transgene-negative mice displayed a brownish granular appearance with some marrow structures seen through the cortical bone (Fig. 7 C). The shape of the bones was almost normal by macroscopic observation, but a detailed measurement of the bone sizes suggested an enlarged diameter at the metaphysis (Table I). Similar changes were observed among all individuals from the three different transgene-positive lines (n = 3). Other tissues did not exhibit any macroscopic changes. Adult individuals propagated from the transgene-positive lines and their nontransgenic littermates were used for further analyses of the bone phenotype.
Table I.
Sizes of the Femur and Humerus from Transgenic and Nontransgenic Mice
| Parameter | Nontransgenic‡ | Transgenic‡ | P value* | |||
|---|---|---|---|---|---|---|
| Femur | ||||||
| Longitudinal length | 13,335 ± 486 | 13,751 ± 548 | 0.0755 | |||
| Diaphysis | ||||||
| Diameter | 1,032 ± 240 | 1,099 ± 199 | 0.2829 | |||
| Thickness | 190 ± 32 | 236 ± 49 | 0.0186 | |||
| Metaphysis | ||||||
| Diameter | 1,029 ± 298 | 1,131 ± 238 | 0.2373 | |||
| Thickness | 143 ± 40 | 194 ± 54 | 0.0237 | |||
| Humerus | ||||||
| Longitudinal length | 11,000 ± 206 | 11,431 ± 415 | 0.0010 | |||
| Diaphysis | ||||||
| Diameter | 1,279 ± 152 | 1,158 ± 170 | 0.0801 | |||
| Thickness | 196 ± 27 | 289 ± 40 | 0.0005 | |||
| Metaphysis | ||||||
| Diameter | 1,182 ± 325 | 1,247 ± 259 | 0.0337 | |||
| Thickness | 164 ± 64 | 197 ± 76 | 0.1834 |
Thickness describes thickness of the cortical bone. Parameters for diaphysis are measured at the midpoint of longitudinal length, and those for metaphysis are measured at one quarter of the longitudinal length apart from either humeral or femoral head. Sizes are in micrometers (mean ± SEM).
Student's t test.
Number of animals for nontransgenic and their transgenic littermates were 7 and 9, respectively.
In the transgene-positive mice, HB-GAM was abundantly expressed by the osteocytes dispersed in the cortical bone (Fig. 8 A, c). HB-GAM was localized along the surface of the cortical bone (Fig. 8 A, a) in a similar manner to that found during the adult periosteal ossification (see Fig. 5 h). It thus appears that HB-GAM is localized because of binding sites on the bone surface, which may stabilize the secreted protein and present it in a surface-bound form to the motile osteoblasts/osteoblast precursors. In contrast, the transgene-negative mice were devoid of HB-GAM expression (Fig. 8 A, d) with the exception of the epiphyseal growth plate (Fig. 8 A, b).
Figure 8.


(A) Bone phenotype of the HB-GAM transgenic mice. Femora from 1-yr-old transgenic (a and c) and nontransgenic (b and d) littermates. (a) HB-GAM is abundantly expressed by osteocytes of the transgene-positive femur, and it is widely distributed along the bone surface (arrows). (b) HB-GAM expression in the transgene-negative femur is confined to the epiphyseal growth plate (arrowheads), which persists throughout life in rodents. Note that the transgene-positive mouse (a) has developed a much wider growth plate (arrowheads). (c) HB-GAM is expressed in the transgene-positive femur by the osteocytes of cortical bone (arrowheads) and localized to the bone surface (arrows) in a similar manner to that found during regeneration (see Fig. 4 h). (d) HB-GAM is not expressed either by the osteocytes or on the bone surface (arrow) in the transgene-negative femur. The cortical bone of the transgene-positive femur (cb′ in c) is much thicker than that of the transgene-negative femur (cb in d). (B) Histomorphometric analysis of femora of transgene-negative (Non tg) and transgene-positive mice (Tg). The parameters followed the recommended nomenclature (Parfitt et al., 1987). (a) Cortical bone volume (BT/TV,%): expressed as the percentage of the cortical tissue area divided by the cross-sectional area. (b) Cancellous bone volume (BT/TV,%): expressed as the percentage of metaphyseal area occupied by cancellous bone excluding the cortices. (c) Bone marrow space (mm2): area of metaphyseal marrow cavity excluding cancellous bone. Bars represent means ± SEM. Statistical differences between the groups were assessed by Student's t test (*P < 0.05, **P < 0.01, n = 6 and 8 for nontransgenic and transgenic mice, respectively).
Measurement of bone sizes revealed that the major significant difference was the increased thickness of the cortical bone (Table I). This was in agreement with the macroscopic appearance of the transgenic mice bone (Fig. 7 C). Thickness of the cortical bone was increased up to 147.4% for the humerus and 124.2% for the femur by 1 yr of age. Histomorphometric analysis showed that the cortical bone volume (Fig. 8 B, a) and the cancellous bone volume (Fig. 8 B, b) were significantly increased in the transgene-positive mice. Bone marrow area, another parameter that is a good indicator of osteoclast function (Fig. 8 B, c) (Parfitt, 1987), was not altered. Osteoblast surface (ObS/BS,%) of the transgenic mice, an indicator of the number of osteoblasts covering the bone surface (Parfitt, 1987), was 17.2 ± 4.4 as compared with 13.4 ± 5.9 in the nontransgeic mice.
Discussion
Expression of HB-GAM and N-Syndecan in Developing and Regenerating Bone
Endochondral bone formation is a complex series of sequential biological events involving template formation by the cartilage, mineralization of the cartilage, resorption of the mineralized cartilage, and finally replacement by bone (Marks and Hermey, 1996). Strictly speaking, the mineralized cartilage is partially resorbed by osteoclasts and macrophages, which create channels for recruitment of osteoblast precursors but leave some struts of the cartilage intact. These cartilage struts act as an osteoconductive substrate, permitting the osteoblast precursors to attach and initiate deposition of osteoid (Marks and Hermey, 1996; Scammell and Roach, 1996).
Our study on the developing rat bone demonstrates that HB-GAM is strongly expressed in the cartilage template (Fig. 1 a). HB-GAM persists in the mineralized cartilage (Fig. 1 c, arrowheads), onto which the osteoblast precursors are recruited (Marks and Hermey, 1996; Scammell and Roach, 1996). This finding is in agreement with the very recent report addressing the expression of HB-GAM during chicken embryogenesis (Dreyfus et al., 1998). In turn, N-syndecan is expressed by a group of cells dispersed between the struts of the mineralized cartilage (Fig. 1, d, f, and g). Ultrastructural phenotypes of the N-syndecan– expressing cells are suggestive of an active cell motility (Fig. 1 h). These observations lead us to hypotheses that (a) N-syndecan may be expressed by the motile precursors of osteoblasts; (b) HB-GAM may be expressed in the matrices of their destination; and (c) HB-GAM/N-syndecan interaction may participate in osteoblast recruitment and attachment to their target substrates in addition to the chemotactic signals provided by the diffusible factors (Bonewald, 1996).
Localization of HB-GAM can also be seen in the cartilage matrices of the epiphyseal growth plate (Fig. 8 A, a and b, arrowheads) and the secondary ossification center (Fig. 2 a), on the bone surface of the growing lamellar bone (Fig. 2 e), and in the head epithelia of the developing skull (Mitsiadis et al., 1995). All of these anatomical regions are known to be the sites where osteoblast precursors are recruited for deposition of osteoid. Osteoblasts/ osteoblast precursors are thought to be brought into the vicinity of the target matrices, presumably via the chemotactic effects of the diffusible factors (Bonewald, 1996). However, little is understood about how these cells are thereafter informed where to deposit the osteoid. Accurate guidance of axonal outgrowth, which is a particular form of cell motility, has been shown for several matrix-associated guiding molecules (Baier and Bonhoeffer, 1992). It is thus possible that the osteoblast precursors, after being brought into the vicinity of their target matrices, use a contact-dependent signal to find their destination should they express a functional receptor for the signal. N-syndecan expressed by the osteoblasts/osteoblast precursors may act as a receptor for HB-GAM to guide the migration of these cells to their target substrate.
Osteoblast Recruitment Induced by HB-GAM
To test the hypothetical osteoblast recruitment mediated by HB-GAM, we used several osteoblast-type cells (i.e., osteogenic sarcoma cell lines), including rat osteoblast-type cells, UMR-106, and human osteoblast-type cells, Saos-2, U-2 OS, and KHOS/NP. These cells are shown to migrate rapidly to HB-GAM in a dose-dependent manner, whereas nonosteoblastic cells, N18 and 3T3 cells, do not respond to HB-GAM (Fig. 3 A).
To further investigate how the osteoblast-type cells respond to HB-GAM, whereas the nonosteoblast-type cells do not, we studied UMR-106 cells in more detail. Based upon the profiles of osteoblastic characteristics and morphological features that are similar to osteoblast lineage cells in vivo, UMR-106 cells have been considered as preosteoblasts, the immediate precursor of the fully differentiated osteoblast (Rodan and Noda, 1991). UMR-106 cells are known to express N-syndecan as abundantly as, or even more abundantly than, the developing brain (Fig. 3. B and D), which has been the only known source of N-syndecan (Carey et al., 1992). N-syndecan is also isolated from crude extracts of UMR-106 cells by HB-GAM affinity column (Fig. 3 B).
The control cells (N18 and 3T3 cells), which did not respond to HB-GAM, were shown to be N-syndecan negative (Fig. 3 A, c). The migration of the osteoblast-type cells in the transfilter assays cannot be explained by random migration of the cells because more than 90% of the plated cells migrate to the lower surface when HB-GAM is coated at 50 μg/ml. In addition, the recruitment of the cells does not depend on the nonspecific adhesiveness provided by the polycationic property of HB-GAM, but depends on the intact molecular structure of HB-GAM (Fig. 4). Furthermore, the recruitment of UMR-106 cells is likely to depend on the interaction of the cell surface N-syndecan and substrate-bound HB-GAM since the migration can be competed by addition of either soluble N-syndecan or soluble HB-GAM (Fig. 3 E, a). Further studies are required to show whether the receptor-type protein-tyrosine phosphatase-θ/β plays a role in HB-GAM– induced osteoblast migration in addition to N-syndecan, as it is suggested for the HB-GAM–induced migratory response in neurons (Maeda et al., 1996).
Cell surface proteoglycans have been regarded as mere storage sites for growth factors or as coreceptors in growth factor signaling but have not been generally considered functional receptors that can directly activate cytosolic signaling pathways. The cytosolic domain of N-syndecan binds a protein complex containing src-family tyrosine kinases (pp60-src and fyn) and the src-substrate cortactin (T. Kinnunen et al., 1998). Binding of HB-GAM to N-syndecan leads to phosphorylation and activation of src followed by cortactin phosphorylation (T. Kinnunen et al., 1998). Phosphorylation of cortactin is known to modulate its F-actin cross-linking activity (Hung et al., 1997) and probably contributes to the cell motility (T. Kinnunen et al., 1998). Since the specific inhibitor of src-family kinases, PP1 (Hanke et al., 1996), clearly impairs the recruitment of UMR-106 cells (Fig. 3 E, b), the cytoskeletal reorganization via src-dependent phosphorylation is likely to play a role in the HB-GAM–induced osteoblast recruitment. Furthermore, methods that have been applied to study N-syndecan–mediated signaling in neurons (T. Kinnunen et al., 1998) have been very recently used to study the intracellular interactions of N-syndecan in the UMR-106 cells. These studies have shown that the cytosolic moiety of N-syndecan interacts with a tyrosine kinase–active protein complex containing cortactin in the UMR-106 cells (Kinnunen, T., S. Imai, and H. Rauvala, unpublished results). These results agree with the inhibition of osteoblast migration by PP1. Thus, also from the viewpoint of the intracellular signaling mechanism, it has been suggested that the HB-GAM–induced osteoblast migration is similar to the HB-GAM–induced migratory response in neurons.
The experimental design using the Transwell® chamber may require an explanation for the corresponding in vivo condition. The osteoblast-type cells must have extended their cell processes to interact with the HB-GAM molecule immobilized on the lower surface (Fig. 3 A, a). In fact, N-syndecan–expressing cells in vivo are characterized by the long slender cell processes that may explore their surrounding substrates (Fig. 6 c). The lengths of the processes well exceed 15 μm, which is the depth of the pore in the filter (Fig. 3 D, a). After the induced osteoblast precursors are brought into the vicinity of the target matrices, these cells may respond to HB-GAM with their long cell processes that express N-syndecan.
While much is known about the kinetics of bone turnover, little is understood about the coordinated regulation of bone deposition and resorption at molecular level (Canalis et al., 1991). The “nerve cell” role of osteocytes has been long debated for its anatomical and cell biological characteristics (Nijweide et al., 1996). Osteocytes are dispersed throughout the mineralized bone and are connected with their neighboring osteocytes via long cell processes that form a nerve-like network within the bone. Their processes connect with each other via gap junctions (Doty, 1981), thereby allowing cell-to-cell coupling (Jeansonne et al., 1979). The matrix around their processes is permeable to macromolecules (Dillaman et al., 1991), thereby allowing rapid passage of the yet unidentified signal molecules through the canaliculi (Nijweide et al., 1996). Elevation of metabolic (Pead et al., 1988; Skerry et al., 1989) and endocrine activities (Lean et al., 1995) after mechanical or electrical stimulation has predicted a role of osteocytes as a local regulator of bone formation. It is particularly interesting that the osteocytes upregulate HB-GAM production during an accelerated periosteal ossification (Fig. 5 e) and localize it on the bone surface during recruitment of the osteoblasts (Fig. 5, h and k). By localizing HB-GAM via bone canaliculi, the osteocytes may prepare the bone surface as a substrate for the appositional ossification. The prepared bone surface may act as an osteoconductive substrate in a similar sense to that of the mineralized cartilage (see Fig. 1 c).
Detailed ultrastructural characterization suggests that N-syndecan is expressed by several groups of bone forming cells, i.e., by osteoblast-like cells (Fig. 6 d) and later by osteocyte-like cells (Fig. 6 e). This is in a clear contrast to the finding that the differentiated osteoblasts covering the healthy bone surface do not express N-syndecan (Fig. 6 a). It must be remembered that these osteoid-producing osteoblasts are not motile. In turn, expression of N-syndecan seems to depend on the motility of the osteoblast lineage cells. Its expression is the most intense in the spindle-shaped cells with the long slender cell processes (Fig. 6 c), weaker in the osteoblast-like cells (Fig. 6 d), and faint in the osteocyte-like cells (Fig. 6 e). N-syndecan completely disappears from the mature osteocytes, the immobile terminal differentiation stage of the osteoblast lineage (Fig. 6 f).
Enhanced Bone Formation in Transgenic Mice
The hypothesis that HB-GAM regulates bone formation is tested by producing the transgenic mice that maintain an elevated level of HB-GAM on their bone surface. First of all, it should be noted that these mice display no developmental anomaly at birth. This is probably due to the high expression level of endogenous HB-GAM during embryonic development. The high expression level is likely to override the effect of the transgene. The high expression level is maintained also during the postnatal growth of bone, where HB-GAM is localized on bone surface with the osteocytes being its cellular source (Fig. 2 e). After skeletal maturity, however, the expression of HB-GAM is normally downregulated (Fig. 8 A, b and d; also see Fig. 5 b).
The transgenic mice, in turn, maintain an elevated level of HB-GAM even at the age of 12 mo (Fig. 7 B, b), and the localization of HB-GAM on the bone surface is similar to that of the postnatal bone growth (Fig. 8 A, a and c, see also Fig. 2, d and e) and that of the postarthritic periosteal ossification (Fig. 5 h). The transgenic mice develop a distinct bone phenotype characterized by an increased volume of the cortical and cancellous bone. This finding is compatible with the finding that local HB-GAM antagonizes bone mineral loss induced by estrogen deprivation (Matsuda et al., 1997).
The mechanism of the increased bone formation is not likely to be due to the decreased osteoclastic function since the bone marrow space, a good indicator of osteoclastic function (Parfitt, 1987), is not altered. Addition of HB-GAM to osteoblast-type cells has been shown to result in a 1.6–2.0-fold increase in the alkaline phosphatase activity and a 1.2–1.8-fold increase in the DNA content (Zhou et al., 1992). Since magnitudes of these effects are rather modest as compared with those of other growth and differentiation factors, the osteoblast-stimulating action of HB-GAM has received little attention. However, the present study demonstrates a prominent osteoblast-recruiting action of HB-GAM, and the N-syndecan expression by the osteoblasts/osteoblast precursors also supports this. HB-GAM transgene may thus lead to the increased bone volume by not only recruiting the osteoblasts to the bone surface but also by maintaining the osteoblastic activity of the recruited osteoblasts.
A Model of HB-GAM Function in Bone Development and Repair
The hypothetical osteoblast recruitment mediated by HB-GAM explains well the yet unclear mechanism of osteoblast recruitment and attachment to the different target substrates. It is particularly noteworthy that different cell types act as the source of HB-GAM, e.g., chondrocytes during prenatal endochondral ossification, osteocytes of the lamellar bone during postnatal bone growth, and osteocytes of the injured bone during postarthritic ossification.
Induction of osteoblasts has been attributed to a variety of growth and differentiation factors (Rosen and Thies, 1992; Kingsley, 1994; Bonewald, 1996), but the induced osteoblasts must be precisely located to form an appropriate shape and mass of future bone. In addition, bone is a self-organizational organ that alters its shape and mass according to the physical and chemical environments around bone itself.
HB-GAM is upregulated on the surface of damaged bone, where recruited osteoblasts deposit new osteoid for repair process (Fig. 5). The growth and differentiation factors responsible for the osteoblast induction are probably induced in the environment of the damaged bone. These factors may also act on the damaged bone so that the damaged bone surface may be marked with HB-GAM (Fig. 9). Although HB-GAM gene expression has been shown to be induced by platelet-derived growth factor in vitro (Li et al., 1992), other factors involved in bone repair may also act for the HB-GAM induction in situ. This model suits well the yet unclear mechanism of the self-organizational control of bone formation. The osteoblasts further differentiate to osteocytes being surrounded by the osteoid matrix that they produce, and they then may become a new source of HB-GAM for the next round of osteoblast recruitment (Fig. 9). A future application of HB-GAM may contribute to the clinically desired bone formation, which has not been fully attained by application of other growth and differentiation factors.
Figure 9.

A model for the HB-GAM/N-syndecan interaction in regulation of osteoblast recruitment and attachment to the sites for new bone deposition.
Acknowledgments
This work was supported by grants from the Technology Development Centre, Finland, the Sigrid Jusélius Foundation, the Academy of Finland, Nakatomi Foundation, Uehara Memorial Foundation, and Research fellowships of the Japan Society for the Promotion of Science. Shinji Imai is a JSPS Research Fellow.
Abbreviations used in this paper
- HB-GAM
heparin-binding growth-associated molecule
- PP1
pyrazolopyrimidine 1
Footnotes
The excellent technical assistance of Seija Lehto, Eeva-Liisa Saarikalle, and Erja Huttu is gratefully acknowledged.
Address all correspondence to Shinji Imai, M.D., Ph.D., Department of Anatomy, Shiga University of Medical Science, Setatsukinowa-cho, Otsu-shi, Shiga-ken, 520-2192, Japan. Tel.: 81-77-548-2136. Fax: 81-77-548-2139. E-mail: simai@belle.shiga-med.ac.jp
References
- Baier H, Bonhoeffer F. Axon guidance by gradients of a target-derived component. Science. 1992;255:472–475. doi: 10.1126/science.1734526. [DOI] [PubMed] [Google Scholar]
- Bernfield M, Kokenyesi R, Kato M, Hinkes M, Spring J, Gallo R, Lose E. Biology of the syndecan. Annu Rev Cell Biol. 1992;8:365–393. doi: 10.1146/annurev.cb.08.110192.002053. [DOI] [PubMed] [Google Scholar]
- Bonewald, L.F. 1996. Transforming growth factor-β. In Principles of Bone Biology. J.P. Bilezikian, L.G. Raisz, and G.A. Rodan, editors. Academic Press, San Diego. 647–659.
- Canalis E, McCarthy TL, Centrella M. Growth factors and cytokines in bone cell metabolism. Annu Rev Med. 1991;42:17–24. doi: 10.1146/annurev.me.42.020191.000313. [DOI] [PubMed] [Google Scholar]
- Carey DJ. Syndecans: multifunctional cell-surface co-receptors. Biochem J. 1997;327:1–16. doi: 10.1042/bj3270001. [DOI] [PMC free article] [PubMed] [Google Scholar]
- Carey DJ, Evans DM, Stahl RC, Asundi VK, Conner KJ, Garbes P, Cimeci-Smith G. Molecular cloning and characterization of N-syndecan, a novel transmembrane heparan sulfate proteoglycan. J Cell Biol. 1992;117:191–201. doi: 10.1083/jcb.117.1.191. [DOI] [PMC free article] [PubMed] [Google Scholar]
- David G, van den Schueren BP, Marynen P, Cassiman J-J, van den Berghe H. Molecular cloning of amphiglycan, a novel integral membrane heparan sulfate proteoglycan expressed by epithelial and fibroblastic cells. J Cell Biol. 1992;118:961–969. doi: 10.1083/jcb.118.4.961. [DOI] [PMC free article] [PubMed] [Google Scholar]
- Dillaman RM, Roer RD, Gay DM. Fluid movement in bone: theoretical and empirical. J Biomech. 1991;24S:163–177. doi: 10.1016/0021-9290(91)90386-2. [DOI] [PubMed] [Google Scholar]
- Doty SB. Morphological evidence of gap junctions between bone cells. Calcif Tissue Int. 1981;33:509–512. doi: 10.1007/BF02409482. [DOI] [PubMed] [Google Scholar]
- Dreyfus J, Brunet-de Carvalho N, Duprez D, Raulais D, Vigny M. HB-GAM/pleiotrophin: localization of mRNA and protein in the chicken developing leg. Int J Dev Biol. 1998;42:189–198. [PubMed] [Google Scholar]
- Gabe, M. 1976. Histological Techniques, English Edition. E. Blackith and A. Kavoor, translators. Masson, Paris. 550 pp.
- Gunning P, Leavvitt J, Muscat G, Ng SY, Kedes LA. Human β-actin expression vector system directs high-level accumulation of antisense transcripts. Proc Natl Acad Sci USA. 1987;84:4831–4835. doi: 10.1073/pnas.84.14.4831. [DOI] [PMC free article] [PubMed] [Google Scholar]
- Hammarback JA, Palm SL, Furcht LT, Letourneau PC. Guidance of neurite outgrowth by pathways of substratum-absorbed laminin. J Neurosci Res. 1985;13:213–220. doi: 10.1002/jnr.490130115. [DOI] [PubMed] [Google Scholar]
- Hanke JH, Gardner JP, Dow RL, Changelian PS, Brissette WH, Weringer EJ, Pollok BA, Connelly PA. Dicovery of a novel, potent, and src family-selective tyrosine kinase inhibitor. Study of Lck- and Fyn T-dependent T cell activation. J Biol Chem. 1996;271:695–701. doi: 10.1074/jbc.271.2.695. [DOI] [PubMed] [Google Scholar]
- Hulmes JD, Seddon AP, Decker MM, Böhlen P. Comparison of the disulfide bone arrangements of human recombinant and bovine brain heparin binding neurite-promoting factors. Biochem Biophys Res Commun. 1993;192:738–746. doi: 10.1006/bbrc.1993.1476. [DOI] [PubMed] [Google Scholar]
- Hung C, Ni Y, Wang T, Gao Y, Haudenschild CC, Zhan X. Down-regulation of the filamentous actin cross-linking activity of cortactin by src-mediated tyrosine phosphorylation. J Biol Chem. 1997;271:13911–13915. doi: 10.1074/jbc.272.21.13911. [DOI] [PubMed] [Google Scholar]
- Imai S, Rauvala H, Konttinen YT, Tokunaga Y, Maeda T, Hukuda S, Santavirta S. Efferent target of osseous CGRP-immunoreactive nerve fiber before and after bone destruction in adjuvant arthritic rat: an ultramorphological study on their terminal-target relations. J Bone Miner Res. 1997;12:1018–1027. doi: 10.1359/jbmr.1997.12.7.1018. [DOI] [PubMed] [Google Scholar]
- Jeansonne BG, Feagin FF, McMinn RW, Shömaker RL, Rehen WS. Cell-to-cell communication of osteoblasts. J Dent Res. 1979;58:1415–1423. doi: 10.1177/00220345790580042101. [DOI] [PubMed] [Google Scholar]
- Kingsley DM. What do BMPs do in mammals? Clues from the mouse short-ear mutation. Trends Genet. 1994;10:133–146. doi: 10.1016/0168-9525(94)90014-0. [DOI] [PubMed] [Google Scholar]
- Kinnunen A, Kinnunen T, Kaksonen M, Nolo R, Panula P, Rauvala H. N-syndecan and heparin-binding growth-associated molecule (HB-GAM) associate with early axonal tracts in the rat brain. Eur J Neurosci. 1998;10:635–648. doi: 10.1046/j.1460-9568.1998.00082.x. [DOI] [PubMed] [Google Scholar]
- Kinnunen T, Raulo E, Nolo R, Maccarana M, Lindahl U, Rauvala H. Neurite outgrowth in brain neurons induced by heparin-binding growth-associated molecule (HB-GAM) depends on the specific interaction of HB-GAM with heparan sulfate at the cell surface. J Biol Chem. 1996;271:2243–2248. doi: 10.1074/jbc.271.4.2243. [DOI] [PubMed] [Google Scholar]
- Kinnunen T, Kaksonen M, Saarinen J, Kalkkinen N, Peng B, Rauvala H. Cortactin/Src-kinase signalling pathway is involved in N-syndecan-dependent neurite outgrowth. J Biol Chem. 1998;273:10702–10708. doi: 10.1074/jbc.273.17.10702. [DOI] [PubMed] [Google Scholar]
- Lean JM, Jagger CJ, Chambers TJ, Chow JW. Increased insulin-like growth factor I mRNA expression in rat osteocytes in response to mechanical stimulation. Am J Physiol. 1995;268:318–327. doi: 10.1152/ajpendo.1995.268.2.E318. [DOI] [PubMed] [Google Scholar]
- Li YS, Milner PG, Chauhan AK, Watson MA, Hoffman RM, Kodner CM, Milbrandt J, Deuel TF. Cloning and expression of a developmentally regulated protein that induces mitogenic and neurite outgrowth activity. Science. 1990;250:1690–1694. doi: 10.1126/science.2270483. [DOI] [PubMed] [Google Scholar]
- Li YS, Gurrieri M, Deuel TF. Pleiotrophin gene expression is highly restricted and is regulated by platelet-derived growth factor. Biochem Biophys Res Commun. 1992;184:427–432. doi: 10.1016/0006-291x(92)91211-8. [DOI] [PubMed] [Google Scholar]
- Maeda N, Nishiwaki T, Shintani T, Hamanaka H, Noda M. 6B4 proteoglycan/phosphacan, an extracellular variant of receptor-like protein-tyrosine phosphatase ζ/RPTPβ, binds pleiotrophin/heparin-binding growth-associated molecule (HB-GAM) J Biol Chem. 1996;271:21446–21452. doi: 10.1074/jbc.271.35.21446. [DOI] [PubMed] [Google Scholar]
- Marks, S.C., and D.C. Hermey. 1996. The structure and development of bone. In. Principles of Bone Biology. J.P. Bilezikian, L.G. Raisz, and G.A. Rodan, editors. Academic Press, San Diego. 3–14.
- Marynen P, Zhang J, Cassimann J-J, van den Berghe H, David G. Partial primary structure of the 48- and 90-kilodalton core proteins of cell surface-associated heparan sulfate proteoglycans of lung fibroblasts. J Biol Chem. 1989;264:7017–7024. [PubMed] [Google Scholar]
- Matsuda H, Tsujimura A, Yoshida M, Arai Y, Koboki Y, Mukai T, Nakamura T, Tsuji H, Nakagawa M, Hashimoto-Gotoh T. Bone mass loss due to estrogen deficiency is compensated in transgenic mice overexpressing human osteoblast stimulating factor-1. Biochem Biophys Res Commun. 1997;238:528–533. doi: 10.1006/bbrc.1997.7188. [DOI] [PubMed] [Google Scholar]
- Merenmies J, Rauvala H. Molecular cloning of the 18-kDa growth-associated protein of developing brain. J Biol Chem. 1990;265:16721–16724. [PubMed] [Google Scholar]
- Migita K, Eguchi K, Kawabe Y, Mizokami A, Tsukada T, Nagataki S. Prevention of anti-CD3 monoclonal antibody-induced thymic apoptosis by protein tyrosine kinase inhibitors. J Immunol. 1994;153:3457–3464. [PubMed] [Google Scholar]
- Mitsiadis TA, Salmirvirta M, Muramatsu T, Muramatsu H, Rauvala H, Lehtonen E, Jalkanen M, Thesleff I. Expression of the heparin-binding cytokines, midkine (MK) and HB-GAM (pleiotrophin), is associated with epithelial-mesenchymal interactions during fetal development and organogenesis. Development (Camb) 1995;121:37–51. doi: 10.1242/dev.121.1.37. [DOI] [PubMed] [Google Scholar]
- Nijweide, P.J., E.H. Burger, K.J. Nulend, and A. Van der Plas. 1996. The osteocyte. In Principles of Bone Biology. J.P. Bilezikian, L.G. Raisz, and G.A. Rodan, editors. Academic Press, San Diego. 115–126.
- Nolo R, Kaksonen M, Raulo E, Rauvala H. Coexpression of heparin-binding growth-associated molecule (HB-GAM) and N-syndecan (syndecan-3) in developing rat brain. Neurosci Lett. 1995;191:39–42. doi: 10.1016/0304-3940(94)11551-1. [DOI] [PubMed] [Google Scholar]
- Parfitt AM. Bone histomorphometry: standardization of nomenclature, symbols, and units. J Bone Miner Res. 1987;2:594–610. doi: 10.1002/jbmr.5650020617. [DOI] [PubMed] [Google Scholar]
- Pead MJ, Suswillo RS, Skerry TM, Vedi S, Lanyon LE. Increased 3H-uridine levels in osteocytes following a single short period of dynamic loading in vivo. Calcif Tissue Int. 1988;43:92–96. doi: 10.1007/BF02555153. [DOI] [PubMed] [Google Scholar]
- Peng HB, Ali AA, Dai Z, Dagget DF, Raulo E, Rauvala H. The role of heparin-binding growth-associated molecule (HB-GAM) in the postsynaptic induction in cultured muscle cells. J Neurosci. 1995;15:3027–3038. doi: 10.1523/JNEUROSCI.15-04-03027.1995. [DOI] [PMC free article] [PubMed] [Google Scholar]
- Raulo E, Julkunen I, Merenmies J, Pihlaskari R, Rauvala H. Secretion and biological activities of heparin-binding growth-associated molecule. J Biol Chem. 1992;267:11408–11416. [PubMed] [Google Scholar]
- Raulo E, Chernousov MA, Carey D, Nolo R, Rauvala H. Isolation of a neuronal cell surface receptor of heparin-binding growth-associated molecule (HB-GAM): identification as N-syndecan (syndecan-3) J Biol Chem. 1994;269:12999–13004. [PubMed] [Google Scholar]
- Rauvala H. An 18-kD heparin-binding protein of developing brain that is distinct from fibroblastic growth factors. EMBO (Eur Mol Biol Organ) J. 1989;8:2933–2941. doi: 10.1002/j.1460-2075.1989.tb08443.x. [DOI] [PMC free article] [PubMed] [Google Scholar]
- Rauvala H, Vanhala A, Castrén E, Nolo R, Raulo E, Merenmies J, Panula P. Expression of HB-GAM (heparin-binding growth associated molecules) in the pathways of developing axonal processes in vivo and neurite outgrowth in vitro induced by HB-GAM. Dev Brain Res. 1994;79:157–176. doi: 10.1016/0165-3806(94)90121-x. [DOI] [PubMed] [Google Scholar]
- Rodan GA, Noda M. Gene expression in osteoblastic cells. Crit Rev Eukaryot Gene Expr. 1991;1:85–98. [PubMed] [Google Scholar]
- Rosen V, Thies RS. BMPs in bone formation and repair. Trends Genet. 1992;8:97–102. doi: 10.1016/0168-9525(92)90197-c. [DOI] [PubMed] [Google Scholar]
- Saunders S, Jalkanen M, O'Farrell S, Bernfield M. Molecular cloning of syndecan, an integral membrane proteoglycan. J Cell Biol. 1989;108:1547–1556. doi: 10.1083/jcb.108.4.1547. [DOI] [PMC free article] [PubMed] [Google Scholar]
- Scammell BE, Roach HI. A new role for the chondrocyte in fracture repair: endochondral ossification includes direct bone formation by former chondrocytes. J Bone Miner Res. 1996;11:737–745. doi: 10.1002/jbmr.5650110604. [DOI] [PubMed] [Google Scholar]
- Skerry TM, Bitensky L, Chayen J, Lanyon LE. Early strain-related changes in enzyme activity following bone loading in vivo. J Bone Miner Res. 1989;4:783–788. doi: 10.1002/jbmr.5650040519. [DOI] [PubMed] [Google Scholar]
- Szabat E, Rauvala H. Role of HB-GAM (heparin-binding growth-associated molecule) in proliferation arrest in cells of developing rat limb and its expression in the differentiating neuromuscular system. Dev Biol. 1996;178:77–89. doi: 10.1006/dbio.1996.0199. [DOI] [PubMed] [Google Scholar]
- Tezuka K, Takeshita S, Hakeda Y, Kumegawa M, Kikuno R, Hashimoto-Gotoh T. Isolation of mouse and human cDNA clones encoding a protein expressed specifically in osteoblasts and brain tissue. Biochem Biophys Res Commun. 1990;173:246–251. doi: 10.1016/s0006-291x(05)81048-4. [DOI] [PubMed] [Google Scholar]
- Tomomura M, Kadomatsu K, Matsubara S, Muramatsu T. A retinoid acid-responsive gene, MK, found in the teratocarcinoma system. J Biol Chem. 1990;265:10765–10770. [PubMed] [Google Scholar]
- Zhou HY, Ohnuma Y, Takita H, Fujisawa R, Mizuno M, Kuboki Y. Effects of a bone lysine-rich 18 kDa protein on osteoblast-like MC3T3-E1 cells. Biochem Biophys Res Commun. 1992;186:1288–1293. doi: 10.1016/s0006-291x(05)81545-1. [DOI] [PubMed] [Google Scholar]
- Wilkinson, D.G. 1992. Whole mount in situ hybridization of vertebrate embryos. In In Situ Hybridization: A Practical Approach. Wilkinson D.G., editor. IRL Press, Oxford. 75–83.